In the midst of the Colorado Desert, southeastern California retains the geological and archaeological evidence of tremendous ecological changes, some of the most dramatic and rapid of which took place in the last millennium. Stretching a massive 180 km long and 50 km wide, ancient Lake Cahuilla was one of the largest Holocene lakes in North America and provided a variety of resources to Native American groups (Gobalet and Wake Reference Gobalet and Wake2000; Laylander Reference Laylander2006; Sutton Reference Sutton1998; White and Roth Reference White and Roth2009; Wilke Reference Wilke1978). Seasonal occupations along the lake's shorelines by indigenous hunter-gatherer-fishers were intricately linked to the lake's filling and desiccation cycles, resulting in a dynamic environment and an extraordinary set of human adaptive strategies (Laylander Reference Laylander2006; Love and Dahdul Reference Love and Dahdul2002; Waters Reference Waters1983).
Several ethnographic and archaeological studies have been published on the prehistory of the Lake Cahuilla region (e.g., Gobalet and Wake Reference Gobalet and Wake2000; Laylander Reference Laylander1997; Pallette and Schaefer Reference Pallette and Schaefer1995; Quinn and Burton Reference Quinn and Burton2016; Schaefer Reference Schaefer1994; Sutton Reference Sutton1993, Reference Sutton1998, Reference Sutton2011; White and Roth Reference White and Roth2009), yet fish trap technologies, although prominent features scattered along recessional shorelines, remain understudied (Schaefer and Laylander Reference Schaefer, Laylander, Jones and Klar2010). One of the primary reasons is that the remote locations, dense concentrations, and large scales of these traps make traditional archaeological pedestrian surveys and mapping difficult and inefficient. Fish traps tend to blend into the rocky, desert landscape, which makes their identification problematic, and traditional methods of recording their elevations and orientations are slow and arduous.
For our study of a newly identified cluster of Lake Cahuilla fish traps, we employed both traditional archaeological mapping methods and cutting-edge aerial photography collected by an unmanned aerial vehicle (UAV) to document the distribution and reconstruct prehistoric fish traps along the southwestern shoreline of ancient Lake Cahuilla. High-precision UAV mapping helped identify patterning in the shapes, orientation, and seasonality of fish trap construction—patterns not yet identified using traditional archaeological methodologies. Our study demonstrates how emerging technology can aid in mapping fish trap features and in better understanding the long-term ecodynamics of the people who inhabited the shorelines of freshwater and coastal systems worldwide.
ENVIRONMENTAL AND CULTURAL BACKGROUND
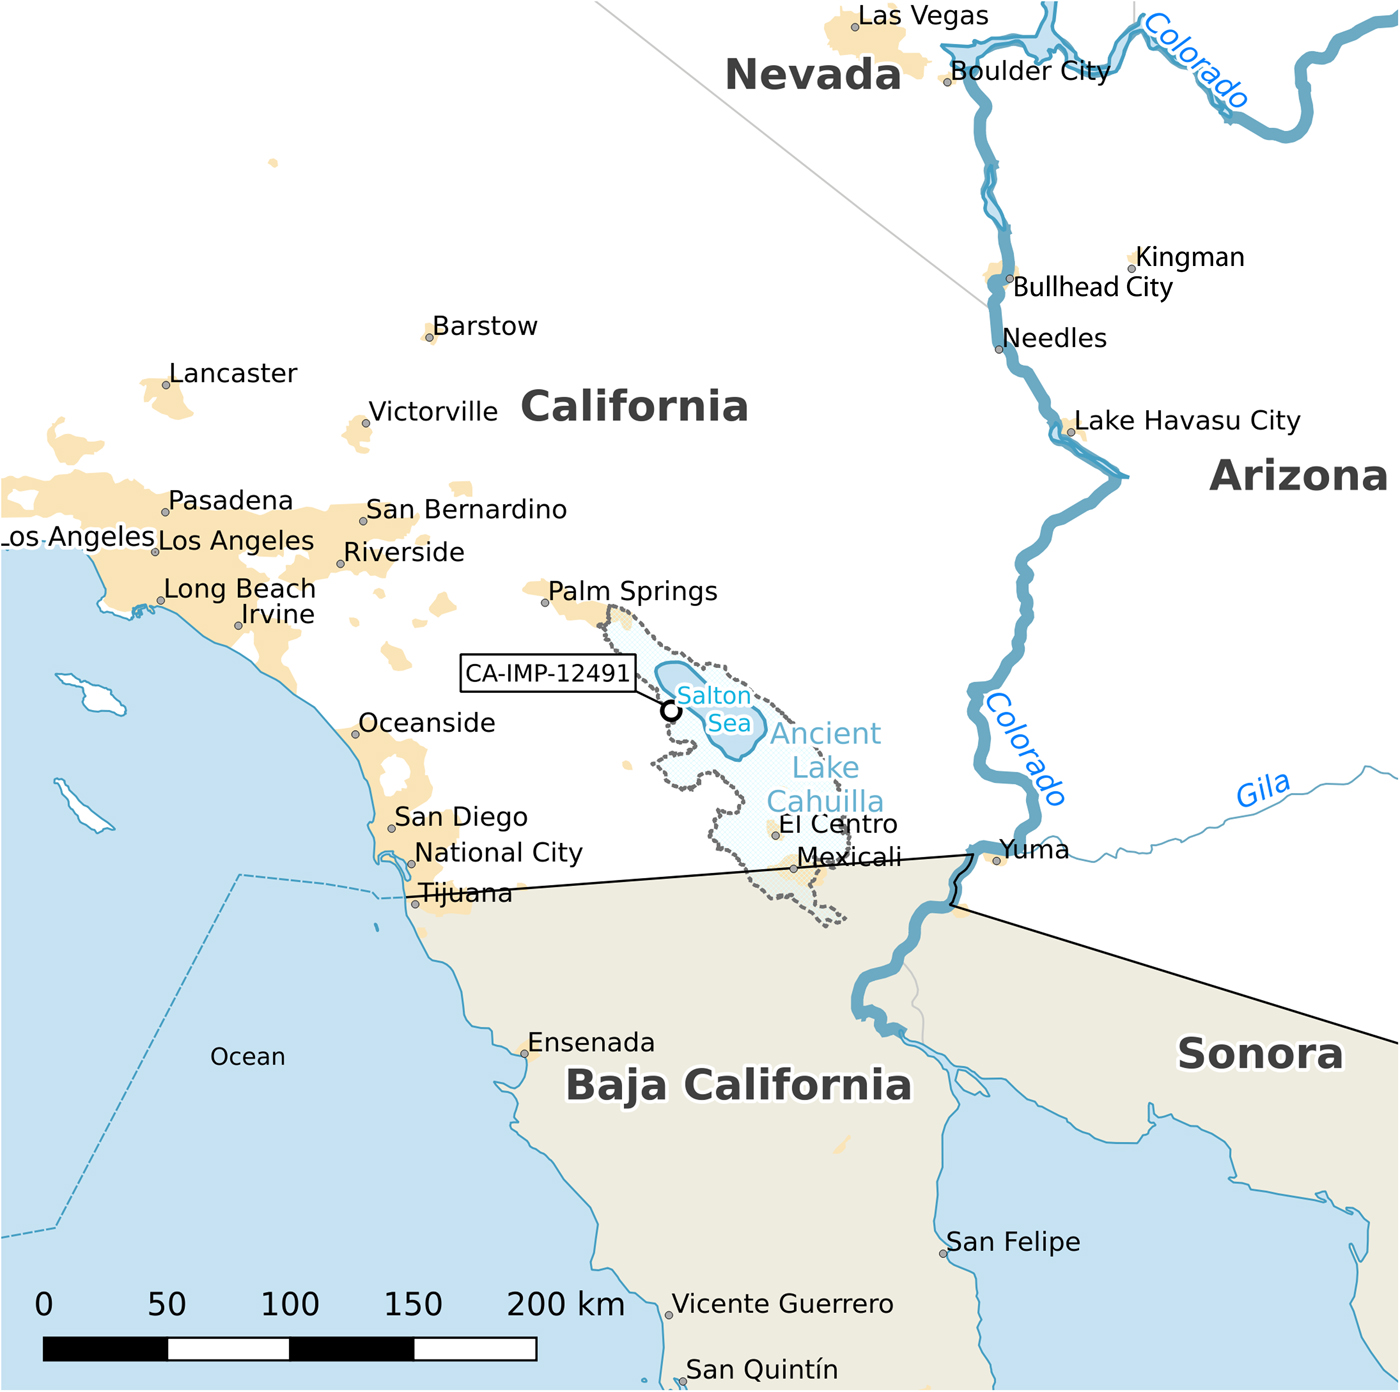
In 1854, the geologist William Blake helped survey the Colorado Desert for a possible railroad route connecting the American East with the West, and he reported the presence of a prominent lacustrine shoreline, later dubbed Lake Cahuilla (Waters Reference Waters1983). This massive freshwater lake once filled the Salton Trough portion of the Colorado Desert, creating an oasis in an otherwise arid desert environment. The lake formed when the Colorado River shifted its normal course between AD 700 and 1000 and gradually filled the structural lowland of the Salton Trough, most of which lies below sea level (Gobalet and Wake Reference Gobalet and Wake2000; Waters Reference Waters1983; Figure 1).
Map of ancient Lake Cahuilla and the larger southern California region. Note the successive shorelines of Lake Cahuilla and the modern extent of the Salton Sea.

The Salton Trough lies near the San Andreas fault in the northern Colorado Desert. It is bordered on the east by the Chocolate Mountains and the Colorado River, the west by the Peninsular Range, and the north by the Mojave Desert. The elevation of the area ranges from approximately 1,305 m above sea level at Blue Angel Peak in the Jacumba Mountains to approximately 87 m below sea level at the bottom of the Salton Sea. Six times over the last millennium, the Colorado River diverted from its normal course to the Gulf of California and flooded the Salton Trough with water and sediment, forming Lake Cahuilla. Estimates suggest that the lake would take approximately 13–20 years to reach its full size (Rockwell et al. Reference Rockwell, Meltzner and Haaker2018), bringing with it a diversity of freshwater fish and terrestrial wildlife (Laylander Reference Laylander1997).
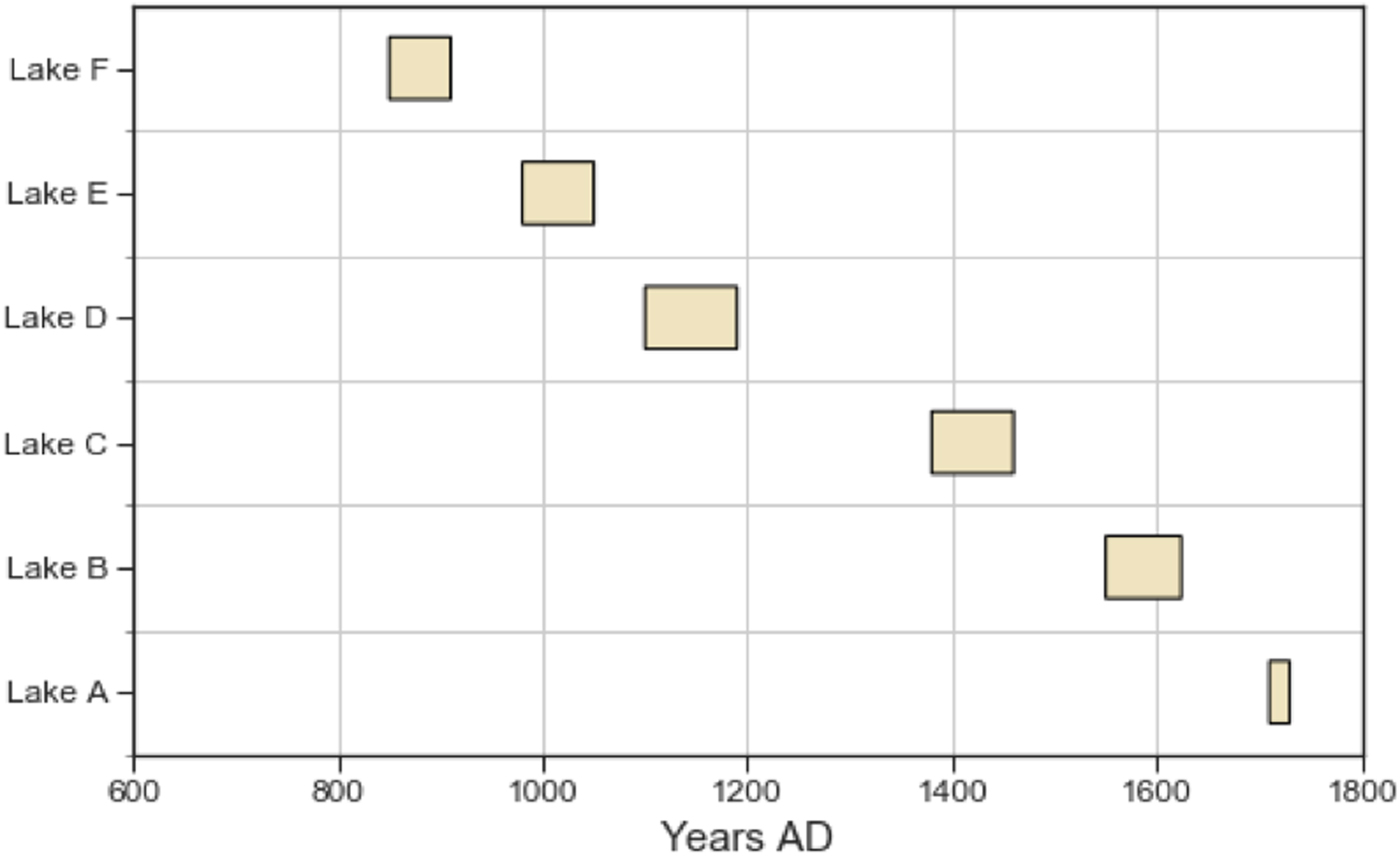
The depth and shoreline elevations of Lake Cahuilla fluctuated dramatically over time. Radiocarbon dating and stratigraphic analyses suggest the lake maintained a period of stasis for a number of decades before gradually receding, which would take approximately 47–64 years, depending on evaporation rates (Rockwell et al. Reference Rockwell, Meltzner and Haaker2018). These cycles of filling and recession each lasted an estimated 200 years (Laylander Reference Laylander2006; Waters Reference Waters1983; White and Roth Reference White and Roth2009). The exact number of fillings and recessions, as well as their durations, continues to be debated. The most recent and compelling data document at least six lake highstands and five dateable lakes (Philibosian et al. Reference Philibosian, Fumal and Weldon2011; Rockwell et al. Reference Rockwell, Meltzner and Haaker2018; Figure 2). Peat and charcoal samples from Lake Cahuilla shorelines produced a calibrated radiocarbon age of AD 817–964 for the oldest Lake Cahuilla highstand and circa AD 1726 for the youngest (Rockwell et al. Reference Rockwell, Meltzner and Haaker2018).
Simplified chart showing the approximate age of each lake highstand. (Data synthesized from Philibosian et al. [Reference Philibosian, Fumal and Weldon2011] and Rockwell et al. [Reference Rockwell, Meltzner and Haaker2018] radiocarbon-dated tree stump dates.)

When Lake Cahuilla filled, it attracted a wide variety of flora and fauna, creating a rich and diverse environment. Archaeological surveys and excavations along the northern shore have identified nearly 40 different fish species captured by hunter-gatherer-fishers (Smith and Brock Reference Smith and Brock1999; Sutton Reference Sutton1993, Reference Sutton1998). Some of the most common fish species recovered from archaeological deposits include the razorback sucker (Xyrauchen texanus), the flannelmouth sucker (Catostomus latipinnis), the bonytail (Gila elegans), the humpback chub (Gila cypha), the roundtail chub (Gila robusta), the Colorado pikeminnow (Ptychocheilus lucius), the desert pupfish (Cyprinodon macularius), the Gila topminnow (Poeciliopsis occidentalis), the Machete (Elops affinis), and the striped mullet (Mugil cephalus; Pallette and Schaefer Reference Pallette and Schaefer1995). Archaeological evidence from midden deposits and human coprolites indicate that a staggering majority (up to 99%) of fish remains at sites in the Salton Basin are either from razorback suckers or bonytail chubs. Almost all of these fish are of relatively uniform size, suggesting that fish traps were employed as the primary capture technology during spawning seasons (Gobalet and Wake Reference Gobalet and Wake2000; Sutton Reference Sutton1998; White and Roth Reference White and Roth2009).
Ethnographic accounts document that at least three different ethnolinguistic groups—the Kumeyaay, Cahuilla, and Cocopah—settled in the Lake Cahuilla area to take advantage of local resources (Treganza Reference Treganza1945; White and Roth Reference White and Roth2009; Wilke Reference Wilke1978). The Cahuilla occupied the northernmost portion of the basin, the Kumeyaay inhabited the southern basin, and the Cocopa settled in the delta (Laylander Reference Laylander2006). Archaeological and ethnographic accounts suggest that all three groups maintained a diverse hunter-gatherer subsistence adaptation. The Kumeyaay and the Cahuilla constructed stone fish traps along lake shorelines to capture spawning fish (Bean Reference Bean1991; Gifford Reference Gifford1931; Pritzker Reference Pritzker2000), while the Cocopa used nets (White and Roth Reference White and Roth2009).
Many of the Lake Cahuilla fish traps are located in the Ocotillo Wells State Vehicular Recreation Area (SVRA), and preliminary accounts suggest that over 80 fish traps cluster along the northeast park boundary. These sites are privately owned but managed by the Ocotillo Wells SVRA and were once within a World War II military training area used for construction and testing of heavy equipment before deployment. Modern off-road vehicle activities, combined with historical disturbances, have made fish trap features even more difficult to effectively map and document using traditional methodologies. This is so despite the fact that fish trap features, when carefully surveyed and mapped, can trace the history of Lake Cahuilla shoreline change and human responses to ecological shifts.
SITE SETTING AND LAKE CAHUILLA FISH TRAPS
In 2015, as part of ongoing archaeological site monitoring and pedestrian surveys by Ocotillo Wells SVRA archaeologists, a large cluster of rock fish traps was identified along the southwestern park boundary. Recorded as CA-IMP-12491, the site measures approximately 375 m east-west by 450 m north-south. It consists of dozens of rock fish traps constructed from boulder- to cobble-sized stones along multiple recessional shorelines of ancient Lake Cahuilla during the last lake highstand (Lake A; see Figure 2). Due to the large number of fish traps, and the site's position along a natural rocky terrace, no precise mapping of the fish traps was accomplished when it was first recorded.
Fish trap technology can be found around the world and is generally constructed as wood or stone weirs designed to block or trap fish at intertidal areas or along shorelines (e.g., Gabriel et al. Reference Gabriel, Lange, Dahm and Wendt1964; Langouët and Darie Reference Langouët and Daire2009; Roberts et al. Reference Roberts, Mollenmans, Agius, Graham, Newchurch, Rigney, Sansbury, Sansbury, Turner, Wanganeen and Wanganeen2016; White and Roth Reference White and Roth2009). Fish traps documented along Lake Cahuilla have been described as circular, U-shaped, or V-shaped structures made of cobble-sized rocks. Hundreds of these traps have been found along the successively retreating ancient Lake Cahuilla shorelines, many along the northern shorelines where the natural rocky landscape expediated their construction (Connaway Reference Connaway2007; Gobalet and Wake Reference Gobalet and Wake2000; Oglesby Reference Oglesby2005).
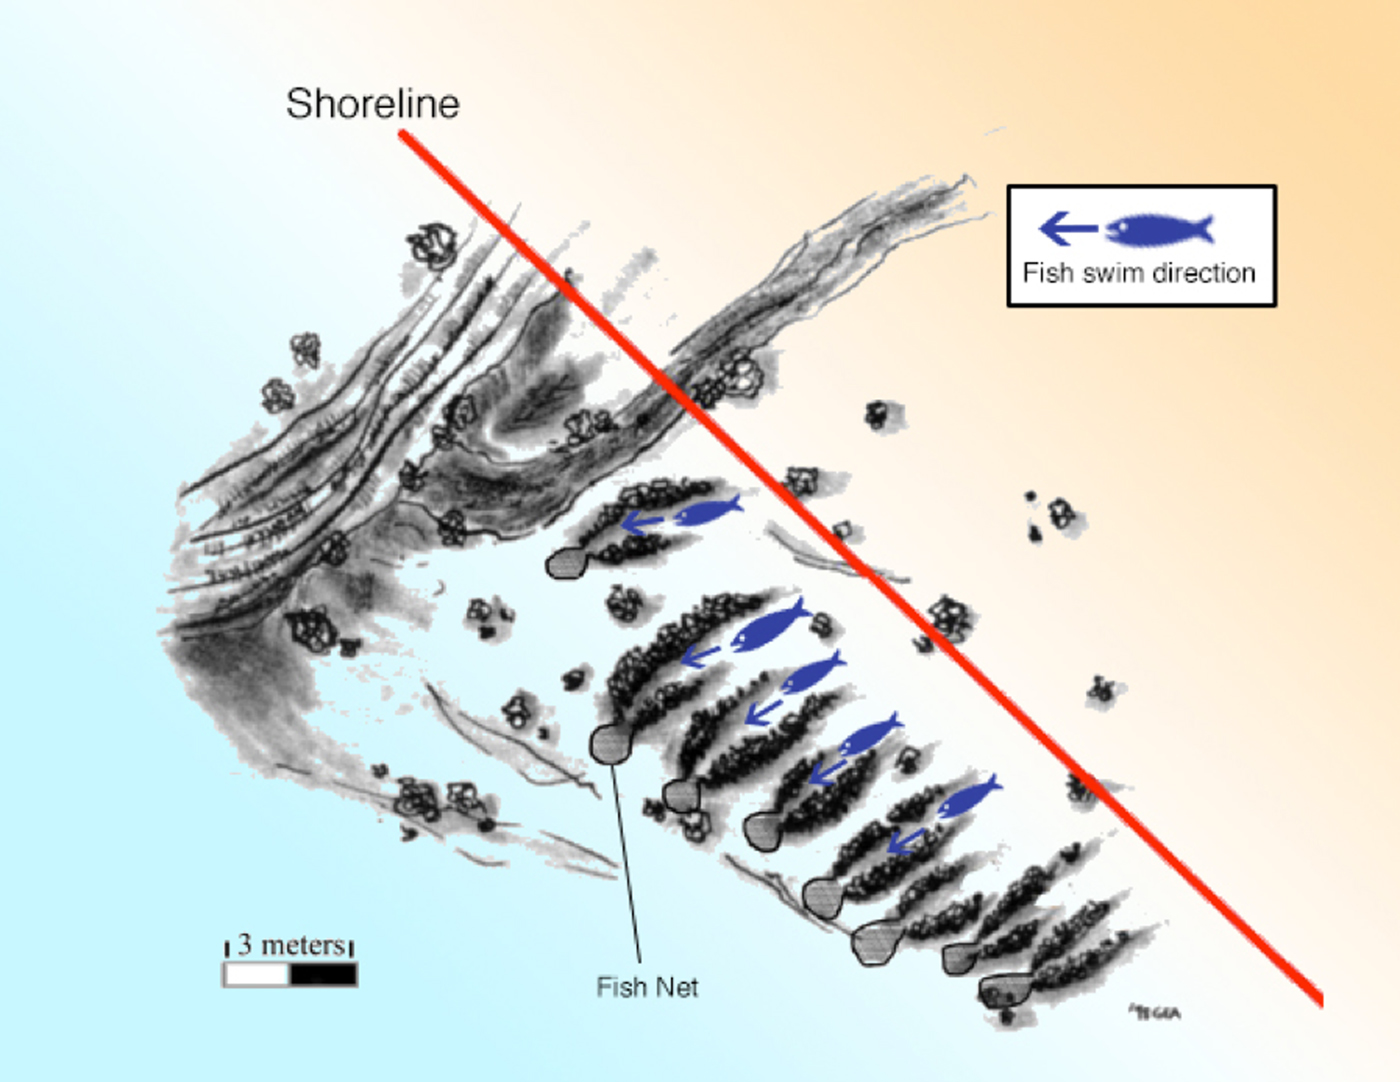
White and Roth (Reference White and Roth2009:187) argue that the behavior of the fishes native to the Colorado River “dictated the development, application, location, and scheduling of fishing practices along Lake Cahuilla.” U- and V-shaped traps, constructed from locally gathered cobbles, formed a barrier between the shallow gravel shoreline and deeper water, and they were positioned to exploit the spawning habitats of local fish (Connaway Reference Connaway2007; Gobalet and Wake Reference Gobalet and Wake2000; Oglesby Reference Oglesby2005). Lake Cahuilla fish, which bred or foraged in shallow nearshore waters, would swim into the fish traps, and the rock wall barriers would prevent the fish from returning to deeper water. Fishers would then block off the open end of the fish trap and scoop up their catch.
Fish trapping technology relies on a behavioral principle called “positive and negative thigmotaxis.” A positive thigmotaxis response relies on a fish's need to touch something. Fish species that live and spawn in shallow waters and prefer plant and rock cover have a positive thigmotactic response. Razorback suckers and bonytail chubs both display positive thigmotactic behavior, spawn in shallow nearshore waters, and retreat to deeper water when startled. The stone fish traps constructed along the alluvial shorelines of Lake Cahuilla would have attracted both fish species and been an effective capture method (Papoulias and Minckley Reference Papoulias and Minckley1990). Additionally, the relatively uniform size of the bonytail chub and razorback suckers recovered in archaeological deposits suggests that both were caught during spawning season (Wilke Reference Wilke1978).
METHODS
In 2017, San Diego State University archaeologists accessed CA-IMP-12491 and received permission from private landowners and Ocotillo Wells SVRA to conduct an archaeological survey and map the area. We began with a pedestrian survey conducted by a crew of San Diego State University anthropology graduate students. We evaluated the area, marked fish trap features with pin flags, and recorded basic descriptions and orientations. Due to ground cover, the uniform rocky terrain, and the size and scope of the fish traps, we determined that traditional pedestrian survey was not the most effective method of documenting the features and arranged for an aerial survey of the site.
Aerial photographic survey of the area was conducted in March 2017 using a DJI Phantom 3 professional UAV “drone.” The UAV survey was completed in partnership with licensed FAA Spark Aerial drone pilots with permission from the Ocotillo Wells SVRA. This type of UAV system offers excellent positional control as well as accurate topographic coverage because of the on-board, high-precision GPS receiver. Although other low-cost aerial photographic platforms are available to archaeologists, such as kites or balloons, the absence of cables, wires, or other connections to the ground allows for the unobstructed generation of images to reconstruct landscapes and cultural features (Campana Reference Campana2017). Furthermore, the GPS-enabled UAV piloting software allows for precise survey planning and even photographic coverage at a predetermined set of camera angles, which produces a photographic record much more amenable to 3D photogrammetry and digital topography generation (Green et al. Reference Green, Bevan and Shapland2014). This method of noninvasive survey enables the identification of fish traps from the air while documenting patterns that may not be evident from traditional pedestrian surveys, including precise measurement of the relational elevation of cultural features.
All features (ecological and archaeological) were mapped using a Trimble GPS system, along with ground control points (GCPs) to ensure accurate mapping. We placed large (0.5 × 0.5 m), high-contrast GCP markers where high-precision (2–5 cm) GPS location measurements were taken so that GCPs could later be identified on the aerial imagery. This is important because accurate placement of GCP points is necessary to calibrate the georectification calculations made by the photogrammetry software used to process the images. The use of photogrammetry augmented with GCPs means that surveyors need only measure the location of the five GCP markers rather than each individual feature. The software automatically registers all remaining pixels of the imagery in relation to the known GCPs, so surveyors can extrapolate the precise location of every identified feature after the imagery is processed.
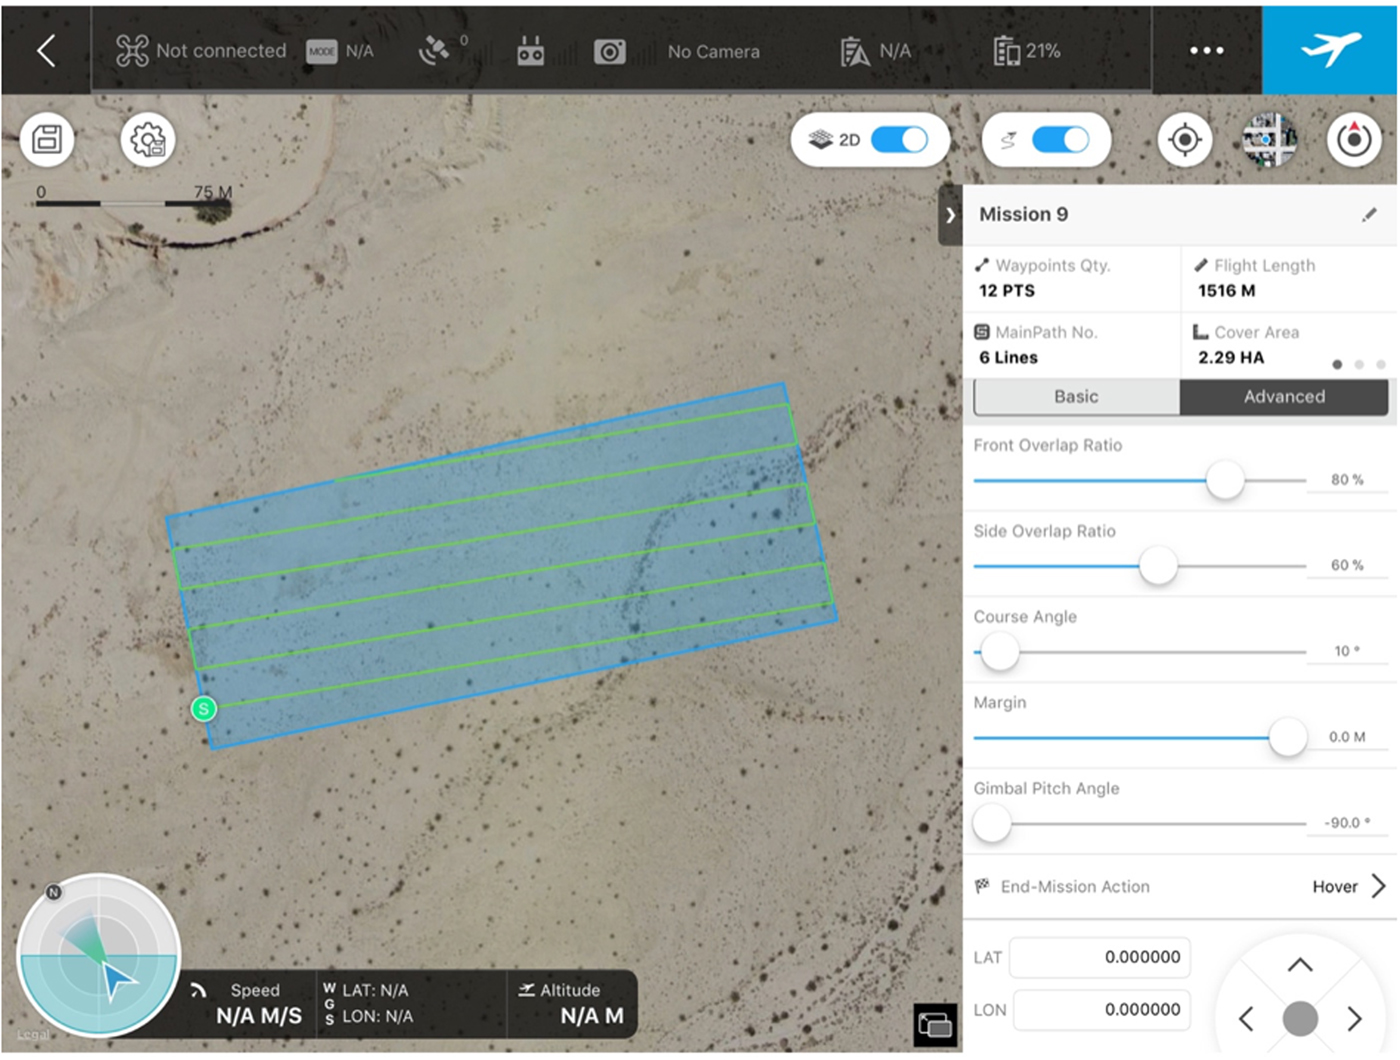
We preplanned the UAV survey by using GPS coordinates to create a simple overlay on a map with GIS software. We then used this map to outline a similar area in the UAV mission planning software, DJI GS Pro, which defined the extent of the UAV flight range. The software allows us to customize the survey parameters, and then it automatically generates a flight plan (Figure 3). For our survey, the important parameters were overlap ratio, flight altitude, gimbal pitch angle, and speed. Changes to the survey parameters affect the duration, distance, accuracy, and resolution of the survey, and they need to be adjusted to match the desired use of the output imagery.
Image of the flight plan, within the blue box along the green line, with set parameters for our survey of fish traps along ancient Lake Cahuilla.

For the 3D photogrammetric analysis, an important survey parameter is the overlap ratio—the percentage that each photograph overlaps with the image ahead and behind (frontlap), and to images on either side (sidelap). For best 3D rendering, a feature point needs to be matched on at least three overlapping images (Siebert and Teizer Reference Siebert and Teizer2014). Low-contrast scenes where unique feature points are difficult to identify may benefit from greater overlap (and thus an increased likeliness of features being matched on at least three images). Excessive overlap, however, will result in very large photo sets, increasing post-processing time. The ideal overlap ratio also varies with flight altitude, lens focal length, camera sensor size, and camera angle, so it needs to be set to match the conditions of the survey. The camera sensor we used is wider than it is tall, so the ratios were set at 80% frontlap and 60% sidelap to capture the same amount of overlap on all sides. The flight altitude also affects the photo resolution of the resulting map. Because the features we were trying to detect were relatively small, we targeted a resolution of 1 cm per pixel. With our photo sensor (12MP, 4000 × 3000), this meant flying at an altitude of 22.8 m to create a high-resolution map in which fish trap features could easily be detected and mapped. The gimbal pitch angle is the angle of the camera relative to the ground. Because the survey area was mostly flat with sloping gravel terraces and a few protruding features, orienting the camera perpendicular to the ground was the most efficient way to capture all visible surfaces. However, for survey areas with considerable elevation change or protruding features, it is best to position the camera closer to a 45° angle so the depths of cultural features are captured in higher fidelity (James and Robson Reference James and Robson2012). The speed parameter controls how quickly the UAV flies the mission. Speed is a careful balancing act—one wants to map the area efficiently without causing the images to blur. Blurred images are the result of having too low a shutter speed for how quickly the camera, or subject, is moving. For our survey, lighting conditions in the middle of the day dictated that the mission flew at 3 m/s.
Once the flight plan was in place, we positioned GCPs within the survey area using the flight plan map to choose the GCP locations. GCPs should be spread “randomly”—but evenly—over the survey area (neither concentrated nor regularly spaced) and placed on flat, even ground. It also is helpful to place GCPs in areas of minimum and maximum elevation (or a close approximation) to ensure that the full elevation range is accurately recorded. Following these criteria, we selected GCPs, coded them with a unique identifier, recorded an approximate location on Google Maps for reference in the photogrammetry process, and mapped their locations with an RTK Trimble GPS to an accuracy of ± 4 cm.
After the UAV survey was completed, the data were downloaded into the Pix4D software program, which is designed to process aerial drone imagery. We produced a high-resolution model of the topography in the survey area using Pix4D's 3D map processing engine, which processes the aerial imagery and GCPs in a “Structure from Motion” analysis (James and Robson Reference James and Robson2012). The process is iterative. It begins with a basic orthomosaic generation and feature point extraction, and it continues through sparse 3D point cloud generation, georectification from GCPs, and the creation a final GIS-ready dense 3D point cloud output. The process is largely automated, but it does require manual fine-tuning of the exact location of GCPs, which allows Pix4d to better stitch the images and distribute any error, resulting in more accurate spatial models.
Two open-source geographical information system (GIS) programs, Geographic Resource Analysis and Support System (GRASS) and QGIS, were used to create elevation maps and model fish trap feature patterns (GRASS Development Team 2017; QGIS Development Team 2017). Both programs are open-source, general-purpose GISs and can be used on all commonly used computer operating systems. GRASS and QGIS both offer rich sets of geospatial analysis and modeling functions, especially useful for archaeology and environmental sciences (Mitasova and Neteler Reference Mitasova and Neteler2004).
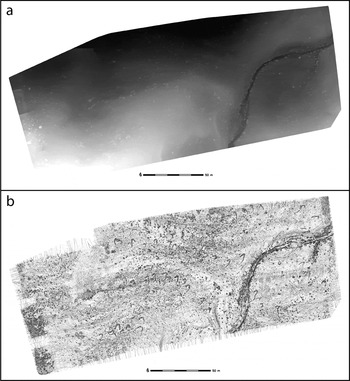
Using GRASS and QGIS, we interpolated a digital surface model (DSM) from the 3D point cloud generated by Pix4D. A DSM is a model of the first reflective surface captured by the UAV that contains the elevations of both the natural terrain as well as vegetation and cultural features (Figure 4a). This is important in our case, as it captures both the general surface topography of the ancient lake shore landforms and the local elevation of the fish traps. We further highlighted these local elevation differences by analyzing a map of the topographic slope derived from the DSM. The topographic slope of a DSM highlights the degree of inclination of a feature or object relative to the horizontal plane and the general trend of the landscape. The more an object projects above or below the surface trend, the steeper the transition, and the larger the topographic slope (up to 90°). The map (Figure 4b) is shaded from white (low slope) to black (high slope) and therefore highlights steep transitions in the slope map. The fish trap features were more clearly highlighted in comparison to their surroundings. The georectified and stitched photographic images captured from the UAV, or orthomosaic, was then overlaid on the slope map to show both the vegetation and the terrain in a true color image (Figure 5).
(a) Digital Surface Map (DSM) of the survey area; (b) Slope map created from the DSM to highlight fish trap features.

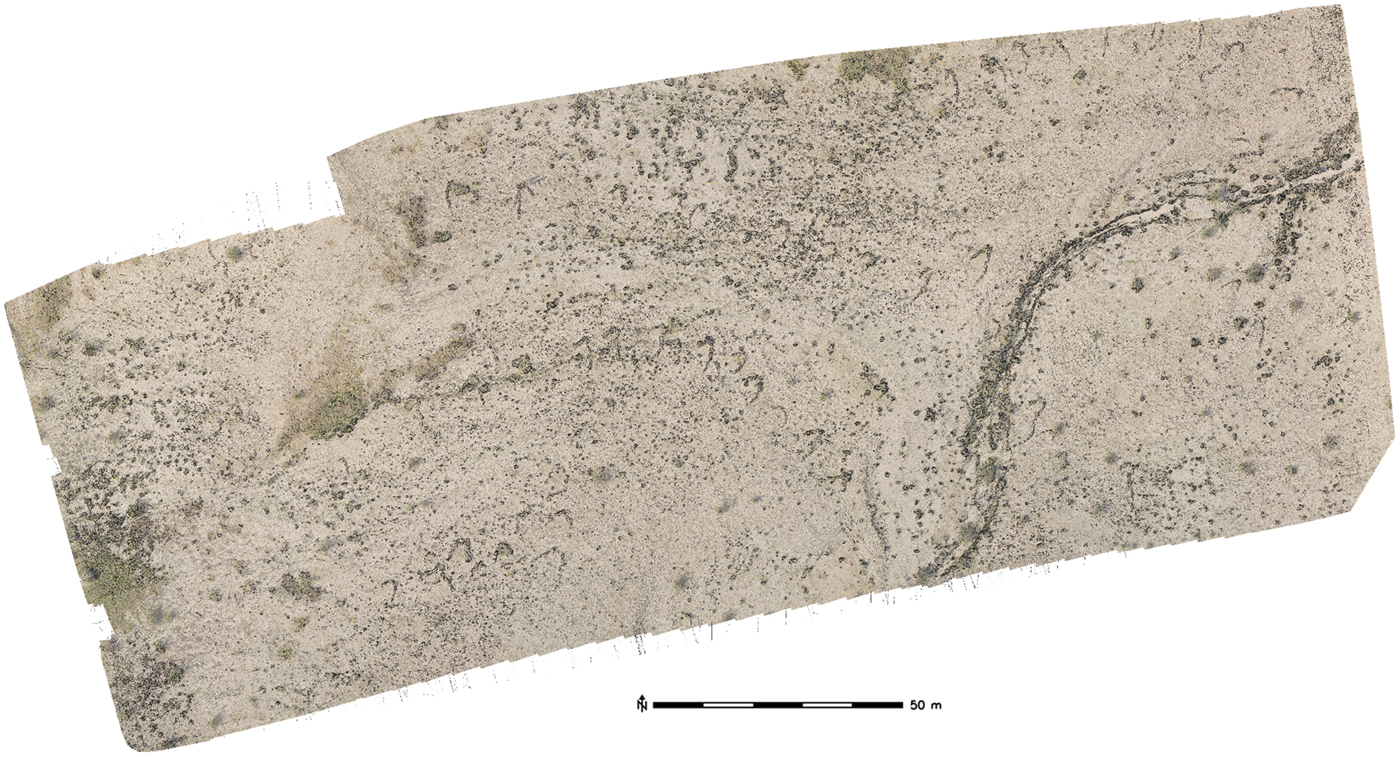
Overlay of the orthomosaic on the slope map with the 55 identified fish traps individually digitized.

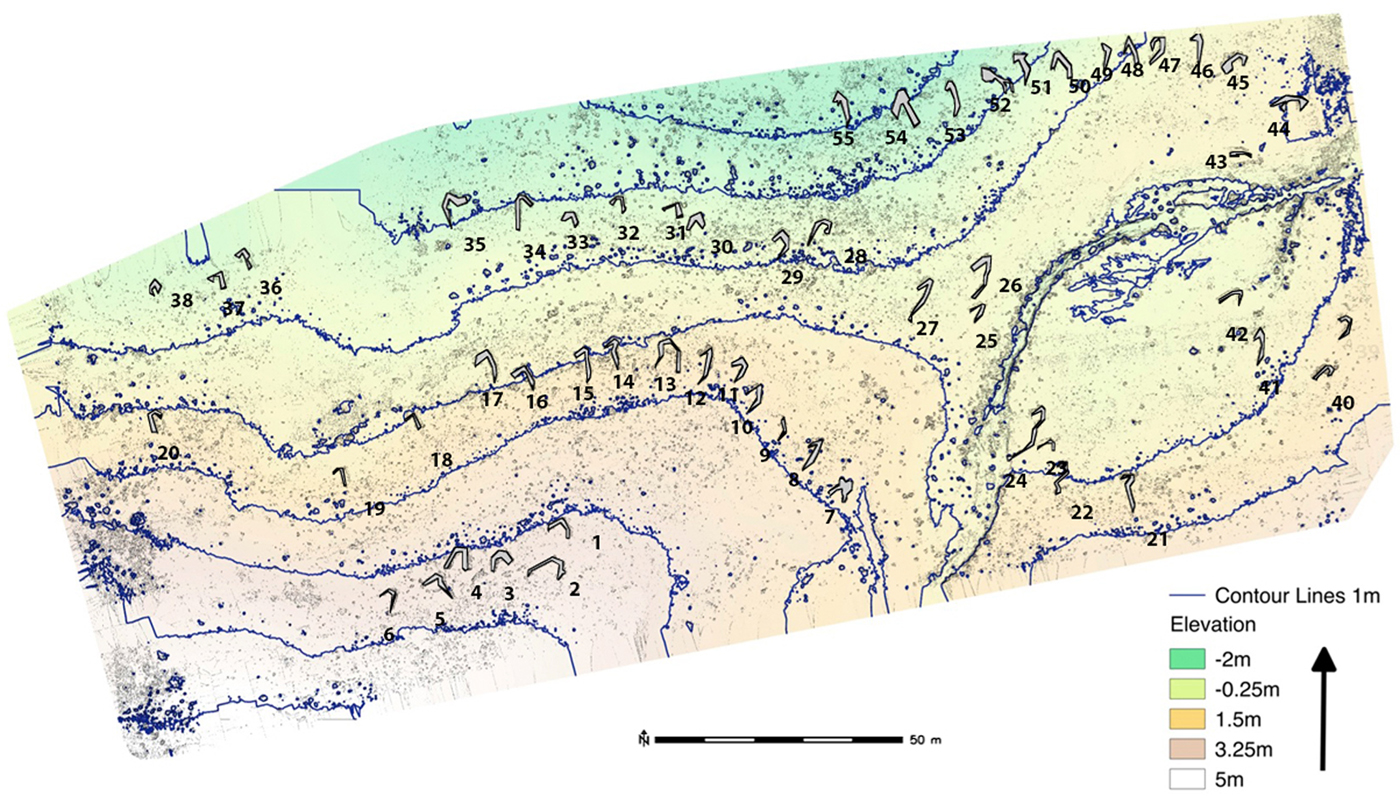
We extracted contour lines at 1 m increments from the elevation data embedded in the DSM (Figure 6), which illustrates the change in elevation across the site from 2 m below sea level to 5 m above sea level. The preceding set of analyses allowed us to highlight the fish trap features in multiple ways, making it easier to positively identify all the features in the survey region within the GIS. We manually digitized the outlines of each feature as vector polygons, making it possible to pull out summary statistics about elevation changes within each fish trap feature (see Table 1 for raw data).
Elevation contour map with each of the 55 fish traps individually extracted and digitized.
Shape of Each Fish Trap Feature as well as Their Minimum, Maximum, and Mean Elevations in Meters above Sea Level.

RESULTS AND DISCUSSION
Aerial survey of CA-IMP-12491 identified 55 fish trap features over an area of approximately 28,000 m2 (Figure 6). Nearly all were readily identifiable from aerial imagery, although some of the features showed signs of disturbance where an old military road and grading activities—part of the World War II training activities—may have impacted archaeological features. As is typical with similar cobble fish traps, all the traps are oriented in a similar direction (Figure 7), with the divergent ends opening toward the ancient Lake Cahuilla shoreline (Figure 8). The traps likely were blocked at its narrow, offshore end by a net, basket, or the equivalent. Fish spawning in shallow nearshore Lake Cahuilla waters, such as razorback suckers, could be startled into deeper waters, funneled into the trap, and herded into the nets or baskets (Gobalet and Wake Reference Gobalet and Wake2000). This use pattern has been widely identified, but our detailed mapping offers a more nuanced perspective on local harvesting strategies.
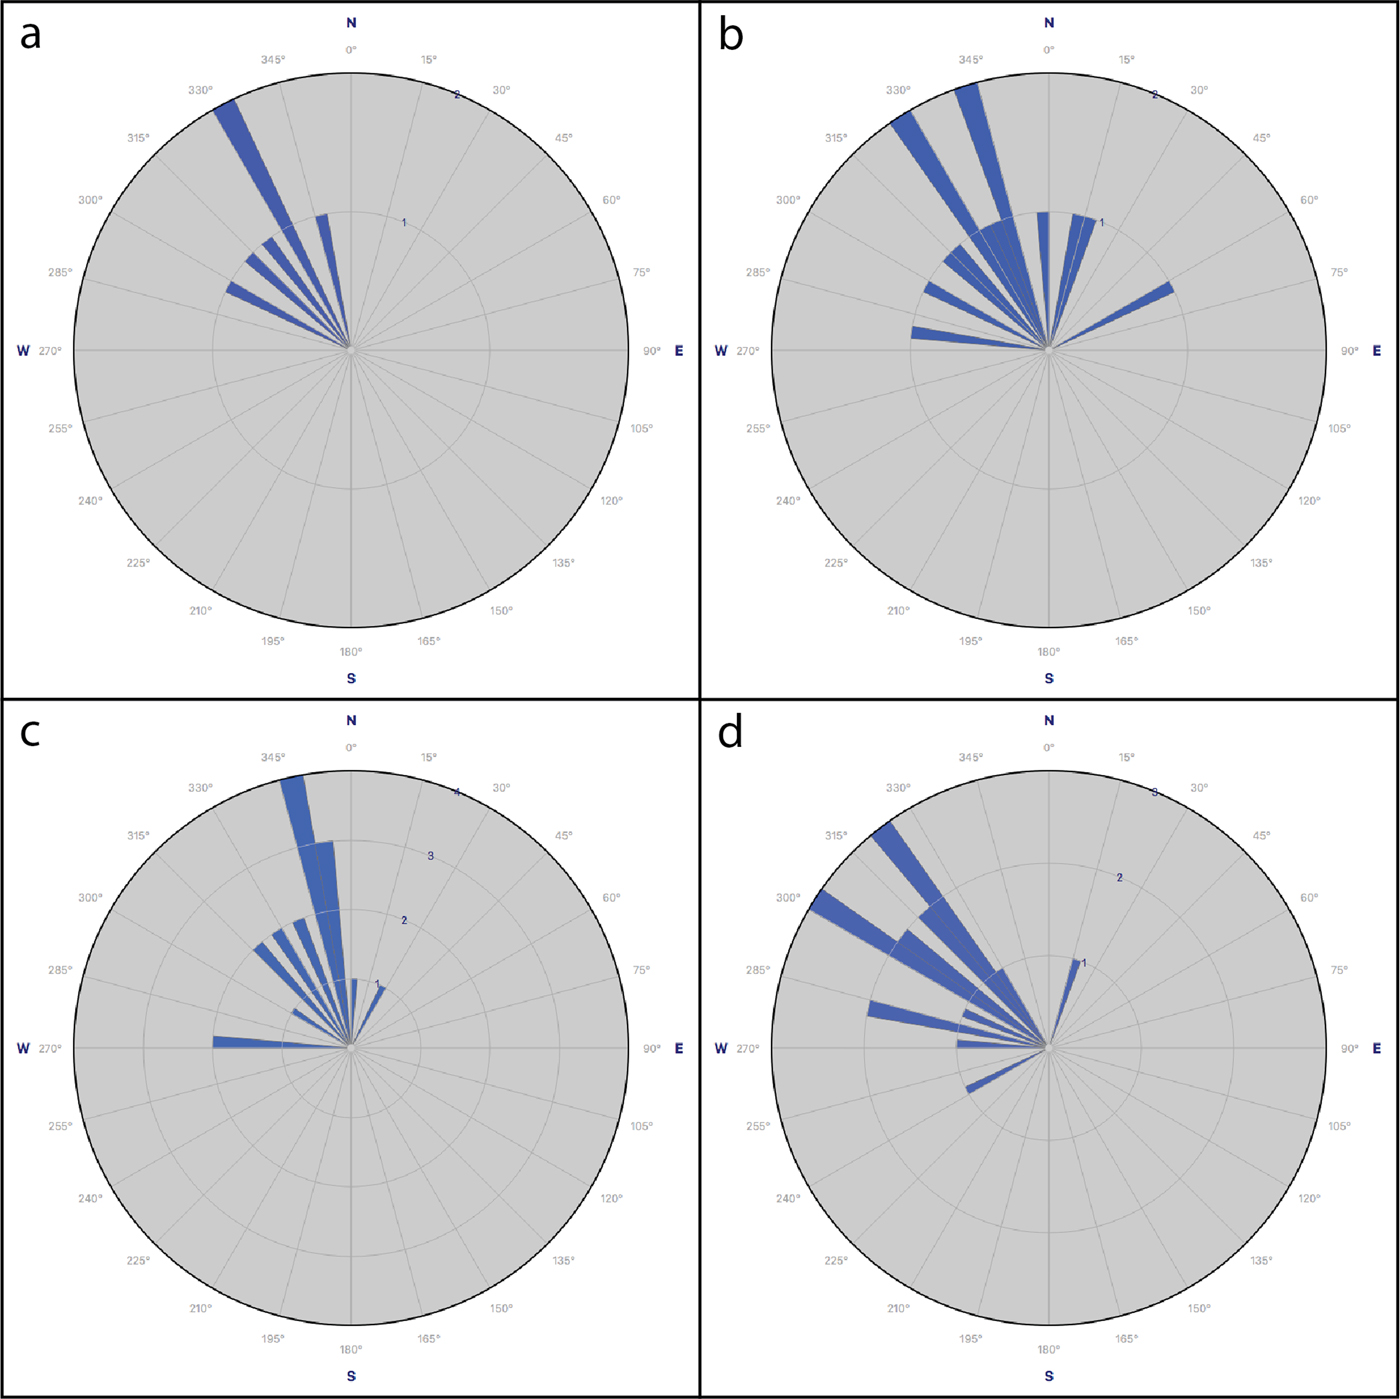
Rose diagram showing the directionality of the large opening of each row of fish traps: (a) fish traps 1–6; (b) fish traps 7–20; (c) fish traps 21–38; (d) fish traps 39–55.

Fish trap features along the shoreline of ancient Lake Cahuilla (adapted from Gobalet and Wake Reference Gobalet and Wake2000). The red line represents a possible shoreline with the fish traps in the shallow shorelines. The apex of the trap would be at a slightly lower elevation. Note the nets at the bottom of the trap.
The CA-IMP-12491 fish traps are laid out in approximately four rows. Traps within each row are about 2.5 m apart, suggesting that shoreline traps were constructed one after another for mass harvesting of fish. Rows of fish traps are positioned approximately 10–20 m apart, with each row at elevations 1–2 m below the next highest. This suggests successive episodes of construction following longer-term shoreline regressions between seasonal fish harvests (see Figure 6). Within these rows, however, trap elevations are not uniform. Traps 1–6, for example, seem to have been erected at a similar elevation, which suggests that they represent a single construction event within a season (Figure 9). Traps 7–20, however, are positioned at declining average elevations that may suggest one or two construction events year-over-year as Lake Cahuilla water levels slowly dissipated. Average elevations for traps 21–38 and traps 39–55 steadily decline, which suggests that they were constructed at successively lower elevations across a small number of years as the lake slowly dissipated. Fish trap rows, then, likely represent sequential fish trap construction following larger shoreline regressions over multiple years to decades of lake desiccation, and groupings of traps at elevation gradients within rows likely represent their year-over-year construction over shorter time periods.
Box and whisker plots showing the maximum and minimum elevations for each fish trap feature.
This year-over-year seasonal construction of fish traps follows patterns identified in the zooarchaeological record. In a meta-analysis by Gobalet and Wake (Reference Gobalet and Wake2000), a staggering 99% of the fish remains from 64 Lake Cahuilla archaeological sites were identified as bonytail chubs or razorback suckers, all of relatively similar size, probably captured during spawning season (Gobalet and Wake Reference Gobalet and Wake2000; Wilke Reference Wilke1978). Razorback sucker spawning season begins in January and ends in April, during which they congregate at night in large groups near shorelines or in shallow waters (Mueller and Marsh Reference Mueller and Marsh2002). Bonytail chub spawning season is considerably shorter, lasting from April to May (Mueller and Marsh Reference Mueller and Marsh2002). Bonytail chubs spawn in deep water during the day but move toward the shore at night where they continue to spawn (Mueller and Marsh Reference Mueller and Marsh2002). Outside of spawning season, fishers had little reason to construct or maintain fish traps, and slight changes in elevation indicate that not all the traps along elevation gradients were in use at one time, but probably represent the yearly construction of traps from local cobbles at the beginning of the seasonal fishing activities. This also suggests that fishers did not cannibalize older traps to create new ones but had plenty of cobbles for their in situ construction.
Most Lake Cahuilla fish traps have been classified as V- or U-shaped, although some have been described as either lines of parallel stones or circular (see White and Roth Reference White and Roth2009). Our aerial imaging and mapping suggests, however, that most of the fish traps at CA-IMP-12491 are asymmetrical and better classified as J-shaped. In fact, 80% (n = 44) of the 55 fish traps we mapped are more accurately described as J-shaped, while only 20% (n = 11) were V- or U-shaped (Table 1). The long arm of the J varies considerably across the fish trap features, with some only slightly longer than the hook (see Figure 5 fish traps 17, 29, and 37) and others with arms twice as long or more (see Figure 5 fish traps 24, 26, and 27). Coupled with this, while all the trap openings are positioned facing ancient Lake Cahuilla shorelines, nearly all the trap openings orient to the northwest. The combined directionality and asymmetrical J shape probably was carefully designed to funnel spawning razorback suckers and bonytail chubs into the narrow, closed apex of the trap in deeper water. Combined with currents and eddies, fishers walking along the shallow shoreline, and the long arm of the J acting as a barrier, the natural thigmotaxic response of these fishes would have helped funnel them along the walls, away from the trap entrance and into the basket or net at the trap apex (Connaway Reference Connaway2007; Gobalet and Wake Reference Gobalet and Wake2000; Oglesby Reference Oglesby2005).
CONCLUSIONS
The preliminary goal of our research was to better understand fish trap construction patterns and their relationship to the rapidly changing local environments of Lake Cahuilla during seasonal and decadal lake desiccation. Although all the fish traps at CA-IMP-12491 likely were constructed during the last lake highstand (Lake A), aerial survey using a UAV allowed us to identify new patterns in both the shape of fish traps and the timing of their construction. The CA-IMP-12491 fish trap features are located in an arid desert environment with sloping gravel terraces nestled between scattered rocks and desert sagebrush, making many of the features incredibly difficult to identify from the ground. Aerial survey and photogrammetry allowed us to quickly capture images, use cloud-based platforms to process high-quality orthomosaic maps and 3D models, and extract and analyze each of the fish trap features. This made the shape and directionality of the fish traps more clearly visible.
Our analysis demonstrated that rather than having U- or V-shaped features, most fish traps at CA-IMP-12491 were asymmetrical and J-shaped, presumably to take advantage of local currents and the natural behaviors of prey fish. The data gathered from the UAV survey produced precise measurements of each of the features. In addition, we found that even along a single ancient shoreline, fish traps were not all constructed at the same elevation, suggesting their expedient construction across multiple seasons as Lake Cahuilla slowly desiccated.
As emerging technologies such as UAVs and techniques such as photogrammetry become customary in archaeological field research, there is tremendous potential to more precisely and efficiently map and document archaeological fish trap features along freshwater and coastal systems worldwide and to revisit long-held notions about our ancient past. Our work, for example, suggests that the reanalysis of the dozens of stone fish trap sites that dot the recessional shorelines of ancient Lake Cahuilla could yield similar findings—that stone fish traps were more commonly shaped as a J than a U or a V and that fishers not only constructed expedient traps from local cobbles at the beginning of a new season but across seasons as the lake slowly evaporated. Uncovering these patterns can help us gain a better understanding of the people who lived in the area, as well as offer insights into how the environment surrounding Lake Cahuilla and the lake itself has changed over time.
Acknowledgments
Special thanks to Tricia Dodds, Jim Cassidy, and the staff at Ocotillo Wells SVRA for your help and support of our research. Thanks to Austin Hill and Spark Aerial (https://sparkcreative.tech) for donating their time and equipment in the field and expertise in the laboratory. We also thank two anonymous reviewers and Mark Sutton for their helpful suggestions on an earlier version of our manuscript.
Data Availability Statement
In keeping with the spirit of Open Science, but in deference to the sensitive nature of archaeological sites, we are making a primary dataset publicly available online at https://osf.io/xdj69/, and we are referable with the persistent identifier DOI 10.17605/OSF.IO/XDJ69. All spatial location data has been removed from the public-facing archive in order to protect the site from potential disturbance, but there remains enough integrity for anyone to replicate the substantive portions of our research. Researchers interested in obtaining spatial coordinates and georeferenced datafiles may contact the corresponding author (Braje) via email. We pledge to share all data in the event of any qualified research inquiry. All data related to the project, both in the public-facing archive and in our research archives, are published under a Creative Commons Attribution 4.0 International Public License, which allows unrestricted reuse of the data, providing the authors are credited in any derivative works that use the data.