


1. Introduction
Voter identification (ID) laws govern the interaction between voters and electoral administrators at the moment the voter receives their ballot paper. Scholars study voter ID laws because of their potential to shape who does or does not receive a ballot paper (Highton, Reference Highton2017). Currently, much of the research concerning voter ID laws focusses on the USA (Hershey, Reference Hershey2009; Vercellotti and Andersen, Reference Vercellotti and Andersen2009; Hajnal et al., Reference Hajnal, Lajevardi and Nielson2017, Reference Hajnal, Kuk and Lajevardi2018; Grimmer et al., Reference Grimmer, Hersh, Meredith, Mummolo and Nall2018; Gronke et al., Reference Gronke, Hicks, McKee, Stewart and Dunham2019; Hoekstra and Koppa, Reference Hoekstra and Koppa2019; Kuk et al., Reference Kuk, Hajnal and Lajevardi2020; Grimmer and Yoder, Reference Grimmer and Yoder2021), where variation across each state permits researchers to identify the causal effect of ID laws on turnout. More recent work has gone beyond the USA to gather comparative data on ID requirements (Barton, Reference Barton2022) and analyze the effects of ID laws from a cross-sectional perspective (Barton, Reference Bartonn.d.).
It is an open question as to whether effects in the USA can be generalized to a wider comparative context. First, within the USA, many factors related to turnout and voter ID laws (such as electoral system or the presence of national ID cards) are held constant; with their potential conditioning effect unable to be accounted for. Second, it is well established that ID laws in the USA have a racialised component to them which does not exist in the same manner outside of the USA (Bentele and O’Brien, Reference Bentele and O’Brien2013). Previous comparative cross-sectional data and analysis (Barton, Reference Bartonn.d., Reference Barton2022) allows us to address some of these concerns but does not permit causal identification. Given the change to voter ID laws has been contentious within the UK, there is a need for causal identification to help develop understanding of the impact of this policy change at future elections.
The purpose of this article is to create a level of causal identification through a number of methods a naïve difference-in-difference (DID), interactive fixed-effects (IFE), and a synthetic difference-in-difference (SDID) approach, as recently developed by Arkhangelsky et al. (Reference Arkhangelsky, Athey, Hirshberg, Imbens and Wager2021). These methods are applied to the 2018 London local elections where out of the 32 London boroughs only one (Bromley) participated in a voter ID pilot scheme. In the scheme piloted by Bromley, voters had to show either one piece of photo ID or two pieces of non-photo ID in order to receive their ballot paper. All other London boroughs maintained previous requirements, where voters only had to give their name and address. Using ward-level turnout data from five local elections between 2002 and 2018, I study how turnout changed due to the pilot scheme. One part of the pilot scheme was to assess the impact of changing the voter ID regime. The analysis carried out by the Electoral Commission (2019b) and Cabinet Office (Reference Cabinet2019) by their own admission lacked a robust estimate of the impact on turnout. A stated purpose of the pilot scheme was to understand potential impacts on turnout of any new, more restrictive voter ID law. Yet as we do not have a good estimate of this effect it is unclear what impact a more restrictive voter ID could have on the wider electorate. If this impact is larger than as described in the analysis carried out by the Electoral Commission and Cabinet Office the implications of changes to the voter ID law in the UK could be significant. More generally, given the electoral context in the UK is different from that of the USA, this article adds an important comparison to the study of electoral laws and how they shape key electoral outcomes. Changes to voter ID laws have become increasingly popular outside of the USA, and a majority of countries do require some form of photo IDFootnote 1 (Barton, Reference Barton2022); therefore, estimating an effect outside of the US context adds to the more general understanding of how different voter ID laws may shape turnout.
The first part of this article focuses on the specifics of the 2018 pilot scheme and how it relates to the Election Act 2022 which implements photo ID at all UK national elections and local elections in England. I also describe how the London local elections function. Second, I discuss relevant literature on voter ID laws both at the global level and within single countries, and how both the 2018 and 2019 UK pilot schemes have been analyzed thus far.
I then go on to describe the data and methods used. I describe, briefly, the DID and IFE estimators and how they relate to the SDID estimator. As the SDID model is a relatively new innovation I spend some time explaining its core components and general aims. I also explain why it is useful for my research question in particular and political science more generally. Using the DID and IFE methods on ward-level data, I show that when this particular pilot scheme was in place average turnout across all electoral wards in Bromley fell by 4.0–5.0% points. Given SDID is unable to implement clustered standard error, I use the SDID method, on borough-level data I show that when this particular pilot scheme was in place average turnout across all electoral wards in Bromley fell but only under a specification which looked at strong Tory councils was the effect statistically significant with a point estimate of negative 7.5% points. Lastly, I discuss my findings in relation to the passage of the Election Act 2022 and discuss the wider implications for the study of voter ID more generally.
2. Existing literature on voter ID laws
During elections, there is often a trade-off between allowing all registered voters the opportunity to vote and ensuring a sufficient level of integrity so that voters, politicians, and the international community can trust the results (Norris et al., Reference Norris, Frank and Coma2013). An element of this trade-off is to decide if voters should be asked to show ID when they enter a polling station or whether poll clerks can trust voters’ self-identification. The different types of ID that can be required of a voter typically fall into three categories of varying restrictiveness (Barton, Reference Barton2022). At one end, voters are asked to recite simple information about themselves; at the other extreme, voters must show a form of photo ID or have their fingerprints scanned. There is a considerable body of literature that has examined how different laws may shape participation (Hajnal et al., Reference Hajnal, Lajevardi and Nielson2017; Barreto et al., Reference Barreto, Nuño, Sanchez and Walker2019; Kuk et al., Reference Kuk, Hajnal and Lajevardi2020; Michael, Reference Michael2020), how such effects are moderated or conditioned (Valentino and Neuner, Reference Valentino and Neuner2017; Neiheisel and Horner, Reference Neiheisel and Horner2019) and when such laws may be introduced (Rocha and Matsubayashi, Reference Rocha and Matsubayashi2014).
Further, current literature within the USA argues that more restrictive voter ID laws are introduced to exclude certain groups which are reflected in changes in turnout. Hajnal et al. (Reference Hajnal, Lajevardi and Nielson2017), for example, show that racial minority groups are more likely to lack correct ID when a photo ID law is in place. These laws become exclusionary and racial minorities are less likely to own a passport or driving license for instance (Bentele and O’Brien, Reference Bentele and O’Brien2013). This is due to the affordability of valid IDs for racial minorities and acquiring the information necessary to vote (Bentele and O’Brien, Reference Bentele and O’Brien2013). These greater costs for such voters may alter the classical Downsian model of cost-benefit (Downs, Reference Downs1957) so that costs now outweigh the perceived benefits of voting and some voters no longer turnout, with certain groups of voters impacted more.
Some research has begun to assess the relationship between different voter ID laws and participation outside of the USA (Barton, Reference Bartonn.d.; James and Clark, Reference James and Clark2020; Orr and Arklay, Reference Orr and Arklay2016). Although this strand of research currently lacks causal identification as it is cross-sectional in nature, it indicates the countries with more restrictive laws experience lower levels of turnout. Many countries have had their current voter ID laws in place for a long period of time making the study of the effects of changes to ID laws challenging. Where laws have changed, finding previous legislation that can be considered accurate is difficult. Therefore, to bridge the gap between causal identification and comparability, I make use of a recent change over time which occurred in local elections in London in 2018. The estimated effect can be compared to effects in the USA, and it can be concluded whether such effects on participation are stronger or weaker in a different setting. Therefore, this article addresses key gaps in the literature, namely comparability and causal identification.
3. Voter ID pilot schemes in the UK
Following the review of electoral fraud by Sir Eric Pickles (Reference Pickles2016), who now sits as a Conservative peer in the House of Lords, the UK Government, through the Cabinet Office, ran two sets of voter ID pilots. These schemes altered the identification process for voters or the how of voting (R v minister for the cabinet office, (2022)). Specifically, what a voter must bring to the polling station in order to receive a ballot paper. This did not impact the postal voting process. This occurred twice, once in 2018 and 2019. Each time multiple councils ran the scheme with varying ID requirements. To become a pilot area, local councils were initially asked for an expression of interest which then moved onto a formal application process (Cabinet Office, Reference Cabinet2017). In the formal application process, councils (more precisely Returning Officers) had to show they met certain criteria. The most obvious being they had to have local elections scheduled for May 2018 or May 2019. Supplementary criteria included the need for local support, evidence of feasibility, staffing capabilities and an ability to show that the integrity of the election can be protected (Cabinet Office, Reference Cabinet2017).
This process shows two issues regarding assignment of treatment conditions. In the ideal scenario, such pilot schemes would be assigned to local councils randomly with balances across demographic and other characteristics (such as political control). This would allow for the estimation of the average treatment effect for the population.Footnote 2 However, given how councils were selected in this pilot scheme treatment assignment is not random and we can assume some criteria would correlate with the effect of the scheme.
First, given that introducing a more restrictive form of voter ID was a Conservative manifesto pledge it should be expected that areas with greater Conservative support would be more in favor of piloting the scheme. James and Clark (Reference James and Clark2020) noted a variation in local authority control and local authority type were severely lacking, all local councils apart from Watford had a Conservative majority before the pilot schemes were implemented.
Second, selection into pilot schemes appears to be based on resources and experience. If only well-resourced councils and experienced Returning Officers applied (as they had confidence in implementing the scheme), we would expect a voter ID pilot scheme to have less of an effect when compared to areas where resources are fewer and staff have less experience. These points about treatment assignment show selection was not random; therefore, what can instead be estimated is the average treatment on the treated (ATT).
We know for certain that treatment assignment was not random. Local authorities applied individually to participate in the scheme (Cabinet Office, Reference Cabinet2017). This was done in a two-staged process with an initial expression of interest and then a formal application. As was noted by James and Clark (Reference James and Clark2020), self-selection played a significant role in which areas piloted the voter ID schemes.
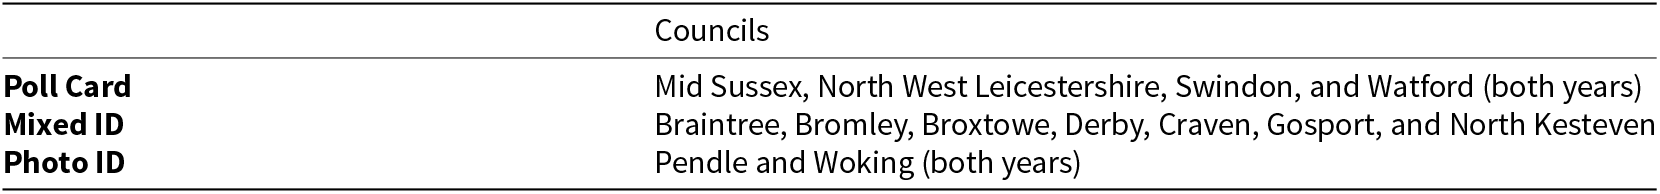
Only Watford and Woking councils piloted the scheme in both years with all other councils only taking part in the pilots in either 2018 or 2019.Footnote 3 Table 1 shows which councils participated by year. A breakdown of the general requirements for each council is shown in Table 2. In the poll card, areas voters were expected to bring only their polling card which was automatically sent to them in the post. In mixed ID areas, voters could bring either one form of photo ID or two forms of non-photo ID. In photo ID areas, voters were required to show one form of photo ID. Each variation was then evaluated by the Electoral Commission. While there was clear selection into the scheme selection on the outcome (turnout) seems unlikely. In the 2014, English local elections turnout across all authorities was 36%, those who in 2018 participated in the 2018 pilot schemes their average turnout in 2014 was 36.21% (Rallings and Thrasher, Reference Rallings and Thrasher2014). Therefore, at least in terms of turnout, there was little difference between the eventual treated and untreated groups in the final pretreatment period.
Voter ID pilot areas by year

When conducting their own assessments the Electoral Commission concluded there was no significant effect on participation in 2018, as did the Cabinet Office following the pilots in 2019 (Cabinet Office, Reference Cabinet2019; Electoral Commission, 2019b). In their report, the Cabinet Office stated turnout data could not be used “due to the nature of the poll” where some areas had boundary changes or last had local elections at the same time as national elections (Cabinet Office, Reference Cabinet2019, 9). Here the report seems to imply that no form of causal identification can take place as like-for-like elections where the only change was the implementation of the pilot scheme did not occur.
Voter ID pilot areas by scheme

While it is true that getting “perfect” matches between pre- and post-voter ID pilot elections is close to impossible, it is perhaps premature to reject the idea that any meaningful analysis where turnout is the variable of interest is unworkable.
However, tools are available whereby we can overcome some of these issues, by drawing on emerging methodologies from other fields. Therefore, the purpose of this article is to assess the impact of the pilot schemes beyond what was provided by the Electoral Commission and Cabinet Office. These bodies only provided a descriptive analysis when assessing the pilot schemes which is problematic in understanding the nature of restrictive voter ID laws and what their implementation may be at future elections through the Elections Act 2022.
4. Hypothesis
The pilot schemes in 2018 and 2019 did alter how voters in certain areas acquired a ballot paper. This was done by asking voters to bring a piece of ID to the polling station to prove who they were. This was a novel thing for many as, excluding Northern Ireland, voters only had to state their name and address previously. As mentioned existing literature has shown that when voter ID laws are more restrictive turnout can be lower. Reasons for why this is the case could include the following:
• Increased costs of voting (Downs, Reference Downs1957).
• Resentment towards having to show ID or staying away as they do not or feel they do not have the required ID.
• Lack of adequate information for voters.
These potential mechanisms may have heterogeneous effects across different groups within a voting population and indicate that more restrictive ID laws can be discriminatory (Bentele and O’Brien, Reference Bentele and O’Brien2013). These mechanisms could play a role in the context of the pilot schemes. However, it could argued be that no effect is found, in this particular case. It is well established that at local elections, especially in the UK, turnout is lower than at general or first-order elections (Frandsen, Reference Frandsen2002) and turnout is not lower uniformly.
Those that turnout at local elections tend to be strong partisans, very interested in politics and older people (Hajnal and Trounstine, Reference Hajnal and Trounstine2005; Rallings and Thrasher, Reference Rallings and Thrasher2007). Therefore, since the local election “type” voter could be more willing to overcome the preparation costs of voting when measuring effects that alter the costs of voting a minimal or no effect may be found. This being said I hypothesize that a negative effect should be present given the nature of the pilot schemes generally and how local elections in the UK function. We know that there was an information campaign to inform people of the pilot schemes through postal leaflets, posters in public places and social media adverts. Yet, these were implemented relatively close to election dayFootnote 4 and were criticized for information not being as widespread as it could have been, particularly for hard to reach groups (“May 2018 Voter Identification Pilot Schemes: Impact on Voters” 2019). As has also been suggested other factors that could mute, or cause there to be no effect between restrictive voter ID laws and turnout such as vouching or universal national ID cards were not present in the pilot schemes. Therefore, I hypothesize that turnout will be lower in pilot areas than would have otherwise been. More formally:
H 1: Local authorities that participated in the UK voter ID pilot scheme experienced a lower level of turnout than if they did not participate in the pilot scheme.
Given the schemes were implemented in areas that tended to vote Tory and in areas where the schemes would likely succeed, any negative effect will likely represent a lower bound estimate and will have significant implications in terms of how turnout could have been if schemes were rolled out randomly and what the effect on turnout may have been at the 2024 General Election where photo ID was required.
5. Method and data
To test my hypothesis, I employ three sets of models, a naïve DID, an IFEs and an SDID approach developed by Arkhangelsky et al. (Reference Arkhangelsky, Athey, Hirshberg, Imbens and Wager2021). I apply these methods to the London Local Elections where the London Borough of Bromley piloted a mixed model of ID in 2018. The first two can be applied to ward-level data as they have the ability to specify clustered standard errors. The latter can only, credibly, be applied to borough-level data as the SDID method does not currently allow for clustering of standard errors.
5.1. Naïve DID
As is well established in the literature, DID models are one of the most popular causal inference tools and are straightforward to implement. To estimate the treatment effect, this naïve equation can be used:
 \begin{equation}Y_{it}=\mu\;+\;W_{it}\tau\end{equation}
 where  $\mu$ is the global intercept and $W_{it}$ is a binary treatment indicator with $\tau $ being the treatment effect. The key assumption underpinning this method is parallel trends, the treated unit would have evolved in the same manner had it not been treated. Often, in political science, it is difficult to argue that a parallel trends hold perfectly, especially when treated units are clustered. Given, in my data, those wards assigned to the treatment condition are within Bromley and could not independently choose to be treated or not when estimating standard a clustering algorithm needs to be used. For this model, I use wild cluster bootstrap at the borough level.Footnote 5 All standard errors are computed by using the vcovBS command from sandwich package in R with 1,000 replications. The use of wild clustered bootstrap is advantageous in this case given the low number of clusters (less than 30) and because in the DID model binary variables are used thus conventional bootstrap clusters would be inestimable (Cameron et al., Reference Cameron, Colin, Gelbach and Douglas2008).
5.2. Interactive fixed-effects
Second, using the same ward-level data, I estimate the causal effect of the pilot scheme using an IFE design, specifically a generalized synthetic control (SC) approach (Yiqing, Reference Yiqing2017). Compared to the naïve DID model above, this model adds a layer of complexity and can be specified in the following form:
 \begin{equation}Y_{it}=\mu\;+\;\alpha_i\;+\beta_t\;+\;\alpha\beta_{it}\;+W_{it}\tau\end{equation}
 These fixed effects incorporate unit-level intercepts,  ${\alpha _i}$ and time-varying factors, ${\beta _t}$ (Yiqing, Reference Yiqing2017). It could be assumed that, under the naïve DID specification, without the inclusion of covariates there are unobserved unit and time effects which could bias the estimated effect. Under this IFE specification, the model allows for the treatment to be correlated with such effects (Yiqing, Reference Yiqing2017a). Given this modeling strategy is factor based, it uses cross-validation to select the optimal number of factors before estimating a causal effect. Uncertainty can be estimated through both parametric and nonparametric bootstrapping or jackknife procedures. In the analysis section, I report all three.
5.3. Synthetic DID
As mentioned, to combine the benefits of the SC and DID methods which have been increasingly used in political science, I estimate the effect with a synthetic difference-in-difference (SDID) model. This SDID approach developed by Arkhangelsky et al. (Reference Arkhangelsky, Athey, Hirshberg, Imbens and Wager2021) gives researchers a new tool where the reliance on parallel trends and controlling for additive unit-level changes can be weakened. As is well established, the two-way fixed effect DID model specification has the following form:
 \begin{equation}Y_{it}=\mu\;+\;\alpha_i\;+\beta_t\;\;+W_{it}\tau\end{equation} ${\alpha _i}$ allows us to control for differences between units and attempts to explain why units may have pretreatment and posttreatment (at the first posttreatment period) differences. $\beta $ controls for differences across time periods, explaining systematic differences across all years for posttreatment time periods.
The SC approach aims to approximate the outcome of the treated unit as if it had not been treated given the pool of control units. The estimated treatment effect is then the difference between this counterfactual estimate and the factual treated outcome. This counterfactual case is a weighted average of the control units to best approximate the treated unit i = 1. This takes the form:
 \begin{equation}
\widehat{\tau _{i = 1t}} = Y_{it}^I - \widehat{Y_{it}^N}\end{equation}
\begin{equation}
\widehat{\tau _{i = 1t}} = Y_{it}^I - \widehat{Y_{it}^N}\end{equation} where  $Y_{it}^I$ is the factual treated outcome and $Y_{it}^N$ is the synthetic counterfactual untreated outcome, given by:
 \begin{equation}
\widehat{Y_{it}^N}\; = \;\mathop \sum \limits_{i = 2}^{I + 1} \widehat{\omega _i}_t{Y_{it}}
\end{equation}
\begin{equation}
\widehat{Y_{it}^N}\; = \;\mathop \sum \limits_{i = 2}^{I + 1} \widehat{\omega _i}_t{Y_{it}}
\end{equation}  $\hat{\omega}_{i}$ describes the unit-level weight, where each value of these weights are chosen so that the synthetic counterfactual matches the treated unit as closely as possible for all pretreatment periods. The process of calculating this is described in detail below. The innovation of the SDID method is to include time weights ( $\widehat {{{{\lambda }}_{\text{t}}}}$) alongside the unit-level weights in the estimation of $Y_{{\;it}^N}$, like so:
 \begin{equation}
\widehat{Y_{it}^N} = \;\mathop \sum \limits_{i = 2}^{I + 1} \widehat{\omega _i}\widehat{\lambda _t}{Y_{it}}
\end{equation}
\begin{equation}
\widehat{Y_{it}^N} = \;\mathop \sum \limits_{i = 2}^{I + 1} \widehat{\omega _i}\widehat{\lambda _t}{Y_{it}}
\end{equation} The treatment effect is then calculated in the same way as in equation 2, or, perhaps, more familiarly as a weighted two-way fixed effects DID regression. Calculating both the unit-level and time weights is done via a loss function. A loss function quantifies how far away our computed outcome is from our desired (or actual) outcome. This can also be understood as the error in our computation. In the case of weights, the loss function calculates how far the synthetic and real outcomes are from each other. When calculating the weights the aim is to reduce or minimize the “gap” between the control and treated units. The minimization process represented by argmin in the equations below asks how small can we make this loss  ${\ell _{unit}}\;/{\ell _{time}}$ or error given certain constraints.
 \begin{equation}
({\hat\omega}_{0},{\hat\omega} )\; = \mathop{{argmin}}_{{\omega _0} \in \mathbb{R},\omega \in \Omega} {\ell _{unit}}({\omega _0},\omega )
\end{equation}
\begin{equation}
({\hat\omega}_{0},{\hat\omega} )\; = \mathop{{argmin}}_{{\omega _0} \in \mathbb{R},\omega \in \Omega} {\ell _{unit}}({\omega _0},\omega )
\end{equation}And:
 \begin{equation}
({{{\hat\lambda }}_0},\;{{\hat \lambda }})\; = \mathop{{argmin}}_{{\lambda _0} \in \mathbb{R},\lambda \in \Lambda} {\ell _{time}}({\lambda _0},\lambda )
\end{equation}
\begin{equation}
({{{\hat\lambda }}_0},\;{{\hat \lambda }})\; = \mathop{{argmin}}_{{\lambda _0} \in \mathbb{R},\lambda \in \Lambda} {\ell _{time}}({\lambda _0},\lambda )
\end{equation} In both cases, two constraints are placed on the loss function, both  ${\omega _0} \in \mathbb{R}$ and ${\lambda_0} \in \mathbb{R}$ tell us intercept values are calculated for unit and time weights that can be any real number. The second set of constraints, $\omega \in \Omega $ or $\lambda \in \Lambda $, have their own formulasFootnote 6 which state that control unit and pretreatment weights must be real positive numbers and these two sets of weights must sum to 1. This tells us all weights are positive decimals. The second part of these constraints states all treatment units or posttreatment periods are equally weighted.Footnote 7
Arkhangelsky et al. (Reference Arkhangelsky, Athey, Hirshberg, Imbens and Wager2021) provide more detail on the form of the loss functions ( ${\ell _{unit}}\;\text{and}\;{\ell _{time}}$). More simplified ways of calculating these weights are possibleFootnote 8 but given the package used integrates this more robust form I make use of it in my analysis.Footnote 9
5.4. Error estimation
The methods described above allow us to calculate a treatment effect  $\hat\tau$ by subtracting the counterfactual outcome from the observed outcome. They do not, however, allows us to express uncertainty regarding the treatment effect—or at least not on their own. Various methods have been developed to estimate the uncertainty of a given treatment effect Arkhangelsky et al. (Reference Arkhangelsky, Athey, Hirshberg, Imbens and Wager2021) describe three error estimation methods. These are a clustered bootstrap, placebo and jackknife. In my analysis, I rely on the placebo method as it is the only method that can be applied to the borough-level data.Footnote 10
The placebo method is most applicable to the data used in this article. The placebo method drops the actual treated unit(s) and selects one control unit to be a “fake” treatment case and re-estimates the model to estimate noise within the data. If it is assumed that the “real” estimated effect is properly identified and operationalized and the model is not just picking up “noise” in the data then the placebo estimates should show a null effect; or be significantly different from the non-placebo estimate. If the effect being measured is not credible then it would not being significantly different from the placebo estimates. More formally the placebo calculates the variance in the estimated effects of each control unit being assigned to the treatment condition. This variance is then represented by confidence intervals. Arkhangelsky et al. (Reference Arkhangelsky, Athey, Hirshberg, Imbens and Wager2021) re-write the variance calculation in the following form:@@
 \begin{equation}
\widehat{V_{{\tau }}^{placebo}} = \frac{1}{B}{\left( {\mathop \sum \limits_{b = 1}^B \widehat{\tau ^{\left( b \right)}} - \frac{1}{B}\mathop \sum \limits_{b = 1}^B \widehat{\tau ^{\left( b \right)}}} \right)^2}
\end{equation}
\begin{equation}
\widehat{V_{{\tau }}^{placebo}} = \frac{1}{B}{\left( {\mathop \sum \limits_{b = 1}^B \widehat{\tau ^{\left( b \right)}} - \frac{1}{B}\mathop \sum \limits_{b = 1}^B \widehat{\tau ^{\left( b \right)}}} \right)^2}
\end{equation} where b is the control unit being assigned as the treatment condition. B indicates this process occurs across all control units.  $\hat\tau$ represents the estimated effect as before. From ${\hat{\vee}}$, being the variance estimate, standard errors can then be calculated which is then multiplied by a critical value (I use 1.96 to estimate 95% confidence intervals) to give the desired confidence interval. The key assumption when using the placebo method is that it is homoscedastic.
The main limitation of the SDID design is that it does not currently allow for the estimation of clustered standard errors. Therefore, results presented under this design have been modeled on borough-level data. To implement the SDID design, I make use of the synthdid package for R that accompanies Arkhangelsky et al.’s (Reference Arkhangelsky, Athey, Hirshberg, Imbens and Wager2021) paper.
5.5. Application to the UK voter ID pilot scheme
As previously stated, the pilot schemes (treatment) were not applied evenly across the UK electorate. Therefore, generalizations may be harder to reach about any treatment effect found and thus results estimate an ATT rather than an ATE. As a range of voter ID regimes were applied across the participating local authorities (James and Clark, Reference James and Clark2020), different “treatments” exist across all local councils. With the properties of the methods described above, especially for IFE and SDID methods, which allow for a single or small number of treated units; analysis can be focused on a particular local authority and its particular pilot scheme.
I focus my analysis on Greater London where elections for borough councils take place every 4 years, at the same time and every seat is elected at the same time, typically in multimember wards (These tend to range between 1 and 4 councilors in each ward). Voters have as many votes as there are vacancies with the top candidates being elected until all seats are filled. The current system first began in 1964 and has gone unchanged, apart from ward boundaries within councils being redrawn periodically. This is at the discretion of the local parties and the council with boundary commission input. Each council is then controlled by whichever party or combination of parties has a majority of councilors. Like all local elections in the UK, turnout is typically lower than general elections. This is beneficial for answering my research question as many factors related to the running of elections are held constant. If I were to expand my analysis beyond London so as to include all councils other factors such as if the full council is up for election or if any Mayoral elections were taking place would have to be considered. Focusing on London means my treatment case is Bromley which implemented a mixed ID pilot scheme.
Compared to the naïve DID and IFE approaches, the SDID approach does allow for a weaker reliance on the parallel trends assumption there is still a need for treatment and control conditions to be similar enough. Given I am focusing within one geographic region (London) where data being used is produced under the same conditions (same elections happening at the same time under the same rules) it seems reasonable to assume the parallel trends assumption would not be heavily violated and that any violation can be limited through reweighing “the unexposed control units to make their time trend parallel” (Arkhangelsky et al., Reference Arkhangelsky, Athey, Hirshberg, Imbens and Wager2021, 4094).
The Election Act 2022 which has been in place for local and parliamentary by-elections in England since January 2023 and all UK General Elections from October 2023 sits within the photo ID category so using Bromley as my case study cannot be considered a direct indication of effects measured that may occur at subsequent elections. However, the report into the 2018 pilots stated the most popular form of ID used in Bromley was a passport or photographic driving license; thus, some comparison is possible. I decided not to use Pendle and Woking as council elections in their respective areas (Lancashire and Surrey) occur at different times across the region, compared to London where all boroughs hold council elections at the same time.
5.5.1 The particular case of Bromley
Briefly, as shown in Figure 1 the London Borough Bromley is in the southeast of Greater London. It is the most rural of all London boroughs as it has the largest proportion of green belt land. Since 1964, the Conservatives have held a majority of the seats on the council, apart from 1998 to 2001 when a Labour/Lib Dem coalition ran the council. In 2018, the Conservatives won 50 out of 60 seats on the council this fell to 36 out of 58 seats in 2022. Therefore, Bromley can be considered as a very safe Conservative council. As discussed above, it is found within the literature that minority groups are often affected most by more restrictive voter ID laws. In the UK, evidence shows such minority groups are less likely to vote Conservative. Further from population estimates, the proportion of ethnic minorities in Bromley are greater than the proportion of ethnic minorities in the wider UK population (Office for National Statistics, 2021).Footnote 11 Bromley also had a similar median age to the rest of England at 41 and 40 years, respectively. In terms of occupation, residents of Bromley were more likely to be in higher managerial occupations than the rest of England and Wales (Office for National Statistics, 2021). Bromley also voted 50.6% to 49.4% to Remain in the EU Referendum in 2016. All three parliamentary seats were held by the Conservatives in 2019, gaining over 50% of the vote in each.
A map of all Boroughs in Greater London with Bromley highlighted in blue.

The pilot scheme in Bromley allowed voters to bring either one photographic form of ID or two nonphotographic forms of ID (Electoral Commission, 2019a). The list of photographic ID match to the current IDs allowed under the Election Act 2022 save for some minor variations.
Bromley was the only London borough to participate in the pilot scheme in 2018 and no local elections took place in London in 2019. Being the only local authority to participate or to be treated would render the classical DID specification insufficient. Leveraging the qualities of an SDID design an estimate of the effect of the pilot scheme can be recovered.
5.6. London local election data
Although there have been many criticisms of election data in the UK with a large scope for improvement (James and Bernal, Reference James and Bernal2023), for local elections we have turnout data available at the borough and ward level. At the ward level, there are 23 treated units (wards in Bromley) out of 630 total units (wards). Turnout data from each ward for each year were collected from election reports published after each election by the Greater London Authority available from the London Datastore website (London Datastore, Reference Datastore2023). Data are then merged by geographic ward code and ward name (with the name of the borough attached to prevent mismatching) to create a panel dataset which records turnout for each ward at local elections from 2002 to 2018. In the 2010 and 2014 data, there were also General and European Parliament elections respectively; this was consistent for all units within the data and do not overlap with the treatment time. Therefore, it can be expected that any turnout changes due to these elections would not significantly interact with the treatment effect. This further justifies why I focus my analysis on just London. If I made use of all pilot areas in 2018 and the remaining control areas, other factors such as combined authority mayoral elections would need to be accounted for. Focusing on London allows me to keep as consistent control and treatment groups as possible. This is particularly necessary given my treatment assignment was not random.
Within boroughs some ward boundaries did change. This affected five boroughs;Footnote 12 therefore, all wards form these boroughs are excluded. This leaves 27 boroughs included in the analysis, totaling 503 individual wards (22 of which are in Bromley so are treated) across five time periods, thus 2515 total units.
For the SDID estimates, I use borough-level data. Here all 32 boroughs are included, the number of pretreatment time periods is also increased to go back to 1964. Therefore, the data have 14 pretreatment periods and 1 posttreatment period, thus 480 total units.
6. Results
6.1. Descriptive analysis
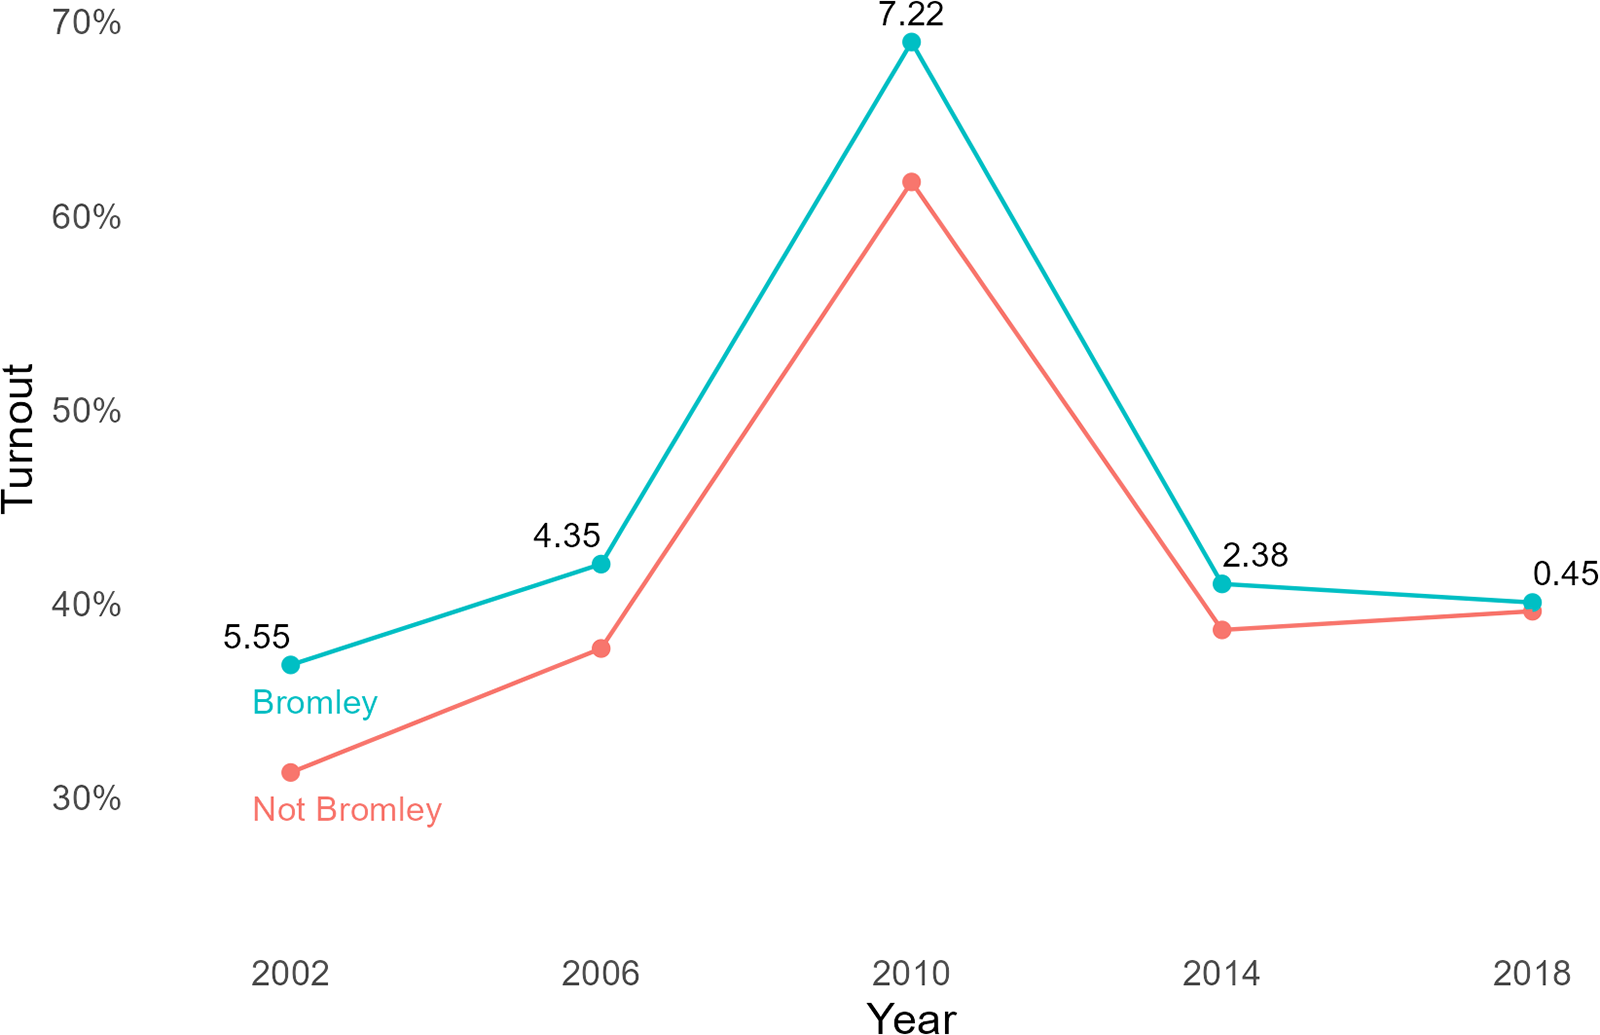
Visualizing the changes in turnout over time, Figure 2 shows the average turnout for wards in Bromley (in blue) and average turnout for all other wards (in red). Included are labels which show the absolute percentage point difference in turnout. As can be seen the obvious peak in both lines is in 2010 when London local elections coincided with the 2010 General Election. This is also where the largest absolute difference occurs but has a very similar relative difference to the local elections in 2006. After 2010, differences narrow quite significantly, with 2018 being the narrowest at 0.45% points.
Average ward-level turnout for local elections between 2002 and 2018 in London. Labels show the absolute percentage point difference in turnout.

6.2. Naïve DID
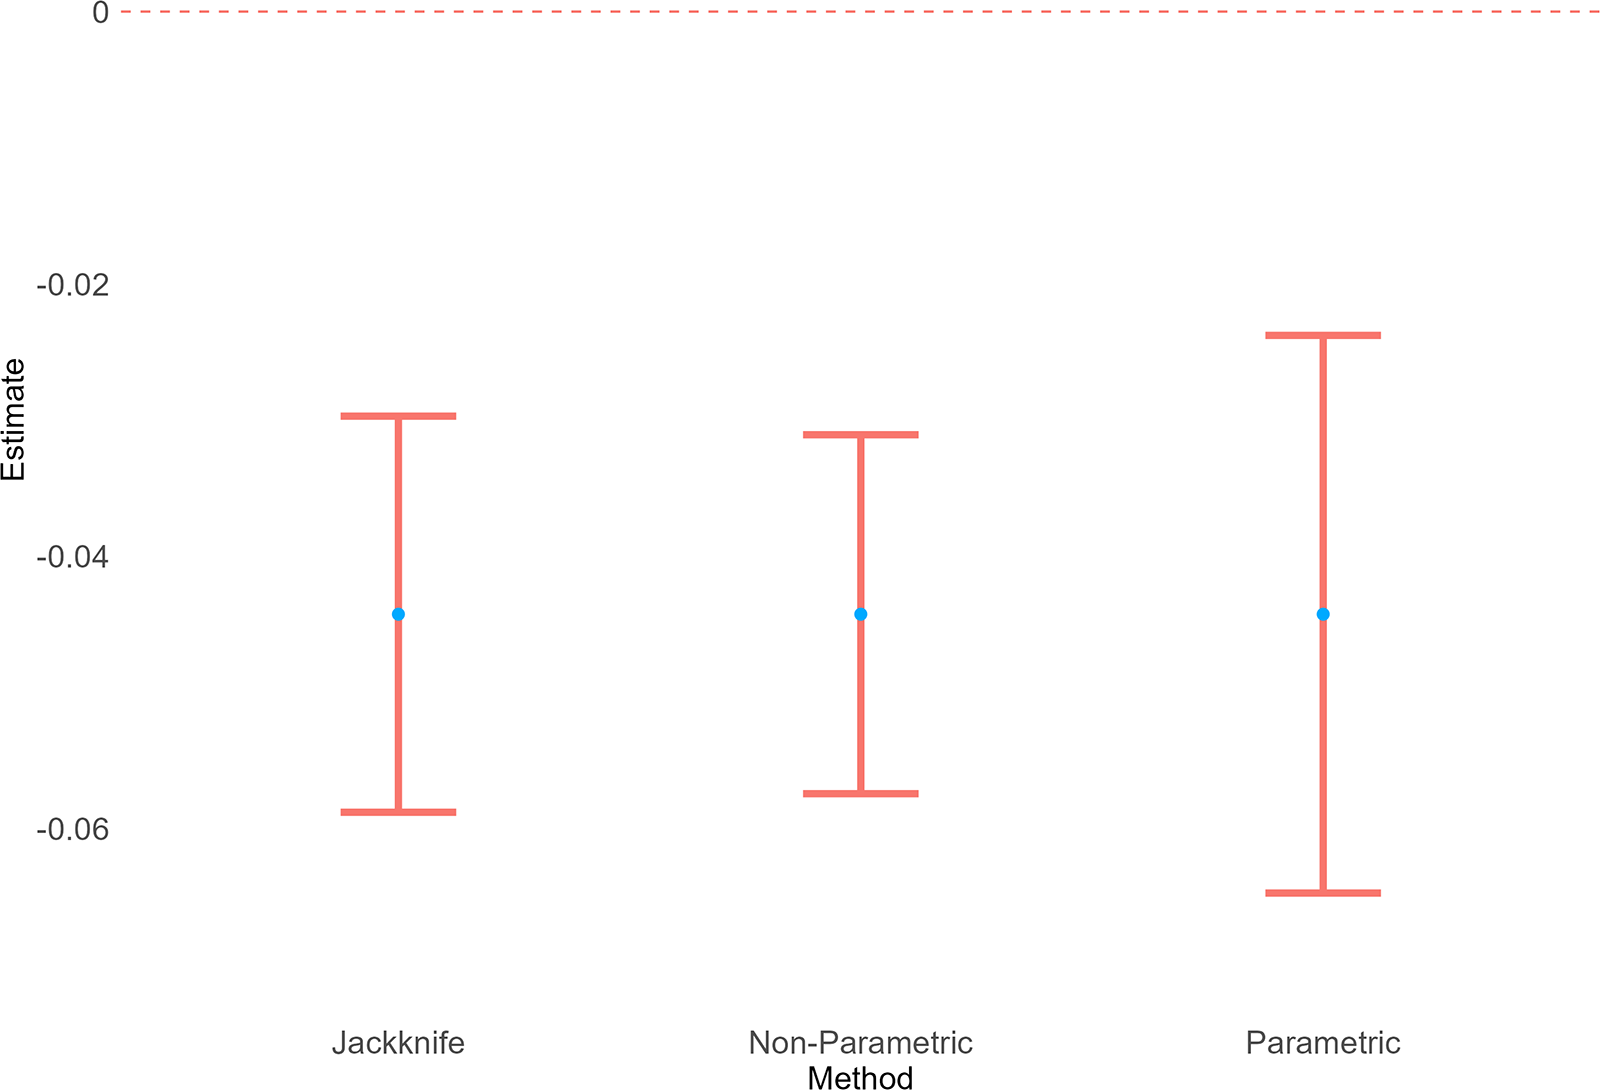
First, I report the results from the naïve DID model with wild clustered bootstraps as described above. In Figure 3, the model calculates a point estimate of −5.0% points. All confidence intervals are statistically significant at the 95% level and appear very similar, this is to be expected given each method is estimated in only subtly different ways.Footnote 13
Treatment effect estimates for ward-level data using a standard DID design with wild clustered boostrapped (1,000 replications) 95% CIs.

6.3. Interactive fixed-effects
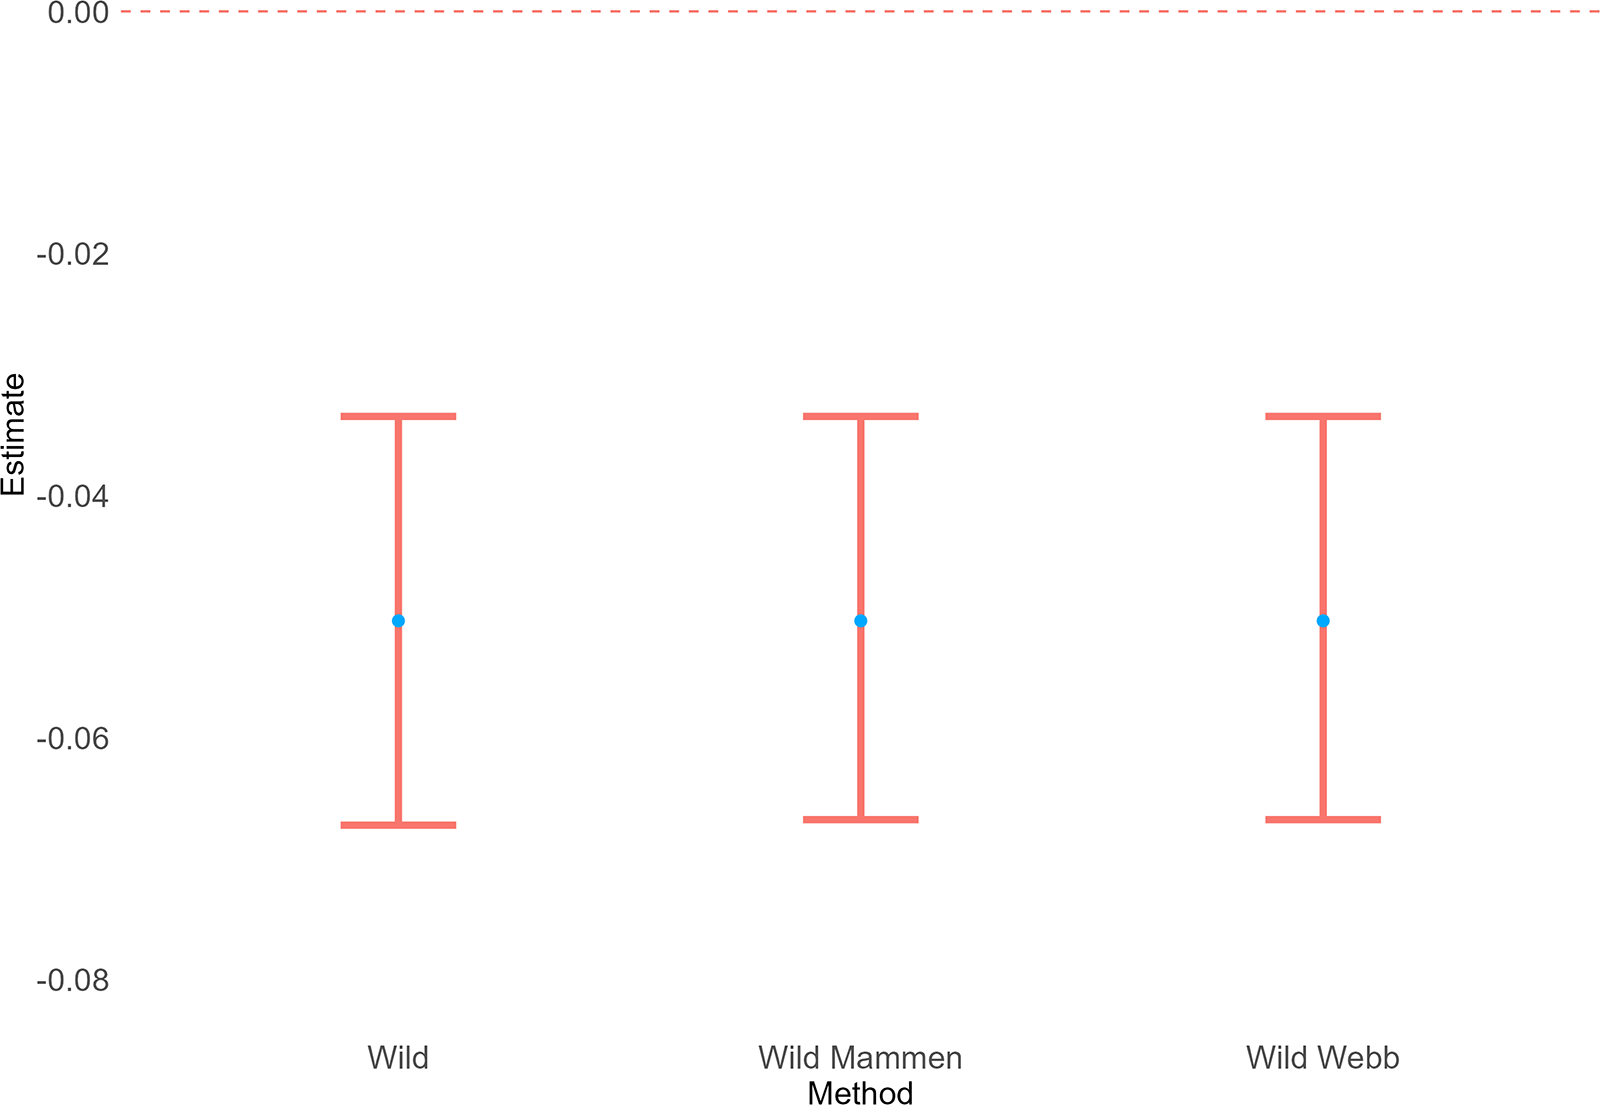
Second, Figure 4 presents the IFEs model with parametric and nonparametric bootstraps, and jackknifing procedures. The model gives a point estimate of −4.4% points, all error estimation methods show statistically significant results, but there is more variation in their width.Footnote 14
Treatment effect estimates for ward-level data using an IFE design with parametric, nonparametric and jackknife 95% CIs.

Therefore, when accounting for the clustered nature of treatment assignment it does appear that there was a negative ATT through the implementation of the pilot scheme in Bromley. However, as noted by Arkhangelsky et al. (Reference Arkhangelsky, Athey, Hirshberg, Imbens and Wager2021), the estimate size reported in these results may overestimate the true effect size. To test this, but using borough-level data for reasons mentioned above, I rerun the analysis using the SDID design.
6.4. Synthetic DID
One benefit of using borough-level data in the context is that I can increase the number of time periods (beginning in 1964) as boundary changes are no longer an issue. Figure 5 shows the SDID parallel trends plot. As can be seen, the control and treatment groups are reasonably parallel, and the model uses few of the total time periods.
Parallel trends plot for SDID estimates, the parallel trends are shown by the dotted lines. Pretreatment and posttreatment averages are shown by the opaque lines, weighted by unit and time period. The time period weights are represented by the red area under the graph. The solid black arrow shows the estimated treatment effect. The translucent lines show the average values for control and treatment groups at each time period.

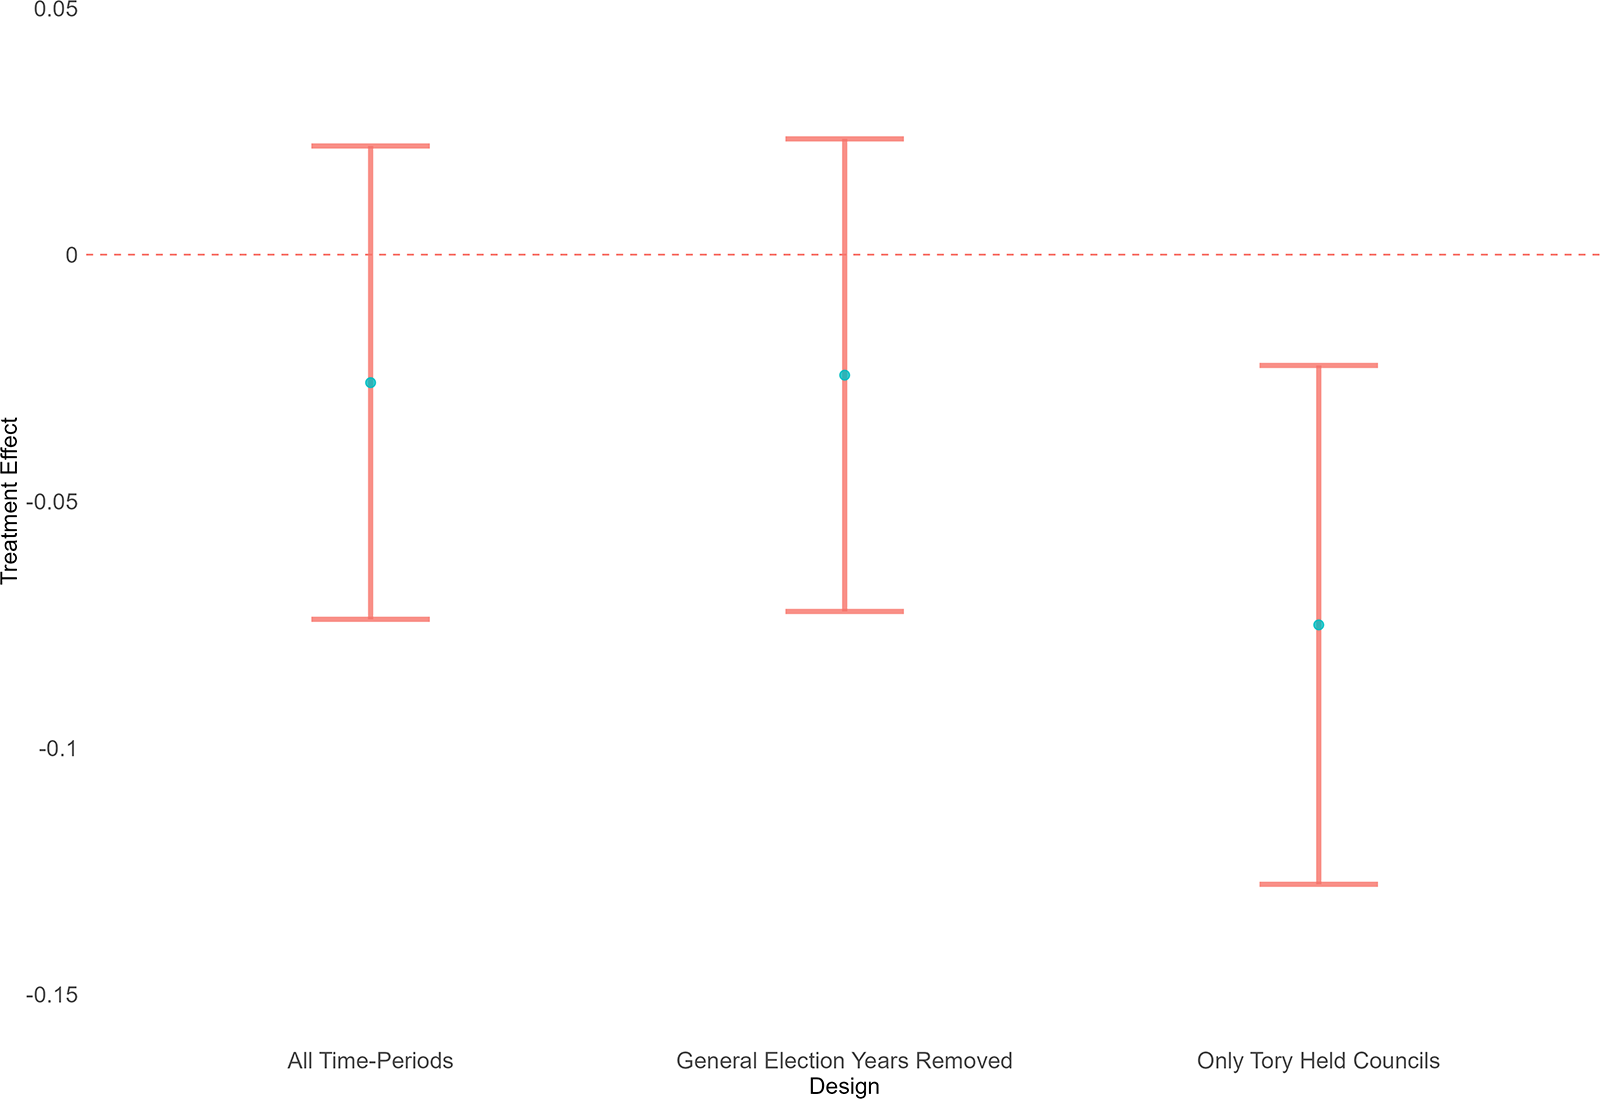
Figure 6 presents the point estimates with level data with 95% placebo CIs.Footnote 15 I include three sets of models; all election years, general election yearsFootnote 16 removed and only Tory held councils from 2002 to 2018.Footnote 17 As can be seen the only model that shows a significant treatment effect is the model that only retains Tory held councils from 2002, with a point estimate of 7.5% points and 95% CIs of −13.0% points and −2.0% points. In terms of interpretation, these findings show that, for Bromley, turnout would have been 7.5% points higher if the pilot scheme had not been in place in 2018 when the most similar councils act as the donor pool of control units. The Tory held council model may illustrate the point that the rest of London could be a poor match to Bromley. Furthermore, Tory held councils were more likely to select into the pilot scheme; therefore, when restricting my units to only Tory councils, it can be assumed that treatment assignment was less systematic than in the more general case of including all councils. In the online Appendix, I discuss the weights in greater detail. For time weights, 2014 is given the greatest value. For unit weights, the seven boroughs with greatest weight are located on the outskirts of London, like Bromley and demographically they prove a good match.
Treatment effect estimates for borough-level data across all councils, with local elections that had general elections running concurrently removed and when only local councils that were controlled by the Tories between 2002 and 2018 (this includes Bromley) are kept. Error bars are 95% placebo CIs.

6.4.1. Local average treatment effects
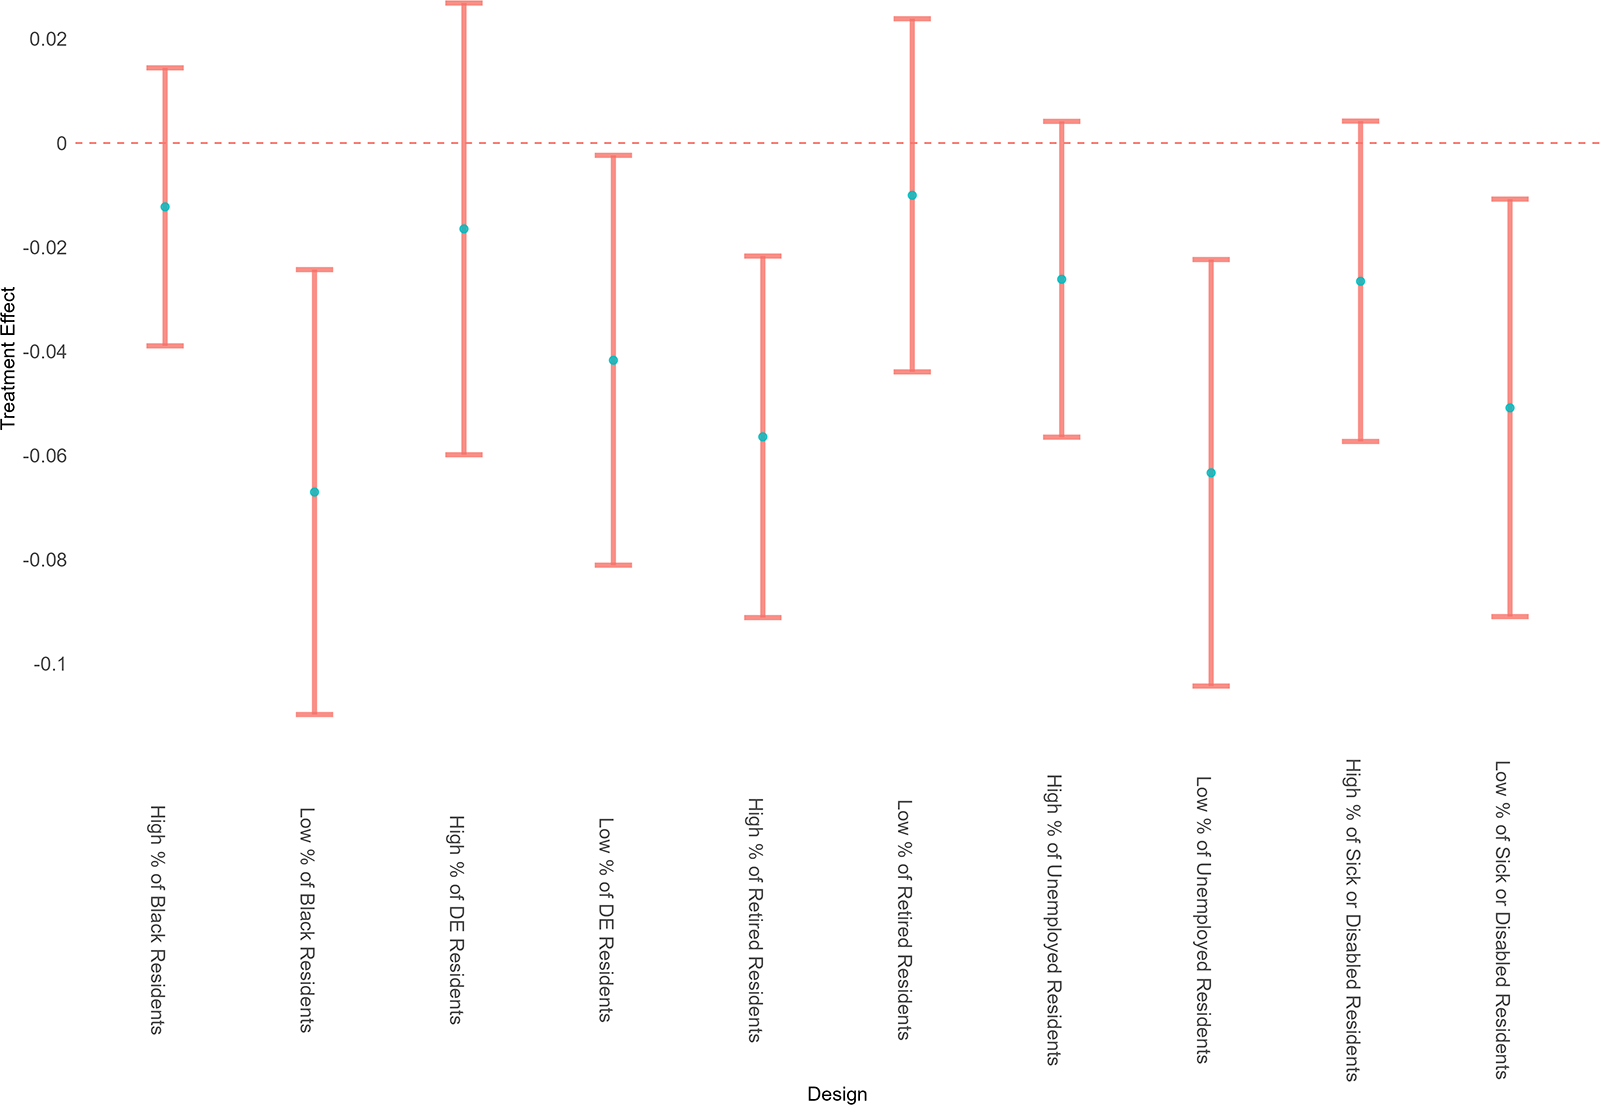
We know from the US literature that voter ID laws tend not to be general, but precise, in their effect (Hajnal et al., Reference Hajnal, Lajevardi and Nielson2017; Barreto et al., Reference Barreto, Nuño, Sanchez and Walker2019; Kuk et al., Reference Kuk, Hajnal and Lajevardi2020). Therefore, I test a series of local average treatment effects. To do this, I execute the same IFE model with parametric bootstrapped confidence intervals,Footnote 18 but only including wards in the bottom 25th percentile and top 25th percentile of a particular population characteristic. I focus on the proportion of black, DE sociodemographic group, retired, unemployed and sick or disabled residents. As is shown in by Figure 7, perhaps counterintuitively, there are statistically significant negative effects for wards which have lower proportions black, DE, unemployed and sick or disabled residents. It may be expected wards with high proportions of such groups would be most impacted. However, I find the opposite, which could be down to the context of the elections I am analyzing. Given I am looking at second-order elections, these LATE estimates are likely showing that this more restrictive voter ID pilot tended to impact groups who are more prone to voting and no effect is measured for groups who are less likely to vote as their baseline turnout at local elections is significantly lower. This being said one result that may support either the resentment or preparation costs hypothesis is the LATE model wards with a high proportion of retired residents. This model indicates that treated wards that had a higher proportion of retired residents experienced a statistically significant treatment effect. Data from the Cabinet Office (Hewitt, Reference Hewitt2021) show that passport and photo driving license ownership (the two most popular forms used in Bromley) is lower in older communities. Therefore, if older residents experienced a greater preparation cost, as they were less likely to own certain ID, they would be less likely to vote. Alternatively, given older residents who have always voted, have never had to show ID to vote may resent that they had to this time around. Testing of these mechanisms is not possible within the scope of this article but should be the goal of future research.
Local average treatment effect estimates for ward-level data filtered by wards with high (top 25th percentile) and low proportions (bottom 25th percentile) of black, DE sociodemographic group, retired, unemployed and sick or disabled residents. Error bars are 95% placebo CIs.

7. Conclusion
This article examined the effects of a voter ID pilot scheme, implemented in the 2018 local elections by the London Borough of Bromley. The key question was whether the introduction of the pilot scheme reduced turnout at all. Using ward-level turnout data from 2002 to 2018, I find that the pilot scheme did significantly reduce turnout in Bromley, compared to a synthetic counterfactual. The effect estimated implies that of the 240,249 people registered to vote in 2018 in Bromley, 10,571 (using the 4.4% point figure) did not vote who would have otherwise done.Footnote 19 The number of people turned away and not then returning estimated by the Electoral Commission in Bromley was 154. This large difference between the two figures implies that voter ID laws reduce turnout by deterring people who lack ID rather than catching the unaware. The number of voters not voting that I estimate could have conceivably made a difference to the outcome of who was elected in some wards if the difference was unequal across parts of the population. As shown in the LATE models, this effect is unlikely to uniform across all socio-demographic groups. However, it is important not prescribe any causal effect here as this data looks at the aggregate ward-level rather than the individual level.
The results of this study offer several distinct contributions to the fields of politics and elections. First, I give the first estimate of the effect of voter ID pilot schemes in the UK that does not rely on data where potential voters showing up to a polling station and then being turned away, which may have been inconsistently collected. Providing a more causal narrative will allow future research and public discourse to have a more complete understanding of how voter ID laws function within the UK. This article also lays important groundwork for future research on more restrictive voter ID laws which have been introduced by the Election Act 2022.
Second, I apply a novel methodology to the field of elections and political science more generally. Previously, political science has heavily engaged with DID approaches and has recently engaged in SC approaches (Boris et al., Reference Boris, Peterson and Jenkins2017; Yiqing, Reference Yiqing2017a; Timoneda and Wibbels, Reference Timoneda and Wibbels2022). The combination of these two methods in the form of the SDID approach has been limited to economics but has clear applications to turnout. This is because turnout is easily observed and over time political scientists have understood the idiosyncratic factors which shape turnout, and which complicate DID analyses. Yet, challenges surrounding clustered treatment assignment cannot yet be captured by this method. Therefore, future work should seek to refine the SDID method so that it can be applied to clustered data, which is common in political science.
Third, this article speaks to wider debates about electoral laws around the world and how they can shape electoral outcomes. Changes to voter ID laws outside of the USA have, previously, been rare but now begun to grow in popularity. Within the last 20 years, as technology has advanced, innovations have been made in electoral administration, which has included changes to voter ID laws. This has included the piloting of requirements in Australia (Orr and Arklay, Reference Orr and Arklay2016), Canada implementing voter ID with a vouching system (Canada Elections Act, 2000), since 2007, or the use of biometrics in Brazil, which has been rolled out since 2008 (Barton, Reference Barton2022; Superior Electoral Court, 2024). These examples indicate that, like in the USA, voter ID laws are not static, and governments do make fundamental changes to how people access the ballot box. The pilot scheme used in Bromley in 2018 sits within the middle between the Canadian and Brazilian cases in terms of restrictiveness, thus indicates a general magnitude of expected effect size for when a law is changed from basic personal details to requiring a form of ID. A majority of countries do have photo ID laws in place (Barton, Reference Barton2022), therefore, by enchancing our knowledge of how similar law could effect turnout, as this article does, is important.
This being said gaps and caveats still remain, which should be addressed by future research. First, I rely on a relatively narrow geographic area and second order elections so precise extrapolations to effects in national first-order elections may not be valid. Future research should seek to test this and test if effects may vary between geographic areas and individuals. Second, the data used only contained one posttreatment time period. This means this article cannot speak to the long-term effects of voter ID laws. It could be the case that after a certain period, once voters have acquired knowledge of voter ID laws from multiple elections, the negative effect on turnout weakens. Whether these changes in turnout have a partisan impact and, therefore, can shape the outcome of an election in a meaningful way is a question for future research.
Supplementary material
To view supplementary material for this article, https://doi.org/10.1017/psrm.2025.7. To obtain replication material for this article, please visit https://doi.org/10.7910/DVN/KULZYU.
Acknowledgments
I would like to thank Profs. Chris Hanretty and Oliver Heath for providing feedback on drafts on this paper. I would also like to thank those who gave feedback at the 2023 EPOP conference. Lastly, thanks goes to the two anonymous reviewers and Editor of the journal for constructive comments in the review process.


 Open access