


Introduction
Gambling disorder is a significant public health problem affecting 0.4% to 1% of the US population and is also prevalent in many other countries.Reference Petry, Stinson and Grant1 Understanding the chain of progression from recreational gambling to gambling disorder is vital toward understanding the underlying biological mechanisms (pathogenesis). Comparing people with gambling disorder with those at an increased risk of developing gambling disorder would help to elucidate whether neurobiological aspects of gambling disorder are evident prior to the development of overt pathology or stem from the disorder itself, perhaps even reflecting the harmful effects of recurrent gambling on brain function.
Gambling disorder can be conceptualized from a neurobiological perspective in terms of an excessive drive from the subcortical regions involved in reward processing, coupled with diminished top-down control from the prefrontal cortical regions.Reference Limbrick-Oldfield, van Holst and Clark2, Reference Goudriaan, Yücel and van Holst3 Consistent with this perspective, people with gambling disorder often exhibit impairments across a spread of cognitive domains including inhibitory control, working memory, and decision-making.Reference Goudriaan, Yücel and van Holst3–Reference Odlaug, Chamberlain, Kim, Schreiber and Grant6 Extensive translational data implicate subcortical structures in these abilities.Reference Eagle, Wong, Allan, Mar, Theobald and Robbins7
Functional neuroimaging (fMRI) studies involving healthy volunteers have demonstrated that the striatum and pallidum respond to reward, in particular, through dopaminergic signaling, and encode reward expectancy (anticipation of reward).Reference Preuschoff, Bossaerts and Quartz8 Such subcortical structures are also central to contemporary computational models of decision-making, which, in turn, stem from human (and translational) data.Reference Hauser, Eldar and Dolan9, Reference Elliott, Friston and Dolan10 Gambling disorder is conceptualized as a Substance-Related and Addictive Disorder in DSM-5, and abnormalities of decision-making are central to understanding its symptomatology (eg, loss of control, craving, escalation of reward-seeking over time, and neglect of other areas of life). Reward-related increases in striatal dopamine release have been found in gambling disorder,Reference Linnet, Peterson, Doudet, Gjedde and Møller11 along with a positive correlation between such dopamine release and symptom severity.Reference Joutsa, Johansson and Niemelä12 Functional imaging has also indicated that gambling disorder is typically associated with blunted mesolimbic-prefrontal cortex responses to general rewards but heightened activation to gambling-related stimuli.Reference van Holst, van den Brink, Veltman and Goudriaan13 An fMRI study of gambling disordered adults (n = 10) using a monetary reward task demonstrated that gamblers, as compared with controls, exhibited decreased neural activity in the pallidum for decision-making under risk, as opposed to decision under ambiguity, and increased neural activity within the putamen prior to bet choices, as opposed to safe choices.Reference Brevers, Bechara and Hermoye14 A subset of patients with Parkinson’s disease develops impulsive symptoms, including gambling disorder, due to pro-dopaminergic therapy.Reference Voon, Fernagut and Wickens15 In functional imaging, such impulsive symptoms in Parkinson’s disease were associated with heightened connectivity from the ventral striatum to the putamen and pallidum.Reference Petersen, Van Wouwe and Stark16
Though striatal brain regions are demonstrably involved in decision-makingReference Preuschoff, Bossaerts and Quartz8 and functional imaging data have identified altered responses to reward in such regions in gambling disorder,Reference van Holst, van den Brink, Veltman and Goudriaan13 direct quantification of structural changes in these regions in patients is lacking. One voxel-based morphology (VBM) investigation found that gambling disorder was associated with increased gray matter volumes in the ventral striatum.Reference Koehler, Hasselmann, Wüstenberg, Heinz and Romanczuk-Seiferth17, Reference Mohammadi, Hammer and Miedl18 Another VBM study examining 30 male never-treated gambling patients and 30 controls showed increased absolute global gray matter volumes in gamblers relative to controls, as well as relatively decreased volumes in the left putamen.Reference Fuentes, Rzezak and Pereira19
Subcortical structures are difficult to visualize structurally accurately with conventional pipelines because of poor, heterogeneous signal intensities.Reference Patenaude, Smith, Kennedy and Jenkinson20 Typical imaging analysis pipelines were designed for analysis of the cortex rather than the subcortical regions.Reference Dale, Fischl and Sereno21, Reference Fischl, Sereno and Dale22 Neuroimaging pipelines are now available that enable the sensitive measurement of localized differences in deformations of subcortical structure shapes across groups. This latter approach of examining localized abnormalities in subcortical brain structure (ie, quantification of local curvature) has the advantage of not relying on arbitrary smoothing extent or tissue classification.Reference Patenaude, Smith, Kennedy and Jenkinson20 This innovative modeling approach has been shown to be sensitive to pathologies in other contexts, such as in Alzheimer’s Disease.Reference Patenaude, Smith, Kennedy and Jenkinson20
Therefore, the current study aimed to examine whether localized morphometric differences of the striatum (caudate, putamen, accumbens, and pallidum) exist in people with gambling disorder symptoms, compared with recreational non-pathologic gambler controls (ie, those with no gambling disorder symptoms). We hypothesized, based on the abovementioned literature, that these regions would show abnormal morphology in those with symptoms, which, in turn, would correlate with the extent of symptoms and impulsivity more broadly.
Method
Subjects
Participants were recruited using media advertisements for anyone who had gambled within the past year. Inclusion criteria were: age 18–29 years (this was set to limit the confounding effects of age), right-handedness, no use of psychotropic medications in the past 6 weeks, and no contraindication to MRI. Participants with current mental disorders (apart from gambling disorder in the gambling disorder group) including any other impulse control disorder or a lifetime history of psychotic disorder, bipolar disorder, or substance use disorder were excluded. Healthy controls were recruited using media advertisements based on no lifetime or current psychiatric disorders.
The study procedures were carried out in accordance with the ethical standards laid out in the Declaration of Helsinki. The University of Chicago Institutional Review Board approved the study and consent procedures. After providing a complete description of the study to the subjects, written informed consent was obtained.
Assessments
Demographic variables including age and gender were recorded for all participants. Subjects underwent a psychiatric evaluation, which included the Structured Clinical Interview for Pathological Gambling (SCI-PG)Reference Grant, Steinberg, Kim, Rounsaville and Potenza23 adapted for DSM-5.24 A score of 0 on the SCI-PG designated controls, a score of 1–3 defined a participant as being an at-risk gambler, and a score of 4 or greater was consistent with meeting criteria for gambling disorder.
Clinical measures included: Mini International Neuropsychiatric Inventory (MINI),Reference Sheehan, Lecrubier and Sheehan25 the Eysenck Impulsivity Questionnaire (EIQ),Reference Eysenck and Eysenck26 and the National Adult Reading Test.Reference Nelson27
After completing these assessments, participants undertook high-resolution structural imaging using a 3-Tesla (3T) scanner with magnetization-prepared rapid gradient echo (3D-MPRAGE) sequences. Axial 3-dimensional T1-weighted scans were acquired using the following parameters: repetition time = 2000 ms, echo time = 3.0 ms, flip angle = 9 degrees, field of view = 256 × 256, and resolution = 1 × 1 × 1 mm).
Statistical analysis, including neuroimaging processing steps
Group differences in demographic and clinical measures were explored using independent sample t tests and chi-square tests (P < 0.05, uncorrected) in SPSS v24.0.
Image preprocessing and data extraction were undertaken using the University of Chicago Midway computing system. We employed the same methodology as with a previous publication by our group.Reference Isobe, Redden and Keuthen28 T1-weighted images were automatically bias-field corrected and nonlinearly registered to the MNI 152 standard space. We employed the Integrated Registration and Segmentation Tool (FIRST) of FMRIB implemented in FSL 5.0.9 to automatically segment subcortical structures.Reference Patenaude, Smith, Kennedy and Jenkinson20 Segmentation was based on shape models with structural boundaries obtained from 336 manually segmented images and resulted in a deformable surface mesh of each subcortical structure consisting of vertices. The meshes were reconstructed and filled in the MNI space, and boundary correction was applied. Then, the segmented images were transformed into the original space. All segmented images were visually checked for errors in registration and segmentation.
A region of interest approach was used for the neuroimaging analyses. Based on literature pertaining to models of decision-making, findings in gambling disorder, and findings in impulse control disorders in Parkinson’s disease (outlined in the introduction), we specifically focused on the striatum, defined as the putamen, caudate, accumbens, and pallidum. We calculated the total intracranial volume (ICV) as the sum of the volumes of gray matter, white matter, and cerebrospinal fluid (CSF) using the Automated Segmentation Tool (FAST) of FMRIB.Reference Zhang, Brady and Smith29 Each subject’s brain scan was skull-stripped using the Brain Extraction Tool and linearly aligned to the MNI152 space, and the inverse of the determinant of the affine transformation matrix computed by the software was multiplied by the ICV size of the template. We adjusted the subcortical volumes by the intracranial volumes (ICV) of each individual.Reference Buckner, Head and Parker30
Subcortical volumes were compared between those with gambling disorder symptoms (GD + AR) and controls (HC) using t tests. Values were reported uncorrected for multiple comparisons but were only deemed statistically significant if they withstood a Bonferroni correction for the number of comparisons undertaken.
For the morphometric analysis, a vertex analysis implemented in FIRST (FSL) was employed to compare the shapes of the subcortical structures.Reference Patenaude, Smith, Kennedy and Jenkinson20 A negative value of the vertex represented deformation in an inward direction, and a positive value of a vertex indicated deformation in an outward direction. Curvature abnormalities were identified between those with gambling disorder symptoms (GD + AR) and controls (HC) using “Randomise,” a permutation-based non-parametric testing method implemented in FSL with 5000 iterations that corrects for multiple comparisons and uses Threshold-Free Cluster Enhancement (TFCE) as recommended.Reference Hill, Bolo and Sarvode Mothi31–Reference Winkler, Ridgway, Webster, Smith and Nichols33 We used a 2-group comparison because the primary interest was in determining abnormalities in those with gambling disorder symptoms collectively compared with controls. If significant regions of morphometric abnormalities were found, correlations were explored with the clinical measures (Eysenck scores and SCIGD scores) using Spearman’s rho, with significance set at a P of <0.05. Correlations were reported uncorrected but were only deemed significant if they withstood a Bonferroni correction for the number of correlation analyses undertaken.
Results
Of the 54 participants, 18 had a gambling disorder, 14 met criteria for being at-risk gamblers, and 22 were controls. None of the participants had ever sought treatment for gambling behavior. Although the participants had no current mental health issues other than gambling disorder, 2 were former smokers (only occasionally), and 3 reported histories of anxiety problems; however, none met the criteria for a previous anxiety disorder.
The demographic and clinical features of the participants with GD, AR, and HC are presented in Table 1, in which it can be seen that there were no differences in age, gender, or IQ. Regarding gambling behavior, the majority of both gambling groups reported casino gambling as their primary form of gambling, with slots and blackjack as their preferred games (15 [83.3%] of the gambling disordered participants and 12 [85.7%] of the at-risk). Gambling disorder symptoms were associated with significantly higher impulsiveness on the Eysenck Impulsiveness measure, as compared with the controls.
Demographic and clinical comparison of3 levels of gambling behavior
AR, at-risk gamblers; EIQ, Eysenck Impulsivity Questionnaire; GD, gambling disorder; HC, healthy controls; NART, National Adult Reading Test; SCI-PG, Structured Clinical Interview for Pathological Gambling; SD, standard deviation.
a P < 0.05 post hoc analysis between HC and GD.
b P < 0.05 post hoc analysis between HC and AR.
Group differences in subcortical volumes and morphology
Table 2 provides group volumetric differences. There were no significant group differences in volumes in the regions of interest.
Volumetric analysis
AR, at-risk gamblers; GD, gambling disorder; GMV, gray matter volume; HC, healthy controls; ICV, intracranial volume; Lt, left; NAcc, nucleus accumbens; Rt, right; WMV, white matter volume.
There were no significant group differences with the Bonferroni correction.
Values in brackets are standard deviations.
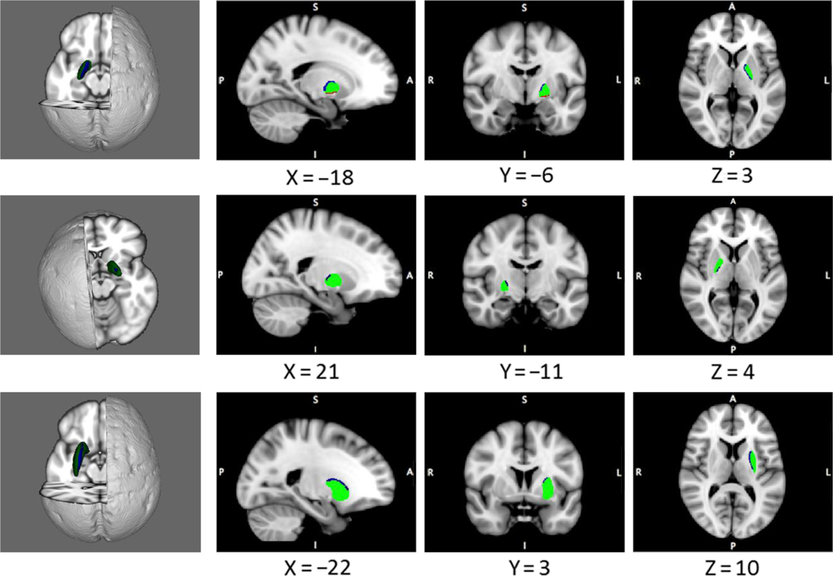
Several significant morphometric abnormalities were associated with a subsyndromal and clinical gambling disorder, as compared with controls. Specifically, localized morphometric abnormalities were found in the bilateral pallidum and left putamen (Figure 1; FDR P < 0.05). In post hoc t tests using extracted cluster means, at-risk gamblers did not differ significantly from participants with gambling disorder regarding curvature in the identified abnormal significant clusters (all P > 0.10).
Morphological abnormalities in disordered gamblers, as compared with controls. Blue indicates a significant excess in the inward curvature, and red indicates a significant excess in the outward curvature in the gambling disorder symptom group versus controls (permuted P < 0.05, corrected). Top row, left pallidum; middle row, right pallidum; and bottom row, left putamen.
The relationship between morphology and clinical measures
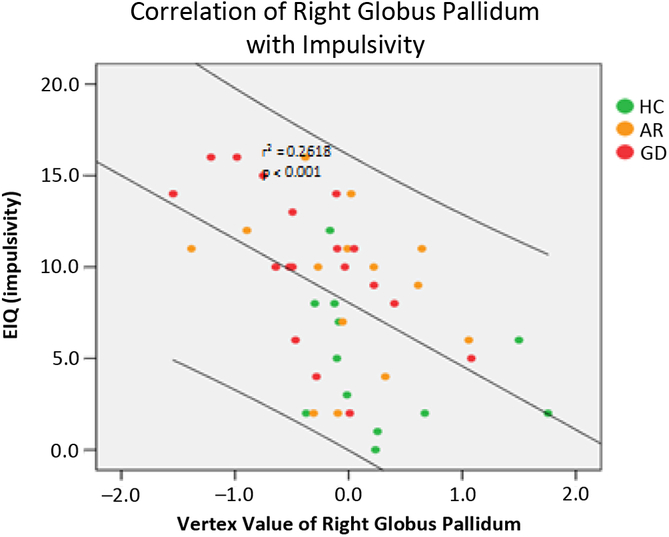
In terms of clinical correlates, the morphological shape of the right pallidum demonstrated a significant correlation with the impulsivity subscale score of the EIQ across all participants pooled; this was because of a significant correlation in those with gambling disorder symptoms, but not in the healthy controls (see Figure 2). No significant correlation was found in the severity of gambling symptoms.
Correlation between the mean curvature (vertex value) of the right pallidum in a cluster for group difference and impulsivity on the Eysenck Impulsivity Questionnaire (EIQ). The correlation was significant with all subjects pooled and in the combined GD + AR group (r = 0.45, P < 0.001), but not in the controls (r = 0.03, P > 0.3).
Discussion
This study investigated subcortical morphology in individuals with gambling disorder symptoms, as compared with controls who gamble but had no pathologic symptoms. This approach stemmed from our goal to evaluate morphological abnormalities in the subcortical structures common to those with any degree of gambling disorder symptoms versus those with none, as such differences may inform the understanding of vulnerability markers and differences in brain development predisposing persons to these and other impulsive psychiatric problems. Partly consistent with our a priori hypothesis, we identified morphologic abnormalities in the pallidum and putamen in those with gambling disorder symptoms. The morphological abnormalities in the right pallidum correlated highly significantly with impulsivity scores on the EIQ across all study participants. Contrary to expectation, morphology in these structures did not correlate significantly with symptom severity in those with gambling disorder symptoms. We conclude that abnormalities in the striatal morphology, specifically involving the pallidum, are associated with trait impulsivity and thus may predispose persons to gambling disorder and potentially other impulsive symptomatologies.
The striatum encodes reward through dopaminergic signaling,Reference Preuschoff, Bossaerts and Quartz8 and aberrant functional connectivity between such structures has been found in impulse control problems in Parkinson’s disease, perhaps arising from pro-dopaminergic therapy.Reference Petersen, Van Wouwe and Stark16 The current data not only enhance existing neurobiological models of gambling disorderReference van Holst, van den Brink, Veltman and Goudriaan13 but also extend beyond these models by suggesting that pallidum abnormalities, in particular, may be a vulnerability marker associated more broadly with impulsive tendencies (measured here using the Eysenck questionnaire), rather than necessarily only to disordered gambling per se. Neural responses in the pallidum have been shown to be specific to high reward levels occurring in the context of increasing reward.Reference Elliott, Friston and Dolan10 Thus, the pallidum may play a key role in the pathophysiology of gambling disorder, and this may offer some explanation for what we see clinically in problem gamblers, that is, the inability to control the behavior despite the negative consequences.Reference Black, Shaw, McCormick and Allen34, Reference Grant and Kim35 Our results suggest that pallidum curvature abnormalities are more related to the extent of trait impulsivity rather than gambling disorder symptoms in particular. In preclinical work, a subset of pallidum neurons has been found to respond selectively in situations requiring the sudden cancellation of impulsive actions.Reference Mallet, Schmidt and Leventhal36 Therefore, we suggest that morphological abnormalities (versus controls) in the pallidum might contribute to (or correlate with) impulsive traits, which, in turn, may predispose toward a range of problematic behaviors including disordered gambling.
These findings are interesting if also placed in the context of imaging results in the field of substance addiction that are pertinent given that gambling disorder is now regarded as a Substance-Related and Addictive Disorder in DSM-5. For example, bilateral gross symmetric lesions in the pallidum have been associated with heroin intoxication,Reference Strassmann, Sturner and Helpern37 and lesions in the pallidum have been found in 5–10% of heroin-addicted individuals postmortem.Reference Andersen and Skullerud38 More recently, widespread gray matter reductions in the pallidum (in addition to other areas) have been found in adults undergoing methadone maintenance treatment for opioid use disorder.Reference Tolomeo, Gray, Matthews, Steele and Baldacchino39
This study had several positive features, notably that it is the first imaging study of the subcortical structures in adults with varying levels of gambling severity, and entailed examination of not only the volumes but also the shapes (localized curvature) of the implicated structures. Of course, we examined only localized morphometric differences in the striatum, and, therefore, whole brain analyses may have resulted in additional findings. We focused on the striatum for several reasons including a relative lack of data on this region in gambling disorder; its likely involvement in reward and habit learning; and the relatively recent development of suitable analysis pipelines for interrogating these relatively small, hard-to-visualize structures. We also focused on these regions to reduce multiple comparisons that are hard to mitigate with relatively small sample sizes. The subjects were free from current psychiatric comorbidities and psychotropic medications. Several limitations, however, should be considered. The sample size may have limited the statistical power to detect more subtle differences between the groups (ie, group differences with small effect sizes). Larger samples in future studies would also help to rule out false positives. In addition, the lack of correlation between curvature abnormalities and gambling disorder severity could reflect the smaller sample size for this correlational analysis, as compared with the correlational analysis for impulsiveness, which was measurable along a continuum across all participants. We selected subjects who were not taking psychotropic medications and who were free from comorbid psychiatric conditions including nicotine dependence and substance use. It, therefore, remains to be seen whether the findings generalize to gambling disorder more widely, as the condition is often comorbid with other disorders.
In summary, the current study identified morphologic abnormalities of the pallidum and putamen in people with gambling disorder symptoms (at-risk gambling and gambling disorder), as compared with recreational gamblers without any pathologic symptoms. The right pallidum abnormality bore a particularly strong relationship with trait impulsiveness on the EIQ, rather than with gambling disorder severity. We suggest that pallidum morphology and associated impulsivity might predispose persons to a range of problematic repetitive behaviors including gambling and that these differences observed in people with gambling disorder symptoms may reflect abnormalities of longitudinal brain development related to impulsivity.
Disclosures
This research was supported by a Center of Excellence in Gambling Research grant from the National Center for Responsible Gaming and a Wellcome Trust Clinical Fellowship (110049/Z/15/Z). Samuel Chamberlain consults for Cambridge Cognition, Shire, and Promentis. There are no competing financial interests in relation to this work. Jon Grant has received research grants from the American Foundation for Suicide Prevention, TLC Foundation, and Takeda Pharmaceuticals. Jon Grant receives yearly compensation from Springer Publishing for acting as Editor-in-Chief of the Journal of Gambling Studies and has received royalties from Oxford University Press; American Psychiatric Publishing, Inc; Norton Press; and McGraw Hill. Masanori Isobe has nothing to disclose.


 Open access