

INTRODUCTION
Following a vast increase over the past two decades in the number of studies focused on marine protected areas (MPAs) (Willis et al. Reference Willis, Millar and Babcock2003b ; Edgar Reference Edgar2011), conservation managers could expect reasonable scientific guidelines for predicting ecological changes that follow declaration of new no-take MPAs in local jurisdictions. Nevertheless, the great variety of interacting factors that can potentially affect outcomes of MPA establishment, including MPA size (Vandeperre et al. Reference Vandeperre, Higgins, Sánchez-Meca, Maynou, Goñi, Martín-Sosa, Pérez-Ruzafa, Afonso, Bertocci, Crec'hriou, D'Anna, Dimech, Dorta, Esparza, Falcón, Forcada, Guala, Direach, Marcos, Ojeda-Martínez, Pipitone, Schembri, Stelzenmüller, Stobart and Santos2011), source-sink dynamics (Lipcius et al. Reference Lipcius, Stockhausen and Eggleston2001), time (Babcock et al. Reference Babcock, Shears, Alcala, Barrett, Edgar, Lafferty, McClanahan and Russ2010), fishing pressure (Côté et al. Reference Côté, Mosqueira and Reynolds2001), habitat type (Claudet et al. Reference Claudet, García-Charton and Lenfant2011) and compliance (Little et al. Reference Little, Smith, McDonald, Punt, Mapstone, Pantus and Davies2005), have so far precluded development of an accurate predictive framework. By necessity, the complexity of interactions between species and socioeconomic and physical factors has been largely ignored in modelling studies, which typically group species within arbitrarily-defined functional groups or focus on one species and ignore interspecific interactions. Community-level field studies to date have also been limited to investigation of the influences of no more than two influential environmental or socioeconomic factors in any single study.
The synthesis of the large body of published research through meta-analysis arguably provides the best path for understanding and predicting ecological responses to MPA declaration. This approach does, however, require caution, given the large differences in scope, aims and quality of published work, and biases introduced through reliance on data that have passed through the publication filter. In particular, studies generating inconclusive results are unlikely to be published, while emphasis within published studies is typically placed on species and locations showing strongest effects (Tomkins & Kotiaho Reference Tomkins and Kotiaho2004). Moreover, global analyses to date have yet to consider factors other than time, MPA size, sexual strategy and whether focal species are fished or unfished (Mosquera et al. Reference Mosquera, Côté, Jennings and Reynolds2000; Côté et al. Reference Côté, Mosqueira and Reynolds2001; Halpern & Warner Reference Halpern and Warner2002; Halpern Reference Halpern2003; Molloy et al. Reference Molloy, Reynolds, Gage, Mosqueira and Côté2008; Molloy et al. Reference Molloy, McLean and Côté2009), although a meta-analysis of Mediterranean studies has progressed further by considering interspecific variability in responses, including variation in life-history traits (Claudet et al. Reference Claudet, Osenberg, Domenici, Badalamenti, Milazzo, Falcón, Bertocci, Benedetti-Cecchi, García-Charton, Goni, Borg, Forcada, Lucia, Pérez-Ruzafa, Afonso, Brito, Guala, Diréach, Sanchez-Jerez, Somerfield and Planes2010).
In the present study, we compare outcomes of meta-analyses with observed changes in species’ densities over the first three years following prohibitions on fishing in five temperate Australian MPAs. Based on meta-analysis conclusions, many fished species were predicted to exhibit strong positive population responses, and a mixture of negative and neutral responses seen amongst non-fished species, depending on whether the species represents prey for predators with increasing population numbers or not.
We apply an ecological survey design that corresponds with the ideal set of attributes proposed by Willis et al. (Reference Willis, Millar and Babcock2003b ) for studying MPA-related effects. This is the first published study that includes: (1) systematically-collected data for a large range of fish and invertebrate species, (2) multiple MPAs distributed over a continental scale, (3) multiple sites nested within each MPA, (4) sites distributed inside and outside no-take sanctuary zones, and (5) sites surveyed before and after enforcement of MPA regulations over a multi-year time span.
METHODS
Sampling design
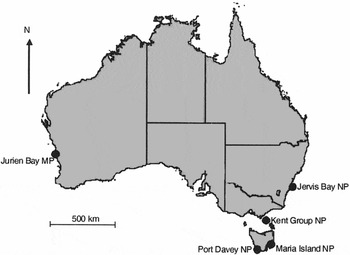
Five MPAs distributed around the southern half of the Australian continent were investigated (Fig. 1, Table 1): (1) the Jurien Bay Marine Park, (2) the Jervis Bay Marine Park, (3) the Kent Group National Park, (4) Maria Island National Park and (5) Port Davey National Park. Three of these MPAs are multi-zoned (Table 1), with multiple no-take sanctuary zones interspersed with general use zones and restricted fishing zones.
Marine protected areas studied around the Australian coast.
Characteristics of MPAs investigated, including coastal length of sanctuary zones (SZs) within MPAs, number of SZs investigated in multi-zoned MPAs, number of sites surveyed, and years of surveys.

The Jurien Bay Marine Park was declared in August 2003 along a c. 80 km section of the Western Australian coast to a distance of c. 10 km offshore (Department of Conservation and Land Management 2005; Edgar et al. Reference Edgar, Barrett, Crane and Bancroft2007). Six categories of management zone afford different levels of protection to biota; the most highly protected zones comprise ten no-take sanctuary zones (SZs; 3.7% of total area), while 77% of the MPA is zoned for general use. Both commercial and recreational fishing are allowed in general use zones, so sites in this zone are considered fished. Additional sites surveyed in ‘Scientific Reference Zones’, where rock lobster capture is allowed but most forms of fishing prohibited, were not considered in the current analysis. Restrictions on fishing were gazetted two years after MPA declaration, in December 2005.
Like all New South Wales marine parks, the Jervis Bay Marine Park is also zoned for multiple use with approximately 19% of the Park's total area of c. 210 km2 closed to all forms of fishing within 14 SZs (Barrett et al. Reference Barrett, Edgar and Morton2002; Lynch Reference Lynch2006; Marine Parks Authority 2008). The majority of the MPA comprises habitat protection zones (72% of total), in which recreational fishing, including spearfishing, and commercial fishing other than trawling and longlining is allowed. Although the boundaries of the Jervis Bay Marine Park were declared in 1998, the zoning plan commenced and restrictions on fishing were introduced four years later in October 2002.
The Maria Island MPA on the Tasmanian east coast is a regional conservation reserve, protecting 7 km of moderately-exposed coastline from all forms of fishing. This MPA was declared in September 1991, but with no effective control until about 12 months later, when boundaries were signposted and regulations first enforced (Edgar & Barrett Reference Edgar and Barrett1999).
The Kent Group and Port Davey MPAs were both declared in 2003, each covering an area of c. 120 km2, and with c. 50% of the total area of each MPA comprising no-take SZs and the remainder restricted fishing zones. Marine species in SZs were first protected from fishing when regulations were gazetted in January 2005 (Resource Planning & Development Commission 2003; Edgar et al. Reference Edgar, Last, Barrett, Gowlett-Holmes, Driessen and Mooney2010).
Surveys were distributed using a replicated before-after control-impact (BACI) design, with surveys before and after prohibitions on fishing made within SZ and fishing zone (FZ) treatments, and with multiple sites examined within each treatment. Because the focus of the study was on responses of individual fish and invertebrate species, with different dominant species in each of the five MPAs, an integrated continental-scale analysis was not possible, rather analyses for each MPA were undertaken separately. For each of the five MPAs, reefs at 6–14 sites were surveyed in SZs and a similar number of additional sites were surveyed in nearby FZs, the latter providing reference areas for regional changes through time.
Selection of sites was primarily based on size of MPA, with more sites in larger multi-zoned MPAs, and the distribution of locations with sufficient reef area (200 m span) within the 3–10 m depth zone. Sites were separated by c. 2 km distance wherever possible, with at least two sites within each SZ investigated in the multi-zoned MPAs. Sites in FZs were selected: (1) to be in close proximity to studied SZs, (2) with separation of at least 2 km from each other, (3) with close match to environmental conditions at surveyed SZ sites, and (4) to surround SZs studied.
Densities of fishes and invertebrates were initially censused at sites in the year prior to policing of SZ fishing restrictions, and the same sites were resurveyed after 3–4 years of enforcement (Table 1), with transects laid as close as possible to the original position using GPS position, direction originally set and depth. Baseline data for Jervis Bay were obtained in 2001 rather than 2002 because of partial protection in 2002, a year when zones were signposted but regulations were not legally enforceable.
Survey methods
Densities of fishes and invertebrates were quantified using underwater visual transect methods (Brock Reference Brock1954). At each site, a 200 m long transect line was laid along a defined depth contour in 2–10 m water depth, in most cases along the 5 m depth contour (Edgar & Barrett Reference Edgar and Barrett1999). The transect line was subdivided into four 50 m long transect blocks, but data analysed here were aggregated as mean density per site, hence site was considered the unit of replication.
All fishes and cephalopods observed by divers were counted during slow swims above the algal canopy along the centre of a 5 m wide swathe up one side and then down the other side of the 200 m line (Edgar & Barrett Reference Edgar and Barrett1999). For invertebrate censuses, divers thoroughly searched the seabed for a distance of 1 m on one side of the transect line, investigating all visible crevices and overhangs but not overturning boulders. Macroalgae were swept away from the transect to obtain a clear view of the substratum. Large (>25 mm length) mobile gastropods, crustaceans and echinoderms (other than ophiuroids) were counted, including crabs, lobsters, whelks, tritons, abalone, asteroids, echinoids, crinoids and holothurians. Sessile invertebrates and small cryptic invertebrates (most notably annelids, chitons, shrimps and ophiuroids) were not counted.
Statistical analyses
Consistent with recommendations of many statistically-minded ecologists (for example Gerrodette Reference Gerrodette2011), our analyses focused primarily on recurrent patterns in variation of means, and associated standard errors, rather than on outcomes of significance tests. Nevertheless, while recognizing that the null hypothesis that no difference exists between sets of sites or times is ecologically trivial (such differences inevitably exist in reality), we followed the traditional approach to BACI studies by identifying statistically-significant changes in animal densities associated with MPA ‘zone’, ‘year’ and ‘zone × year’ interaction. The interaction term is of greatest importance in analytical outcomes, given that it indicates whether species are responding to protection in SZs relative to region-wide changes at FZs. More importantly than its use for significance tests, we used an ANOVA-type design here to partition variation in survey data amongst the spatial and temporal scales studied.
We evaluated variation in data using univariate PERMANOVA (Anderson et al. Reference Anderson, Gorley and Clarke2008), assessed similarity using Euclidean Distance, and permutated residuals under a reduced Type III (partial) PERMANOVA model. Analytical outputs (sum of squares, mean squares, F-values) were thus identical to those calculated using mixed-model ANOVA except for the p-values, which were calculated using permutation procedures (Anderson et al. Reference Anderson, Gorley and Clarke2008). A nested mixed-model design was applied with the categorical fixed factor ‘zone’ (two levels: SZ, FZ) crossed with the fixed factor ‘year’ (two levels: before protection, after protection), and with the random factor ‘site’ nested hierarchically below zone.
Changes through time in SZs and FZs were primarily assessed using the log-response ratio (ln RR), calculated as ln (Xa /Xb ), where Xa and Xb are mean densities of a species before and after protection. Following Molloy et al. (Reference Molloy, Reynolds, Gage, Mosqueira and Côté2008), we used natural logarithms for statistical efficacy and added 1 to all raw abundance values to allow calculation of ln RR for sites where species were not sighted during some surveys. Given that rare species show considerable stochastic variability in counts, we restricted our analyses of population change to common species, defined as those observed in > 50% of SZ sites within each MPA. Baseline surveys were not considered when defining common species in order to include any species with negligible occurrence in pre-protection surveys that became widely established at sites following protection from fishing.
Data were analysed using PERMANOVA with raw abundance counts to assess additive effects, abundance data transformed by ln (x+1) to assess multiplicative effects, and, for fishes, biomass (wet weight in g) transformed by ln (x+100). Components of variation were calculated for untransformed abundance data only, given that components have little logical meaning when log-transformed (Morrisey et al. Reference Morrisey, Underwood, Howitt and Stark1992).
We estimated fish biomass by combining abundance counts with size estimates using length-weight relationships provided for total length of each fish species (in some cases genus and family) in Fishbase (http://www.fishbase.org). Bias in divers’ perceptions of fish size underwater was additionally corrected using relationships presented in Edgar et al. (Reference Edgar, Barrett and Morton2004). Biomass values calculated here were used as estimates for relative comparisons rather than considered accurate absolute fish biomass estimates (Edgar et al. Reference Edgar, Barrett and Morton2004).
RESULTS
A total of 202 955 fishes belonging to 251 species, and 54 765 mobile invertebrates belonging to 87 species, were counted on transects during the study. The richest fish fauna was observed at Jervis Bay (total 140 species; mean of 32 species per 200 m long transect; 20 common species, defined as those observed at most of 22 sites surveyed), followed by Jurien Bay (104 species; 20 species per transect; 11 common species; 28 sites), the Kent Group (49 species; 20 species per transect; 11 common species; 16 sites), Maria Island (49 species; 9 species per transect; 11 common species; 12 sites) and Port Davey (33 species; 7 species per transect; 4 common species; 11 sites). Fish species considered common contributed 72% of total fish abundance.
The invertebrate fauna showed generally similar patterns of species richness to fishes, but with more species per transect at Maria Island than elsewhere: Jervis Bay (35 species; 10 species per transect; 4 common species), Jurien Bay (52 species; 12 species per transect; 6 common species), Maria Island (27 species; 14 species per transect; 7 common species), the Kent Group (28 species; 9 species per transect; 5 common species) and Port Davey (19 species; 6 species per transect; 4 common species). Common invertebrate species contributed 84% of total invertebrate abundance.
Common species showed a variety of population responses through time, with 18% of species declining to less than half numbers between years, 16% of species at least doubling in numbers, and 19% of species showing < 10% change (Fig. 2). The median change between years in absolute values was c. 50%.
Total number of fish and invertebrate species showing population changes of different magnitude. Population increases were calculated as (Xa /Xb –1) × 100, and population declines as (Xb /Xa –1) × 100, where Xa and Xb are mean densities of a species before and after protection.
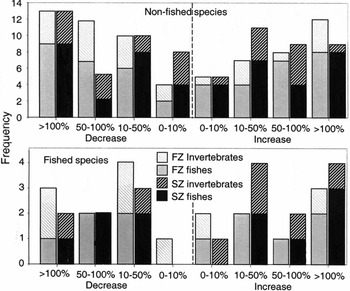
Amongst the common non-fished species investigated, the number of species showing declining trends between years was similar to the number showing increasing trends (Fig. 2). Similar consistency was evident for fished species in FZs; however, 11 fished species showed increasing trends in SZs compared to only six with decreasing trends, albeit this difference was not significant when assessed using binomial probability (p = 0.09). No clear differences were evident between patterns shown by fishes compared to invertebrates.
The various taxa of fishes (Fig. 3) and invertebrates (Fig. 4) showed considerable variation in log response ratios (Ln RR) for zone and year, where Ln RR depicts mean change in log densities of common species in SZs and FZs for different MPAs. Some species exhibited large population changes that were synchronous in SZs and FZs (for example Acanthaluteres vittiger at Maria Island), while others had stable population densities over the two survey periods (for example Pictilabrus laticlavius at Jervis Bay).
Log response ratios (Ln RR) depicting mean change (±SE) in density of common fish species before and after MPA gazettal in SZs and FZs associated with five MPAs.

Log response ratios (Ln RR) depicting mean change (±SE) in density of common invertebrate species before and after MPA gazettal in SZs and FZs associated with five MPAs.

The number of species with disproportionate changes in SZs relative to FZs was low. Only two fish species (Latridopsis forsteri at Maria Island and Cheilodactylus fuscus at Jervis Bay) and one invertebrate species (Dicathais orbita at Jurien Bay) generated significant (p < 0.05) outcomes in zone × year interaction tests using PERMANOVA (Tables 2 and 3).
Results of PERMANOVA where total variation in data for each fish species and MPA is partitioned as percentage attributable to the various components, with residual error based on site × year interaction. Negative components are equated to 0. #exploited species; *0.01 < p < 0.05, **0.001 < p < 0.01, ***p < 0.001.

Results of PERMANOVA where total variation in data for each invertebrate species and MPA is partitioned as percentage attributable to the various components, with residual error based on site × year interaction. Negative components are equated to 0. #exploited species; *0.01 < p < 0.05, **0.001 < p < 0.01, ***p < 0.001.

In contrast to only three significant zone × year interaction results, 43 of the 87 species/MPA combinations tested showed significant variation among sites, 17 varied significantly with year, and nine showed significant variation with zone (between the sets of SZ and FZ sites).
Analytical outcomes were generally consistent when data were log-transformed, with the exception that log abundance of the wrasse Ophthalmolepis lineolatus at Jervis Bay (p = 0.016) and the seastar Nectria ocellata at Maria Island (p = 0.009) also showed significant zone × year interactions, while the stingray Urolophus cruciatus was at the margins of significance (p = 0.060). The three species with significant interactive effects noted above for untransformed abundance also generated significant results for log abundance (p = 0.049, 0.028, and 0.002 for C. fuscus, L. forsteri, and D. orbita, respectively).
Population size structure for most species varied little with time or zone, consequently plots for abundance (Fig. 3) generally changed little in form when replotted for biomass. However, two additional species, the wrasse Ophthalmolepis lineolatus at Jervis Bay and the stingray Urolophus cruciatus at Maria Island, showed significant zone × year interaction effects (p = 0.026 for both species) when investigated using PERMANOVA with log biomass data. As with abundance data, Cheilodactylus fuscus at Jervis Bay and Latridopsis forsteri at Maria Island also showed significant interaction effects (p = 0.026 and p = 0.045, respectively).
The distribution of components of variation for untransformed count data varied greatly between species (Tables 2 and 3), with many species showing ‘site’ as the predominant influential factor, others showing ‘year’ as important, and a few indicating substantial variation with zone. Unexplained residual error was, however, large in most cases; extremely so for the common sweep Scorpis lineolata at Jervis Bay, which occurred episodically in large numbers at some sites but with no consistency in site location between years surveyed.
Regardless of the high spatial and temporal variability shown by different species, when we calculated mean responses for all common species for different MPAs, components of variation showed almost identical patterns (Fig. 5). On average, the major component of variation in all MPAs was residual error (site × year variation, c. 45% of total), followed by site (c. 35%), zone (c. 8%) and year (c. 8%). The magnitude of the zone × year interaction component was consistently half that shown by zone (c. 4%).
Mean (±SE) components of variation, as calculated by univariate PERMANOVA using a nested mixed model with Euclidean Distance, for common species observed at each MPA. Values are expressed as per cent of total variance for each species.

DISCUSSION
Short-term population responses of fishes and invertebrates following MPA declaration were unexpectedly few in the present study, with only three significant results for zone × year interaction generated from 87 tests using abundance data. Two of these results were consistent with predictions in terms of recovery of exploited fish species; however, a significant decline in populations of the whelk Dicathais orbita at Jurien Bay may represent a Type I error from the large number of tests undertaken. No whelk predator surveyed at Jurien Bay increased over the period studied, thus the possibility that whelks declined as a secondary consequence of increased predation pressure in SZs seems unlikely, but not impossible given that predatory species not surveyed here could be responsible.
The infrequent occurrence of species showing a zone effect could potentially be caused by low statistical power in tests; however, we discounted this possibility given that the survey design was more powerful than those applied in most other published field studies dealing with MPAs, with 1/20 degrees of freedom in interaction tests for all MPAs. Moreover, regardless of significance test outcomes, the number of common species in SZs showing increasing population trends was only marginally greater than the number showing decreasing trends (44 versus 43; Fig. 2), although it should be noted that these figures under-represent the true influence of SZs given that a majority (39 increasing versus 48 declining) of populations in FZs declined through the period studied.
In contrast to our weak observed zone effects, conclusions of published meta-analyses indicate that many exploited species should have shown substantial increases in population numbers within SZs, while population declines of some prey species were also possible because of increased predation pressure exerted by exploited species (Mosquera et al. Reference Mosquera, Côté, Jennings and Reynolds2000; Côté et al. Reference Côté, Mosqueira and Reynolds2001; Micheli et al. Reference Micheli, Halpern, Botsford and Warner2004; García-Charton et al. Reference García-Charton, Pérez-Ruzafa, Marcos, Claudet, Badalamenti, Benedetti-Cecchi, Falcón, Milazzo, Schembri, Stobart, Vandeperre, Brito, Chemello, Dimech, Domenici, Guala, Diréach, Maggi and Planes2008; Lester et al. Reference Lester, Halpern, Grorud-Colvert, Lubchenco, Ruttenberg, Gaines, Airamé and Warner2009; Molloy et al. Reference Molloy, McLean and Côté2009; Claudet et al. Reference Claudet, Osenberg, Domenici, Badalamenti, Milazzo, Falcón, Bertocci, Benedetti-Cecchi, García-Charton, Goni, Borg, Forcada, Lucia, Pérez-Ruzafa, Afonso, Brito, Guala, Diréach, Sanchez-Jerez, Somerfield and Planes2010). The discrepancy between our results and outcomes of meta-analyses may arise from meta-analyses overstating the importance of MPA-related effects, or because the MPAs studied here generated smaller responses than typical elsewhere. Both possibilities probably contributed to outcomes.
A major recognized deficiency with meta-analyses is publication bias, where outcomes are skewed by use of data that have been non-randomly selected by acceptance through the publication process, and thus with non-significant results often filtered out and higher effect sizes evident than in field data (Kotiaho & Tomkins Reference Kotiaho and Tomkins2002; Stewart et al. Reference Stewart, Kaiser, Côté, Halpern, Lester, Bayliss and Pullin2009; Edgar Reference Edgar2011). This source of error was presumably responsible in part for early conclusions that effects of MPAs occur almost instantaneously (Halpern & Warner Reference Halpern and Warner2002), and that population responses are independent of MPA size (Halpern Reference Halpern2003), two inferences that have been shown in subsequent investigations to be incorrect (Molloy et al. Reference Molloy, McLean and Côté2009; Babcock et al. Reference Babcock, Shears, Alcala, Barrett, Edgar, Lafferty, McClanahan and Russ2010; Vandeperre et al. Reference Vandeperre, Higgins, Sánchez-Meca, Maynou, Goñi, Martín-Sosa, Pérez-Ruzafa, Afonso, Bertocci, Crec'hriou, D'Anna, Dimech, Dorta, Esparza, Falcón, Forcada, Guala, Direach, Marcos, Ojeda-Martínez, Pipitone, Schembri, Stelzenmüller, Stobart and Santos2011).
A particular issue for meta-analyses dealing with ecological effects of MPAs is the likelihood that data used are confounded spatially and temporally. If underlying studies rely on before/after comparisons within a single MPA, or SZ/FZ comparisons without temporal replication, then differences detected are much more likely to represent site or temporal variability than an effect of fishing. Of 72 significant PERMANOVA test results generated here for abundance data (Tables 2 and 3), 43 related to pre-existing site effects, nine related to pre-existing SZ/FZ zone effects, 17 related to changes through time that co-occurred in both SZs and FZs, and only three were attributable to protection from fishing. With our survey design, variation in species-level data attributable to the zone × year interaction was consistently about half the variation evident between SZs and FZs, about half the variation evident between years, and about 10% of site-to-site variability (Fig. 5). Clearly, if our study had been based on the same survey information but without baseline data, or the temporal data were used without information from fished reference sites, then many more effects of fishing would have been inferred.
Robust analyses of MPA-related effects need control-impact designs with long-term trend or before-after data, and multi-site rather than multi-transect replication, as now well recognized in the literature (see for example Willis et al. Reference Willis, Millar and Babcock2003b ), yet the proportion of studies used in meta-analyses with multi-site BACI designs is very low. For example, the most recent meta-analysis of temperate MPAs (Stewart et al. Reference Stewart, Kaiser, Côté, Halpern, Lester, Bayliss and Pullin2009) included only a single BACI study amongst 34 studies included, and only three of these studies considered data from more than one no-take area.
Recent studies increasingly indicate the importance of MPA age as a fundamental determinant of MPA-related effects; however, in contrast to our outlook at commencement of this study and expectations of many MPA managers, decades are often required for effects to manifest sufficiently to be detected (Claudet & Guidetti Reference Claudet and Guidetti2010). Stewart et al. (Reference Stewart, Kaiser, Côté, Halpern, Lester, Bayliss and Pullin2009) calculated that the median period from MPA establishment for detection of an effect is 9.5 years for temperate MPAs, while Babcock et al. (Reference Babcock, Shears, Alcala, Barrett, Edgar, Lafferty, McClanahan and Russ2010) indicated a period of 5.1 years for primary effects to become evident, and Edgar et al. (Reference Edgar, Barrett and Stuart-Smith2009) inferred ecological changes to continue to develop in Australian MPAs over at least 40 years. Thus, a fundamental reason for the apparent paucity of MPA effects detected here is probably the 3–4 year duration of investigation, a lengthy period in relation to most ecological studies, including those undertaken over 2–3 years by postgraduate students, but which now seems inadequate for a study of population responses to MPA declaration.
Longer term studies in the Maria Island MPA support this explanation, in that numerous population changes associated with protection were evident five (Edgar & Barrett Reference Edgar and Barrett1999) and ten years (Barrett et al. Reference Barrett, Edgar, Buxton and Haddon2007, Reference Barrett, Buxton and Edgar2009) after MPA declaration, while only a single species (Latridopsis forsteri) was found to show significant change here. Longer term effects at Maria Island included order of magnitude increases in the biomass of rock lobsters and large (>45 cm) fishes, and declines by a factor of three in populations of grazing urchins and gastropods due to secondary trophic influences (Edgar et al. Reference Edgar, Barrett and Stuart-Smith2009).
The strong temporal signals in the longer-term Maria Island study were enhanced by assessing trends using biomass rather than abundance; commercially-exploited fishes and lobsters in SZs showed greatly increasing mean body mass and abundance through time. Fish data analysed here also showed double the number of significant zone × time interactions when biomass rather than abundance data were used, with the wrasse Ophthalmolepis lineolatus and ray Urolophus cruciatus showing significant increases with time in SZs relative to FZs. Neither of these two species is directly targeted by fishers, although both are captured as by-catch.
An additional factor that likely contributed to few zone effects being noted in our study is low regional fishing pressure (see Côté et al. Reference Côté, Mosqueira and Reynolds2001); populations of several fished species may not have been greatly depressed by fishing outside Australian SZs. Australia possesses a relatively low human population density compared to other countries, so fishing pressure, while substantial for high-value commercial species such as rock lobster (Jasus edwardsii and Panulirus cygnus) and abalone (Haliotis rubra), is relatively low when considered at the global scale. This is particularly the case for the remote Tasmanian MPAs at the Kent Group and Port Davey, where virtually no hook-and-line fishing is undertaken, and nets are rarely set (Resource Planning & Development Commission 2002). Moreover, the two common commercially-valuable species at Jurien Bay (baldchin groper Choerodon rubescens and the lobster Panulirus cygnus) probably both migrate out of the inshore SZs surveyed on approaching maturity (Phillips Reference Phillips1983), consequently the studied populations consisted almost exclusively of individuals below legal capture size.
Amongst the common fishes investigated, the primary target for recreational gill net fishers in Tasmania at the time of surveys was the latrid trumpeter Latridopsis forsteri (Harries & Croome Reference Harries and Croome1989), which is now almost commercially extinct, while the red morwong Cheilodactylus fuscus, the only other fish species showing a significant reserve effect for abundance data, represented a major target for spearfishers in NSW (Lowry & Suthers Reference Lowry and Suthers2004). These results are consistent with gill net fishing and spearfishing impacting populations on shallow temperate Australian reefs to a greater extent than other permitted fishing techniques (hook-and-line and traps), although these species may also be more strongly site-associated than the majority of exploited fishes studied.
Other factors that potentially influenced study outcomes include relatively small size of SZs studied and their fragmented nature within MPAs, illegal fishing activities depressing populations within SZs, hysteresis and lags in ecological response to removal of fishing pressure, excessive spillover, and poor habitat for commercial species within SZs (Little et al. Reference Little, Smith, McDonald, Punt, Mapstone, Pantus and Davies2005; Edgar et al. Reference Edgar, Barrett and Stuart-Smith2009; Edgar Reference Edgar2011; McClanahan et al. Reference McClanahan, Muthiga and Coleman2011). Moreover, the underwater visual census techniques used may not adequately capture population responses of key exploited species, particularly large fishes that are targeted by anglers using baited hooks but rarely sighted by divers, such as the snapper Pagrus auratus, a major target of fishers in Jervis Bay. Baited underwater video proved a more useful technique for monitoring numbers of this species in a New Zealand MPA (Willis et al. Reference Vandeperre, Higgins, Sánchez-Meca, Maynou, Goñi, Martín-Sosa, Pérez-Ruzafa, Afonso, Bertocci, Crec'hriou, D'Anna, Dimech, Dorta, Esparza, Falcón, Forcada, Guala, Direach, Marcos, Ojeda-Martínez, Pipitone, Schembri, Stelzenmüller, Stobart and Santos2003a ) than underwater visual survey methods (see, for example, Cole et al. Reference Cole, Ayling and Creese1990).To fully understand how each of the large variety of extrinsic factors contribute to protection responses, both in Australia and more generally, much additional data on ecological patterns with associated covariate data on physical, socioeconomic and governance conditions are needed (see García-Charton et al. Reference García-Charton, Pérez-Ruzafa, Marcos, Claudet, Badalamenti, Benedetti-Cecchi, Falcón, Milazzo, Schembri, Stobart, Vandeperre, Brito, Chemello, Dimech, Domenici, Guala, Diréach, Maggi and Planes2008; Claudet & Guidetti Reference Claudet and Guidetti2010).
CONCLUSION
Recovery of depleted fished stocks and associated trophic adjustments to food webs are presently difficult to predict at the scale of individual MPAs. Development of accurate predictive models requires long-term empirical data from a large variety of MPAs and consideration of the various environmental and socio-economic factors that prevail locally. More complex statistical approaches that consider non-linearities and multifaceted interactions also need to be applied. The monitoring programme described here is continuing, and will contribute to the long-term assessment of the efficacy of MPA networks over what now appears to be a more appropriate and ecologically realistic time period for assessment (such as 10–20 years).
ACKNOWLEDGEMENTS
The project was undertaken with financial support of the Australian Research Council, and is based on field, financial and staff support provided by the NSW Marine Park Authority, the WA Department of Environment and Conservation, the Tasmanian Department of Primary Industry, Parks, Wildlife and Environment, and the Institute for Marine and Antarctic Studies. Particular thanks are due to Tim Lynch, Kevin Crane, Kevin Bancroft, Matt Dasey, Chris Simpson, Kim Friedman, Fran Clements, Nathan Knott, Peter Mooney and Colin Buxton. Diving assistance provided by Carolina Zagal, Dane Jones, Adriana Polacheck, Ian Osterloh, Rick Stuart-Smith, James Brook and Tim Alexander is also gratefully acknowledged.


