


1. Introduction
The Himalayan orogen represents one of the most intensively studied collisional mountain belts on Earth, formed by convergence between the Indian and Eurasian plates during the Cenozoic (Gansser, Reference Gansser1964; Yin, Reference Yin2006). This prolonged convergence, initiated at ca. 60 Ma, resulted in crustal thickening, widespread metamorphism and complex tectono-magmatic interactions that shaped the architecture of the orogen. While the central and western Himalaya and southern Lhasa terrane have been the focus of extensive research on deformation and metamorphism (Le Fort, Reference Le Fort1975; Yin & Harrison, Reference Yin and Harrison2000; DeCelles et al. Reference DeCelles, Robinson, Quade, Ojha, Garzione, Copeland and Upreti2001; Kapp & DeCelles, Reference Kapp and DeCelles2019), the northern Indo-Burma Ranges, located southeast of the Eastern Himalayan Syntaxis, remain comparatively understudied. Although pioneering studies by Haproff et al. (Reference Haproff, Zuza and Yin2018, Reference Haproff, Zuza, Yin, Harrison, Manning, Dubey, Ding, Wu and Chen2019, Reference Haproff, Levy, Zuza, Hooker, Heizler, Stockil and Braza2023) have advanced the understanding of deformation and slip history along major thrust systems north of the Indo-Myanmar region, detailed investigations into the region’s metamorphic histories are still lacking (Fig. 1a,b).
(a) Geological map of the Himalayan orogen showing the Lesser, Greater, Tethyan and Sub-Himalayan sequences, the Trans-Himalayan units and major structures (MFT, MBT, MCT, STD, IYSZ), modified after Webb et al. (Reference Webb, Guo, Clift, Husson, Muller, Costantino, Yin, Xu, Cao and Wang2017). The red dotted box indicates the location of the study area in the northeastern Himalaya. (b) Geological map showing litho-tectonic units north of the Indo-Burma ranges adjacent to the northeastern Eastern Himalayan Syntaxis (modified after Haproff et al. Reference Haproff, Levy, Zuza, Hooker, Heizler, Stockil and Braza2023). (c) Detailed geological map (modified after Haproff et al. Reference Haproff, Levy, Zuza, Hooker, Heizler, Stockil and Braza2023) showing the distribution of rock units in the studied area, Dibang Valley, Arunachal Pradesh. Studied high-grade metapelites (GMS1, GMS2) are highlighted by red stars.

In this region, two major contractional shear zones are recognized: (i) the Lohit thrust shear zone, which defines the lower boundary of the easternmost Cretaceous Gangdese belt and its Mesoproterozoic basement is represented by the Lohit Plutonic Complex (LPC) and (ii) the structurally lower Tidding shear zone which marks the base of the Indus–Yarlung suture zone, represented by the Tidding and Mayodia mélange complexes (Dhoundial et al. Reference Dhoundial, Santra and Dange1971; Nandy, Reference Nandy1973, Reference Nandy1976; Gururajan & Choudhuri, Reference Gururajan and Choudhuri2003; Misra, Reference Misra2009; Singh & Singh, Reference Singh and Singh2011, Reference Singh and Singh2013; Lin et al. Reference Lin, Chung, Kumar, Wu, Chiu and Lin2013; Bikramaditya et al. Reference Bikramaditya, Chung, Singh, Lee, Lin and Iizuka2020; Haproff et al. Reference Haproff, Zuza and Yin2018, Reference Haproff, Zuza, Yin, Harrison, Manning, Dubey, Ding, Wu and Chen2019; Pebam & Kamalakannan, Reference Pebam and Kamalakannan2019) (Fig. 1b). The LPC forms the northernmost Trans-Himalayan unit exposed along the Dibang Valley and is composed mainly of Mesoproterozoic migmatitic orthogneiss (ca. 1286 Ma; Haproff et al. Reference Haproff, Zuza, Yin, Harrison, Manning, Dubey, Ding, Wu and Chen2019), which is intruded by granitoids of Late Jurassic–Cretaceous age (ca. 144–90 Ma) and Cretaceous granitoids (ca. 135–69 Ma). The orthogneiss is commonly interlayered with marble and gabbro, recording a long-lived magmatic history (Thakur & Jain, Reference Thakur and Jain1975; Gururajan & Choudhuri, Reference Gururajan and Choudhuri2003, Reference Gururajan and Choudhuri2007; Misra, Reference Misra2009; Haproff et al. Reference Haproff, Zuza and Yin2018, Reference Haproff, Zuza, Yin, Harrison, Manning, Dubey, Ding, Wu and Chen2019, Reference Haproff, Levy, Zuza, Hooker, Heizler, Stockil and Braza2023) (Fig. 1c).
While the magmatic history of the LPC is well established, its metamorphic evolution has received limited attention and remains poorly understood. A key question is whether the LPC preserves only its arc magmatic and subsequent cooling history, or whether it also records a high-pressure metamorphic overprint associated with Oligocene–Miocene crustal thickening (Gururajan & Choudhuri, Reference Gururajan and Choudhuri2003; Misra, Reference Misra2009; Haproff et al. Reference Haproff, Zuza and Yin2018, Reference Haproff, Zuza, Yin, Harrison, Manning, Dubey, Ding, Wu and Chen2019, Reference Haproff, Levy, Zuza, Hooker, Heizler, Stockil and Braza2023). The Tidding mélange sediments in this region are metamorphosed because they are carried down with the subducting oceanic slab into high-pressure environments and later exhumed along thrusts. In contrast, sediments associated with continental arc systems are buried by intracrustal thrusting and crustal thickening during arc–continent collision, and thus can preserve high-grade metamorphic assemblages. By analogy with the many continental arcs across the world, metasedimentary rocks juxtaposed with and intruded by plutons have been shown to retain pressure–temperature–time (P–T–t) histories and record polymetamorphism (Miller & Snoke, Reference Miller, Snoke, Miller and Snoke2009; Hacker et al. Reference Hacker, Kelemen and Behn2015; Gordon et al. Reference Gordon, Miller, Sauer, Haugerud and Kelsey2017). Hence, the metasedimentary enclaves within the LPC may provide the first direct constraints on Himalayan-age metamorphism in this eastern sector of the Trans-Himalayan belt.
Rare, spatially restricted garnet–Al-silicate–bearing metapelitic enclaves occur in the footwall of the Walong Thrust in the Dibang Valley section, where mineral assemblages characterized by the co-occurrence of andalusite, kyanite and sillimanite attest to a complex metamorphic history (Fig. 1c). While the limited extent of these enclaves restricts regional extrapolation, they provide a valuable opportunity to assess whether these enclaves record an Oligocene–Miocene metamorphic overprint or whether their evolution was dominated by arc magmatism followed by cooling. This study documents the detailed textures, microstructures and mineral chemistry of these enclaves, reconstructs peak metamorphic conditions using geothermobarometry and phase equilibrium modelling and interprets the regional pressure–temperature (P–T) trajectory. Microstructural studies of pelitic rocks, particularly those containing key phases such as kyanite, andalusite, staurolite and garnet, provide vital insights into both the polymetamorphic history, indicating multiple metamorphic episodes (Palin et al. Reference Palin, Searle, Waters, Horstwood and Parrish2012, Robyr, Reference Robyr2023) and the progressive reaction history during individual metamorphic events (Phillips et al. Reference Phillips, Argles, Warren, Harris and Kunz2023; Pattison and Spear, Reference Pattison and Spear2018; Nerone et al. Reference Nerone, Groppo, Ágreda-López, Petrelli and Rolfo2025). Traditional mineral-based geothermometry techniques often assume that garnet preserves compositional zoning, which predominantly records the prograde growth history leading to peak metamorphic conditions. Garnet commonly serves as a robust geothermobarometric indicator, reliably preserving evidence of successive pressure-temperature conditions throughout metamorphic history (Catlos et al. Reference Catlos, Lovera, Kelly, Ashley, Harrison and Etzel2018; de Capitani & Petrakakis, Reference De Capitani and Petrakakis2010; Moynihan & Pattison, Reference Moynihan and Pattison2013; Spear & Kohn, Reference Spear and Kohn1996; Kohn, Reference Kohn, Holland and Turekian2014; Lanari & Engi, Reference Lanari and Engi2017). However, if garnet experienced post-peak diffusion and reequilibration, its composition can become homogenized, causing conventional thermometers to underestimate peak temperatures (Caddick et al. Reference Caddick, Konopa´sek and Thompson2010). Phase equilibrium modelling effectively addresses this challenge by reconstructing P–T evolution in compositionally complex metapelites, integrating the thermodynamics of all stable mineral phases and compositional variability (White et al. Reference White, Powell and Clarke2003; Lanari and Duesterhoeft, Reference Lanari and Duesterhoeft2019; Groppo, Reference Groppo2025). This approach allows accurate prediction of phase assemblages and their stability fields, enabling detailed interpretation of metamorphic reaction history and pressure-temperature paths. Given their ability to preserve P–T histories, these metapelitic enclaves provide a unique insight into metamorphic processes in the structurally lower part of the LPC in the Dibang Valley section, NE India.
2. Geological setting
The northern Indo-Burma Ranges (to the south and southeast of the eastern Himalayan syntaxis, Fig. 1a, b) expose a structurally complex crustal domain recording the India–Asia collision. In the Dibang and Lohit valleys of Arunachal Pradesh, a series of thrust-bounded lithotectonic units delineate the transition from Trans-Himalayan arc crust in the north to foreland basin deposits in the south (Fig. 1b).
At the top of this tectono-stratigraphic stack lies the LPC, interpreted as the southeastern continuation of the Gangdese batholith (Lin et al. Reference Lin, Chung, Kumar, Wu, Chiu and Lin2013; Haproff et al. Reference Haproff, Zuza, Yin, Harrison, Manning, Dubey, Ding, Wu and Chen2019, Reference Haproff, Levy, Zuza, Hooker, Heizler, Stockil and Braza2023). The LPC is divided into eastern (ELPC) and western (WLPC) belts by the Walong thrust (Thakur and Jain, Reference Thakur and Jain1975; Misra & Singh, Reference Misra, Singh, Pant and Sharma2002; Gururajan & Choudhuri, Reference Gururajan and Choudhuri2003, Reference Gururajan and Choudhuri2007). The ELPC comprises Mesoproterozoic and Cretaceous migmatitic orthogneiss, metaigneous and granitoids (including leucogranites), whereas the WLPC consists of Late Jurassic–Cretaceous granitoids interlayered with migmatitic orthogneiss, marble and mafic lithologies (Haproff et al. Reference Haproff, Zuza, Yin, Harrison, Manning, Dubey, Ding, Wu and Chen2019; Bikramaditya et al. Reference Bikramaditya, Chung, Singh, Lee, Lin and Iizuka2020). These granitoids intruded at depths of ∼32–40 km, consistent with emplacement in thickened arc crust analogous to the Gangdese lower arc (Zhang et al. Reference Zhang, Ding, Palin, Dong, Tian and Chen2020).
Structurally beneath the LPC, the Lohit thrust shear zone juxtaposes the WLPC against the Tidding mélange complex composed of serpentinized ultramafics, metaigneous bodies and metasedimentary rocks (Dhoundial et al. Reference Dhoundial, Santra and Dange1971; Gururajan & Choudhuri, Reference Gururajan and Choudhuri2003; Haproff et al. Reference Haproff, Zuza, Yin, Harrison, Manning, Dubey, Ding, Wu and Chen2019). South of the Tidding unit, the Mayodia mélange complex occurs as a thrust klippe. Both mélanges are imbricated onto metasedimentary sequences comparable to the Lesser Himalayan succession, including quartzo-feldspathic schists, paragneiss, quartzite and marble, commonly grouped as the Mayodia gneiss and Lalpani schist (Gururajan & Choudhuri, Reference Gururajan and Choudhuri2003; Haproff et al. Reference Haproff, Zuza, Yin, Harrison, Manning, Dubey, Ding, Wu and Chen2019). The Mayodia and Lalpani sequences are separated by the Demwe thrust, folded into the Hunli antiform above a duplex structure (Salvi et al. Reference Salvi, Mathew, Kohn, Pande and Borgohain2020). Farther southwest, the Lalpani thrust overlays these rocks onto the Sewak unit, which in turn is thrust over Quaternary Brahmaputra floodplain strata along the active, range-bounding Mishmi thrust – a southeastern continuation of the Main Frontal Thrust with a right-lateral component consistent with displacements during the 1950 Assam earthquake (Coudurier-Curveur et al. Reference Coudurier-Curveur, Tapponnier, Okal, Van der Woerd, Kali, Choudhury, Baruah, Etchebed and Karakaş2020).
Metamorphic conditions vary systematically across this thrust belt. Amphibole-bearing orthogneisses within the LPC yield pressures of ∼9 kbar and temperatures of ∼700 °C, while associated monzodiorite records peak conditions near the Al2SiO5 triple point (Haproff et al. Reference Haproff, Levy, Zuza, Hooker, Heizler, Stockil and Braza2023) (Fig. 1c). The Tidding and Mayodia mélange complexes preserve upper amphibolite-facies assemblages corresponding to burial depths of 27–39 km, with cooling ages of ca. 36–30 Ma linked to exhumation along the north-dipping Tidding thrust (Haproff et al. Reference Haproff, Zuza, Yin, Harrison, Manning, Dubey, Ding, Wu and Chen2019). LPC cooling ages between ca. 25–10 Ma suggest exhumation related to slip along the Lohit thrust.
Field mapping along the Etalin–Malini section of the Dibang Valley identified strike-parallel enclaves of garnet–Al-silicate-bearing metapelites within Cretaceous migmatitic–gneiss complexes of the WLPC (Fig. 1c). These enclaves, hosted subparallel to the regional tectonic fabric, indicate structural emplacement and preservation along the strike of the WLPC, providing a unique record for reconstructing metamorphic evolution and deformation associated with crustal thickening in this segment of the Himalayan orogen. Mineral assemblages include garnet together with elongated kyanite and andalusite, signifying polymetamorphism and suggesting a possible Oligocene–Miocene metamorphic overprint during crustal thickening.
The regional structural architecture is characterized by steeply dipping foliation planes (S1/S2) trending NNE–SSW, large-scale asymmetric folds and high-strain shear zones, all evidence of intense ductile deformation accompanying burial and exhumation (Fig. 2a). Figure 2b shows the previously unexplored metapelite enclaves in the migmatite orthogneiss of the WLPC. Two representative metapelite samples, GMS1 and GMS2, were collected for detailed study. In GMS1, small garnet grains are distributed along S1/S2 foliation, with elongated kyanite concentrated in lenses parallel with the foliation (Fig. 2c). In contrast, GMS2 contains coarse garnet (up to 1.5 cm), elongated kyanite and sub-elliptical andalusite grains (Fig. 2d).
Field photographs illustrating structural and lithological features: (a) asymmetric folding in migmatite gneiss (LPC); (b) metapelite enclaves associated with migmatite gneiss/migmatite, showing bands of leucocratic layers; (c) sample GMS1 displaying small almandine garnets aligned along fine-grained layers with well-developed S1 and S2 fabrics; (d) enlarged view of a metapelite enclave showing large garnets (∼1.5 cm) with dark blue kyanite and light-coloured oval andalusite crystals.

Collectively, the Lohit and Tidding thrust systems delineate a crustal section through former arc roots and associated basin units that underwent deep burial, metamorphism and subsequent exhumation during the Himalayan orogeny. The lithologic diversity and well-preserved metasedimentary enclaves within the Lohit plutonic complex may provide a polymetamorphic history related to early arc magmatism and the Cenozoic high-pressure metamorphic imprint associated with arc–continent collision and crustal thickening.
3. Analytical methods
3.a. Mineral chemistry
Polished thin sections were prepared from five collected samples, yielding a total of 11 sections. These were systematically examined using optical microscopy to characterize mineral assemblages, textures and microstructures relevant to the metamorphic history. From these, six representative thin sections from two key samples (GMS1 and GMS2) were selected for detailed mineral chemical analysis using electron probe microanalysis (EPMA). Silicate minerals were analysed using a CAMECA SX-100 Electron Probe Micro Analyzer (EPMA) at the Indian Institute of Technology, Kharagpur, West Bengal, India. Major element analyses for mineral chemistry and thermobarometry were conducted using the same instrument, which is equipped with four spectrometers. Additionally, X-ray element maps of garnet grains for Fe, Mg, Ca and Mn were obtained.
The analyses were performed at an acceleration voltage of 15 kV with a beam current of 20 nA, using a focused beam (∼1 µm). The dwell time was set at 10 seconds for the peak and 5 seconds for the background for all elements. The following standards and emission lines were used: jadeite (Na-Kα, Si-Kα), orthoclase (K-Kα, Al-Kα), diopside (Ca-Kα, Mg-Kα), NaCl (Cl-Kα), Fe2O3 (Fe-Kα), TiO2 (Ti-Kα), fluoro-apatite (F-Kα, P-Kα) and rhodonite (Mn-Kα). TAP crystals were used for F, Na, Al, Si and Mg; PET for Ca, Ti, K and Cl; LPET for P; and LIF for Mn and Fe. Na and K were analysed first to minimize the effects of migration. The raw EPMA data were matrix-corrected using the PAP correction method (Pouchou and Pichoir, Reference Pouchou, Pichoir, Brown and Packwood1987). Mineral chemical formulae were calculated using the AX software (https://filedn.com/lU1GlyFhv3UuXg5E9dbnWFF/TJBHpages/ax.html), and the results are provided in Tables 1 and 2.
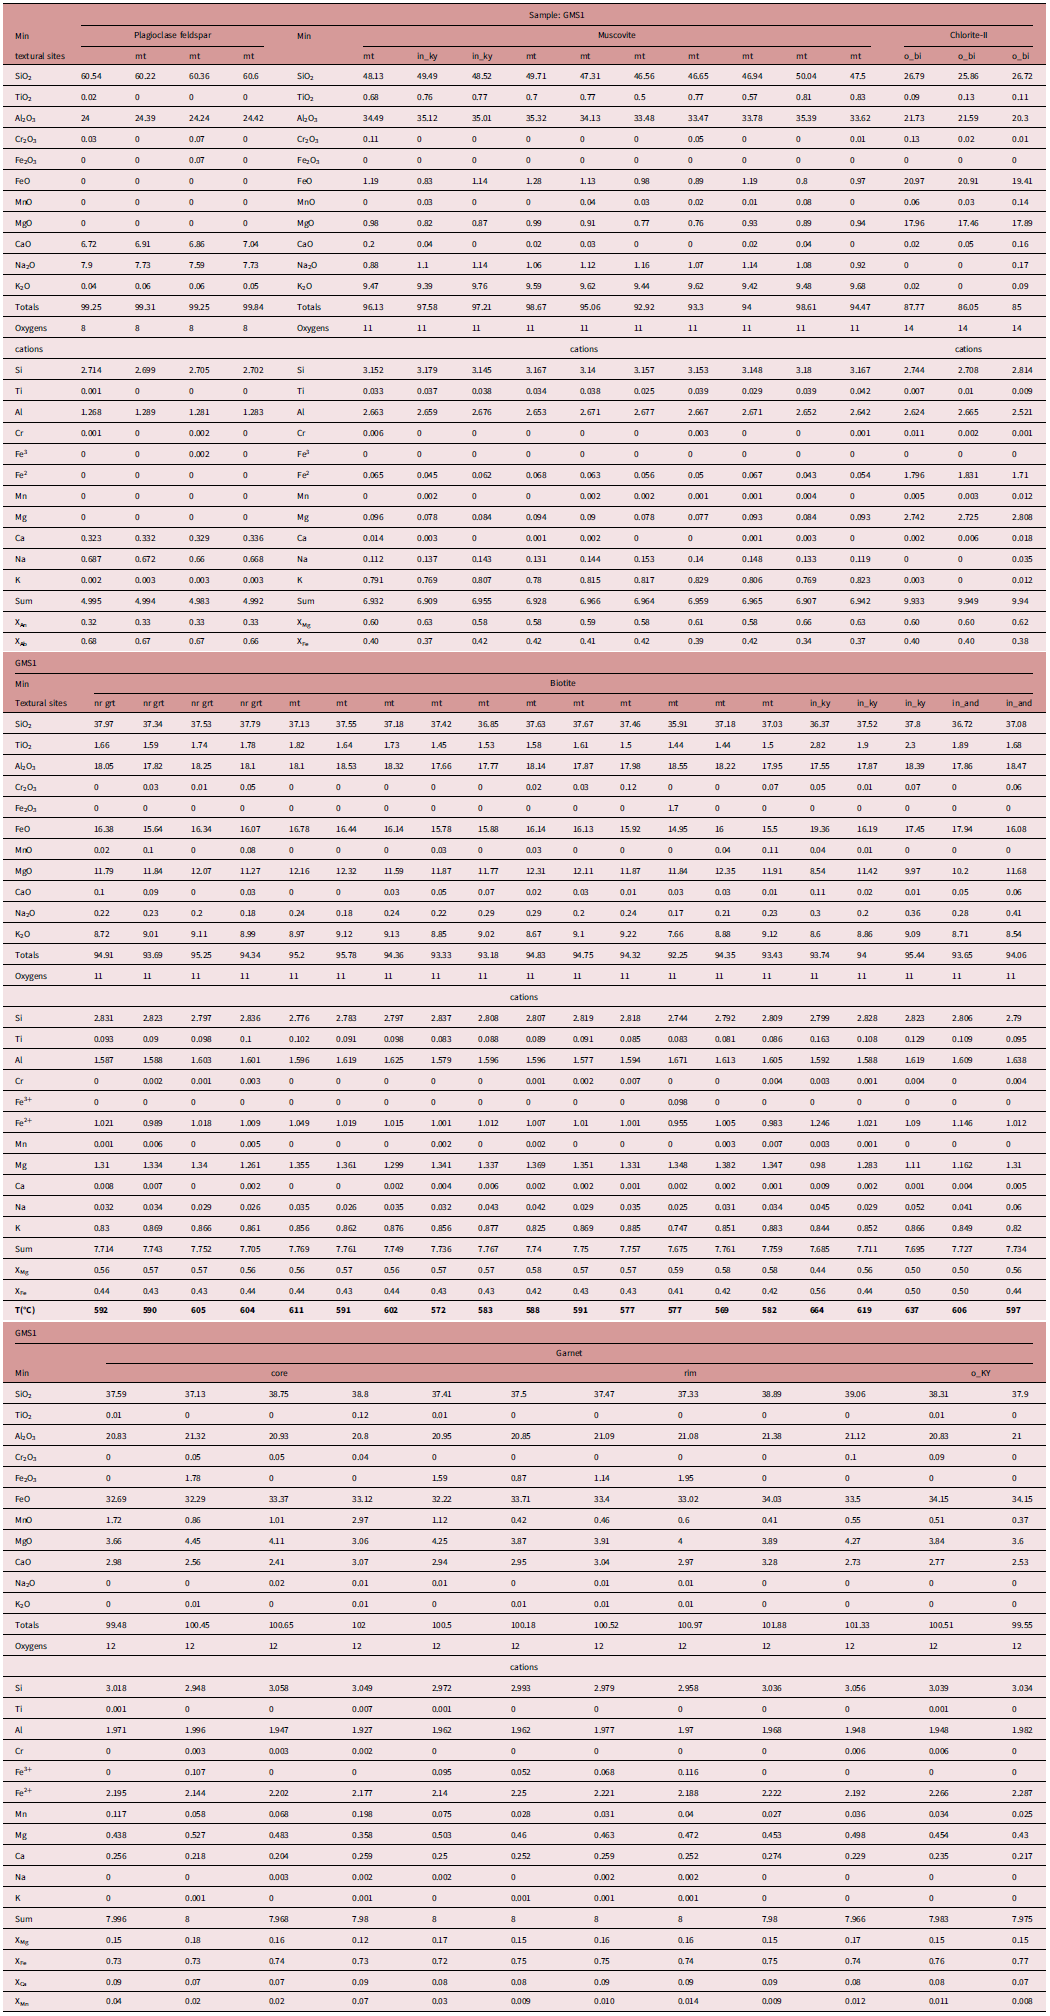
Electron probe microanalytical data and calculated cations of minerals from the high-grade metapelite sample GMS1.

mt: matrix; in_ky: inclusion in kyanite; o_bi : over biotite.
mt: matrix; in_ky: inclusion in kyanite; o_bi : over biotite; nr grt: near garnet; in_and: inclusion in andalusite.
Grt: XMg=(Mg/Mg+Fe+Ca+Mn); XFe=(Fe/Mg+Fe+Ca+Mn); XCa=(Ca/Mg+Fe+Ca+Mn); XMn=(Mn/Mg+Fe+Ca+Mn).
Bt: XMg=(Mg/Mg+Fe); XFe=(Fe/Mg+Fe).
Electron probe microanalytical data and calculated cations of minerals from the high-grade metapelite sample GMS2.

mt: matrix; o_ky: over kyanite; o_bi : over biotite; in_st: included in staurolite.
mt: matrix; o_ky: over kyanite; o_bi: over biotite; in_st: included in staurolite.
Grt: XMg=(Mg/Mg+Fe+Ca+Mn); XFe=(Fe/Mg+Fe+Ca+Mn); XCa=(Ca/Mg+Fe+Ca+Mn); XMn=(Mn/Mg+Fe+Ca+Mn).
Bt: XMg=(Mg/Mg+Fe); XFe= (Fe/Mg+Fe).
3.b. Geothermobarometric analysis
The garnet-biotite thermometer, which is based on Fe-Mg exchange, is the most commonly employed technique for determining temperatures in medium-grade metapelitic rocks. Several thermometers have been developed through experimental studies (Ferry & Spear, Reference Ferry and Spear1978) and empirical calibrations, accounting for both non-ideal (Hodges & Spear, Reference Hodges and Spear1982; Ganguly & Saxena, Reference Ganguly and Saxena1984) and ideal (Thompson, Reference Thompson1976) behaviour of these minerals. In our research, the metamorphic mineral assemblages in the metapelite samples generally include biotite ± plagioclase, quartz, garnet and aluminosilicates (kyanite, andalusite/or sillimanite). Consequently, the Grt-Bt thermometer, using Fe-Mg exchange calibration (5AV) by Holdaway (Reference Holdaway2000), estimates peak metamorphic temperatures with an accuracy of ±25°C. To estimate peak metamorphic pressure, we applied both the garnet–biotite–plagioclase–quartz (GBPQ) barometer (Hoisch, Reference Hoisch1990) and the GASP barometer (Holdaway, Reference Holdaway2001). Compositional domains of garnet–biotite and garnet–plagioclase–quartz pairs within each sample were analysed by EPMA and used for independent calculations, capturing the range of P–T conditions recorded by local equilibrium domains. Post-peak re-equilibration temperatures were estimated by the Ti-in-biotite thermometer following Henry et al. (Reference Henry, Guidotti and Thompson2005).
Pressure-temperature (P–T) conditions were further assessed using Berman’s internally consistent thermodynamic data (Berman, Reference Berman1988, Reference Berman1990) with the winTWQ software version 2.64, an update from version 2.36 (Berman, Reference Berman2007), utilizing the Dec06.dat database (Berman et al. Reference Berman, Aranovich, Rancourt and Mercier2007). Near-peak conditions were determined from garnet rim and adjacent biotite compositions. However, factors such as changes in bulk rock composition due to garnet growth, partial melting, partial re-equilibration of biotite and compositional zoning in garnet can affect these calculations. Consequently, some variation in geochemistry and equilibrium P–T conditions is expected (Tinkham & Ghent, Reference Tinkham and Ghent2005).
3.c. P-T Pseudosection analysis
P–T phase equilibrium modelling was performed using Perple_X version 7.1.12 (Connolly, Reference Connolly2005, Reference Connolly2009), which employs constrained free-energy minimization. Calculations used the internally consistent thermodynamic dataset of Holland & Powell (Reference Holland and Powell1998, updated 2004; dataset ds55). P-T phase equilibrium modelling has proven to be a reliable method for determining the P-T evolution of anatectic rocks due to advancements in thermodynamic databases, as well as melt and solid solution models (Indares et al. Reference Indares, White and Powell2008; Groppo et al. Reference Groppo, Rubatto, Rolfo and Lombardo2010, Reference Groppo, Rolfo and Indares2012; Guilmette et al. Reference Guilmette, Indares and Hébert2011; Rubatto et al. Reference Rubatto, Chakraborty and Dasgupta2013). In a metapelite system, pressure and temperature are well recorded by paragenesis, as the changes in peak paragenesis are susceptible to P-T variations (e.g., Caddick et al. Reference Caddick, Bickle, Harris, Holland, Horstwood, Parrish and Ahmad2007; Evans, Reference Evans2004; Gaidies et al. Reference Gaidies, Abart, De Capitani, Connolly and Reusser2006; Groppo et al. Reference Groppo, Castelli, Compagnoni, Hacker, McClelland and Liou2006, Reference Groppo, Rolfo and Lombardo2009; Tinkham & Ghent, Reference Tinkham and Ghent2005).
P–T phase equilibrium modelling was performed to constrain the metamorphic evolution of the metapelites. Whole-rock compositions for samples GMS1 and GMS2 were used to construct P–T phase equilibrium modelling within the MnO–Na2O–K2O–CaO–FeO–MgO–Al2O3–SiO2–H2O–TiO2 (TiMnNKCFMASH) system. These models allowed precise determination of the metamorphic P–T paths using bulk compositions derived from X-ray fluorescence (XRF) analysis. The major element data were obtained using pressed pellets analysed by XRF spectroscopy with a Phillips MAGIX PRO Model 2440 at CSIR-NGRI, Hyderabad, India. Bulk compositions of the metapelites (in wt. %) are as follows: GMS1 – SiO2 = 59.36, Al2O3 = 22.669, FeO = 7.15, MnO = 0.069, MgO = 1.725, CaO = 0.687, Na2O = 0.813, K2O = 4.41, TiO2 = 0.789, P2O5 = 0.152; and GMS2 – SiO2 = 59.66, Al2O3 = 22.383, FeO = 7.23, MnO = 0.039, MgO = 1.137, CaO = 0.803, Na2O = 0.766, K2O = 3.901, TiO2 = 0.789, P2O5 = 0.314. These compositions were converted into molar proportions for P–T phase equilibrium modelling (molar proportions: GMS1-SiO2 = 68.81, TiO2 = 0.69, Al2O3 = 15.49, FeO = 6.94, MnO = 0.07, MgO = 2.98, CaO = 0.85, Na2O = 0.91, K2O = 3.26; GMS2-SiO2 = 69.93, TiO2 = 0.70, Al2O3 = 15.46, FeO = 7.09, MnO = 0.04, MgO = 1.99, CaO = 1.01, Na2O = 0.87, K2O = 2.92). Oxygen was not considered as an independent component because the samples lack magnetite and instead contain rutile, ilmenite and ± pyrite; ferric iron contents are low, consistent with reduced redox conditions (Diener & Powell, Reference Diener and Powell2010; Groppo et al. Reference Groppo, Rubatto, Rolfo and Lombardo2010). Despite its low abundance, MnO was retained in the system, as even minor Mn significantly influences garnet nucleation and growth (Spear & Cheney, Reference Spear and Cheney1989; Groppo et al. Reference Groppo, Rolfo and Lombardo2009). TiO2 was included due to its occurrence in rutile, ilmenite and biotite solid solutions. H2O was considered saturated in the system, which is supported by the widespread presence of muscovite and biotite.
Initial mineral assemblages were evaluated using AFM projections (Spear, Reference Spear1993). Both GMS1 and GMS2 plot above the Grt–Chl tie-line (Fig. 3), consistent with high-Al pelitic compositions. Textural evidence, such as chlorite and muscovite inclusions in staurolite at the core of garnet (Fig. 5b), further suggests that the precursor assemblages likely contained muscovite and chlorite.
AFM diagram after Spear (Reference Spear1993) showing the positions of pelite compositions GMS1 and GMS2. Both samples plot within the high Al-pelite field.

BSE images and photomicrographs of high-grade anatectic metapelite (GMS1): (a) garnet porphyroblasts (2–3 mm) in a recrystallized leucocratic quartz matrix with strong S1/S2 fabric defined by muscovite and biotite; relict andalusite porphyroblasts are warped by foliation; (b) intergrowth of relict staurolite with kyanite; (c) garnet preserving pseudomorphic texture after staurolite, indicating replacement; (d) relict kyanite grain at garnet rim; (e) co-occurrence of deformed kyanite (Ky2) and relict andalusite (And1), with kinked kyanite providing nucleation sites for small garnets; (f) fractured near-peak kyanite (Ky2) grains serving as sites for secondary muscovite development; (g) rare peritectic kyanite containing sub-rounded polymineralic quartz inclusions, bordered by cuspate quartz lenses, consistent with crystallization in the presence of melt; (h) sillimanite needles overgrow kyanite and muscovite fish, indicating a late sillimanite-grade overprint; (i) partial replacement of kyanite by andalusite during retrogression; (j) corroded kyanite (Ky1) in leucocratic domains with subordinate secondary andalusite (And2); (k) thin And2 coronas along fractured kyanite (Ky2) margins, indicating final crystallization of Al-rich silicate melt during cooling; (l) muscovite + quartz symplectite texture representing cooling and retrogression.

The Holland & Powell dataset (ds55, updated 2004) was employed for thermodynamic modelling, as it has been demonstrated to reproduce natural observations of Al-rich metapelites more reliably (Gervais & Trapy, Reference Gervais and Trapy2021). The solution models employed include white mica (Smye et al. Reference Smye, Greenwood and Holland2010), Ca–Na feldspar (Newton et al. Reference Newton, Charlu and Kleppa1980), K-feldspar (Thompson & Hovis, Reference Thompson and Hovis1979), ilmenite (White et al., Reference White, Powell, Holland and Worley2000; modified by White, Powell & Johnson, Reference White, Powell and Johnson2014), chloritoid, garnet, biotite, staurolite and melt (Holland & Powell, Reference Holland and Powell1998), chlorite (Holland, Baker & Powell, Reference Holland, Baker and Powell1998) and cordierite (ideal Mg–Fe model). Although the white mica model of Smye et al. (Reference Smye, Greenwood and Holland2010) was originally calibrated for use with the Mn-bearing garnet model of White et al. (Reference White, Pomroy and Powell2005), the garnets in the samples contain very low Mn (XMn < 0.07) and the combination of the Smye et al. (Reference Smye, Greenwood and Holland2010) white mica model with the garnet model of Holland & Powell (Reference Holland and Powell1998) yields stable phase topologies and mineral equilibria that closely match the observed assemblages, making this model combination appropriate for the bulk compositions.
4. Results
4.a. Textural and microstructural studies
Representative thin sections from two samples (GMS1 and GMS2; Fig. 1c) were selected for petrographic studies and mineral chemical analyses. Detailed sample-specific textural and microstructural studies are presented below and are illustrated (in Figs. 4, 5).
BSE images and photomicrographs of high-grade anatectic metapelite (GMS2): (a) large garnet porphyroblasts (1–1.5 cm) with staurolite cores in a dynamically recrystallized quartz matrix; relict andalusite (And1) porphyroblasts contain quartz, muscovite, biotite and apatite inclusions; (b) garnet core with poikiloblastic staurolite and inclusions of Chl-I, Qz, etc.; (c) embayed garnet rim hosting relict kyanite, quartz and rutile; (e) peritectic kyanite with sub-rounded polymineralic quartz inclusions and cuspate quartz lenses, indicating melt-assisted crystallization; (f) sillimanite needles overgrow elongate kyanite crystals, recording a late stage of sillimanite growth; (g) muscovite–sillimanite coronas around kyanite, reflecting back-reaction with residual melt during late crystallization; (h) coronal andalusite (And2) along margins of corroded kyanite (Ky1) in polygonized leucocratic domains, recording cooling and exhumation into the andalusite stability field. Euhedral magmatic kyanite (Ky4) crystallized from the earliest melt during peak metamorphic conditions; (i) resorbed margins of large andalusite (And1) porphyroblasts; (j) fibrolite aggregates along And1 margins, indicating partial resorption under late melt-present conditions.

4.a.1. Sample GMS1
Sample GMS1 is characterized by coarse, subhedral to euhedral garnet porphyroblasts measuring 2–3 mm, embedded within a dynamically recrystallized leucocratic matrix predominantly composed of quartz and feldspar (Fig. 4a). The garnet porphyroblasts commonly contain sub-idioblastic inclusions of quartz and kyanite along their margins, indicative of syn-kinematic garnet growth synchronous with peak metamorphic conditions (Figs. 4a, d). In localized microdomains, smaller garnet grains are partially overgrown by larger, kinked kyanite crystals. The pronounced kinking and internal deformation within kyanite produced microstructural discontinuities and zones of enhanced permeability, which likely served as favourable sites for the localized nucleation and growth of garnet (Fig. 4e). Notably, some garnets preserve textural remnants of former staurolite, displaying twinned or cross-like pseudomorphs. These features signify prograde garnet growth over staurolite during the progressive breakdown of staurolite under increasing temperature and pressure conditions consistent with classical prograde metamorphic reactions (Fig. 4c).
Based on microstructural studies, kyanite grains in the studied metapelites can be classified into three main types. Kyanite 1 (Ky1) consists of relict sub-solidus grains, preserved as inclusions within garnet rims and as corroded kyanite in the leucocratic domains (Fig. 4d, j). Kyanite 2 (Ky2) includes weakly to strongly deformed sub-solidus porphyroblasts that exhibit elongate forms parallel to the primary foliation, with common inclusions of quartz, muscovite and biotite. Some Ky2 grains are overgrown by fibrolite or display secondary muscovite and andalusite (And2) overgrowths along fractures (Figs. 4a, b, e, f, h, i, k). The rare peritectic kyanite (Ky3) incorporates sub-rounded, polymineralic quartz inclusions and is mantled by cuspate quartz lenses. These microstructures are interpreted to record crystallization under melt-present conditions (Fig. 4g). Andalusite grains are texturally classified into two populations: And1, larger grains characterized by quartz and muscovite inclusions and deformation-warped morphologies, and And2, smaller grains concentrated along corroded kyanite margins (Figs. 4a, e, j, k).
The matrix is dominated by recrystallized granoblastic quartz exhibiting amoeboid grain boundaries, grain boundary migration textures and quartz ribbons, indicative of dynamic recrystallization during deformation (Figs. 4a, h). Flaky muscovite and biotite define the principal foliation and occasionally exhibit mica fish structures. Muscovite-quartz symplectite occasionally occurs in some microdomains (Fig. 4l). Accessory phases include apatite, monazite, zircon, rutile, ilmenite and disseminated graphite.
4.a.2. Sample GMS2
Sample GMS2 is characterized by coarse garnet porphyroblasts measuring up to 1.5 cm, exhibiting skeletal morphologies and enclosed by dynamically recrystallized quartz grains (Fig. 5a). The rims of large garnet crystals commonly interface with relict kyanite and andalusite grains (Fig. 5a). Large poikiloblastic staurolite grains, occur within the cores of many garnet porphyroblasts; these staurolite cores often contain inclusions of chlorite-I, muscovite-I and quartz (Figs. 5a, b). Garnet rims preferentially preserve kyanite, rutile and quartz inclusions, signifying progressive garnet growth through prograde metamorphism (Fig. 5c).
The primary foliation in the matrix is defined by well-aligned muscovite and biotite (Fig. 5a). Microstructural studies reveal that kyanite grains in the studied metapelites can be classified into four distinct types. Kyanite 1 (Ky1) represents older, relict sub-solidus grains, often preserved as inclusions within larger garnet rims, and occurs as corroded individual crystals, occasionally overgrown by a coronal rim of secondary And2 (Fig. 5c, h). Kyanite 2 (Ky2) consists of elongated weakly to strongly deformed sub-solidus porphyroblasts that are parallel to pervasive foliation. They commonly host inclusions of quartz, muscovite and biotite, consistent with syn-tectonic growth. These are frequently overgrown by sillimanite (fibrolites) and muscovite (Fig. 5d, f, g). Kyanite 3 (Ky3) is characterized by sub-rounded, polymineralic quartz inclusions, indicative of a peritectic origin (Fig. 5e). The newly crystallized kyanite grains, Kyanite 4 (Ky4), are distributed within leucocratic domains and remain unaffected by deformation (Fig. 5e).
Andalusite porphyroblasts have complex textures and form two groups: And1 includes many larger, irregular grains with quartz inclusions and fibrolite margins (Figs. 5a, i, j), and And2 consists of smaller, thin overgrowths near corroded kyanite (Ky1) in a quartz matrix (Fig. 5h). Thin melt films are also found between And1 and kyanite grains (Fig. 5d).
Quartz dominates the matrix relative to plagioclase and exhibits an amoeboid granoblastic texture, recrystallized quartz ribbons and grain boundary migration fabrics (Fig. 5a). Accessory mineral phases identified include apatite, monazite, zircon, rutile, ilmenite and graphite.
4.b. Mineral chemistry
4.b.1. Garnet
The garnet composition is of the almandine type in GMS1 and GMS2. In GMS1, the core composition of the garnet is as follows: XPyp [Mg/(Mg+Fe+Ca+Mn)] = 0.12–0.17, XAlm [Fe/(Mg+Fe+Ca+Mn)] = 0.74–0.79, XGrss [Ca/(Ca+Mg+Fe+Mn)] = 0.07–0.09 and XSpss = [Mn/(Mn+Ca+Fe+Mg)] = 0.02–0.04. Similarly, the rim composition of the garnet porphyroblasts shows the following chemical compositions: XPyp = 0.14–0.17, XAlm = 0.74–0.75, XGrss = 0.08–0.09 and XSpss = 0.009–0.014.
The large porphyroblasts of garnet in GMS2 show distinct chemical zonation with an Mn-rich core (up to 0.04 mole) and an Mn-depleted rim structure. Chemically, the core composition of the garnet porphyroblast exhibits XPyp: 0.12–0.16, XAlm: 0.75–0.80, XGrss: 0.06–0.08 and XSpss: 0.02–0.03. Similarly, the rim composition of the garnet porphyroblasts shows the following chemical compositions: XPyp = 0.14–0.17, XAlm = 0.74–0.79, XGrss = 0.06–0.10 and XSpss = 0.02–0.03 mole.
A garnet profile was constructed to investigate compositional variation along a-a’ in GMS2 (EPMA traverse, profile length 0.0–0.8 cm, rim-core-rim) for Fe, Mg, Ca and Mn (Fig. 6a). It is observed that the garnet shows an almost homogeneous composition in Mg and Fe, with a slight enrichment in Ca at the rim (Fig. 6b). In contrast, the XGrss composition is depleted at the rim and enriched at the core of the garnet porphyroblast (Fig. 6b). The near homogeneity of Fe, Mg and Ca, along with weak Mn zoning in garnet, indicates partial chemical homogenization at high temperatures, which reduces the core–rim compositional gradients typically used to reconstruct detailed P–T paths (Caddick et al. Reference Caddick, Konopa´sek and Thompson2010; Spear & Florence, Reference Spear and Florence1992; La Roche et al. Reference La Roche, Gervais, Tremblay, Crowley and Ruffet2015). Consequently, thermobarometric estimates based on garnet rims may reflect re-equilibrated or averaged conditions rather than true peak metamorphism, potentially underestimating maximum temperature. The garnet crystal shown in Fig. 6a (∼1.2 cm diameter) exhibits blurred Fe–Mg–Mn–Ca zoning, consistent with prolonged high-temperature residence and diffusion-induced modification during peak metamorphism.
(a) X-ray element maps of garnet for Fe, Mg, Ca and Mn in GMS2; (b) chemical profiles showing garnet rim–core–rim (r-c-r) variations for Fe, Mg, Ca and Mn.

4.b.2. Staurolite and chlorite
Staurolite is rare in GMS1 compared to GMS2. It constitutes less than 1% of the total minerals observed and is absent in the matrix of both rock samples. The XMg and XFe of staurolite are 0.17–0.19 and 0.80–0.83, respectively. The large staurolite grains also include chlorite (Chl-I) and graphite in GMS2. However, staurolite is absent at the garnet core in GMS1. Additionally, chlorite-(Chl-II) is rare and observed along the margin of matrix biotite, indicating low-temperature overprinting. In GMS2, the XMg of Chl-I is 0.53, and the XMg of Chl-II is 0.69. Similarly, in GMS1, the XMg of Chl-II is between 0.60–0.62. Chl-I, being less Mg-rich, likely represents a prograde chlorite phase formed during prograde heating. In contrast, Chl-II, which is more Mg-rich and commonly observed along biotite margins, typically corresponds to retrograde chlorite formed during cooling and exhumation.
4.b.3. Biotite
In GMS1, biotite occurs at the contact of garnet along the foliation in the matrix, as an included phase in andalusite, and large kyanite is overgrown along the cleavage. All variants of biotite exhibit similar chemical compositions, with XMg varying between 0.56 and 0.58. In GMS2, biotite forms within the matrix, growing over kyanite along its cleavages and extending over muscovite. All the biotite variants have similar chemical compositions, with XMg between 0.53 and 0.60.
4.b.4. Muscovite
Muscovite is the dominant hydrous phase in both rock samples (GMS1 and GMS2), with Si content ranging from 3.14 to 3.18 apfu in GMS1 and 3.122 to 3.177 apfu in GMS2. In our study, Fe3+ in muscovite was calculated stoichiometrically as zero based on electron microprobe analyses, which measure total Fe but cannot differentiate between Fe2+ and Fe3+. Although recent studies (e.g., Forshaw & Pattison, Reference Forshaw and Pattison2021) have shown that muscovite can contain Fe3+, precise quantification requires advanced spectroscopic methods not commonly applied. Therefore, for consistency and simplicity, Fe in muscovite was treated as entirely Fe2+ in our thermodynamic modelling.
4.b.5. Plagioclase feldspar
Plagioclase feldspar is volumetrically minor in both rock types. Plagioclase compositions are predominantly andesine. In GMS1, XAb and XAn range from 0.66–0.68 and 0.32–0.33, respectively. In GMS2, XAb and XAn are ∼0.69 and 0.30–0.31, respectively.
4.c. Geothermobarometry
The metamorphic conditions of the aluminosilicate-bearing metapelites were constrained using conventional mineral-based thermobarometry combined with Ti-in-biotite thermometry. Textural evidence shows that garnet porphyroblasts are largely homogenized, while biotite records variable temperatures depending on microstructural setting. This indicates that much of the matrix biotite and grains adjacent to kyanite and garnet have re-equilibrated, and consequently, mineral-based thermobarometry most likely underestimates the true peak conditions. Although biotite inclusions in kyanite can provide estimates for peak metamorphic temperatures, the pervasive fracturing, kink bands and cleavage development within kyanite grains may facilitate post-peak partial re-equilibration, potentially leading to underestimation of the true peak metamorphic temperature.
Ti-in-biotite thermometry after Henry et al. (Reference Henry, Guidotti and Thompson2005), provides critical evidence for the re-equilibration temperature of biotite. In GMS1, biotite inclusions within kyanite yield the highest temperatures (∼640°C), closely approximating near-peak conditions (Fig. 7a). By contrast, matrix biotite records lower values (∼585°C), and grains adjacent to garnet yield ∼600°C, consistent with partial resetting during cooling (Fig. 7a). In GMS2, matrix biotite records ∼575°C, whereas grains near garnet and overgrowing kyanite yield ∼584°C (Fig. 7b).
(a, b) Box-and-whisker plots of Ti-in-biotite temperature estimates (after Henry et al. Reference Henry, Guidotti and Thompson2005) from different microstructural sites in GMS1 and GMS2; (c, d) near-peak P–T conditions derived from garnet–biotite thermometry and garnet–plagioclase–biotite–quartz and garnet–Al2SiO5–plagioclase–quartz barometry; (e, f) independent P–T estimates using the winTWQ program, showing reaction curves and inferred peak conditions.

Temperatures were estimated using the garnet–biotite thermometer of Holdaway (Reference Holdaway2000), and pressures were constrained using the GBPQ (GBPQ; Hoisch, Reference Hoisch1990a, b) and garnet–aluminosilicate–plagioclase–quartz (GASP; Holdaway, Reference Holdaway2001) barometers. For sample GMS1, near-peak conditions are estimated at T :650 ± 25°C and P: 6–8 kbar (Fig. 7c), while GMS2 yields similar temperatures T∼650 ± 25°C but slightly higher pressures of 6–9 kbar (Fig. 7d). Phase equilibria modelling with winTWQ (Berman, Reference Berman2007) refines these results: eight equilibria for GMS1 intersect at ∼7 kbar and ∼600°C (Fig. 7e), and four equilibria for GMS2 converge at ∼7.5 kbar and ∼600°C (Fig. 7f).
4.d. P-T Phase equilibrium analysis
This section details the phase equilibrium modelling of metapelite samples GMS1 and GMS2, as illustrated in Figs. 8 & 9. For GMS1, the phase topology shown in Fig. 8a. At ∼ 500°C, the assemblage Pl + Ms + Chl + Bt + Grt + St + Qz indicates the stability of staurolite and garnet. The peak metamorphic assemblage, Grt + Ms + Bt + Pl + Ky + Qz + Rt+ L, is confined to a narrow range of 7.5–9 kbar and reaches a maximum temperature of approximately 660–690°C, in Fig 8a. Fig. 8b displays the volume isopleths for garnet, biotite and plagioclase, with garnet volume increasing with pressure, while biotite and plagioclase volumes decrease with pressure. The compositional isopleths for garnet core and rim (XPyp, XGrs, XSps) help in predicting initial and peak metamorphic conditions, with intersections indicating stabilization of Grt core conditions at T ∼550°C and P ∼5.5 kbar, and peak metamorphic conditions at P ∼8.5 kbar and T ∼670°C, which is just above the solidus line (Fig. 8c). Notably, the lower pressure limit of the peak P-T field is controlled by both the ilmenite/rutile transition and kyanite stability, consistent with pressures >7 kbar as dictated by phase relations in this system.
P–T phase equilibrium modelling for GMS1: (a) P–T pseudosection from whole-rock composition showing peak assemblage Grt + Ky + Bt + Ms + Ilm + Rt + Qz + L; the dark vertical line at high temperature marks the melt-in boundary; (b) volume isopleths for garnet, biotite and plagioclase; (c) intersections of XMg and XCa garnet isopleths (core and rim) used to estimate initial and peak metamorphic conditions. Mineral abbreviations after Warr (Reference Warr2021).

P–T phase equilibrium modelling for GMS2: (a) P–T pseudosection showing peak assemblage Grt + Ky + Bt + Ms + Ilm + Rt + Qz + L; (b) volume isopleths for garnet, biotite and plagioclase; (c) intersections of XMg and XCa garnet isopleths (core and rim) used to estimate initial and peak metamorphic conditions. Mineral abbreviations after Warr (Reference Warr2021).

For GMS2, Fig. 9a shows the prograde phase topologies where garnet and staurolite are stable at relatively higher pressure ∼P∼5.5 kbar and T ∼550°C, as indicated by the assemblage Pl + Ms + Chl + Bt + Grt + St + Qz. The stability range of the peak metamorphic assemblage for GMS2, Grt + Bt + Ms + Pl + Ky + Qz + Rt +L is similar to GMS1, a stable range of 7.5–9 Kbar and reaches a maximum temperature of approximately 660–690°C, in the Fig. 9a. Figure 9b presents volume isopleths for garnet, biotite and feldspar, where garnet volume increases with pressure, while biotite and plagioclase volumes decrease. The initial prograde and peak metamorphic conditions of the prograde path for GMS2 are predicted using garnet core and rim compositional isopleths (XPyp, XGrs, XSps), with intersections showing stability of Grt core conditions at T ∼550°C and P ∼5.5 kbar, and peak metamorphic conditions at P ∼8.5 kbar and T ∼680°C, just above the solidus (Fig. 9c). As in GMS1, the lower P limit of the peak P-T field is constrained by both ilmenite/rutile and kyanite phase transitions, consistent with pressures above 7 kbar.
5. Discussion
5.a. Textural Interpretations and Stability of Aluminosilicates
The studied metapelites exhibit a diverse high-grade mineral assemblage dominated by garnet, aluminosilicates (kyanite, sillimanite and andalusite), staurolite and melt phases. Phase equilibrium modelling predicts a pre-Himalayan, low-pressure assemblage of And + Ms + Bt ± Grt + Pl + Qz + Ilm at 550–600°C. The P–T diagrams indicate minimal overlap between staurolite and andalusite stability, with garnet becoming stable above ∼3–3.5 kbar (Figs. 8a, 9a). The rare co-occurrence of kyanite, sillimanite and andalusite within the same rock reflects complex orogenic P–T–t histories involving multiple burial, heating, decompression and cooling episodes (Holdaway, Reference Holdaway1978; García-Casco & Torres-Roldán, Reference García-Casco and Torres-Rold´an1996; Cesare et al. Reference Cesare, Gomez-Pugnaire, Sanchez-Navas and Groberty2002; Whitney, Reference Whitney2002). Additionally, although rare, the co-occurrence of kyanite and andalusite has been documented in polymetamorphic terranes that experienced initial low-pressure/temperature metamorphism followed by subsequent medium-pressure/temperature metamorphism (Evans & Berti, Reference Evans and Berti1986; Sánchez-Navas et al. Reference Sánchez-Navas, Oliveira-Barbosa, García-Casco and Martín-Algarra2012).
Andalusite occurs primarily as relict porphyroblasts that are wrapped by the dominant foliation in both metapelite samples (Figs. 4a, 5a). Poikiloblastic staurolite is enclosed within garnet cores (Fig.5a), and in certain domains, kyanite-staurolite intergrowths are locally developed (Fig. 4b). The occurrence of staurolite within garnet cores may reflect either a polycyclic or monocyclic metamorphic history. Polycyclic staurolite typically appears as isolated inclusions in garnets, lacks alignment with sigmoidal S1 inclusion trails, and is absent from the matrix, indicating relicts of an earlier metamorphic event passively entrapped during garnet growth (Robyr, Reference Robyr2023; Passchier & Trouw, Reference Passchier and Trouw2005). In contrast, staurolite in the present study occurs as inclusions within large garnets that lack S1 fabrics and is accompanied by minor matrix kyanite intergrowths. These observations suggest crystallization during late prograde to near-peak Himalayan metamorphism, broadly coeval with major garnet porphyroblast growth, consistent with a monocyclic origin for the staurolite. However, the preservation of relict andalusite porphyroblasts suggests an early metamorphic event likely corresponding to pre-Himalayan low-pressure, high-temperature conditions within the andalusite stability field. This event is probably related to Cretaceous magmatism associated with the Lohit Plutonic Complex in northeastern India (Haproff et al. Reference Haproff, Zuza, Yin, Harrison, Manning, Dubey, Ding, Wu and Chen2019, Reference Haproff, Levy, Zuza, Hooker, Heizler, Stockil and Braza2023; Bikramaditya et al. Reference Bikramaditya, Chung, Singh, Lee, Lin and Iizuka2020). Collectively, the co-occurrence of these mineral assemblages and their textures more likely reflects a complex polycyclic metamorphic history rather than a monocyclic one, consistent with our petrographic observations.
The subsequent Himalayan metamorphic phase is characterized by Barrovian-type metamorphism, as evidenced by garnet porphyroblast growth in metapelites and the stability of kyanite, which indicates peak burial conditions. In high-aluminium pelites, staurolite preferentially facilitates prograde metamorphic reactions relative to andalusite owing to its broader stability range and its role as a key reactant during garnet growth. Textural evidence shows staurolite preserved mainly as porphyroblastic cores within garnet, highlighting its active involvement in decomposition reactions that provide the necessary components for garnet formation during prograde metamorphism. In contrast, andalusite frequently persists as large relict porphyroblasts, reflecting its limited role in complete transformation to kyanite, probably due to kinetic constraints and microtextural shielding that inhibit full reaction progress, resulting in the survival of sizable andalusite porphyroblasts. Supporting this, Palin et al. (Reference Palin, Searle, Waters, Horstwood and Parrish2012) documented relict andalusite in the Karakoram metamorphic complex, northwest Himalaya, interpreting it as a remnant of an earlier low-pressure thermal event linked to granite magmatism circa 105 Ma, distinct from subsequent kyanite-grade metamorphism dated around 28 Ma. Pattison & Spear (Reference Pattison and Spear2018) emphasized the kinetic favourability of early kyanite nucleation owing to small free-energy differences and structural similarity between staurolite and kyanite, leading to kyanite growth in parallel with staurolite. Unlike the common Barrovian sequences of overlapping growth intervals for staurolite and kyanite, in our study, staurolite is largely enclosed by late garnet growth, with relatively minor early kyanite (Ky1). This suggests a prograde trajectory dominated by increasing pressure, as supported by garnet volume isopleths and phase boundaries (Figs. 8a,b and 9a,b). Significant garnet growth occurring up-pressure within the staurolite (St) and kyanite (Ky) stability fields results in staurolite being mostly enclosed within garnet, while most kyanite growth appears near the equilibrium St-Ky transition at ∼ 8 kbar. In contrast, in many classic Barrovian sequences, staurolite and kyanite overlap in their growth intervals (cf. Pattison and Spear, Reference Pattison and Spear2018), which may reflect a prograde path dominated more by increasing temperature with relatively less garnet growth. Progressive staurolite breakdown promoted garnet growth (Fig. 5a), consistent with the following metamorphic reaction.
 $${\rm{St}} + {\rm{Ms}} + {\rm{Qz}} \to {\rm{ Grt}} + {\rm{Bt}} + {\rm{Ky}} + {{\rm{H}}_2}{\rm{O}}$$
Microstructural evidence from the studied metapelite samples, including the presence of peritectic kyanite, discrete melt films and sillimanite over muscovite, provides clear indicators of incipient melting, particularly melting associated with muscovite-dehydration (Fig. 4g-j; & Fig. 5d-g). The breakdown of muscovite in these rocks may be represented by the following dehydration melting reactions:
 $${\rm{Ms}} + {\rm{Qz}} + {\rm{Pl}} \to {\rm{Melt}} + {\rm{Kfs}} + {\rm{A}}{{\rm{l}}_2}{\rm{Si}}{{\rm{O}}_5}$$
The presence of muscovite coronas overgrowing kyanite and fibrolites is consistent with melt back reactions with aluminosilicate after Kriegsman, (Reference Kriegsman2001) (Figs. 4i, 5g), such as:
 $${\rm{Melt}} + {\rm{A}}{{\rm{l}}_2}{\rm{Si}}{{\rm{O}}_5} \to {\rm{Ms}} + {\rm{Qz}} + {\rm{Pl}} + {{\rm{H}}_2}{\rm{O}}$$
These textures indicate that dehydration melting was internally buffered and limited in extent, producing only small volumes of melt that were largely retained within the rock.
Sillimanite occurs as overgrowths on kyanite porphyroblasts (Figs. 4h;5f, g). Although direct transformation of kyanite to sillimanite is rare, their coexistence is a well-documented feature of post-peak retrograde metamorphism in high-grade terranes globally (Carmichael, Reference Carmichael1969). Similarly, sillimanite commonly forms as acicular fibrolite aggregates or rims around muscovite (Chinner, Reference Chinner1961), a characteristic of muscovite-dehydration melting (Fig. 4h).
5.a.1. Multistage Kyanite growth and stability of Andalusite
Recent research increasingly highlights the complex multistage growth history of kyanite in high-grade metapelites through detailed microstructural investigations (Iaccarino et al. Reference Iaccarino, Montomoli, Carosi, Massonne, Langone and Visona2015; Phillips et al. Reference Phillips, Argles, Warren, Harris and Kunz2023; Nerone et al. Reference Nerone, Groppo, Ágreda-López, Petrelli and Rolfo2025). In this study, microstructural analysis of the GMS1 and GMS2 metapelite samples reveals a polyphase history of kyanite development linked closely to progressive metamorphism, deformation and partial melting.
In GMS1, kyanite grains are classified into three principal types based on morphology, microstructural characteristics and spatial relationships: (i) older, relict sub-solidus grains (Ky1), predominantly preserved as inclusions within garnet rims and as corroded grains accompanied by subordinate andalusite (And2) in leucocratic domains, indicating early prograde growth prior to melt generation and subsequent cooling (Fig. 10a); (ii) sub-solidus porphyroblasts (Ky2) with elongate morphologies, often fractured due to intense shear deformation, aligned closely parallel to the primary foliation and containing inclusions of quartz, muscovite, biotite and rare staurolite consistent with prograde development (Figs. 4b, e, f and 10a). Some Ky2 grains display overgrowths of fibrolite and muscovite formed during retrograde exhumation (Fig. 10a); and (iii) relatively rare peritectic kyanite (Ky3) contains sub-rounded, polymineralic quartz inclusions (Figs. 4g, 10a), consistent with growth during muscovite-dehydration melting in which quartz participates as a reactant in both melting reactions. These inclusions are typical of peritectic phases that entrap their reactants (e.g. Phillips et al. Reference Phillips, Argles, Warren, Harris and Kunz2023; Cesare et al. Reference Cesare, AcostaVigil, Bartoli and Ferrero2015; Dyck et al. Reference Dyck, Waters, St-Onge and Searle2020; Erdmann et al. Reference Erdmann, Scaillet and Kellett2012). Moreover, cuspate quartz lenses developed along the margins of poikiloblastic kyanite (Fig. 4g, 10a) are interpreted as former melt pockets now replaced by quartz (Holness and Sawyer, Reference Holness and Sawyer2008; Holness et al. Reference Holness, Cesare and Sawyer2011; Sawyer Reference Sawyer1999; Vernon Reference Vernon2011).
Cartoons illustrating different kyanite types (subsolidus, melt-related and magmatic) based on microstructural evidence for GMS1 and GMS2.

The GMS2 sample exhibits a diverse assemblage of kyanite types, reflecting a complex growth history (Fig. 10b). Inherited Ky1 grains are preserved at the margins of garnet porphyroblasts, while porphyroblastic Ky2 grains include both kinked and highly deformed varieties. Additionally, some corroded Ky1 grains are overgrown by coronal andalusite (And2) (Figs. 5h and 10b). The assemblage contains rare peritectic kyanite (Ky3) with irregular shapes and polymineralic quartz inclusions, and cuspate quartz lenses along grain margins, interpreted as resulting from kyanite growth in the presence of melt (Figs. 5e, 10b). Finally, undeformed late-stage magmatic kyanite crystals (Ky4), crystallized from residual melt, are found within granoblastic quartz domains (Figs. 5h and 10b).
Different generations of andalusite are observed within the studied metapelites. In sample GMS1, andalusite grains are texturally classified into two populations: And1, larger grains characterized by quartz and muscovite inclusions and deformation-warped morphologies, and And2, smaller grains concentrated along corroded kyanite margins (Figs. 4a, e, j, k). The relict And1 population likely represents an older Cretaceous metamorphic event, while the younger And2 population reflects post-peak Himalayan metamorphism associated with cooling, decompression and crystallization from residual melt solidification. Similarly, in GMS2, the relict andalusite (And1) populations correspond to the older Cretaceous event, whereas the younger And2 occurs as coronas over Ky2, representing the post-peak Himalayan metamorphic stage associated with cooling and exhumation. The larger porphyroblasts of andalusite (And1) in GMS2 are further characterized by resorbed and irregular boundaries with abundant polymineralic quartz inclusions and fibrolitic margins, interpreted as static growth during late-stage cooling (Figs. 5i, j). Smaller And2 in GMS2 frequently occur as overgrowths along deformed kyanite margins, reflecting recrystallization from Al2SiO5 rich melts during cooling within the andalusite stability field associated with exhumation (Fig. 5h). Rare microstructural evidence also suggests partial polymorphic transformation of kyanite to andalusite during decompression and ductile deformation-facilitated retrograde metamorphism (Fig. 4i). However, due to the subtle and localized nature of this reaction, it remains a subject of debate warranting further investigation (Kerrick, Reference Kerrick1986; Doukhan et al. Reference Doukhan, Doukhan, Koch and Christie1985; Grambling, Reference Grambling1981).
5.b. Metamorphic P–T path and tectono-thermal evolution
Microstructural, mineralogical and P-T studies indicate that the metapelites record two distinct metamorphic events. The earlier stage is interpreted as a low-pressure, high-temperature event, likely related to contact metamorphism, while the subsequent Himalayan phase is characterized by Barrovian-type conditions, as evidenced by garnet porphyroblast growth and kyanite stability at peak burial, followed by features associated with decompression. Figure 11 synthesizes the proposed tectono-metamorphic evolution, illustrating (a) pre-Himalayan contact metamorphism, (b) prograde Himalayan Barrovian metamorphism and associated partial melting and (c) subsequent decompression and cooling. Panel (d) provides a summary table outlining the temporal relationships among the different generations of the representative mineral phases.
Schematic diagram summarizing the temporal evolution of mineral phases in the studied metapelites. Panels (a–c) show progression from (a) pre-Himalayan (Cretaceous?) magmatism and associated mineral assemblages, (b) syn-to post-Himalayan prograde metamorphism with partial melting, multiple kyanite generations, garnet growth and melt-related textures, to (c) exhumation and cooling marked by development of andalusite coronas (And2) around corroded Kyanite (Ky1), muscovite–sillimanite coronas over Kyanite (Ky2). Panel (d) summarizes microtextural positions and inferred relative timing of key minerals, highlighting a complex polyphase metamorphic history involving burial, heating, decompression and cooling.

The Lohit thrust shear zone exhibits a predominantly sub-vertical geometry and is characterized by north-side-up kinematics (Haproff et al. Reference Haproff, Odlum, Zuza, Yin and Stockli2020; Salvi et al. Reference Salvi, Mathew, Kohn, Pande and Borgohain2020). This structural geometry is believed to have resulted from rotational movement, potentially originating from an initial north-dipping orientation during the late Miocene duplexing at shallower/deeper crustal levels (Haproff et al. Reference Haproff, Odlum, Zuza, Yin and Stockli2020; Salvi et al. Reference Salvi, Mathew, Kohn, Pande and Borgohain2020). Haproff et al. (Reference Haproff, Levy, Zuza, Hooker, Heizler, Stockil and Braza2023) further proposed that crustal thickening along the southern margin of the Lhasa terrane, within the northern Indo-Burma Ranges, is primarily concentrated along the Lohit thrust shear zone, which extends approximately 5 km in width, and the Lohit thrust fault, which is located near the base of the shear zone. Geothermobarometric studies on migmatitic orthogneiss of the WLPC in the Dibang Valley indicate peak P–T conditions of ∼8.5 ± 3.6 kbar (equivalent to a depth of ∼32 km) and ∼665 ± 153°C for amphibole-bearing orthogneisses located along strike from the metapelite samples analysed in this study (Fig. 1c) (Haproff et al. Reference Haproff, Levy, Zuza, Hooker, Heizler, Stockil and Braza2023). In addition, mylonitic orthogneiss from the Lohit thrust shear zone yields conditions consistent with greater structural depth, at 9.7 ± 0.8 kbar and 725 ± 58°C (∼36 km depth). By contrast, a lower-grade metadiorite (Fig. 1c), characterized by clinozoisite and retrograde features, records conditions of 4.3 ± 0.9 kbar (∼16 km depth) and 476 ± 42°C – temperatures close to the Al2SiO5 triple point. These data indicate that cooling of the LPC rocks occurred between ∼25 and ∼10 Ma, likely driven by exhumation associated with slip along the Lohit thrust shear zone (Haproff et al. Reference Haproff, Levy, Zuza, Hooker, Heizler, Stockil and Braza2023). Additionally, geothermobarometric analysis of samples from the Tidding mélange complex suggests upper amphibolite-facies metamorphism, with peak temperatures exceeding 600°C and burial depths of ∼34–39 km (9–10.4 kbar). These findings closely resemble those of the Mayodia mélange complex, which records amphibolite-facies conditions at a depth of around 27–28 km (Ghosh and Ray, Reference Ghosh and Ray2003a, Reference Ghosh and Ray2003b; Ghosh et al. Reference Ghosh, Mahoney and Ray2007).
Phase equilibrium modelling predicts that the early Cretaceous low-pressure, high-temperature metamorphism produced an assemblage of andalusite (relict porphyroblast) + muscovite + biotite ± garnet + plagioclase + quartz + ilmenite at 550–600°C, with garnet stability limited to pressures below approximately 3–3.5 kbar (Figs. 8a, 9a). In contrast, subsequent Himalayan metamorphism of the same metapelites from the WLPC in the Dibang Valley indicates a clockwise P–T trajectory (Fig. 12). This path indicates initial heating (field-1) and compression, culminating in a peak near the solidus (field-2). Following peak metamorphism, the rocks underwent near-isothermal decompression, succeeded by further decompression and gradual cooling during the retrograde phase (field-3). The present study provides P-T estimates indicating that the prograde segment of the P-T path is marked by a substantial increase in pressure, ranging from ∼5 kbar to 9 kbar, followed by rapid erosion and decompression while maintaining a relatively stable temperature range of 550–600°C. The formation of garnet cores marks the early prograde metamorphic conditions, with pressures of ∼5.5 kbar and temperatures around 550°C. The peak metamorphic conditions, corresponding to upper amphibolite-facies, were attained at ∼8.5 kbar and ∼670°C (just above the solidus), leading to the stabilization of garnet rims (Fig. 12). This peak metamorphic event was subsequently followed by near-isothermal decompression near the solidus (Fig. 12), signifying the onset of retrograde metamorphism of the studied rocks. The estimated peak metamorphic conditions derived from this study corroborate well with those of the migmatitic orthogneiss from the WLPC, mylonitic orthogneiss of the Lohit shear zone, and Tidding mélange (Fig. 12). Similarly, a comparable low-temperature, high-pressure peak metamorphic event is recorded in the Milin Schist of the Eastern Himalaya, with kyanite-bearing schists reaching conditions of ∼670°C and ∼8.8 kbar at 22–21 Ma (Li et al. Reference Li, Yin, Yakymchuk, Ding, Li, Qian, Gao and Zhang2024). The Milin Schist, located adjacent to the suture zone on the western side of the Namche Barwa syntaxis, is not directly analogous to the present study area; however, the timing of peak metamorphism and closure of isotopic systems there is likely younger. In contrast, the peak metamorphic conditions inferred for the samples in this study are likely older than 25 Ma, based on existing geochronological constraints related to exhumation and cooling along the Lohit Thrust (Haproff et al. Reference Haproff, Levy, Zuza, Hooker, Heizler, Stockil and Braza2023). The final cooling of the metapelites is constrained by Ti-in-biotite geothermometry, which yields a temperature range of 560–600°C. Pressure estimates align with the stability of secondary andalusite (And2) surrounding corroded kyanite (Ky1) (Fig. 10a, b) and along the margins of primary andalusite (Fig. 5i, j, And1), where partial growth or recrystallization suggests a late-stage static or retrograde process during cooling. This cooling event is consistent with evidence for retrograde metamorphism in metadiorite within the WLPC (4.3 ± 0.9 kbar, ∼16 km depth) at 476 ± 42°C, temperatures close to the Al2SiO5 triple point, and likely correlates with the thermal evolution of the Lohit Plutonic Complex, which experienced exhumation and cooling between approximately 25 and 10 Ma (Haproff et al. Reference Haproff, Levy, Zuza, Hooker, Heizler, Stockil and Braza2023).
Clockwise P–T path for the metapelite samples showing prograde, peak and retrograde stages. Comparison with existing P–T estimates for the LPC (after Haproff et al. Reference Haproff, Levy, Zuza, Hooker, Heizler, Stockil and Braza2023) highlights the relative metamorphic evolution of the metapelite enclaves.

5.c. Incipient melting in the metapelites
The metapelites within the WLPC record two primary metamorphic phases (Fig. 1c). The early pre-Himalayan phase represents burial and heating associated with Cretaceous magmatism and crustal thickening near the Lohit Plutonic Complex (Haproff et al. Reference Haproff, Zuza, Yin, Harrison, Manning, Dubey, Ding, Wu and Chen2019, Reference Haproff, Levy, Zuza, Hooker, Heizler, Stockil and Braza2023). The subsequent syn-to post-Himalayan phase is characterized by prograde Barrovian metamorphism, reaching peak conditions of approximately 8.5 kbar and 670°C.
Incipient partial melting is mainly attributed to muscovite-dehydration melting under fluid-limited conditions. Supporting evidence includes the preservation of prograde muscovite with minor retrograde fringes and its partial replacement by fibrolitic sillimanite in localized domains (Figs. 4g, h, 5e). These textures signify dehydration reactions that release structurally bound water near the solidus (Dyck et al. Reference Dyck, Waters, St-Onge and Searle2020). Other microstructural indicators include localized melt films, partial melt crystallization near grain boundaries (Fig. 5d), and polymineralic quartz inclusions in peritectic kyanite (Figs. 4g, 5e). Phase equilibrium modelling indicates partial melting just above the solidus at peak pressures (∼8.5 kbar) and temperatures ∼670°C (Fig. 8c &9c), which is consistent with isolated metapelite lenses within a south-verging crustal wedge. Furthermore, muscovite and sillimanite coronas surrounding kyanite (Fig. 5g) support the interpretation that melt reacted back with kyanite to form these coronas, primarily indicating in situ melt retention or consumption during cooling and decompression. This localized melting phenomenon, governed by crustal thickening and exhumation via thrust duplexing, aligns with Himalayan collisional orogenesis (Ding et al. Reference Ding, Zhong, Yin, Kapp and Harrison2001; Haproff et al. Reference Haproff, Zuza and Yin2018, Reference Haproff, Levy, Zuza, Hooker, Heizler, Stockil and Braza2023; Salvi et al. Reference Salvi, Mathew, Kohn, Pande and Borgohain2020).
6. Conclusions
The findings offer new constraints on microstructure, metamorphic conditions and processes in the northern Indo-Burma region,
-
1. The metapelites record an early pre-Himalayan low-pressure, high-temperature metamorphic event likely related to Cretaceous magmatism associated with the Lohit Plutonic Complex.
-
2. The second metamorphic event is a Himalayan Barrovian-type peak metamorphism characterized by burial to ∼8.5 kbar and temperatures ∼670°C. Geothermobarometric and P-T phase equilibrium modelling indicate peak upper amphibolite-facies conditions followed by near-isothermal decompression and retrograde cooling, reflecting a clockwise P-T path controlled by crustal stacking and exhumation along the Lohit thrust shear zone.
-
3. Microstructural analyses of the metapelites reveal multistage kyanite growth linked to progressive metamorphism and partial melting. Sub-solidus kyanite started forming near-peak metamorphic conditions during prograde loading and heating, while peritectic and magmatic kyanite crystallized in association with melt-forming reactions. Andalusite is preserved both as pre-kinematic relics and as fine-grained retrograde products formed through annealing and polymorphic transformation during cooling and decompression. Textural and mineralogical evidence further supports localized, fluid-limited muscovite-dehydration melting during peak to early decompression. The resulting small melt volumes were largely retained within the metamorphic matrix, with melt-consuming reactions and secondary overgrowths documenting retrograde evolution consistent with in situ melting during tectonic thickening and initial exhumation.
-
4. These metamorphic processes correspond to sequential deformation and exhumation stages likely spanning ∼36 to ∼10 Ma, associated with thrust duplexing, crustal thickening and focused exhumation along the NE Himalayan collisional boundary.
Data availability statement
The data are available in the manuscript.
Acknowledgements
This research was partially supported by Institute Research Grants (IRG-2023 and IRG-2025) from Arya Vidyapeeth College (Autonomous), Guwahati-16, Assam, India. DS gratefully acknowledges the Principal of Arya Vidyapeeth College (Autonomous) for financial support and assistance throughout the project. The authors sincerely thank Prof. Tim Johnson (Executive Editor) and two anonymous reviewers of Geological Magazine for their constructive comments and suggestions, which substantially improved the quality of this manuscript. DS also thanks Dr. Pranjit Hazarika, Department of Geology, Gauhati University, India, for providing access to a microscope for initial petrological investigations. Most photomicrographs were obtained using the Leica D750P microscope in the Petrological Laboratory, Department of Geology, Arya Vidyapeeth College (Autonomous), funded by the DST-FIST Project No. SR/FST/COLLEGE-/2023/1373(G). DS further acknowledges Prof. Biswajit Mishra, Department of Geology and Geophysics, IIT Kharagpur, India, for providing the opportunity to conduct EPMA analyses, and Dr. Ashim Kumar Patel (PhD Scholar), Department of Geology and Geophysics, IIT Kharagpur, India, for his assistance during the EPMA analytical work.
Author contributions
Dicton Saikia: Fieldwork, sample collection, methodology, conceptualization, data generation and curation, textural interpretations, thermobarometric and P-T phase equilibrium modelling, software and graphical representations, writing (original draft) – review & editing, final compilation of the manuscript; all revisions; M.K. Ozha: review & editing. R. Shankar: XRF data generation, review & editing; B. Gogoi: Fieldwork, Sample collection in Arunachal Himalaya.
Financial support
Institute Research Grant (IRG-2023).
Competing interests
The research work has no conflict of interest.
Ethical standards
Not applicable.


 Open access