
5.1 Introduction
The importance of diamond to carbon in Earth is due to the fact that diamond is the only mineral and especially the only carbon mineral to crystallize throughout the silicate Earth – from the crust to the lower mantle. To study diamond is to study deep carbon directly throughout Earth, allowing us to see the inaccessible part of the deep carbon cycle. By using the properties of diamond, including its ability to preserve included minerals, important questions relating to carbon and its role in planetary-scale geology can be addressed:
What is the mineralogy of phases from Earth’s mantle transition zone and lower mantle?
What are the pressures and temperatures of diamond growth?
What is the chemical speciation of recycled and deep carbon?
What are the reactions that produce reduced carbon?
What are the sources of carbon and its associated volatiles (H2O, CH4, CO2, N2, NH3, and S)?
How do these findings vary with global-scale geological processes?
How have these processes changed over billions of years of geologic history?
Diamonds for scientific study are difficult to obtain and the nature of diamond presents special research challenges. Diamonds, whether they are lithospheric or sublithospheric (see the paragraph after next below), are xenocrysts in kimberlitic magma that travel a long path (as much as 150 to >400 km!) during eruption to Earth’s surface. On strict petrologic grounds, by the time a diamond reaches Earth’s surface, there is little direct evidence that it is related to any neighboring diamond. However, the suites of diamonds that occur in close spatial association at Earth’s surface in a mine may have similar physical characteristics and may also record similar pressure–temperature conditions and ages. If so, these features would suggest that the host kimberlite delivered a diamond suite to the surface from a spatially restricted mantle source hundreds of kilometers distant. Kimberlite magmas can transport some diamonds in mantle blocks that apparently disaggregate near the end of their upward journey. Nonetheless, each diamond and its inclusions is a case study unto itself until its association with other diamonds can be confirmed.
The Diamonds and Mantle Geodynamics of Carbon (DMGC) consortium was conceived early in the existence of the Deep Carbon Observatory (DCO) for the specific purpose of breaking down the traditional barriers to research on single diamonds and directing research toward global carbon questions. From the outset, the DMGC consortium focused on making cross-disciplinary research tools available, sharing samples so that more definitive results could be obtained, and enhancing intellectual stimulation across research groups so that new ideas would develop. The purpose of this chapter is to showcase results from the major collaborative research areas that have emerged within the DMGC consortium: (1) geothermobarometry to allow the depth of diamond crystallization and constraints on diamond exhumation to be determined (Section 5.2); (2) diamond-forming reactions, C and N isotopic compositions, and diamond-forming fluids to understand how diamonds form in the mantle (Section 5.3); (3) the sources of carbon either from the surface or within the mantle to provide information on the way carbon and other volatiles are recycled by global processes (Section 5.4); and (4) the mineralogy, trace element, and isotopic composition of mineral inclusions and their host diamonds to relate diamond formation to geologic conditions in the lithospheric and deeper convecting mantle (Section 5.5).
A general review and summary of diamond research can be obtained by consulting previous works.Reference Gurney, Helmstaedt, Richardson and Shirey1–Reference Stachel and Harris16 Much of this literature focuses on diamonds and the mineral inclusions that have been encapsulated when these diamonds crystallized in the subcontinental lithospheric mantle (SCLM). These so-called lithospheric diamonds can be classified as eclogitic or peridotitic (harzbugitic, lherzolitic, or websteritic) based on the composition of silicate or sulfide inclusions.Reference Stachel and Harris10, Reference Stachel and Harris16 Lithospheric diamonds crystallize at depths of around 100–200 km and temperatures of around 1160 ± 100°C.Reference Stachel and Harris16 Peridotitic diamonds typically have restricted, mantle-like C isotopic compositions, whereas eclogitic diamonds have more variable and sometimes distinctly lighter C isotopic compositions.Reference Cartigny8 Lithospheric diamonds are likely to contain appreciable nitrogen (mostly Type I; 0–3830 at. ppm, median = 91 at. ppmReference Stachel and Harris16). Their ages range from Cretaceous to Mesoarchean, but most are Proterozoic to Neoarchean.Reference Gurney, Helmstaedt, Richardson and Shirey1, Reference Pearson, Shirey, Lambert David and Ruiz7, Reference Shirey and Richardson17 The study of lithospheric diamonds has led to advances in understanding of the stabilization of the continents and their mantle keels, the onset of plate tectonics, and the nature of continental margin subduction, especially in the ancient past.
In the last two decades, attention has turned to the study of diamonds whose inclusion mineralogies and estimated pressures of origin put them at mantle depths well below the lithospheric mantle beneath continents. These “sublithospheric” or so-called super-deep diamonds can occur at any depth down to and including the top of the lower mantle (660–690 km), but a great many crystallize in the mantle transition zone (e.g. 410–660 km)Reference Stachel, Brey and Harris9, Reference Harte12, Reference Harte, Harris, Hutchison, Watt, Wilding, Fei, Bertka and Mysen18 at higher temperatures (between 100 and 400°C higher)Reference Anzolini19 than lithospheric diamonds. Unlike lithospheric diamonds, super-deep diamonds are not as easily classified as eclogitic or peridotitic. However, super-deep diamonds do carry mineral phases that are the high-pressure derivatives of basaltic and ultramafic precursors such as majorite or bridgmanite, respectively,Reference Harte12 so a petrologic parallel exists in super-deep diamonds with the eclogitic and peridotitic lithospheric diamond designation. Super-deep diamonds are typically low nitrogen (e.g. Type IIa or IIb) and display quite variable C isotopic compositions, even extending to quite light compositions (Section 5.4.2 and Ref. Reference Thomson20). Age determinations on super-deep diamonds are rare, but the few that existReference Bulanova21 support their being much younger than lithospheric diamonds – an expected result given the known antiquity of the continents and their attached mantle keels relative to the convecting mantle. The study of super-deep diamonds has led to advances in understanding of the deep recycling of elements from the surface (e.g. H2O, B, C, and S), the redox structure of the mantle, and the highly heterogeneous nature of the mantle transition zone.
Much of the research described in this chapter focuses on super-deep diamonds since the study of super-deep diamonds has the greatest relevance to the deep carbon cycle.
5.2 Physical Conditions of Diamond Formation
5.2.1 Measuring the Depth of Diamond Formation
An essential question is the depth at which a diamond forms. Geobarometry of diamonds based on the stability of their included minerals has provided important constraints on the deep carbon cycle. Application of these methods has yielded the whole range of depths from 110 to 150 km, corresponding to the graphite–diamond boundary in the lithosphere, to over 660 km, lying within the lower mantle.Reference Shirey14, Reference Beyer and Frost22–Reference Nestola25 Thus, these studies have provided direct evidence for the recycling of surficial carbon to lower-mantle depths. Traditional geobarometric methods, however, have several limitations: they can only be applied to rare types of mineral inclusions; touching inclusions may re-equilibrate after diamond growth; non-touching inclusions may be incorporated under different conditions and may not be in equilibrium; and protogenetic inclusionsReference Nestola26, Reference Milani, Nestola, Angel, Nimis and Harris27 may not re-equilibrate completely during diamond growth.
In order to avoid some of these drawbacks, alternative approaches that are independent of chemical equilibria are increasingly being explored. Elastic geobarometry is based on the determination of the residual pressure on the inclusion, Pinc, which builds up on an inclusion when the diamond is exhumed to the surface as a result of the difference in the elastic properties of the inclusion and host. If these properties are known and the entrapment temperature is derived independently or its effect is demonstrably negligible, then the entrapment pressure can be calculated back from the Pinc determined at room conditions. The idea of using Pinc to calculate entrapment conditions is not new,Reference Nimis28 but practical methods have recently been developed that allow more robust estimates of minerals with known elastic properties.Reference Angel, Mazzucchelli, Alvaro and Nestola29, Reference Mazzucchelli30 In principle, elastic geobarometry can be applied to any inclusion in a diamond if: (1) the inclusion–diamond interaction is purely elastic, otherwise only minimum estimates can generally be obtained; (2) the geometry of the inclusion–host system is properly considered; and (3) mineral-specific calibrations are available to calculate Pinc from X-ray diffraction or micro-Raman spectroscopy data. Contrary to common practice, calibrations should take into account the effect of deviatoric stresses, which typically develop in inclusion–diamond systems upon exhumation. For example, Anzolini et al.Reference Anzolini31 showed that only an accurate choice of Raman peaks could provide reliable estimates for a CaSiO3–walstromite inclusion in diamond, yielding a minimum formation depth of 260 km and supporting CaSiO3–walstromite as a potential indicator of sublithospheric origin. The effect of the presence of fluid films around the inclusions, which has recently been documented in some lithospheric diamonds,Reference Nimis32 still demands proper evaluation. In addition, the ability of diamond to deform plastically, especially under sublithospheric conditions, is well known, but methods to quantify any effects on elastic geobarometry are not available. Therefore, in many cases, only minimum estimates can be obtained. Nonetheless, we are now able to provide depth or minimum depth estimates for a number of new single-phase assemblages that would not be possible with more traditional methods. Future geobarometry of larger sets of diamonds, using both elastic and traditional approaches, will allow more comprehensive data to be gathered on the conditions for diamond-forming reactions and on the deep carbon cycle.
5.2.2 Thermal Modeling of Diamond in the Mantle from Fourier-Transform Infrared Spectroscopy Maps
The defects trapped in diamonds can be used to constrain estimates of the temperature that prevailed during the residence of a diamond in the mantle and can help constrain estimates of the return path of carbon to the surface. Pressure and temperature covary with depth in Earth, and the ability of the diamond lattice to record temperature history in its defect structure provides an additional independent constraint on estimates of mantle location. These measurements are therefore complementary to those on inclusions that can be used to determine the pressure and temperature conditions during the trapping of inclusions during diamond growth. The general concepts and calibration of a thermochronometer based on nitrogen defect aggregation are well established.Reference Taylor, Jaques and Ridd33 The technique is based on the kinetics of aggregation of pairs of nitrogen atoms (called A centers) into groups of four nitrogen atoms around a vacancy (called B centers) and measurement of these defect concentrations using Fourier-transform infrared (FTIR) spectroscopy. The FTIR spectroscopy method has long been used as one of the standard characterization techniques for diamonds, mostly for whole stones, but also as FTIR spectroscopy maps showing the distribution of defect concentrations across diamond plates.Reference Howell34, Reference Spetsius, Bogush and Kovalchuk35 Only recently has the full potential of FTIR spectroscopy for determining the thermal history of a diamond been recognized. The major recent developments have been: (1) improvements in the methods for acquiring and processing FTIR spectroscopy mapsReference Howell34; (2) a better understanding of the temperature history that is available from zoned diamondsReference Kohn, Speich, Smith and Bulanova36; and (3) unlocking the abundant information that is provided by the FTIR spectroscopy signal of platelets – planar defects created with B centers during nitrogen aggregation.Reference Speich, Kohn, Wirth, Bulanova and Smith37, Reference Speich, Kohn, Bulanova and Smith38
Figure 5.1a shows a map of “model temperatures” made up by automated fitting of several thousand FTIR spectra in a map of a diamond from Murowa, Zimbabwe. The higher temperatures in the core and lower temperatures in the rim reflect a growth and annealing history with at least two stages. The key idea is that the N aggregation in the rim only occurs during the second stage of annealing, but that N aggregation in the core occurs throughout the residence period of the diamond in the mantle (i.e. during both stages of annealing). Even if the date of rim growth is not known, there is an interplay between the temperatures of the two stages and the time of rim formation (Figure 5.1b). While these data provide a combination of time and temperature, if the dates of each stage of diamond formation are accurately known (by dating of inclusions) and the date of kimberlite eruption is known, the temperatures during the two stages can be determined. The model in Figure 5.1b assumes core growth at 3.2 Ga followed by a period of annealing, then rim growth and finally a second period of annealing. If a constant temperature prevailed throughout the history of the diamond’s residence in the lithosphere, the ages of the two periods of growth are 3.2 and 1.1 Ga. If the earlier history of the diamond was hotter, the overgrowth must be older. Using this method, the mean temperature variation over very long (billion-year) timescales at a specific location in the lithosphere can be determined.
(a) Example of a map of “model temperatures” made up by automated fitting of several thousand FTIR spectra in a map of a diamond from Murowa, Zimbabwe. Model temperatures are calculated using a single assumed mantle residence time. The higher model temperatures in the core and lower model temperatures in the rim reflect a growth and annealing history with at least two stages. (b) Modeling the possible combinations of temperature and time that could explain the FTIR spectroscopy characteristics of a zoned diamond from Murowa.Reference Kohn, Speich, Smith and Bulanova36

An alternative way to learn about the history of a diamond is to study the production and degradation of platelets. By comparing transmission electron microscopy and FTIR spectroscopy measurements on platelets, we now have a much better understanding of the meaning of the FTIR spectroscopy platelet peak characteristics (position, area, width, and symmetry) and how platelets evolve with thermal history.Reference Speich, Kohn, Wirth, Bulanova and Smith37, Reference Speich, Kohn, Bulanova and Smith38 In addition to diamonds with regular platelet behavior and irregular, platelet-degraded behavior, we have identified a new class of sub-regular diamonds with anomalously small platelets that have experienced unusually low mantle temperatures (below about 1120°C).
In summary, improvements in our understanding of the defects incorporated into diamonds will contribute to better quantitative models of carbon precipitation, carbon storage in the mantle as diamond, and carbon exhumation during continental tectonics. Indeed, advances in the correlation of spectral features with newly understood defect types may allow diamond to emerge as a prime mineral for studying the uplift and exhumation in the global tectonic cycle (e.g. Ref. Reference Smit, D’Haenens-Johansson, Howell, Loudin and Wang39).
5.3 Diamond-Forming Reactions, Mechanisms, and Fluids
5.3.1 Direct Observation of Reduced Mantle Volatiles in Lithospheric and Sublithospheric Diamonds
Some carbon in the deep Earth is not stored in crystalline silicates but as fluids such as highly mobile metallic and carbonatitic liquids or supercritical (also known as high-density) C-H-O fluids. As diamond is thought to crystallize from these species by different mechanisms, its study becomes a key way to understand these carbon-bearing fluids. Reduced volatiles in diamonds have only recently been identified,Reference Smit, Shirey, Stern, Steele and Wang40 although they have long been predicted.Reference Frost and McCammon41 Observations of reduced volatiles in any mantle sample are rare because they must avoid oxidation in the shallow mantle and crust on the way to Earth’s surface. Direct samples of these reduced volatiles are crucial to understanding the redox speciation of mantle fluids and melts since they influence both melt composition and physical properties such as solidus temperature, viscosity, and density.Reference Eggler, Baker, Akimoto and Manghnani42, Reference Green, Falloon, Taylor and Mysen43
Experimental results and thermodynamic modeling of C-H-O fluids at pressure and temperature and oxygen fugacities (fO2) relevant to the lithospheric mantle show that methane (CH4) is stable at 2 log units below the fayalite–magnetite–quartz buffer (∆ log fO2 (fayalite–magnetite–quartz buffer (FMQ)) < –2) and becomes the dominant C-H-O species at around ∆ log fO2 (FMQ) 4.5.Reference Matveev, Ballhaus, Fricke, Truckenbrodt and Ziegenben44, Reference Zhang and Duan45 At diamond-stable pressures, the lithosphere should typically have fO2 between FMQ = –2 and FMQ = –4,Reference Stagno, Ojwang, McCammon and Frost46 and the implication is that metasomatic and diamond-forming fluids should also generally be reduced.Reference Luth and Stachel47
Due to their metasomatic origin from fluids with CO2, CO3, or CH4 as the dominant carbon species,Reference Stachel, Harris and Muehlenbachs48 diamonds are the ultimate tracers of carbon cycling into the mantle. Mantle CH4 has recently been directly detected for the first time in diamond samples from both the lithospheric and sublithospheric mantle.Reference Smit, Shirey, Stern, Steele and Wang40, Reference Smith49 Diamond is the ideal carrier, since it shields any trapped reduced volatiles from oxygen exchange during its rapid transport to the surface. Analyses of reduced volatiles, along with any coexisting phases and the host diamonds, allow us to better understand the storage and transport of reduced volatiles into the mantle. These studies can also help us to evaluate whether methanogenesis occurs in the mantleReference Scott50 or whether mantle CH4 has a subducted origin.
Lithospheric diamonds (depths <200 km) from Marange (Zimbabwe) are rare, mixed-habit diamonds that trap abundant inclusions in their cuboid sectors and also contain octahedral sectors that grew simultaneously.Reference Smit, Shirey, Stern, Steele and Wang40 Confocal Raman imaging of the faster-grown cuboid sectors shows that they contain both crystalline graphite and CH4 inclusions (Figure 5.2). Both graphite and CH4 are evenly distributed throughout the cuboid sectors, usually but not always occurring together, a syngenetic texture that suggests that they co-crystallized along with diamond from the same C-H-O fluid. Clear octahedral sectors never contain graphite or CH4.
(a) Cathodoluminescence (CL) image of Marange diamond MAR06b,Reference Smit, Shirey, Stern, Steele and Wang40 showing core-to-rim secondary ion mass spectrometry analytical spots. (b) Raman map showing distribution of graphite and CH4 micro-inclusions in a homogeneously grown cuboid zone. (c) Outwardly decreasing nitrogen content (atomic ppm) with increasing δ13C (‰) in this same cuboid growth zone (red) and other cuboid growth zones (gray). The modeled trend (red dashed line) is for a CH4:CO2 ratio of 1:1 and assumes an initial δ13C for the fluid of –7.4‰. For an assumed water content of 98 mol.%, the observed variation corresponds to 0.7% crystallization of the entire fluid (and 35% of the carbon in the fluid).

In fluid inclusion-free diamonds, core-to-rim trends in δ13C and N content have been (and probably should not have been) used to infer the speciation of the diamond-forming fluid. Outwardly decreasing δ13C with decreasing N content is interpreted as diamond growth from reduced fluids, whereas oxidized CO2 or carbonate-bearing fluids should show the opposite trends. Within the CH4-bearing sectors of Marange diamonds, however, such reduced trends are not observed. Rather, δ13C increases outwardly within a homogeneously grown zone that also contains CH4 (Figure 5.2). These contradictory observations can be explained through either mixing between CH4- and CO2-rich end-members of hydrous fluidsReference Smit, Shirey, Stern, Steele and Wang40 or through closed-system precipitation from an already mixed CH4–CO2 H2O-maximum fluid.Reference Stachel, Chacko and Luth51 The relatively low δ13C value of the initial fluid (modeled at approximately –7.4‰),Reference Stachel, Chacko and Luth51 along with positive δ15N values (calculated using the diamond–fluid fractionation factor from Petts et al.Reference Petts, Chacko, Stachel, Stern and Heaman52), suggests that the CH4-rich Marange diamond source fluids may in part have been subduction derived.
Sublithospheric gem-quality monocrystalline diamonds from depths of between 360 and 750 km have also recently been found to contain inclusions with reduced volatile budgets.Reference Smith49 Specifically, iron- and nickel-rich metallic inclusions are consistently trapped along with CH4 (and H2) in large gem-quality monocrystalline diamonds. This suggests that C-H-O fluids in metal-saturated regions of the deep mantle are buffered to reduced compositions, either dissolved into metallic liquids or existing as CH4-rich fluids.
The key role of CH4 in the precipitation of diamond and its efficient transport through Earth’s mantle has long been inferred on petrological grounds,Reference Wyllie and Nixon53, Reference Taylor and Green54 but it is through these studies on Zimbabwe and sublithospheric diamonds that we now have the first observations of this important fluid species. Further investigation of fluid species in diamonds are needed: (1) to establish the frequency of the involvement of reduced volatiles in diamond formation; and (2) to differentiate the geological environments where transport of carbon and diamond precipitation involves CH4-rich fluidsReference Thomassot, Cartigny, Harris and Viljoen55 versus carbonate-rich fluids or melts.Reference Walter56, Reference Thomson, Walter, Kohn and Brooker57
5.3.2 Redox-Neutral Diamond Formation and Its Unexpected Effect on Carbon Isotope Fractionation
Using models of diamond crystallization from fluids of specific composition, the variation of carbon isotopic compositions across a diamond crystal can be used to estimate fluid composition, interaction with fluid-hosting wall rock, and C source characteristics. This approach has been applied most successfully to lithospheric diamonds. Studies of garnet peridotite xenolithsReference Stagno, Ojwang, McCammon and Frost46, Reference Luth and Stachel47 demonstrate that subcratonic lithospheric mantle typically lies on the reducing side of the fO2 of the EMOD buffer (enstatite + magnesite → olivine + diamond: the transition from carbonate- to diamond-bearing peridotite), but well above that of the IW buffer (iron → wüstite: where native iron becomes stable). Consequently, in the deep lithospheric mantle, carbon will generally be stored as diamond rather than carbonate or carbide. From the study of mineral inclusions in diamond, we know that strongly depleted harzburgite and dunite are the principal (∼56%) diamond substrates in lithospheric mantle. On this basis, we set out to address two fundamental questions: (1) in what form is carbon transported to lithospheric diamond substrates? And (2) what exactly is the process that drives the conversion of carbon-bearing fluid species into elemental carbon?
Luth and StachelReference Luth and Stachel47 modeled that <50 ppm O2 has to be removed from or added to depleted cratonic peridotite to move its oxidation state from the EMOD to the IW buffer (or vice versa). This extremely low buffering capacity of cratonic peridotites has two important implications: (1) the redox state of subcratonic lithospheric mantle is fluid buffered and, consequently, studies of peridotite xenoliths can only reveal the redox state of the last fluid with which they interacted; and (2) redox reactions buffered by depleted cratonic peridotite cannot explain the formation of large diamonds or large quantities of diamonds (per volume unit of peridotite).
At the typical fO2 conditions of diamond-stable cratonic peridotite (∆ log fO2 (FMQ) = –1.5 to –3.5), C-H-O fluids will be water rich (90–99 mol.%) with minor amounts of CH4 and CO2. During cooling or ascent along a geotherm (cooling plus decompression), such near-water-maximum fluids precipitate diamond isochemically, without the need for oxygen exchange with their peridotitic wall rocks.Reference Luth and Stachel47, Reference Stachel and Luth58 At conditions just below the EMOD buffer (∆ log fO2 (FMQ) = –1.5 to –2.4, at 5 GPa and 1140°C), diamond precipitation can occur by the oxygen-conserving reaction:
 (5.1)
(5.1)At more reducing conditions (∆ log fO2 (FMQ) ≤ –3), ascending fluids may precipitate diamond via a second redox-neutral reaction:
 (5.2)
(5.2)These modes of isochemical diamond precipitation require that fluids remain relatively pure (i.e. that progressive dilution of the fluid through addition of a melt component does not occur). For water-maximum fluids ascending along a normal cratonic geotherm (40 mW/m2),Reference Hasterok and Chapman59 this condition is only met for harzburgite and dunite, whereas the higher melting temperatures of peridotite in the presence of more reducing fluids permits the reaction in Eq. (5.2) to occur in lherzolites as well.Reference Stachel and Luth58
In such fluid-buffered systems, the fractionation of carbon isotopes during diamond growth occurs in the presence of two dominant carbon species in the fluid: either CH4 + CO2 or CH4 + C2H6. The equations to model Rayleigh isotopic fractionation in these multi-component systems (RIFMS) were developed by Ray and RameshReference Ray and Ramesh60 and applied to the geologically likely case (based on xenolith fO2 measurements) of diamond precipitation from ascending or cooling near-water-maximum fluids (reaction 1).Reference Stachel, Chacko and Luth51
Calculations revealed unexpected fundamental differences relative to diamond crystallization from a single carbon fluid species:
(1) Irrespective of which carbon species (CH4 or CO2) dominates the fluid, diamond crystallization from mixed CH4–CO2 fluids will always lead to minor (<1‰) enrichment in 13C as crystallization proceeds. In contrast, diamond precipitation through wall rock-buffered redox reactions from a fluid containing only a single carbon species can result in either progressive 13C enrichment (CO2 or carbonate fluids) or 13C depletion (CH4 fluids) in diamond. These two contrasting models of diamond formation can be tested through δ13C–N content profiles in individual diamonds as the mixed fluid model predicts that zoning profiles should be characterized by progressive 13C enrichments, whereas the single fluid redox model predicts both 13C enrichments and depletions, depending on whether the fluids are oxidized or reduced. Notably, the available zoning profile data are more consistent with the mixed fluid model in that coherent trends in δ13C values almost invariably involve rimward enrichments in 13C and total variations within individual growth zones (i.e. zones precipitated from a single fluid pulse) are generally small (<1‰).
(2) Because all mantle-derived fluids should have mantle-like δ13C values near –5‰ irrespective of their redox state, fluid speciation exerts the principal control on diamond δ13C values. For example, the δ13C value of the first diamond precipitated from a relatively oxidized CO2–CH4 H2O fluid in which CO2 is the dominant fluid carbon species (CO2/[CO2 + CH4] = 0.9) will be 3.7‰ lower than the first diamond crystallized from a reduced mixed fluid in which CH4 is the dominant fluid carbon species (CO2/[CO2 + CH4] = 0.1). Accordingly, the observed tight mode of peridotitic diamonds worldwide at δ13C of –5 ± 1‰ requires that CH4 generally constitutes ≥50% of the carbon species in peridotitic diamond-forming fluids.
The RIFMS equations were applied to CH4-bearing Marange diamonds (Figure 5.2) to model their in situ stable isotope and nitrogen content data.Reference Smit, Shirey, Stern, Steele and Wang40 Application of Eq. (5.1) allowed us to perfectly match the observed covariations in δ13C–δ15N–N content and at the same time explain the previously counterintuitive observation of progressive 13C enrichment in diamonds (Figure 5.2) that appear to have grown from a fluid with CH4 as the dominant carbon species.
Importantly, the observation of CH4 in Marange diamonds (Section 5.3.1) along with detailed in situ isotope analysesReference Smit, Shirey, Stern, Steele and Wang40 have allowed us to confirm the important role of CH4-rich fluids in worldwide peridotitic diamond formation. At this time, in situ data on carbon and nitrogen isotope and N content zoning profiles across diamond plates are still fairly scarce. Future research and the acquisition of many more isotopic profiles across peridotitic diamonds is needed to test whether water-maximum fluids are indeed the prevalent way for peridotitic diamonds to form.
5.3.3 Progress in Understanding Diamond-Forming Metasomatic Fluids
Gem-quality monocrystalline diamond is often devoid of fluid inclusions, and so the best samples of C-rich diamond-forming fluids are those trapped by fast-growing, so-called fibrous diamond. Here, millions of microinclusions (normally 0.2–0.5 μm in size) populate cuboid diamonds, internal fibrous zones of octahedral diamonds, or an overgrowth of a fibrous ‘coat’ around a preexisting diamond. The microinclusions carry a secondary mineral assemblage and a residual low-density hydrous fluid,Reference Navon, Hutcheon, Rossman and Wasserburg61 which at mantle temperatures constitute a uniform high-density fluid (HDF; either a melt or a high-density supercritical C–H–O fluid). The major elements define four compositional end-members (Figure 5.3): saline HDFs rich in Cl, K, Na, water, and carbonate; high-Mg carbonatitic HDFs rich in Mg, Ca, Fe, K, and carbonate; and a continuous array between a low-Mg carbonatitic end-member rich in Ca, Fe, K, Mg, and carbonate and a silicic end-member rich in Si, K, Al, Fe, and water.Reference Weiss62 The incompatible trace elements are highly enriched in all HDFs, reaching levels of ~1000 times the primordial mantle concentrations, and they are characterized by two main trace element patterns: one with alkali and high field strength element depletions and large ion lithophile element (LILE) enrichments similar to calcalkaline magmas and continental rocks; and the other with lower LILE abundances and smoother overall patterns similar to oceanic basalts.Reference Tomlinson and Mueller63, Reference Weiss, Griffin and Navon64 Radiogenic isotopic studies of Sr, Nd, and Pb tracers from HDFs are very scarce; nevertheless, the available data indicate their derivation from sources varying between the “depleted” convecting mantle and ancient incompatible element-enriched lithosphere (including recycled old continental crustReference Klein-Bendavid65).
(a and b) SiO2 and Cl versus MgO content of HDF microinclusions in 89 fibrous diamonds from different lithospheric provinces (in wt.% on a water- and carbonate-free basis). The high-Mg carbonatitic compositions are close to experimental near-solidus melts of carbonate-peridotite, while the low-Mg carbonatitic to silicic HDFs form an array that is close in composition to experimentally produced fluids/melts in the eclogite + carbonate ± water system.Reference Weiss62, Reference Tomlinson and Mueller63, Reference Klein-Bendavid65–Reference Elazar, Navon and Kessel67 The saline HDF end-members have been related to fluids derived from seawater-altered subducted slabs.Reference Weiss, McNeill, Pearson, Nowell and Ottley68

As a rule, the composition of HDF microinclusions in an individual fibrous diamond is homogenous, with only a handful out of the ~250 fibrous diamonds analyzed to date showing conspicuous radial (core-to-rim) changes.Reference Shiryaev71 These diamonds revealed correlative variations in hydrous silicic fluids films around mineral inclusionsReference Nimis32 and saline and carbonatitic HDF microinclusions in octahedral diamondsReference Weiss, Kiflawi, Davies and Navon77 and in twinned crystals (maclesReference Jablon and Navon78). Together, these similarities suggest that many lithospheric diamonds could have formed from the four carbonate-bearing HDF end-members known from fibrous diamonds. These HDF fluids provide another growth mechanism that is different from the mechanism by which lithospheric diamonds form from non-carbonate-bearing fluids (see Sections 5.3.1 and 5.3.2).
Diamond formation is a by-product of mantle metasomatism, whereby HDFs migrate through and react with different mantle reservoirs. Their entrapment in the diamond gives us a unique glance at the initial stages of melting and at the enigmatic mantle process known as metasomatism. A strong connection exists between high-Mg carbonatitic HDFs and a carbonated peridotite, indicating that the diamond grew from carbon supplied by the HDFs. Also, the origins of silicic and low-Mg carbonatitic HDFs have been related to the melting of hydrous carbonated eclogites.Reference Klein-Bendavid65, Reference Elazar, Navon and Kessel67 On the other hand, fibrous diamonds generally make up less than a few percent of a mine’s production,Reference Harris and Field2 and differences in the textures, nitrogen aggregations, diamond ages, and the range of carbon isotopic compositions between fibrous and monocrystalline gem-quality diamonds mean that further work is needed to establish whether HDFs are responsible for the formation of all types of diamonds. Accumulating evidence indicates the involvement of HDFs in the growth of many monocrystalline diamonds – the most abundant type of diamond. The age difference between monocrystalline and fibrous diamonds was bridged by finding fibrous diamonds of Archean age,Reference Smith, Kopylova, Nowell, Pearson and Ryder76 as well as fibrous diamonds with aggregated nitrogen (25–70% B centersReference Zedgenizov79). The interaction of HDFs with depleted garnets was shown to closely produce sinusoidal rare earth element (REE) patterns,Reference Weiss62 which are one of the primary features of harzburgitic garnet inclusions in monocrystalline diamonds.Reference Stachel and Harris10 The deep mantle source of saline HDFs has for many years remained ambiguous, until recently, when the first conclusive trace element and Sr isotopic fingerprints indicated that they are derived from seawater-altered subducted slabs.Reference Weiss, McNeill, Pearson, Nowell and Ottley68 Moreover, clear chemical evolutionary trends in these Northwest Territories Canadian diamonds identify saline HDFs as parental to in situ-forming carbonatitic and silicic melts in the deep continental lithosphere. These advances open a new window on understanding the history of magmatism and metasomatism in the deep SCLM and their relationship to carbon and water mobility and diamond formation.
5.4 Sources of Carbon and Recycling of Volatiles
5.4.1 Atmospheric and Biotic Recycling of Sulfur into the Mantle
An important way to trace potential carbon sources in the deep carbon cycle is by using the petrogenesis of mineral inclusions in diamond. Iron–nickel–copper sulfides represent the most common type of mineral enclosed in diamonds. This overabundance of sulfide inclusions in diamonds compared with silicates suggests that a genetic link exists between sulfides and diamonds, but the exact nature of this relationship remains unclear.
Sulfide inclusion mineralogy implies at least two distinct origins for these sulfides, with Ni-rich specimens akin to peridotitic affinity and, more frequently, Ni-poor specimens that originate from a mafic crustal rock. Re/Os studies have provided robust evidence that sulfide inclusion compositions evolved with age.Reference Shirey and Richardson17 Sulfides older than 3 Ga are all peridotitic, while eclogitic specimens prevail from the Mesoarchean until the Proterozoic. They display a discrete age distribution with at least one major age peak coeval with continental collision, which is well characterized in the Kaapvaal craton. These observations indicate irreversible changes in crust/mantle dynamics, with episodic subduction events starting ca. 3 Ga that would have driven crustal sulfur into the cratonic keel.Reference Shirey, Richardson and Harris80
This scenario has major implications for the global budget of volatile elements and its evolution through time. In particular, the flux linking the shallow crust (which is a major sink of volatiles) and the mantle is a key parameter because it allows the recycling of light elements (C, O, H, N, S) and thus partially controls the deep Earth budget.
Unlike carbon or oxygen, for which fractionated isotopic compositions can lead to ambiguous interpretation due to high-temperature fractionation processesReference Cartigny, Palot, Thomassot and Harris81 or perturbation by mantle metasomatism,Reference Huang82 S isotopic systematics provides a unique way to assess the contribution of Archean surficial reservoirs in mantle rocks.Reference Farquhar83 Sulfur is present in all of the external envelopes of Earth (ocean, atmosphere, and biosphere). It participates in many chemical (biotic and abiotic) and photochemical reactions. Large variations of δ34S in sedimentary rocks are mainly attributed to microbe-mediated sulfur metabolisms. On the other hand, in the Archean atmosphere, photochemical reactions involving UV light induced sulfur mass-independent fractionation (MIF). Photochemical products – elemental sulfur and sulfate aerosols – carried anomalous 33S-enrichment (∆33S > 0‰) and depletion (∆33S < 0‰), respectively. Both species have been transferred to seawater and then preserved as two independent isotopic pools in chemical sediments (banded iron formations and black shales) or hydrothermally altered oceanic crust older than 2.4 Ga. MIF sulfur anomalies ceased sharply at the Archean/Proterozoic boundary as a consequence of UV screening by ozone. Thus, multiple S isotopic systematics is a robust tracer of the Archean surficial sulfur,Reference Farquhar83 but can also be used to track the fate of specific sedimentary pools.
Pioneering studies of S isotopes in sulfide inclusions reported departure from mantle composition and concluded that altered oceanic crustReference Chaussidon, Albarede and Sheppard84 or sedimentsReference Eldridge, Compston, Williams, Harris and Bristow85 were recycled in the diamond growth environment. Multiple sulfur isotope measurements (δ33S, δ34S) provide a more complete assessment of the recycled sulfur pools.Reference Farquhar83, Reference Thomassot86 In addition to a wide range of δ34S (–9‰ < δ34S < 3.4‰), eclogitic sulfide inclusions from the Orapa and Jwaneng diamonds carry MIFs that are mostly positive (–0.5‰ < ∆33S < 1‰). While the most anomalous sulfur isotopic compositions match the sulfur compositional trend produced by photochemical reactions with 220‑nm radiationReference Thomassot, O’Neil, Francis, Cartigny and Wing87 previously found in Archean sediments, some 34S-depleted specimens require additional fractionation, most likely related to biologic activity (Figure 5.4). By comparison, peridotitic sulfides from the Slave and Kaapvaal cratonsReference Thomassot86, Reference Stachel, Harris, Brey and Joswig98 do not carry significant MIF (∆33S from –0.12 to 0.19‰). These results provide compelling evidence that MIF S isotopic signatures are not produced by high-temperature processes in the mantle, but indubitably reflect an input of chemical sediments from the surface to the diamond growth region.
∆33S (‰) versus δ34S in mid-ocean ridge basalt (MORB; blue rectangleReference Thomassot, O’Neil, Francis, Cartigny and Wing87, Reference Labidi, Cartigny, Hamelin, Moreira and Dosso89, 90), sulfide inclusions in diamonds (yellow hexagonsReference Farquhar83, Reference Thomassot86), and sulfides from high-µ mantle reservoir (HIMU) ocean island basalt (OIB; Mangaïa,Reference Cabral91 light green squares) and enriched mantle reservoir 1 (EM1) OIB (Pitcairn,Reference Delavault, Chauvel, Thomassot, Devey and Dazas92 dark green squares). While MORB are homogeneous and devoid of MIF, sulfides from SCLM and from some OIB contain the relict of Archean surficial sulfur. Sulfide inclusion compositions are best explained by a combination of atmospheric and biotic effect and resemble what has been previously observed in Archean chemical sediments. Sulfide in OIB carry negative ∆33S together with negative δ34S, as previously observed in sulfides from altered oceanic crust.

Geologic evidence indicates that cratonic keels have been isolated early from the convecting mantle. This is consistent with the absence of ∆33S anomalies in mid-ocean ridge basalt (MORB; Figure 5.4) reported by Labidi et al.Reference Labidi, Cartigny, Hamelin, Moreira and Dosso89, Reference Labidi, Cartigny and Moreira90 Surprisingly, however, two independent studies on sulfides from ocean island basalt (OIB)Reference Cabral91 have reported small but significant negative ∆33S anomalies (down to –0.8‰) correlated with strictly negative δ34S (Figure 5.4). In both Pitcairn (enriched mantle reservoir 1 (EM1)) and Mangaïa (high-µ mantle reservoir (HIMU)) samples, these trends match the composition previously reported for sulfides from hydrothermal barite veins in altered oceanic crust.Reference Ueno, Ono, Rumble and Maruyama93, Reference Roerdink, Mason, Whitehouse and Brouwer94 Accordingly, these studies indicate that deep mantle heterogeneities inherited from seawater Archean sulfates have been preserved over billions of years. It is worth noting that negative anomalies are underrepresented in the sedimentary record. One of the most exciting hypotheses coming along with the presence of negative ∆33S in some OIB is that part of the missing surficial sulfur could be stored in the deep mantle.Reference Farquhar and Jackson95
The data obtained so far on mantle samples tend to indicate that the Archean surficial components recycled in the SCLM differ from those found in some OIB. Additional data are required to confirm this view. The relative abundance of the minor isotope of sulfur, 36S, is also affected by both mass-dependent reactions (related to microbial cycling; e.g. Ono et al.Reference Ono, Wing, Johnston and Farquhar96) and mass-independent atmospheric reactions that lead to variations of δ34S and Δ33S. In the future, studying covariations of ∆33S and ∆36S may help to provide a more complete assessment of the recycled sulfur pools and ultimately add new constraints upon crust/mantle dynamics.
5.4.2 Carbon and Nitrogen Cycling into the Mantle Transition Zone
Studies of the carbon and nitrogen isotopic composition of diamonds represent an opportunity to examine volatile migration within the transition zone (410–660 km depth), a key region within Earth’s interior that may be the main host for recycled material. Seismology and mineral physics show the tendency of subducted slabs to pond at the lower mantle transition zone boundary at ~660 km depth within a region where diamonds capture rare inclusions of majorite garnetReference Moore and Gurney97 and assemblages comprising Ca-rich inclusions (CaSi-perovskite, -walstromite, -larnite, -titanite).Reference Stachel, Harris, Brey and Joswig98 These rare diamonds principally originate from four localities: the Juína area in Brazil, Kankan in Guinea, and Monastery and Jagersfontein in South Africa.
Brazilian diamonds with majorite inclusions exhibit carbon (δ13C = –10.3 ± 5.5‰, 1σ; Figure 5.5aReference Thomson20, Reference Bulanova21, Reference Cartigny, Palot, Thomassot and Harris81, Reference Hutchison, Cartigny, Harris, Gurney, Gurney, Pascoe and Richardson99–Reference Burnham104) and nitrogen isotope compositions (δ15N = +0.4 ± 2.9‰, 1σ; Figure 5.5b) well outside of the current mantle range (δ13C = –5 ± 3‰ and δ15N = –5 ± 4‰). Most likely, these diamond isotopic compositions record subduction-related carbon and nitrogen.Reference Palot, Cartigny, Harris, Kaminsky and Stachel101 The partial melting of former carbonated oceanic crust in the transition zone may produce carbonatitic melts, and the interaction of these melts with ambient convecting mantle may be responsible for the formation of many/most mantle transition zone diamonds and their inclusions (Figure 5.5c).Reference Walter56
(a) Histogram of δ13C values of transition-zone diamonds from Jagersfontein and Monastery (South Africa), the Juína area in Brazil (containing either majorite or Ca-rich inclusions), and Kankan (Guinea). The mantle range (gray band) is defined by the study of fibrous diamonds, mid-ocean ridge basalts, carbonatites, and kimberlites.Reference Thomson20, Reference Bulanova21, Reference Cartigny, Palot, Thomassot and Harris81, Reference Hutchison, Cartigny, Harris, Gurney, Gurney, Pascoe and Richardson99–Reference Palot, Pearson, Stern, Stachel and Harris107 (b) Histogram of δ15N values of transition zone diamonds from Jagersfontein, Monastery, Brazil, and Kankan.Reference Hutchison, Cartigny, Harris, Gurney, Gurney, Pascoe and Richardson99, Reference Palot, Cartigny, Harris, Kaminsky and Stachel101, Reference Palot106, Reference Palot, Pearson, Stern, Stachel and Harris107 (c) Schematic history of diamond formation in the transition zone, illustrating the deep recycling of surficial carbon and nitrogen in the mantle. At each locality, transition zone diamonds did not necessarily form during single subduction events.

Some Brazilian diamonds with super-deep Ca-rich assemblages are thought to derive from even greater depth, at the transition zone–lower mantle boundary.Reference Harte, Harris, Hutchison, Watt, Wilding, Fei, Bertka and Mysen18 These diamonds with distinct carbon isotope compositions (δ13C = –5.9 ± 3.7‰; Figure 5.5a) that overlap with the main mantle range are suggested to originate either from homogenized subducted sediments (composed of 80% carbonate and 20% organic carbon) or mantle-related fluids from the convecting mantle (i.e. non-primordial; Figure 5.5c).
The carbon isotope compositions of Kankan diamonds with majorite- and with Ca-silicate inclusions are distinct from Brazilian samples by being 13C enriched, with an overall δ13C of 0.3 ± 2.2‰, outside the mantle range (Figure 5.5a).Reference Palot, Pearson, Stern, Stachel and Harris107, Reference Stachel, Harris, Aulbach and Deines108 This carbon isotopic signature is consistent with derivation from subducted carbonate with no/little former organic carbon involved. The identification of carbonate inclusions in ultra-deep diamonds indicates that carbonate may be efficiently transported deep into the mantle.Reference Stachel, Harris, Brey and Joswig98 The positive δ15N values of transition-zone diamonds from Kankan also strongly support a subduction origin. Modeling of the local covariations of δ13C–δ15N–N compositions within individual diamonds indicates that they grew from parental fluids involving both oxidized (majority) and reduced (minority) fluids,Reference Palot, Pearson, Stern, Stachel and Harris107 highlighting the likely heterogeneity of the transition zone (Figure 5.5c).
Diamonds from Monastery and Jagersfontein containing majorite inclusions exhibit extremely depleted δ13C values of –16.7 ± 1.2‰ and –19.7 ± 2.1‰, respectively, and strictly positive δ15N values (Figure 5.5a), which are again consistent with subducted material.Reference Palot106 The relatively low nitrogen contents (<55 at. ppm) of the host diamonds together with the positive chondrite-normalized REE slopes and high δ18O values of the majorite inclusions are consistent with the formation of these diamonds within hosts that originated from hydrothermally altered basaltic protoliths. The preferred mechanism to form these diamonds is by dissolution and re-precipitation (Figure 5.5c), where subducted metastable graphite would be converted into an oxidized or reduced species during fluid-aided dissolution, before being re-precipitated as diamond.Reference Ickert, Stachel, Stern and Harris109 In this situation, carbon remains in the subducting slab and is locally redistributed to form sublithospheric diamonds beneath the Kaapvaal Craton (Figure 5.5c).
The carbon and nitrogen isotopic signatures of transition zone diamonds worldwide indicate that they likely crystallized from fluids derived from subducted material, illustrating the deep cycling of surficial carbon and nitrogen into and through the transition zone. Carbon and nitrogen seem to be efficiently retained in the oceanic lithosphere during subduction, prior to being locally mobilized in the transition zone to form diamonds.
5.4.3 Earth’s Deep Water and the Carbon Cycle
Water coexists with carbon as CH4 or CO2 in mantle C–H–O fluids. Studies of the diamond-bearing carbon cycle also afford a chance to follow water – one of the defining components of Earth’s mantle. The mantle transition zone, from ~410 to 660 km depth, was identified 30 years ago as a potentially major sink for water in Earth,Reference Smyth110 where H2O could incorporate into nominally anhydrous minerals as hydroxyl species. Seismic tomography images of some subducted oceanic slabs ponding within the transition zoneReference Van der Hilst, Widiyantoro and Engdahl111 brought into focus the potential for this geochemical reservoir to store volatiles recycled along with the oceanic slabs. Despite experimental verification of the high water storage capacity of high-pressure polymorphs of olivine – wadsleyite and ringwoodite (e.g. Kohlstedt et al.Reference Kohlstedt, Keppler and Rubie112) – considerable debate ensued regarding the degree of hydration of the mantle transition zone. Its state of hydration is poorly constrained at regional and global scales because of the compensating effects of temperature, bulk composition, and mineralogy in modeling geophysical observations. Diamonds have a unique role to play in illuminating this problem.
Since the discovery of super-deep diamonds,Reference Harte, Harris, Hutchison, Watt, Wilding, Fei, Bertka and Mysen18 their immense value in providing samples of the upper mantle, transition zone, and lower mantle has become clear.Reference Walter24, Reference Nestola25, Reference Stachel, Harris, Brey and Joswig98, Reference Brenker113–Reference Nestola115 Several studies discovered olivine inclusions suggested to have previously been wadsleyite or ringwoodite based on frequent spinel exsolutionsReference Brenker, Stachel and Harris116 or their coexistence with other phases thought to be from the transition zone.Reference Harte, Harris, Hutchison, Watt, Wilding, Fei, Bertka and Mysen18, Reference Brey, Bulatov, Girnis, Harris and Stachel117, Reference Hayman, Kopylova and Kaminsky118
During the DMGC consortium initiative on super-deep diamonds, a diamond from the Rio Aripuanã in the Juína district of Mato Grosso, Brazil, was found to contain the first terrestrial occurrence of un-retrogressed ringwoodite (Figure 5.6).Reference Pearson23 This ~30‑μm inclusion was estimated to contain ~1.4 wt.% H2O. Subsequent recalibration of IR absorbance for hydrous ringwoodite by absolute methods (proton–proton scattering) across the Mg2SiO4–Fe2SiO4 solid solutionReference Thomas119 refined this estimate to 1.43 ± 0.27 wt.% H2O. The observed water content in the ringwoodite inclusion is close to the maximum storage capacity (~2 wt.% H2O) observed in experiments at conditions representative of cold-slab geotherms.Reference Litasov, Ohtani and Ohtani120 This constraint is strong evidence that the host environment for the ringwoodite was a subducted slab carrying significant H2O into the transition zone. With such a restricted data set, it remains to be determined how representative the Juína ringwoodite found by Pearson et al.Reference Pearson23 is for the mantle transition zone at regional scales; however, Nestola and SmythReference Nestola and Smyth121 estimated that when this water content is applied to the whole mantle transition zone (~7% of Earth’s mass), the total water content would be ~2.5 times the volume of water in Earth’s oceans. Even if the single natural specimen represents a local phenomenon of water enrichment, seismological evidence of dehydration melting above and below the transition zoneReference Schmandt, Jacobsen, Becker, Liu and Dueker122–Reference Zhang, Dueker and Huang124 and the report of the super-hydrous “Phase Egg” in a super-deep diamond by Wirth et al.,Reference Wirth, Vollmer, Brenker, Matsyuk and Kaminsky125 along with other recently described phenomena such as the presence of brucite within ferropericlaseReference Palot126 and the documentation of ice VII within diamonds originating in the transition zone and lower mantle by Tschauner et al.,Reference Tschauner127 provide stunning evidence of linked water and carbon cycles in Earth’s mantle extending down into the transition zone and possibly as deep as the top of the lower mantle.
Photograph of Juína diamond JuC-29 and a magnified view of the ringwoodite inclusion (right panel, center of image) showing the characteristic indigo–blue color of ringwoodite.

The presence of water in ringwoodite, likely hosted in a cool, subducted oceanic slab along with the recycled signature of carbon and nitrogen evident in transition zone diamonds (see Section 5.4.2) indicate that the transition zone as sampled by diamonds is a reservoir that is potentially dominated by subducted slabs and their recycled volatiles. This region of Earth’s mantle is therefore a key zone for the storage and ultimate return of recycled volatiles, including carbon, in Earth.
5.5 Mineral Inclusions and Diamond Types
5.5.1 Experiments to Study Diamond Formation and Inclusion Entrapment
Experiments on diamond formation and growth have two main goals: gaining a better understanding of diamond-forming reactions and simulating the mechanisms for inclusion entrapment. Both goals address an essential step in the deep carbon cycle where carbon is liberated from fluids or melts and reduced to form diamond. Synthetic diamond growth was one of the driving forces of high-pressure technology,Reference Bundy, Hall, Strong and Wentorf Jun128 but for many years the focus remained on their industrial production, which employs metallic liquid solvents, and not on identifying the growth media of natural diamonds. Arima et al.Reference Arima, Nakayama, Akaish, Yamaoka and Kanda129 first synthesized diamond from a kimberlite composition, but since then a very wide range of plausible mantle fluid and melt compositions have yielded synthetic diamonds, including pure carbonates,Reference Palyanov, Sokol, Borzdov, Khokhryakov and Sobolev130 C–H–O fluids,Reference Sokol, Borzdov, Pal’yanov, Khokhryakov and Sobolev131 carbonate–silicate mixtures with water and/or chloride,Reference Fagan and Luth132, Reference Palyanov, Sokol, Khokhryakov and Kruk133 and metal sulfides.Reference Litvin and Butvina134 Palyanov et al.Reference Palyanov, Sokol, Borzdov, Khokhryakov and Sobolev130 achieved diamond nucleation using Na2CO3 + C–H–O fluid mixtures at 1150°C and 5.7 GPa, overcoming the nucleation barrier exhibited by direct graphite transformation that exists throughout cratonic lithosphere conditions. Further studies have shown nucleation and growth to be greatly promoted by the presence of H2O.Reference Sokol and Palyanov135–Reference Bureau137 There is further evidence that NaCl may act to reduce the growth rate.Reference Fagan and Luth132, Reference Bureau136 Experiments to synthesize diamonds from reduced C–H–O fluids have been less successful. Diamond formation was found to be inhibited in the presence of CH4–H2 fluids, for example,Reference Sokol, Borzdov, Pal’yanov, Khokhryakov and Sobolev131, Reference Sokol, Palyanova, Palyanov, Tomilenko and Melenevskiy138 although recent measurements of CH4 imply that diamonds do indeed grow naturally with such reduced fluids.Reference Smit, Shirey, Stern, Steele and Wang40
Experiments examining natural diamond growth media are generally performed with excess graphite, and in the absence of an obvious reducing agent the main formation mechanism is dissolution and precipitation along a decreasing temperature gradient.Reference Palyanov and Sokol139 Luth and StachelReference Luth and Stachel47 have argued that a thermal gradient growth process may form diamonds in the mantle because the dissolved carbon content of a C–H–O fluid in equilibrium with diamond decreases with temperature and also with pressure. Diamond growth from cooling or decompressing fluids overcomes the difficulty of dissolved carbon species being reduced or oxidized by external agents such as ferric or ferrous iron, which are not present in wall rocks at the concentrations required to account for natural macroscopic diamond growth. Calculations show that, in a C–H–O fluid, the greatest change in diamond solubility with temperature occurs at the so-called H2O maximum, where the carbon content of the fluid is actually at a minimum.Reference Luth and Stachel47 This may explain why diamond growth is promoted in experiments with high H2O concentrations.Reference Bureau136, Reference Bureau137 One problem with this occurring in the mantle is that the H2O contents of mineral inclusions such as olivine trapped in diamonds should be near H2O saturation, which seems not to be the case for the lithospheric diamonds measured to date.Reference Novella, Bolfan-Casanova, Nestola and Harris140 Reduced CH4-rich fluids, on the other hand, experience relatively small changes in carbon solubility with temperature, but much larger changes with pressure.Reference Luth and Stachel47 This, coupled with problems of H2 loss from capsules at reducing conditions, may at least partly explain the difficulties in diamond synthesis from CH4-rich fluids.
Inclusions trapped in diamonds are among the few diagnostic tools that can constrain diamond growth media, and recent experiments have attempted to explore this link by capturing inclusions in synthetically grown diamonds. Experiments using water-rich mixtures containing carbonates and silicates have successfully produced a broad range of mineral, melt, and fluid inclusions at 6–7 GPa and 1300–1400°C (Figure 5.7).Reference Bureau136, Reference Bureau137 Starting compositions were based on fluid inclusion analyses of fibrous diamonds,Reference Navon, Hutcheon, Rossman and Wasserburg61 and polycrystalline and fibrous growth textures were reproduced, which tended toward monocrystalline growth at higher temperatures. Bureau et al.Reference Bureau137 used observations of coexisting melt and fluid inclusions to infer the temperature where the two phases become miscible in the system examined. Bataleva et al.Reference Bataleva, Palyanov, Borzdov, Kupriyanov and Sokol141 also captured inclusions in monocrystalline diamonds grown from SiO2–(Mg,Ca)CO3–(Fe,Ni)S mixtures at 6.3 GPa and 1650–1750°C. The inclusions, which encompassed quenched carbonate–silicate melts, sulfide melts, and CO2 fluid, reflected, in part, the growth medium that is generally assumed for natural diamond inclusions, but Bureau et al.Reference Bureau136 demonstrated that carbonate minerals are readily trapped in diamonds that are actually growing from H2O-dominated liquids.

The alternative to diamond growth from cooling or decompressing C–H–O-rich liquids is precipitation due to redox reactions with iron or potentially sulfide species in surrounding minerals or melts. This would seem to be problematic, as mentioned above, because iron species and sulfides lack the redox capacity to reduce or oxidize macroscopic diamonds from fluids.Reference Luth and Stachel47 With the recognition that the mantle may become metal saturated at depths >200 km, however, a number of experiments have studied a so-called redox freezing scenarioReference Rohrbach and Schmidt142 where carbonate melts may migrate out of subducting slabs and rise into the overlying metal-saturated sublithospheric mantle.Reference Thomson, Walter, Kohn and Brooker57, Reference Palyanov143 An intriguing result is that the oxidation of iron and reduction of carbonate in these experiments form magnesiowüstite with a wide range of Fe contents,Reference Palyanov143 which is consistent with its occurrence in sublithospheric diamonds.
5.5.2 Nanoscale Evidence for Polycrystalline Diamond Formation
Carbon that does not occur as monocrystalline diamond but rather as a polycrystalline diamond aggregate (PDAs; “framesites,”Reference Gurney, Harris, Rickard and Kornprobst144 boart,Reference Orlov145 or diamonditeReference Dobosi and Kurat146) represent a little-studied variety of carbon in the mantle that has the potential to reveal how carbon percolates at shallower levels of diamond stability. The PDAs can make up 20% of the diamond production in some Group I kimberlites (K. de Corte, pers. comm. 2012), but are not reported from Group II kimberlites, nor other diamondiferous volcanic rocks. Their polycrystalline nature indicates rapid precipitation from carbon-oversaturated fluids.Reference Orlov145 Compared to monocrystalline diamonds, individual PDAs often contain a more varied and chemically heterogeneous suite of inclusions and minerals intimately intergrown with the diamond crystals. However, these inclusions are sometimes not shielded from metasomatism and alteration, which can accompany deformation and recrystallization of the diamonds as seen in electron-backscatter diffraction images.Reference Rubanova, Piazolo, Griffin and O’Reilly147 The suite of minerals found in PDAs, while derived from Earth’s mantle, is unlike inclusions in diamond; websteritic and pyroxenitic parageneses dominate and olivine is absent. Individual grains commonly are chemically and structurally heterogeneous,Reference Jacob, Piazolo, Schreiber and Trimby148, Reference Jacob, Viljoen, Grassineau and Jagoutz149 suggesting that many grew by reaction between mantle minerals and metasomatic fluids and/or melts. Trace element patterns of the silicates can show signatures of carbonatite metasomatism, supporting their formation from oxidized fluids. However, some samples contain very reduced inclusions, such as iron carbide.Reference Jacob, Kronz and Viljoen150 Thus, a single formation process is unlikely. Like the associated websteritic and pyroxenitic silicates, the non-silicate phases such as magnetite may represent reaction products associated with diamond formation. Jacob et al.Reference Jacob, Piazolo, Schreiber and Trimby148 documented epitactic relations between grains of iron sulfide, which oxidized to magnetite and served as nucleation templates for the host diamond crystals, underlining the role of redox reactions in diamond formation. Textural evidence for a high-pressure Fe3O4 precursor phase constrains the depth of formation of the PDAs to the base of the lithosphere. Hence, this variety of diamond, due to its rapid formation, provides insights into the extreme “corners” of the diamond formation process in Earth’s SCLM. Such evidence is often eradicated in larger monocrystalline diamonds, which grow slowly and record time-integrated evidence within the deep carbon cycle. Several questions require answers in order for us to understand the role of PDAs and their context in the deep carbon cycle.
Applying robust constraints on absolute ages proves difficult for PDAs, and the sparse data available suggest episodic formation. Jacob et al.Reference Jacob, Viljoen, Grassineau and Jagoutz149 observed trace element zonation in PDA-hosted garnets from Venetia (South Africa); modeling using known diffusion coefficients showed that the preservation of the zoning requires that these samples precipitated shortly before kimberlite eruption. The garnets show unradiogenic εNd (–16 to –22); this implies that they contain older lithospheric material remobilized with the carbon-bearing fluid to form PDAs. However, the nitrogen aggregation states of PDAs (probably from southern Africa) showed that these samples are not exclusively young, but formed in several distinct events over a long time span, possibly more than millions of years.Reference Mikhail151
Carbon isotope values (δ13C) in PDAs span a range from ca. –1‰ to ca. –30‰ (n = 115) with peaks at –5‰ and at –19‰.Reference Mikhail, Dobosi, Verchovsky, Kurat and Jones152, Reference Jacob, Dobrzhinetskaya and Wirth153 The first peak is the typical mantle,Reference Cartigny8 but the second peak at –19‰ is typical only for PDAsReference Cartigny8 and, to date, remains unexplained. Nitrogen concentrations and δ15N in PDAs cover large ranges: 4–3635 at. ppm and –6.1‰ to +22.6‰,Reference Mikhail, Dobosi, Verchovsky, Kurat and Jones152, Reference Gautheron, Cartigny, Moreira, Harris and Allegre154, Reference Mikhail, Howell and McCubbin155 but both are independent of δ13C values, arguing against broad-scale fractionation processes.Reference Deines5, Reference Mikhail, Howell and McCubbin155, Reference Maruoka, Kurat, Dobosi and Koeberl156 Some authors have argued for Rayleigh fractionation of a mantle-derived fluid,Reference Deines5, Reference Maruoka, Kurat, Dobosi and Koeberl156 while others inferred a subducted fluid origin.Reference Mikhail151, Reference Mikhail, Dobosi, Verchovsky, Kurat and Jones152 A role for a subducted component is supported by the high nitrogen concentrations in some of the diamonds, combined with heavy nitrogen isotopic compositions – typical for material from Earth’s surface.Reference Mikhail151, Reference Mikhail, Dobosi, Verchovsky, Kurat and Jones152
Collectively, these data imply that PDAs are the product of small-scale reactions with fluids related to both ambient mantle carbon, remobilized SCLM material, and subducted crustal carbon. The formation of PDAs also requires interaction of melts and rocks within the subcratonic lithosphere, and these events are episodic. These fluid-driven, rapid reactions serve to “freeze” carbon as diamond in the subcratonic lithosphere, and they may preserve some of the best evidence for small-scale chemical heterogeneity at the site of formation. Obtaining accurate information on the age and depth of polycrystalline diamond formation is the next step to addressing their role in the deep carbon cycle, since they may represent the shallowest form of diamond-forming fluid.
5.5.3 Proterozoic Lherzolitic Diamond Formation: A Deep and Early Precursor to Kimberlite Magmatism
Lithospheric diamonds are ancient and form during episodes of fluid infiltration into the lithospheric mantle keel in response to large-scale geotectonic processes. Studies of lithospheric diamonds provide the main way to look back at carbon cycling over the past 3.5 billion years. The continental lithosphere has been recognized as an important carbon reservoir, which, after initial melt extraction imposing highly refractory and reducing conditions, was gradually re-enriched and re-oxidized through infiltration of volatile-bearing fluids and melts from episodically impinging plumes and subducting slabs.Reference Foley and Fischer157 Kimberlite eruptions, which increased in frequency through time (Figure 5.8), sporadically connect this deep lithospheric carbon cycle to surface reservoirs, but require conditions that are favorable to their formation and extraction from a carbonated mantle source.Reference Stagno and Frost158–Reference Tappe, Smart, Torsvik, Massuyeau and de Wit160 The cryptic part of the lithospheric carbon cycle involving diamonds can be illuminated through a combination of age dating and chemical characterization of the inclusions in the diamonds, which reveal the nature of their source rocks and their formation conditions.Reference Stachel and Luth58 Diamond formation through time reveals a trend, from harzburgitic sources prior to 3 Ga, to the first appearance of eclogitic diamonds ca. 3 GaReference Shirey and Richardson17 and of lherzolitic diamonds and renewed diamond growth in the Proterozoic recording ages from ca. 2.1 to 0.7 Ga (Figure 5.8). Thus, Proterozoic lherzolitic diamond formation is a widespread phenomenon, corresponding to ~12% of inclusion-bearing peridotitic lithospheric diamonds.Reference Stachel and Harris10 Refertilization (lherzolitization) of the initially depleted lithosphere and minor associated diamond growth likely occurred in the presence of small-volume melts, producing garnet inclusions with characteristic, generally mildly sinusoidal REE patterns.Reference Stachel and Luth58
Lherzolitic diamond formation through time: ca. 2.1 to 1.8 Ga, diamonds from Premier (Kaapvaal craton) and 23rd Party Congress/Udachnaya (Siberian craton); 1.4 Ga, diamonds from Ellendale (Western Australia);Reference Smit, Shirey, Richardson, le Roex and Gurney161 1.1 to 1.0 Ga, diamonds from 23rd Party Congress/Mir (Siberian craton)Reference de Vries162 and Venetia (Zimbabwe craton);Reference Koornneef163 and 0.72 Ga, diamonds from Attawapiskat (Superior craton).Reference Aulbach164 Numbers in parentheses give host kimberlite eruption ages (in giga-years) to illustrate the delay between lherzolitization and kimberlite magmatism. Shown for comparison is the age distribution of kimberlites from Tappe et al.,Reference Tappe, Smart, Torsvik, Massuyeau and de Wit160 Os model ages of mantle sulfides from Griffin et al.,Reference Griffin165 which predominantly reflect the time of Archaean craton formation and the creation of strongly refractory and reducing mantle lithosphere, and for xenoliths from the Siberian craton, which show a major Paleoproterozoic lithospheric mantle formation event.Reference Ionov, Carlson, Doucet, Golovin and Oleinikov166

The successful eruption of kimberlites has been suggested to require, inter alia, metasomatic oxidative “preconditioning” of deep lithospheric pathways in the presence of diamondReference Yaxley, Berry, Rosenthal, Woodland and Paterson167 and of shallower lithospheric levels through the precipitation of hydrous and Ti minerals from kimberlite precursors.Reference Giuliani168 Although harzburgitic source rocks are too Fe3+ depleted to permit substantial diamond formation by wall rock-buffered redox reactions,Reference Luth and Stachel47 lherzolitization accompanied by (ferrous) iron introduction may have restored sufficient redox buffering capacity to precipitate some diamonds by reduction of carbonate from small-volume melts through simultaneous oxidation of Fe2+ to Fe3+ of the host rock. Indeed, very depleted initial source compositions inferred from average FeO contents in refractory garnet peridotites from various cratons (5.3–6.8 wt.%) give way to higher FeO contents (6.3–7.4 wt.%) when metasomatized lherzolites are included (data in AulbachReference Aulbach169). Some metasomatism was likely accompanied by oxidation and an increase in Fe3+/∑Fe, as indicated by the higher fO2 determined for enriched compared to depleted mantle xenoliths.Reference Yaxley, Berry, Rosenthal, Woodland and Paterson167, Reference McCammon, Griffin, Shee and O’Neill170, Reference Creighton171 Pervasive interaction of the deep mantle column with (proto)kimberlite melts is confirmed by isotopic and trace element studies of mantle xenoliths.Reference Aulbach, Griffin, Pearson and O’Reilly172, Reference Simon, Irvine, Davies, Pearson and Carlson173 Moreover, (hydrous) carbonated melts diluted with silicate components, similar to kimberlites, can be stable at lower fO2 than pure carbonatite.Reference Stagno, Ojwang, McCammon and Frost46 Notably, lherzolitic diamond formation is temporally and genetically dissociated from the later-emplaced kimberlite hosts of these diamonds (Figure 5.8). Within this framework, Proterozoic lherzolitic diamond formation has recently been suggested to represent the deep and early component of the refertilization and reoxidation of the lithosphere required for successful kimberlite eruption.Reference Aulbach164 Given the recent advances in experimental and thermodynamic groundwork, the task is now to quantitatively delineate carbon speciation in the cratonic lithosphere through space and time, including the potential role of lherzolitic diamond formation as part of the upward displacement of redox freezing fronts that culminate in kimberlite eruption.
5.5.4 Diamond Growth by Redox Freezing from Carbonated Melts in the Deep Mantle
The bulk composition and trace element distributions in mineral inclusions in super-deep diamonds provide information about the conversion of carbonate to diamond in the deep upper mantle, transition zone, and lower mantle. Of the wide range of inclusions found in super-deep diamonds, those with bulk compositions consistent with Ca-rich majorite garnet and Ca-rich silicate perovskite have provided the most compelling evidence for the role of carbonated, subducted oceanic crustal materials in their origin (e.g. Refs. Reference Harte, Harris, Hutchison, Watt, Wilding, Fei, Bertka and Mysen18, Reference Thomson20, Reference Bulanova21, Reference Smith49, Reference Walter56, Reference Stachel, Harris, Brey and Joswig98, Reference Kaminsky100, Reference Zedgenizov, Kagi, Shatsky and Ragozin102, Reference Tappert105, Reference Hayman, Kopylova and Kaminsky118, Reference Wang, Gasparik and Rapp174–Reference Thomson176).
Inclusions interpreted as former majorite garnet or Ca-perovskite often exhibit composite mineralogy that is interpreted to have formed by unmixing from primary precursor minerals exhibiting solid solution (e.g. Refs. Reference Harte12, Reference Thomson20, Reference Bulanova21, Reference Walter56, Reference Zedgenizov, Kagi, Shatsky and Ragozin102, Reference Brenker175, Reference Harte and Cayzer177). Inclusions formed as majorite solid solutions typically unmix upon uplift in the mantle to a mixture of pyrope-rich garnet and clinopyroxene (e.g. Refs. Reference Harte12, Reference Bulanova21, Reference Harte and Cayzer177), and on the basis of majorite geobarometry, these inclusions originated at pressures of ~7–20 GPa (Figure 5.9), with most inclusions forming in the range of ~10–17 GPa; that is, in the deep upper mantle and shallow transition zone. Super-deep majorite inclusions are almost exclusively high Ca and low Cr, indicating petrogenesis involving mafic protoliths (e.g. Refs. Reference Harte12, Reference Bulanova21, Reference Stachel, Brey and Harris178, Reference Kiseeva, Litasov, Yaxley, Ohtani and Kamenetsky179).
Bulk silicate earth normalized trace element composition of (a) “calcium silicate perovskite” and (b) majoritic garnet inclusions compared with models for these phases in subsolidus peridotite (blue) and MORB (red) at transition-zone conditions, as described in Thomson et al.Reference Thomson, Walter, Kohn and Brooker57 Inclusion compositions are from Davies et al.,Reference Davies, Griffin, O’Reilly and McCandless180 Stachel et al.,Reference Stachel, Harris, Brey and Joswig98, Reference Stachel, Brey and Harris178 Kaminsky et al.,Reference Kaminsky100 Tappert et al.,Reference Tappert105 Bulanova et al.,Reference Bulanova21 Hutchison,Reference Hutchison, Cartigny, Harris, Gurney, Gurney, Pascoe and Richardson99, Reference Hutchison181 Moore et al.,Reference Moore, Gurney, Griffin and Shimizu182 and Burnham et al.Reference Burnham103 (c) Pressure–temperature plot showing the solidi of model carbonated MORB with 2.5 wt.% CO2Reference Thomson176 and ~4.5% CO2Reference Kiseeva, Litasov, Yaxley, Ohtani and Kamenetsky179 relative to model geotherms for slab surface temperature at modern subduction zones (Syracuse et al.Reference Syracuse183). The solidi create a depth interval over which most slab surface temperatures intersect the melting curves, producing a region of carbonated melt generation.

Inclusions interpreted to have originated as Ca-rich perovskite come in two varieties: Ti rich and Ti poor. Ti-rich inclusions typically unmix to nearly phase-pure CaTiO3-perovskite plus walstromite, larnite, titanite, or wollastonite, whereas CaSiO3 varieties are typically walstromite. An important feature of nearly all Ca-perovskite inclusions is their very low MgO content, typically <0.5 wt.%, which effectively precludes equilibration in the lower mantle with bridgmanite at mantle temperatures.Reference Armstrong187 This observation, together with phase relations in the CaSiO3–CaTiO3 system,Reference Kubo, Suzuki and Akaogi188 constrains the original Ti-rich perovskites to have formed between ~10 and 25 GPa, similar to the majorite inclusions. The exception are some rare occurrences of Ti-poor CaSiO3 inclusions that have moderate MgO contents, and these may have formed in a lower mantle, peridotitic protolith.Reference Burnham103
A feature common to most Ca-perovskite and majorite inclusions is extreme enrichment in trace elements.Reference Thomson20, Reference Bulanova21, Reference Walter56, Reference Wang, Gasparik and Rapp174, Reference Stachel, Brey and Harris178, Reference Zedgenizov, Ragozin, Kalinina and Kagi189 Figure 5.9 shows normalized trace element abundances in inclusions compared to the modeled abundances for these phases in either mantle peridotite or subducted basalt at transition-zone pressures. These inclusions are not fragments of ambient solid mantle or subducted basalt, and in many cases the most incompatible elements are four to five orders of magnitude more abundant than expected for minerals in these lithologies. Wang et al.Reference Wang, Gasparik and Rapp174 suggested a role for carbonated melt in the origin of Ca-perovskite inclusions, and the distinct trace element patterns in Ca-perovskite and majorite inclusions from Juína, Brazil, indicate that the inclusions crystallized from carbonated melt derived from subducted oceanic crust.Reference Thomson20, Reference Bulanova21, Reference Walter56, Reference Thomson176, Reference Zedgenizov, Ragozin, Kalinina and Kagi189
The involvement of recycled crustal components in the origin of super-deep diamonds is supported by observations that the diamond hosts show a wide range of carbon isotope compositions extending to very light values (e.g. ~0% to –25%)Reference Thomson20, Reference Bulanova21 and that majorite garnet and other silicate inclusions have isotopically heavy oxygen isotope compositions.Reference Burnham104, Reference Ickert, Stachel, Stern and Harris109 The high and variable ferric iron content of majorite inclusions is also consistent with an oxidized carbonate component in their origin.Reference Kiseeva, Wood, Ghosh and Stachel190
The solidus of carbonated basalt is notably depressed at deep upper-mantle and transition zone pressures (e.g. Refs. Reference Thomson, Walter, Kohn and Brooker57, Reference Kiseeva, Litasov, Yaxley, Ohtani and Kamenetsky179), and in model MORB composition with 2.5% CO2, a deep a solidus ledge occurs at pressures of 10–15 GPa (Figure 5.9).Reference Thomson, Walter, Kohn and Brooker57 Model geotherms for hot and average surface slab temperaturesReference Syracuse183 intersect the carbonated basalt solidi, and only the coldest slab surface geotherms can escape melting. Carbonated basalt will melt in the deep upper mantle and transition zone and produce alkali-rich silico-carbonate melts.
Mantle peridotite is reducing and expected to be saturated in metal at transition zone depths.Reference Rohrbach and Schmidt142 Upon infiltration into the mantle, oxidized carbonated melts will reduce to diamond plus oxygen in a process called “redox freezing.”Reference Rohrbach and Schmidt142 Experiments mimicking this process show that, upon reaction with peridotite at transition zone pressures, such melts can crystallize calcic majorite and Ca-perovskite with compositions matching those found as inclusions.Reference Thomson, Walter, Kohn and Brooker57 This melt metasomatism can also produce both Fe- and Mg-rich periclase,Reference Thomson, Walter, Kohn and Brooker57 which are common minerals in super-deep assemblages (e.g. Refs. Reference Harte12, Reference Kaminsky191). Some large, gem-quality super-deep diamonds show evidence of growing directly from carbon-saturated metallic melts,Reference Smith49 testifying to a wide range of redox conditions in deeply subducted material.
Future studies will concentrate on determining the role of low-degree, volatile-rich melts in a wider array of inclusions in super-deep diamonds, elucidate the role of water, model the reactive transport processes by which this melt metasomatism occurs, and determine its role in modifying mantle elemental and isotopic compositions.
5.5.5 Evidence for Carbon-Reducing Regions of the Convecting Mantle
The existence, extent, and scale of oxidized versus reduced regions of the convecting mantle are critically important to understanding how carbon moves around at depth. Large and relatively pure diamonds have recently been shown to contain key physical evidence of metallic iron from the deep sublithospheric mantle,Reference Smith49, Reference Smith, Shirey and Wang192 suggesting that metallic iron may be one of the principal reservoirs of mantle carbon in this region. As a family, diamonds like the historic 3106 carat Cullinan diamond tend to be large, inclusion poor, relatively pure (usually Type IIa), and in their rough state they are irregularly shaped and significantly resorbed.Reference Smith49, Reference Moore193, Reference Bowen, Ferraris, Palmer and Ward194 These characteristics are combined into the acronym “CLIPPIR” (Cullinan-like, Large, Inclusion Poor, Pure, Irregular, and Resorbed) to label this genetically distinct diamond variety.
Out of 81 inclusion-bearing CLIPPIR diamonds, the most common inclusion encountered is a composite, metallic iron–nickel–carbon–sulfur mixture (Figure 5.10). In fact, 60 of the 81 samples contain only this inclusion, which attests to its predominance in the CLIPPIR variety.Reference Smith, Shirey and Wang192 The metallic inclusions are a made up of cohenite ((Fe,Ni)3C), interstitial Fe–Ni alloy, segregations of Fe-sulfide, and minor occasional Fe–Cr-oxide, Fe-oxide, and Fe-phosphate.Reference Smith, Shirey and Wang192 A thin fluid layer of CH4 and lesser H2 is trapped at the interface between the solid inclusion and surrounding diamond. The mixture is interpreted to have been trapped as a molten metallic liquid.
(a) Metallic inclusions in a 9.56 carat CLIPPIR diamond with an enlargement of one of the inclusions. These metallic inclusions sometimes have a needle-like tail and typically have large, graphitic decompression cracks around them. (b) Depth constraints place the origin of these diamonds within 360–750‑km depths in the mantle, where they are associated with subducted lithologies. The metallic inclusions are evidence for reduced, metal-bearing regions of the deep mantle below a depth of approximately 250 km.

Other inclusions found in CLIPPIR diamonds represent high-pressure silicates, which provide a constraint for the depth of diamond formation. The second most abundant inclusion, after the metallic Fe–Ni–C–S, is a mix of calcium silicates interpreted as retrogressed CaSiO3-perovskite (CaPv), which is a high-pressure mineral stable at depths beyond about 360 km.Reference Nestola25, Reference Anzolini31, Reference Brenker195 An additional inclusion phase found was low-Cr majoritic garnet, which provides a maximum depth bracket, since it is not stable deeper than about 750 km.Reference Wijbrans, Rohrbach and Klemme196 Silicate inclusion phases therefore bracket the depth to 360–750 km, overlapping the mantle transition zone.
The Fe–Ni–C–S inclusions in CLIPPIR diamonds are physical samples of an Fe-rich metallic liquid from the deep mantle, which help to confirm the fundamental process of Fe2+ disproportionation at depth.Reference Smith49 Disproportionation is driven by the progressive increase in the capacity for silicate minerals to host Fe3+ preferentially over Fe2+ with increasing pressures, promoting the following reaction: 3Fe2+ ➜ 2Fe3+ + Fe0. The “oxidized” Fe3+ is partitioned into the silicates, but the “reduced” Fe0 separates into its own metallic phase, which is thought to generate up to about 1 wt.% metal in the lower mantle.Reference Rohrbach and Schmidt142, Reference Bell, Mao, Weeks and Valkenburg197–Reference Rohrbach199 This metal budget should regulate fO2, keeping it near the iron–wüstite buffer below ~250 km and establishing a carbon-reducing environment in much of the deep mantle.Reference Rohrbach and Schmidt142 The solubility of carbon in metallic Fe liquid is very high, up to ~6 wt.%, and it is ~2% in solid Fe metal at lower temperatures. Thus, in regions of the transition zone and lower mantle where metallic Fe exists, the mantle’s entire budget of carbon might be dissolved in Fe metal and diamond would not be a stable phase.
In order to confirm the experiments and theory that the bulk of Earth’s mantle below ~250 km is likely saturated with metallic iron,Reference Frost198–Reference Ballhaus200 obtaining direct samples is important because the behavior of carbon in the mantle is so strongly affected by oxygen fugacity. In a metal-saturated mantle, carbon is expected to be efficiently reduced and dissolved into the metal phase, or potentially precipitated as carbide or diamond,Reference Rohrbach and Schmidt142 and this has large-scale implications for the behavior of carbon in the mantle over geologic time. In CLIPPIR diamonds, variably light carbon isotopic signatures as well as the composition of majoritic garnet inclusions suggest the involvement of subducted materials.Reference Smith49 This additional observation implies that deeply recycled carbon can enter into carbon-reducing regions of the mantle and become dissolved into metallic phases. Thus, dispersed Fe-rich metal in the deeper, convecting mantle may contain both primordial and recycled carbon, whose proportions may have changed with time. Further research into the influence of metallic iron on carbon in the mantle will explore the evolution of storage and cycling, from core formation to the onset of modern-style plate tectonics.
5.6 Limits to Knowledge and Questions for the Future
Limits to knowledge in diamond research have been the typical occurrence of each diamond as a single isolated xenocryst, its pure crystal structure, the rarity of inclusions, and the availability of samples (see Section 5.1). The DMGC consortium was conceived early in the existence of the DCO to help overcome these and other obstacles to reaching the following major goals: (1) a research focus on the most widely occurring carbon mineral on Earth; (2) the use of diamond’s special ability to preserve mineral inclusions, fluid species, and pathways from great depths and ages to provide a view of the otherwise inaccessible deep carbon cycle; and (3) application of cross-disciplinary research tools and sharing of samples necessary to go beyond a single investigator or research group.
Future directions in diamond research in relation to the bigger picture of carbon in the deep Earth are best summed up with a list of questions:
What is the source of carbon and other volatiles returned by diamond from the deep mantle?
How can the findings from diamond studies be extrapolated to the bulk mantle?
What is the mineralogy and composition of the major deep mantle minerals?
What is the capacity for carbon and water storage in deep mantle minerals?
How and why do contrasting (carbonatitic versus metallic versus supercritical C–H–O fluids) diamond-forming environments exist?
What are the most effective mechanisms for diamond formation in these different mantle environments?
Do the C and N isotopic compositions of diamonds vary with geologic time, and if so, do they record major geodynamic changes?
What is the nature of diamond-forming fluids in the lithosphere, what are the mechanisms for their movement through the lithosphere, and what is their relation to geologic events?
How are accurate entrapment pressures and temperatures determined for mineral inclusions?
How do the fluids around mineral inclusions in gem diamonds compare with the hydrous–silicic fluids in fibrous diamonds?
What are the phase transformations in subducting slabs that allow some carbon, water, and other volatiles to be carried to the transition zone?
Taken in total, the studies made by the DMGC consortium will provide new insights into how carbon behaves and resides in both the lithosphere and the deeper convecting mantle. Moreover, through diamond’s remarkable attributes, diamond studies will allow us to go beyond the study of carbon alone, to make fundamental discoveries on the nature of the deep Earth that is inaccessible in any other way, and to understand the spectrum of geological processes that govern how carbon gets into the mantle and the form in which it resides.
Acknowledgments
The authors thank the following institutions and individuals: our home institutions; SBS and EHH for support from the US National Science Foundation (EAR-104992); FN and PN for support from the European Research Council Starting Grant (#307322); Wuyi Wang and Tom Moses of the Gemological Institute of America (GIA) for the support of the research projects undertaken by KVS and EMS; and SCK for the support of De Beers Technologies. This is contribution 1168 from the ARC Centre of Excellence for Core to Crust Fluid Systems (www.ccfs.mq.edu.au) and 1130 in the Geochemical Evolution and Metallogeny of the Continents Key Centre (www.gemoc.mq.edu.au). Over the years, we have benefitted from discussions and collaborations with other DMGC consortium researchers who are not coauthors of this chapter: Galina Bulanova, Jeffrey Harris, Dan Howell, Shantanu Keshav, Stephen Richardson, Chris Smith, Nikolai Sobolev, and Laura Speich. During the preparation of this chapter, our coauthor and leader within the DCO, Erik H. Hauri, died tragically. We remember him as a champion of diamond research and thank him posthumously for his strong support.
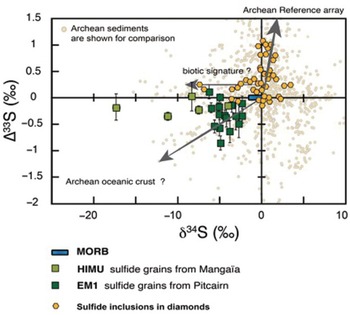
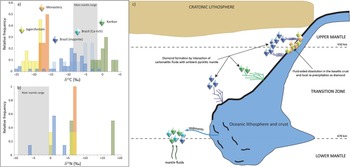
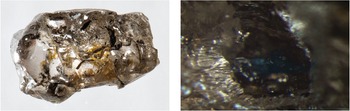
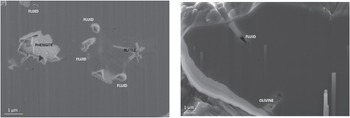
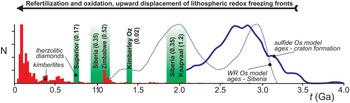
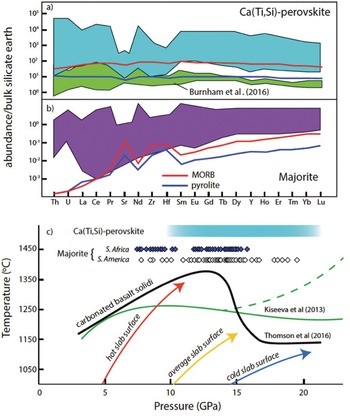
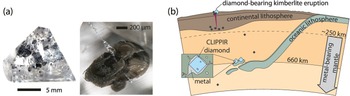

 Open access