

Volatile organic compounds (VOCs) emitted from industrial processes are major contributors to air pollution, including photochemical smog, tropospheric ozone and inhalable particulate matter, thereby posing significant threats to both the environment and human health (Kamal et al., Reference Kamal, Razzak and Hossain2016; Sonne et al., Reference Sonne, Xia, Dadvand, Targino and Lam2022). Catalytic oxidation is regarded as an environmentally friendly and efficient method for eliminating VOCs due to its high efficiency, low reaction temperature and harmless final products (Wei et al., Reference Wei, Yang, Tian, Zhang, Zhang, Zhang and Li2022; Zhu et al., Reference Zhu, Song, Li, Hu, Qi and Gao2024). Therefore, the development of highly efficient and cost-effective catalysts for VOC oxidation is of great significance.
Among non-precious metal oxide catalysts, spinel oxides with unique structures exhibit favourable stability and are little influenced by thermal shock and water vapour (Zhang et al., Reference Zhang, Wu, Li and You2017; Dai et al., Reference Dai, Kumar, Zhu, Wang, Smith, Wolf and MacLachlan2019). In the AB2O4 spinel structure, the metal sites at tetrahedral and octahedral positions can be modulated by various metal cations, directly influencing the redox properties and acidity of the catalyst (Wang et al., Reference Wang, Jia, Luo and Lu2015, Reference Wang, Lan, Zhang, Chen, Jiang and Wang2017). The geometric distribution of metal cations can tailor its electronic structure and oxygen-related properties, thereby further modulating the catalytic performance in VOC oxidation (Sun et al., Reference Sun, Xue, Zhang, Zhang, Guo and Song2022; Wu et al., Reference Wu, Wang, Zheng, Sun, Xie and Ma2022). Zhang et al. (Reference Zhang, Descorme, Valverde and Giroir-Fendler2022b) constructed anion defects in NiCo2O4 via a mechanochemical strategy involving sodium-assisted ball milling for propane oxidation. This approach significantly increased the oxygen vacancy concentration and oxygen mobility of the catalyst. As a novel type of transition metal-based mixed oxide, copper–cobalt spinel oxide (CuCo2O4) demonstrated remarkable advantages in catalysis and energy conversion due to its unique structural features and synergistic compositional effects (Zhuge et al., Reference Zhuge, Zhou, Chen, Liu and Du2023; García-Peña et al., Reference García-Peña, Redón, Gomez-Peralta, Díaz, Bohkimi and Daza-Gómez2025; Li et al., Reference Li, Liu, Mou, Yu, Wu and Wang2025). Zhang et al. (Reference Zhang, Sui, Zhang, Niu, Li and Wan2022a) reported the application of Cu–Co mixed oxides in the oxidation of toluene and propane, highlighting that incorporating an appropriate amount of Cu into Co3O4 induced structural defects and weakened the Co–O bond, thereby facilitating oxygen activation. Ma et al. (Reference Ma, Wang, Ma, Liu, Einaga and He2022) prepared CuCo2O4 catalysts with various cationic substitutions, showing that Cu substitution altered the valence and geometric distribution of Co cations and thus promoted the oxidation of olefins.
Biochar possesses a high specific surface area, a porous structure and abundant functional groups (Wang & Wang, Reference Wang and Wang2019), which can facilitate the dispersed growth of active components on its surface and reduce particle aggregation (Luo et al., Reference Luo, Tian, Wang, Chen, Liu and Shu2024). Huang et al. (Reference Huang, Zhang, Wu, Zuo, Yao, Ni and Li2024) synthesized perovskite oxide LaCoO3 supported on biomass-derived biochar nanocomposites via a sol–gel method using waste pomegranate peel as a complexing agent for photothermal catalytic oxidation of toluene (Song et al., Reference Song, Wang, Yin, Xiao and Ma2022). The incorporation of biomass significantly improved the dispersion of LaCoO3 particles and increased toluene adsorption capacity. Among various waste biomass sources, walnut shells are rich in highly active ellagic acid, gallic acid derivatives and flavonoids. During pyrolysis, they generate a strongly reducing atmosphere that efficiently reduces metal ions and stabilizes active sites, endowing them with unique potential for catalytic oxidation applications (Yuan et al., Reference Yuan, He, Yin and Xu2020; Lu et al., Reference Lu, Zhang, Wu, Liu, Xue, Yao and Li2024; Zhang et al., Reference Zhang, Cao, Zhang, Wang and Tian2024).
As a natural silicate clay mineral, ATP features a unique one-dimensional nanorod crystal structure and high specific surface area. Its surface is abundant in hydroxyl groups and acid sites, making it a promising catalyst support with distinct interfacial activity advantages in catalysis and adsorption (Li et al., Reference Li, Wang, Shi, Dai, Zuo, Yao and Ni2020; Tian et al., Reference Tian, Xiao and Yao2025). For instance, low-grade ATP clay from the Linze region of China serves as an effective support for highly dispersed Mn–Ce oxides in toluene catalytic oxidation without prior purification (Zou et al., Reference Zou, Guo, Peng, Dai, Xu and Zhang2025). Huang et al. (Reference Huang, Ye, Li, Shi, Chu and Cao2022) synthesized a CeO2:Yb3+, Er3+/ATP nanocomposite via a one-step precipitation method and found that it exhibited excellent photothermal catalytic performance and water resistance. Liu et al. (Reference Liu, Zhang, Huhe, Yao and Li2025b) prepared MnCo2O4.5/ATP composites for photothermal catalytic degradation of toluene and found that ATP promoted the formation of an interfacial structure rich in oxygen vacancies. However, ATP alone cannot enable the high level of immobilization of active species, and therefore it needs the assistance of secondary support such as biochar. To date, there have been no reports on the construction of a spinel/biochar/ATP composite catalyst for the catalytic oxidation of VOCs.
In this work, waste walnut shell biomass was employed as a green complexing agent to construct a ternary CuCo2O4/biochar/ATP composite via a one-step sol–gel method. Various characterization techniques were used to analyse the crystal structure, morphology, active oxygen species and redox properties of the composites. The catalytic performance in terms of VOC degradation was evaluated, and the influence of various biomass walnut shell ratios on toluene degradation was explored. This study opens a new pathway for the utilization of waste biomass in the preparation of high-performance spinel-based catalysts.
Experimental
Chemicals
ATP was purchased from Jiangsu Nanda Zijin Technology Co., Ltd. Copper nitrate, cobalt nitrate and citric acid were obtained from Sinopharm Chemical Reagent Co, Ltd. Walnut shell powder was obtained from Shanxi Province, China.
Preparation of the CuCo2O4/biochar/ATP composite
The CuCo2O4/biochar/ATP composite catalyst was synthesized via a sol–gel method. Raw walnut shells were washed with deionized water, mechanically pulverized, sieved through a 180 mesh screen, rinsed again with water and dried in a constant-temperature oven for 12 h to obtain pretreated biomass powder. Subsequently, copper nitrate and cobalt nitrate were accurately weighed in a metal molar ratio of 1:2 and dissolved in 50 mL of deionized water. The mass ratio of spinel to ATP was fixed at 1:5, while samples with varying walnut shell-to-ATP mass ratios (1:2, 1:3, 1:4 and 1:5) were prepared. The mixture was continuously stirred mechanically at 80°C for 6 h to form a wet gel via a sol–gel transition. After ageing at 80°C for 12 h in an oven, a dry gel was obtained, which was then ground and subjected to calcination at 500°C in air with a heating rate of 5°C min–1, yielding the final CuCo2O4/biochar/ATP composite (Lu et al., Reference Lu, Zhang, Wu, Liu, Xue, Yao and Li2024). For comparison, pure CuCo2O4, CuCo2O4/ATP and CuCo2O4/biochar/ATP samples were also prepared under identical process conditions using citric acid.
Characterization
X-ray diffraction (XRD; Bruker D8 Advance) traces were recorded over a diffraction angle range from 5° to 80° with a scanning speed of 5° min–1 and a step size of 0.02°. The X-ray source was Cu-Kα radiation (λ = 0.15406 nm), operated at 40 kV and 40 mA. The morphology and particle size of the as-prepared catalysts were examined using transmission electron microscopy (TEM; JEM-2100, JEOL) operated at an accelerating voltage of 200 kV. The powder samples were dispersed in ethanol by ultrasonication for 10 min, and then a drop of the suspension was deposited onto a carbon-coated copper grid and dried at ambient temperature. X-ray photoelectron spectroscopy (XPS; Thermo Scientific K-Alpha, USA), irradiated with Al-Kα radiation, was conducted to investigate the surface valence state and composition. Electron spin resonance (ESR) experiments were conducted using an ESR spectrometer (Bruker EMXplus-6/1, Germany). Hydrogen temperature-programmed reduction (H2-TPR) was conducted in a mixed H2/Ar stream ranging from 100℃ to 800℃ with a programmed 10℃ min–1 heating rate on an Auto Chem II 2920 (Micromeritics, USA) device. All of the in situ diffuse reflectance infrared Fourier-transform spectroscopy (DRIFTS) tests were undertaken using a Frontier FTIR spectrometer (Thermo Fisher iS20, USA). Raman spectra were recorded on a LabRAM HR Evolution spectrometer (HORIBA) using a 532 nm laser. Electron paramagnetic resonance (EPR) spectra were recorded at room temperature on a Bruker EMXplus-6/1 spectrometer operating at the X-band (9.4 GHz). The catalyst was first pretreated at 200°C under a N2 atmosphere for 30 min to remove physically adsorbed species. After cooling to 30°C, in situ infrared spectra were collected during toluene adsorption.
Catalytic oxidation of toluene
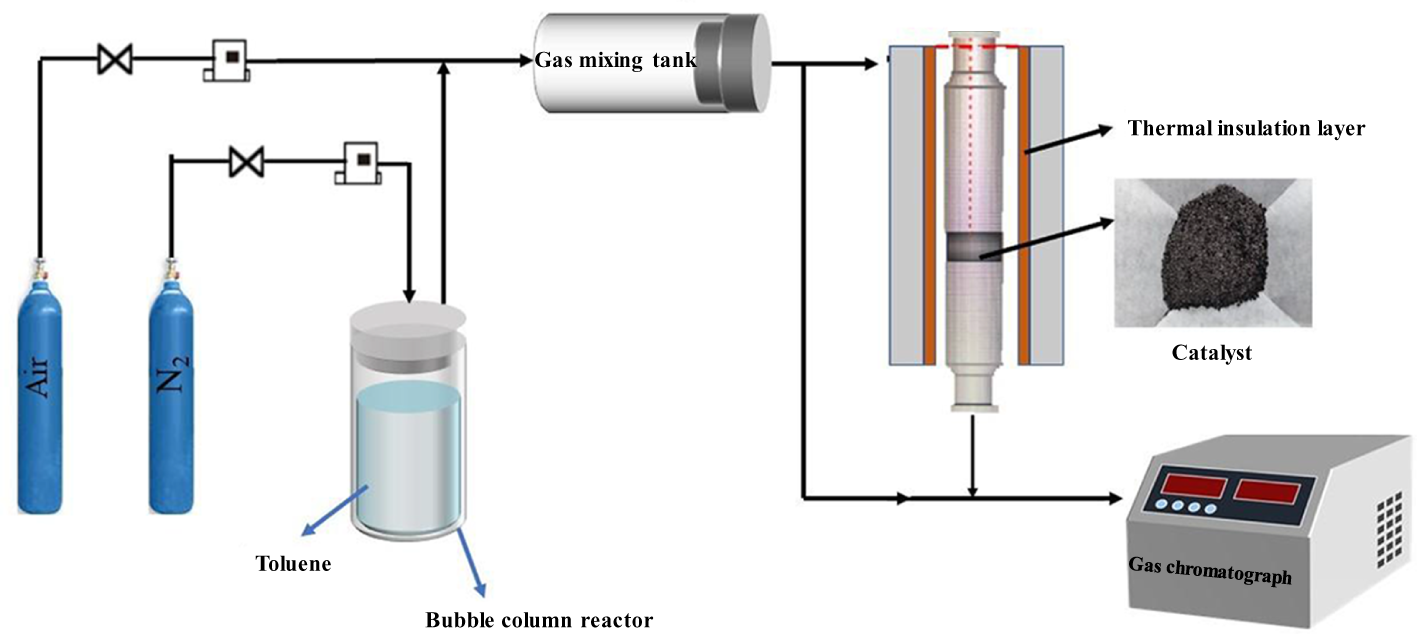
The catalytic oxidation tests were conducted in a fixed-bed reactor as shown in Fig. 1. The catalyst bed, consisting of 1 g of catalyst (40–60 mesh) diluted with 4 g of quartz sand (40–60 mesh), was packed into a quartz tube. To generate toluene gas streams of varying concentrations, a nitrogen flow was bubbled through a liquid toluene container at a controlled rate. The resulting vapour was then mixed with dry air, and the reaction temperature and gas flow rates were regulated by a central computer system. In a typical test, the inlet gas stream was first directed to a GC-2014 gas chromatograph (Shimadzu, Japan) to measure the initial toluene concentration. Then, the gas was diverted to pass through the catalyst bed for the measurement of the outlet concentration. The temperature was increased from room temperature to the target value in increments of 5°C. The system was held at each temperature for 10 min to ensure steady-state conditions were achieved. The toluene degradation was calculated using Equation 1:
 \begin{equation}{\text{Toluene degradation }}\left( {\text{\% }} \right) = \frac{{{\text{Toluen}}{{\text{e}}_{{\text{in}}}}{ } - {\text{ Toluen}}{{\text{e}}_{{\text{out}}}}}}{{{\text{Toluen}}{{\text{e}}_{{\text{in}}}}}}\, \times 100\% \,\end{equation}
Schematic illustration of the fixed-bed reactor system for toluene degradation.

Figure 1 Long description
The schematic illustrates a fixed-bed reactor system for toluene degradation. On the left, two gas cylinders labeled ′Air′ and ′N subscript 2′ are connected to a series of valves and pipes. These pipes lead to a bubble column reactor containing toluene. The output from the bubble column reactor is directed to a gas mixing tank. From the gas mixing tank, the gas mixture flows into a vertical reactor with a thermal insulation layer. Inside the reactor, a section is highlighted to show the catalyst. The gas then exits the reactor and is directed to a gas chromatograph on the right, which is used for analyzing the gas composition. The entire setup is designed to facilitate the catalytic oxidation of toluene, with the gas flow and reaction conditions controlled throughout the system.
Where Toluenein and Tolueneout are measured in parts per million (ppm).
Results and discussion
XRD analysis
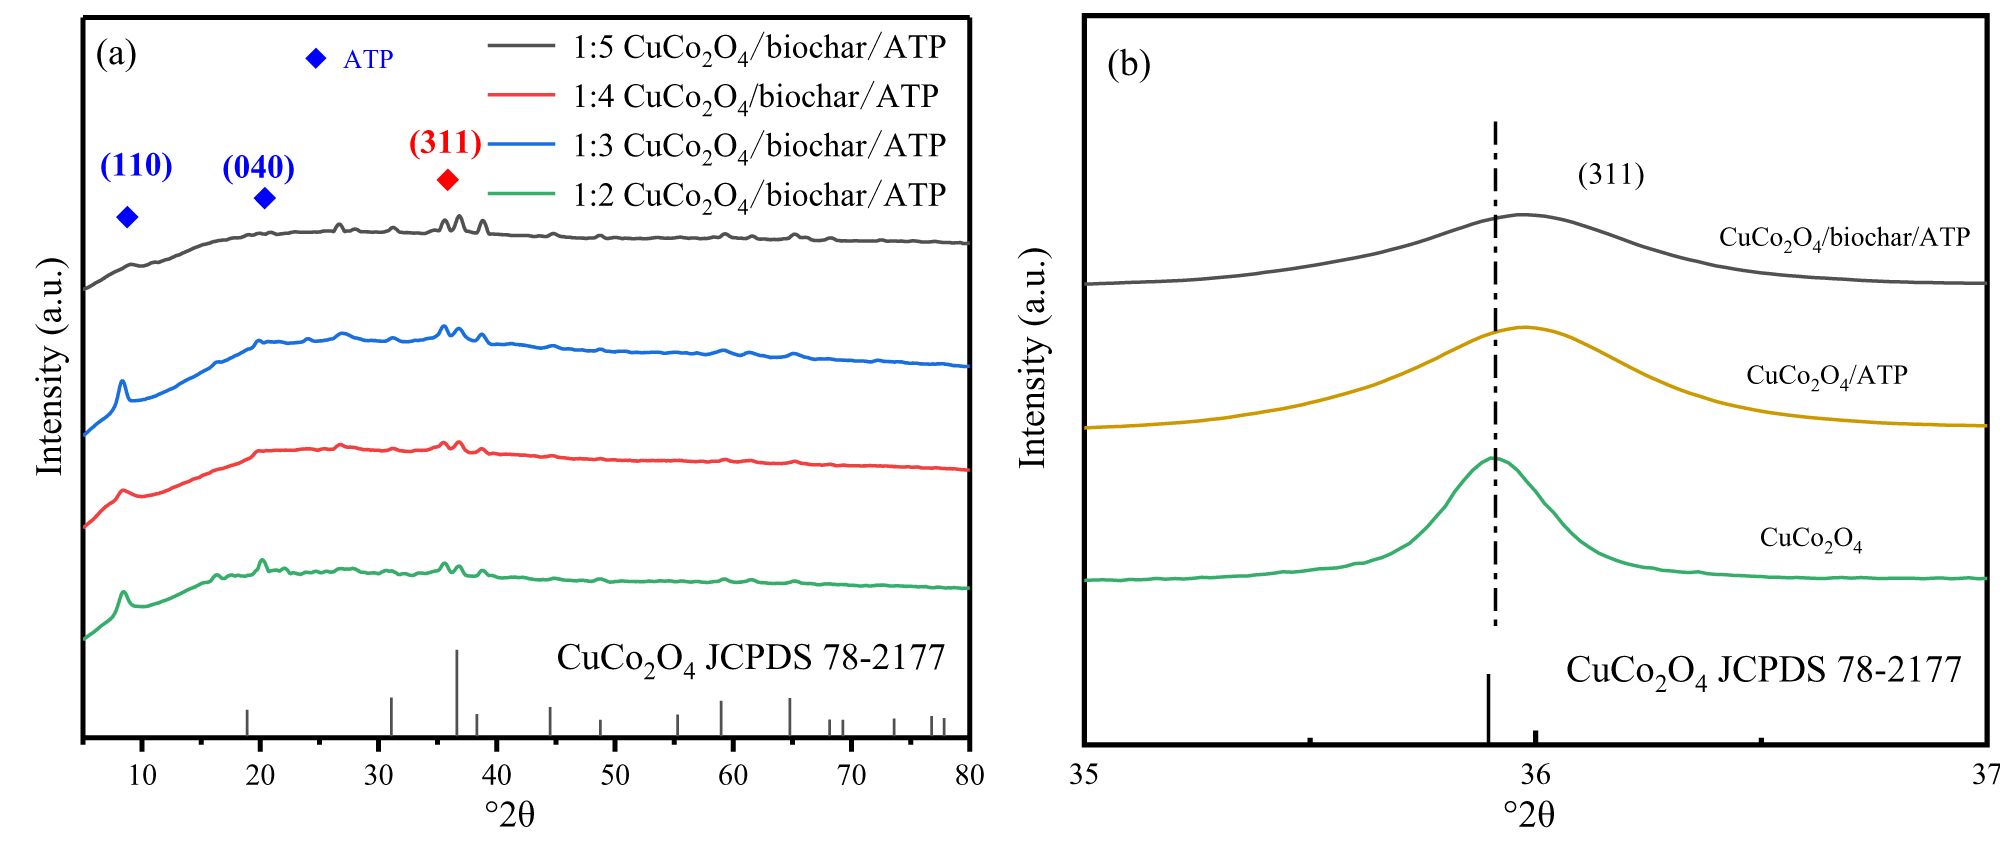
The phase structure of the as-synthesized CuCo2O4/biochar/ATP composite is characterized by XRD traces shown in Fig. 2a. The diffraction peaks of ATP appear at 8.49°2θ (d = 1.04 nm) and 19.85°2θ (d = 0.45 nm), which correspond to the (110) and (040) crystal planes, respectively, consistent with the standard ATP phase (Joint Committee on Powder Diffraction Standards (JCPDS) No. 21-0958). For CuCo2O4, the characteristic peaks at 31.56°2θ, 36.91°2θ, 59.77°2θ and 65.62°2θ match well with spinel CuCo2O4 (JCPDS No. 78-2177). No distinct diffraction peaks of biochar are detected in the XRD trace due to its low crystallinity and the dominant presence of amorphous carbon formed during biomass carbonization. These results confirm the successful formation of a spinel CuCo2O4 phase through the use of walnut shell as a complexing agent. Furthermore, as can be seen in Fig. 2b, the peak intensity corresponding to the (311) plane of CuCo2O4 in the CuCo2O4/biochar/ATP composite appears to be the weakest. This attenuation may be the result of the reducing atmosphere generated during biomass pyrolysis, which promotes the formation of surface defects in CuCo2O4 and facilitates the generation of abundant oxygen vacancies (Huang et al., Reference Huang, Ye, Li, Shi, Chu and Cao2022).
(a) XRD trace of CuCo2O4/biochar/ATP synthesized with various mass ratios of walnut shell. (b) A partially enlarged view of the XRD trace between 35°2θ and 37°2θ.
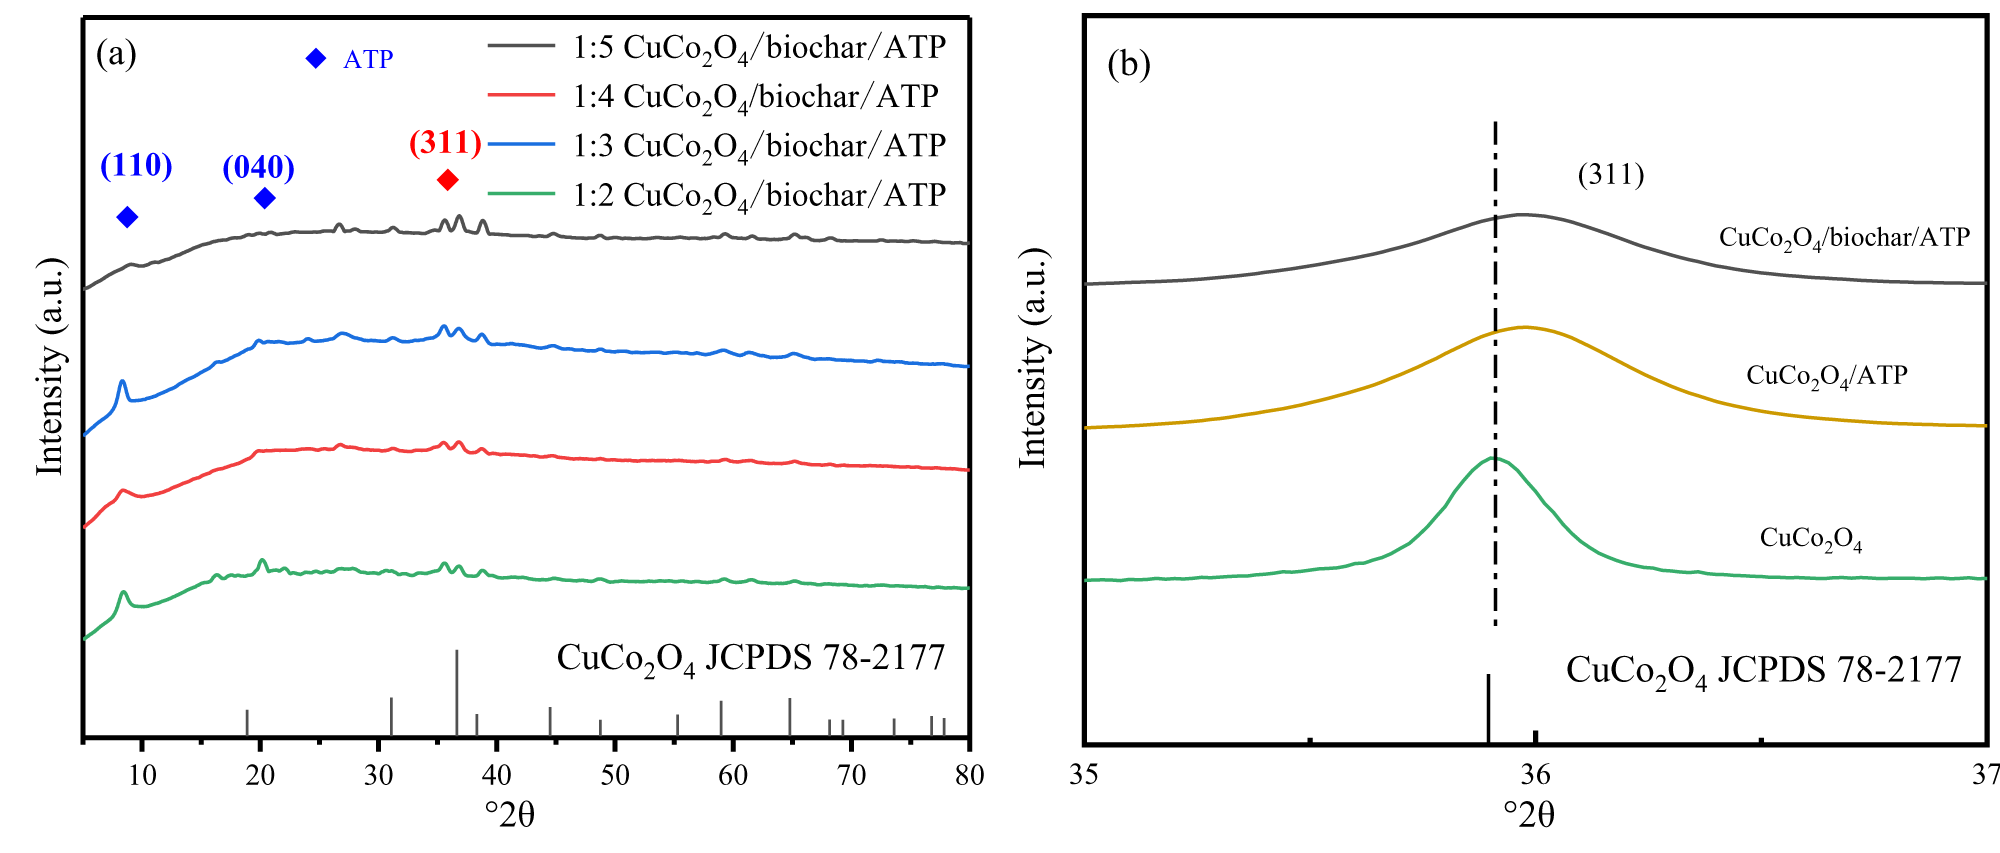
Figure 2 Long description
The image A showing a line plot with four stacked traces and a reference stick pattern. X-axis label: degree 2 theta. Tick labels shown: 10, 20, 30, 40, 50, 60, 70, 80. Y-axis label: Intensity (a.u.). Legend entries: ATP; 1:5 CuCo2O4 slash biochar slash ATP; 1:4 CuCo2O4 slash biochar slash ATP; 1:3 CuCo2O4 slash biochar slash ATP; 1:2 CuCo2O4 slash biochar slash ATP. Text near the bottom: CuCo2O4 JCPDS 78-2177. Two peak labels near the low-angle region: (110) and (040). One peak label near the mid-angle region: (311). The four traces show multiple small peaks across the full degree 2 theta range, with a more prominent labeled feature around the (311) position. The image B showing a line plot with three stacked traces and a vertical dashed line. X-axis label: degree 2 theta. Range shown: 35 to 37, with tick labels 35, 36, 37. Y-axis label: Intensity (a.u.). A vertical dashed line is drawn at 36 on the degree 2 theta axis. A peak label above the dashed line: (311). Trace labels placed near the curves: CuCo2O4 slash biochar slash ATP; CuCo2O4 slash ATP; CuCo2O4. Text near the bottom: CuCo2O4 JCPDS 78-2177. Each trace forms a single broad peak centered near 36 degree 2 theta, with the peak apex aligned close to the dashed line.
TEM analysis
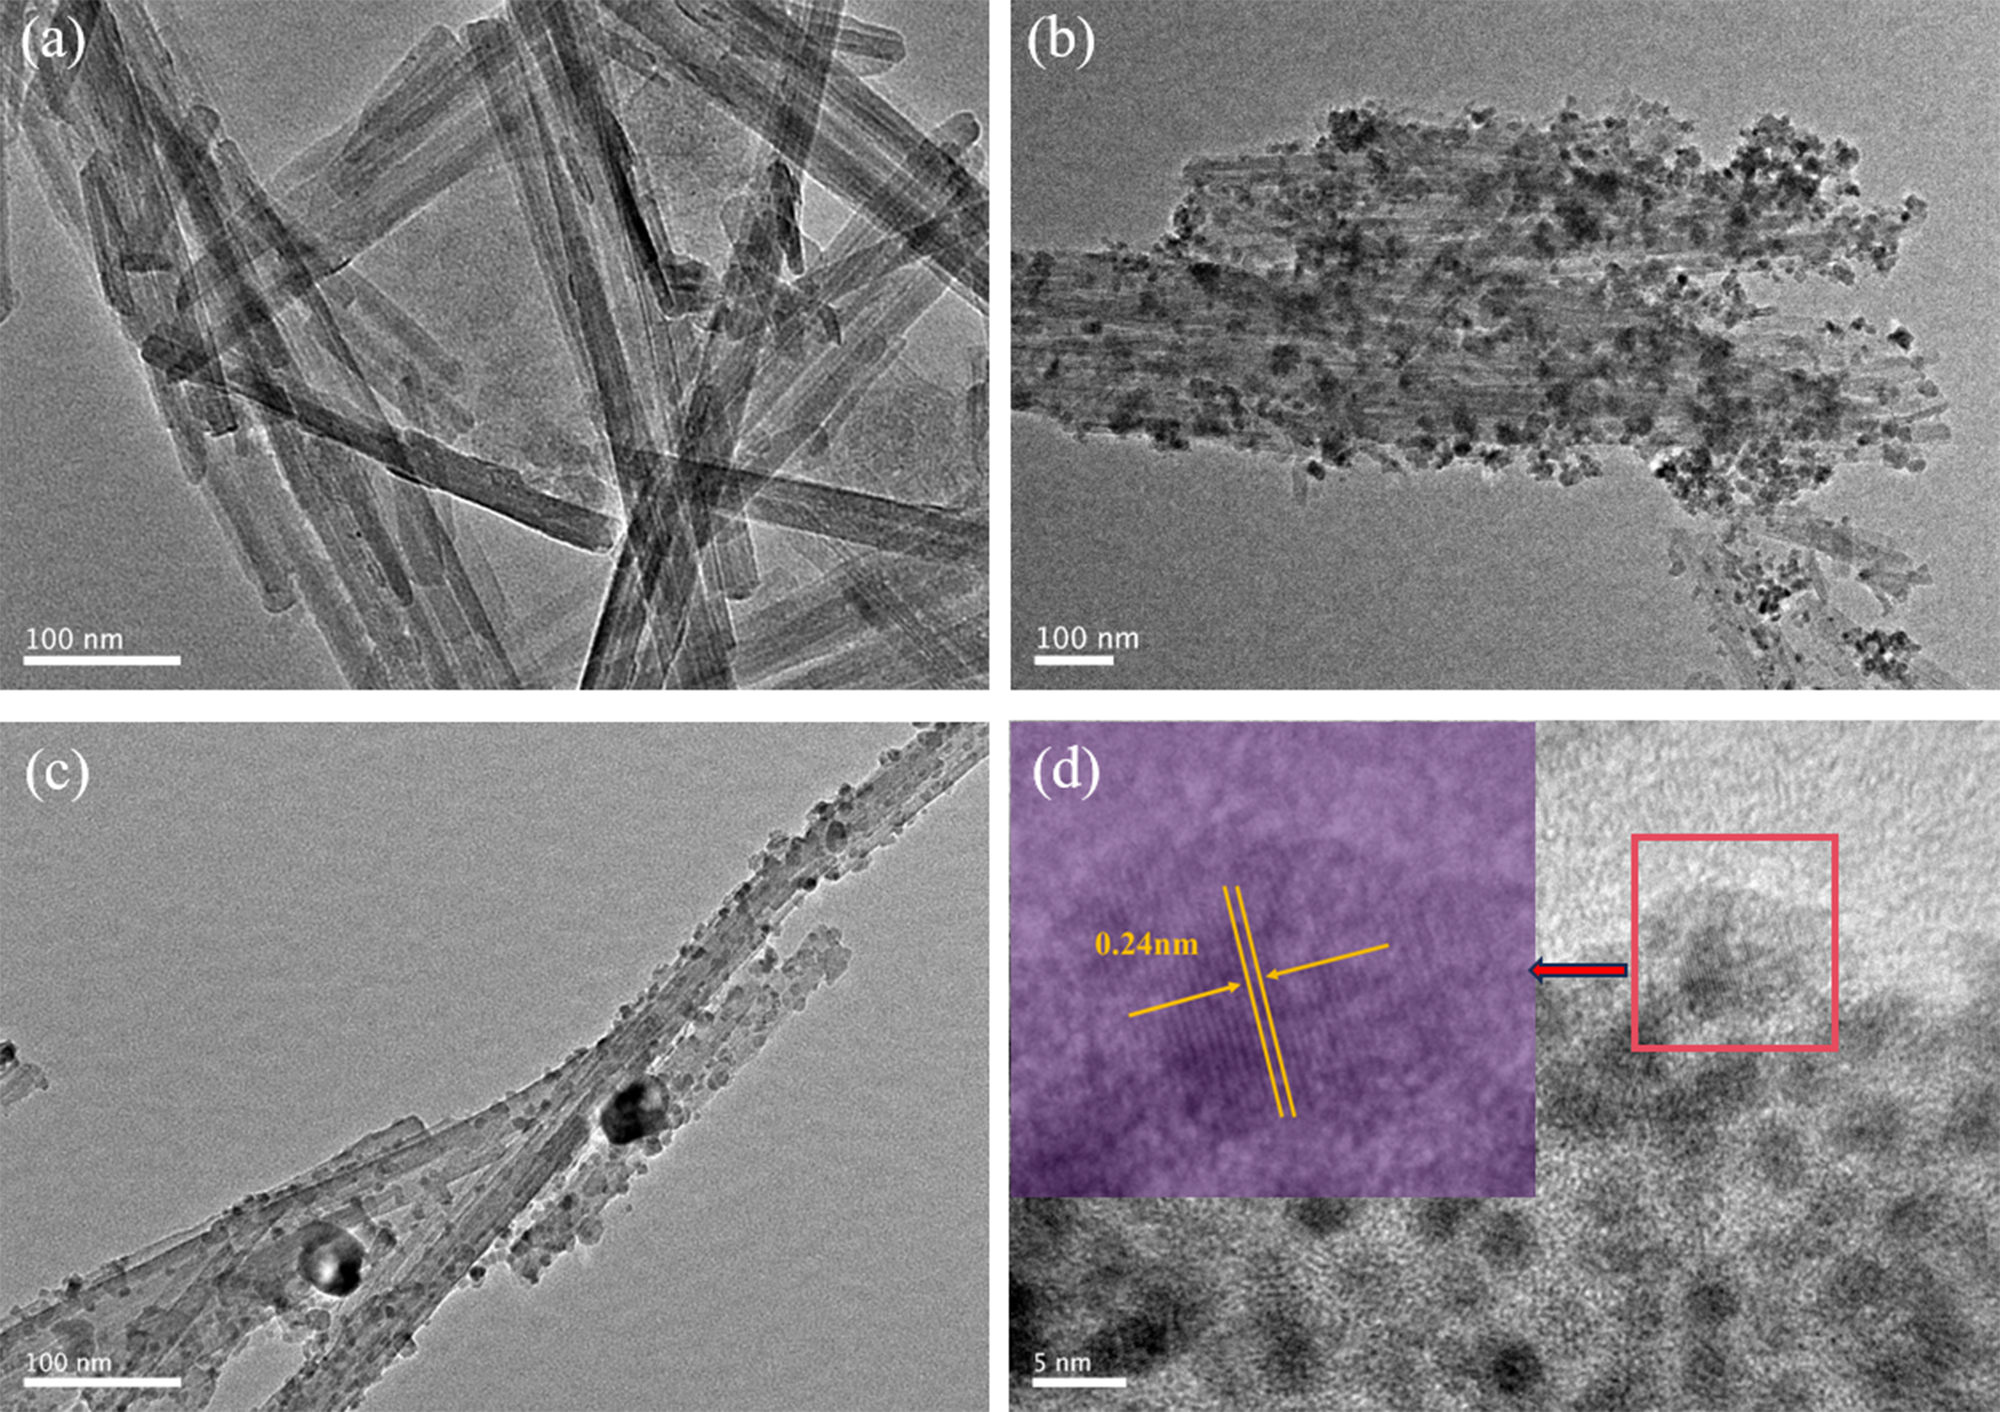
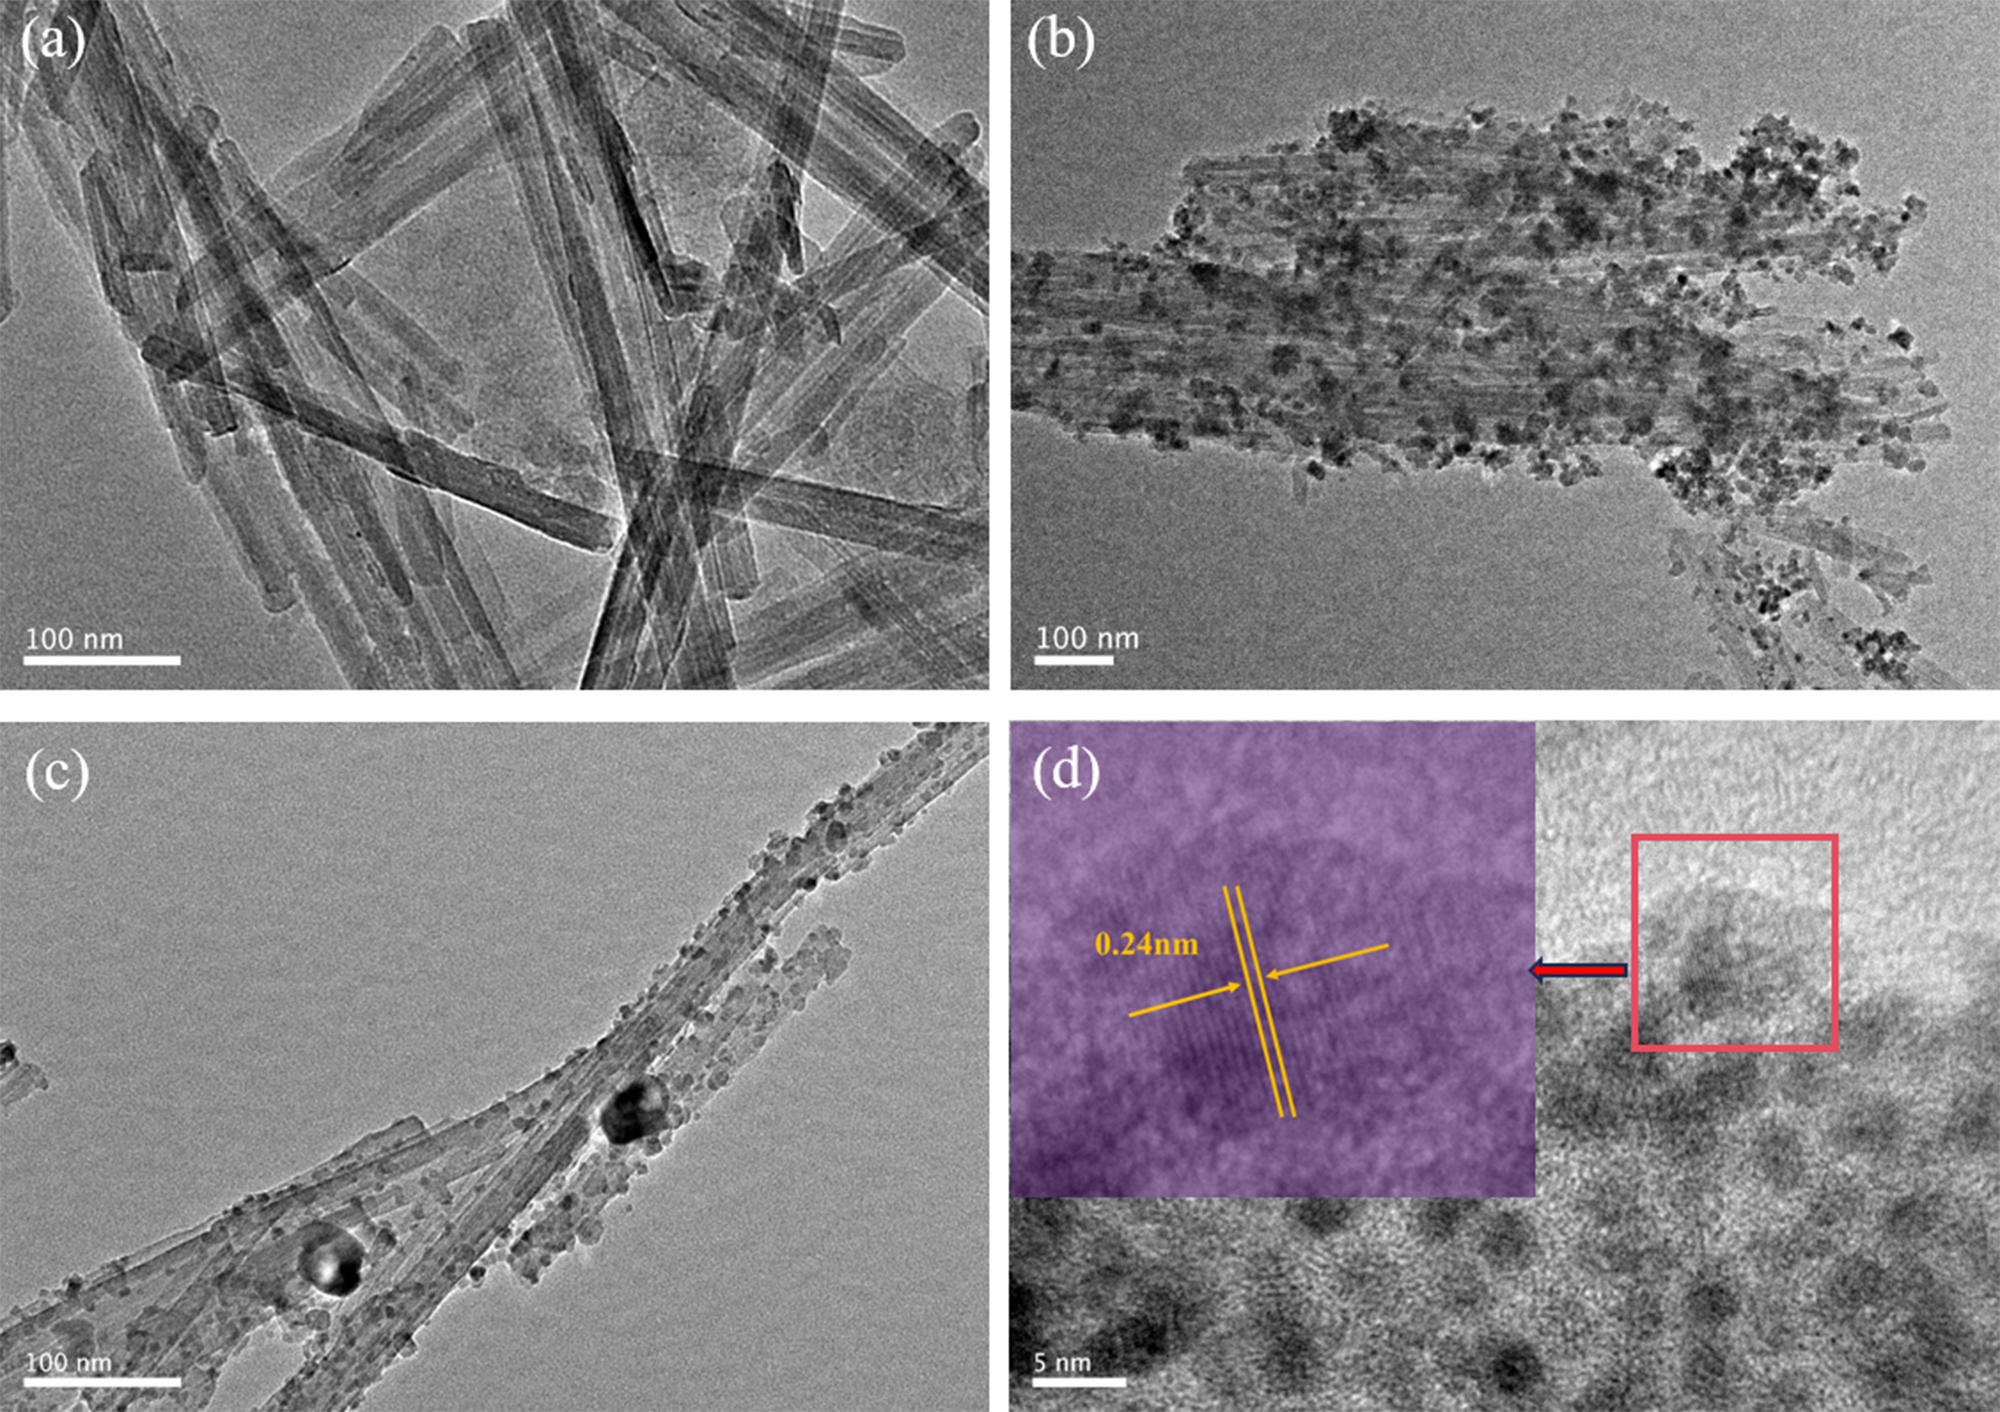
The microstructure and morphological characteristics of the catalysts were examined using TEM. In Fig. 3a, the pristine ATP support exhibits a typical irregular rod-like morphology with a cross-stacking architecture, with an average diameter ranging from 30 to 40 nm and discernible surface roughness (Xu et al., Reference Xu, Wen, Yu, Li and Tang2022). In Fig. 3b, the sample prepared with citric acid, labelled CuCo2O4/ATP, shows significant nanoparticle aggregation, indicating inhomogeneous dispersion of metal oxides across the carrier surface. Following structural modulation via the introduction of biochar, the CuCo2O4/biochar/ATP composite (Fig. 3c) demonstrates markedly improved dispersion characteristics, which can be further verified in Fig. S1. This structural enhancement is attributed primarily to the oxygen-containing functional groups (e.g. carboxyl and hydroxyl groups) enriched on the biochar surface, which facilitate strong coordination with metal ions. This enables a precise nucleation control mechanism and thereby optimizes the distribution of active sites (Zhu et al., Reference Zhu, Zhang, Wang, Wen, Su and Zhu2018). In addition, ATP serves as a robust support that further stabilizes the dispersed active species through its high surface area and abundant surface hydroxyl groups, preventing particle aggregation during calcination. In addition, the measured interplanar spacing of 0.24 nm in high-resolution TEM (HRTEM) in Fig. 3d can be attributed to the (311) crystal plane of the spinel-type CuCo2O4 (Zhuge et al., Reference Zhuge, Zhou, Chen, Liu, Liu and Xiang2025), consistent with the XRD results.
TEM images of (a) ATP, (b) CuCo2O4/ATP and (c) CuCo2O4/biochar/ATP and (d) a HRTEM image of CuCo2O4/biochar/ATP.
FTIR and Raman analyses
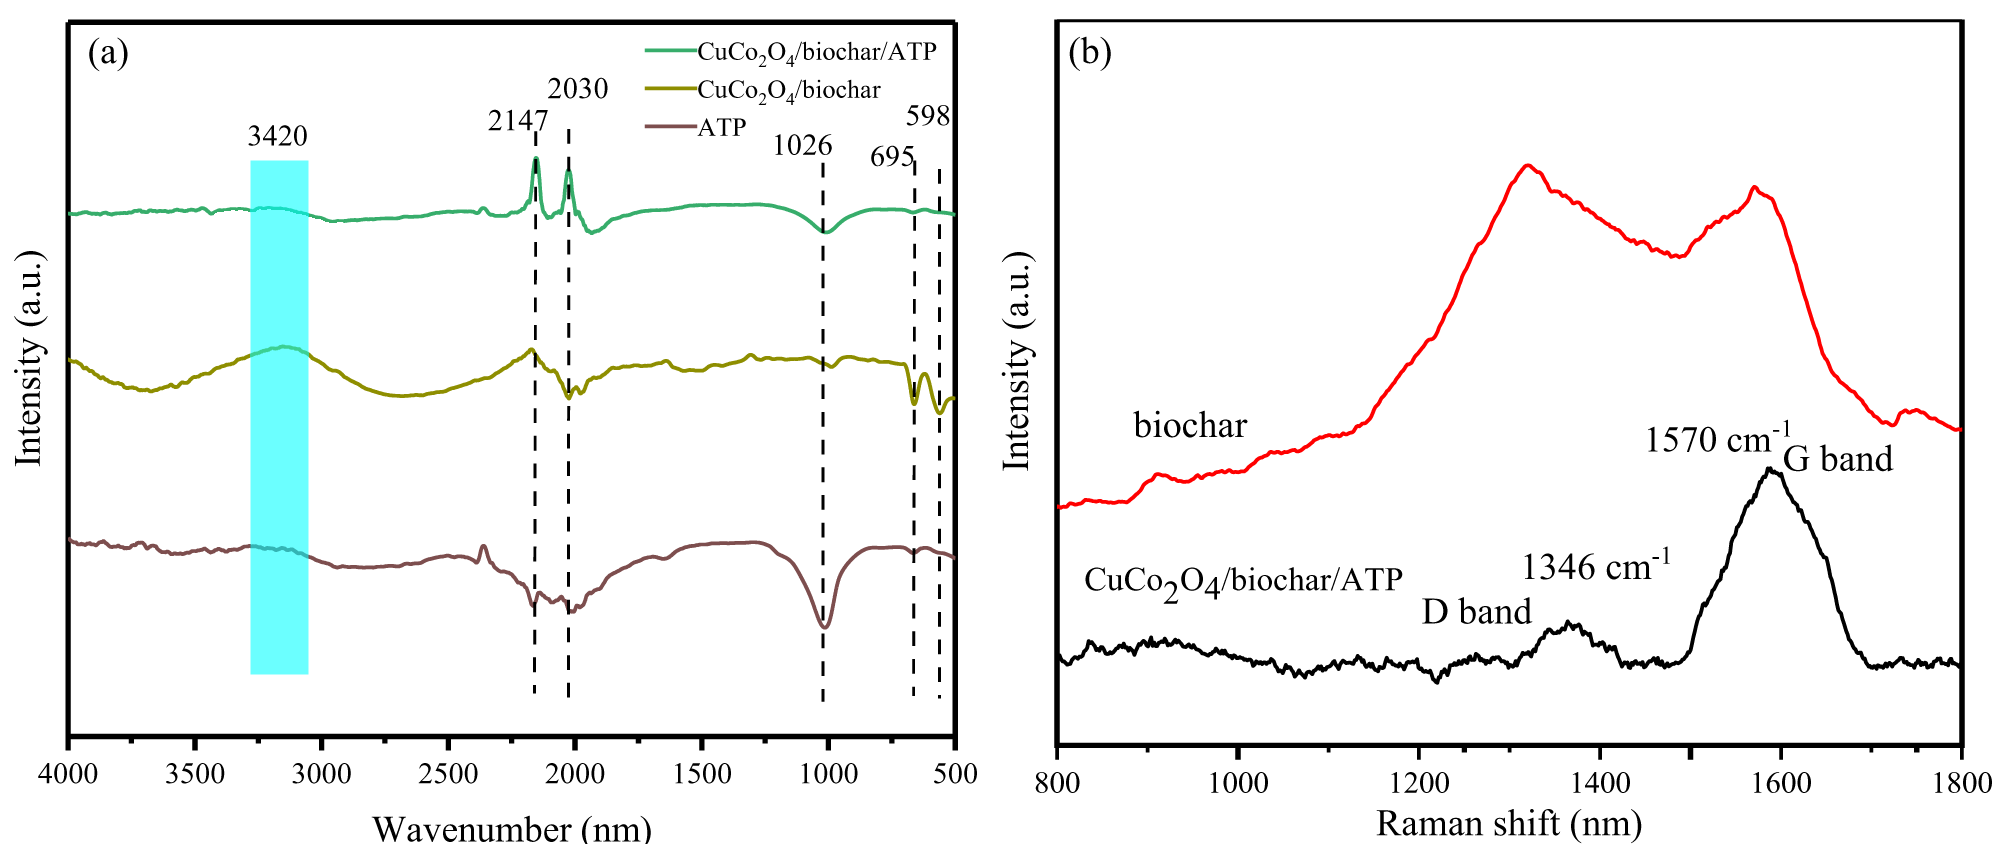
FTIR analysis was conducted on CuCo2O4/biochar/ATP, CuCo2O4/ATP and CuCo2O4/biochar, as shown in Fig. 4a. All catalysts exhibited a broad and similar absorption band at ∼3420 cm–1, which is attributed to the O–H stretching vibration of adsorbed water molecules. In the spectrum of CuCo2O4, characteristic peaks located at 598 and 695 cm–1 correspond to the lattice vibration modes of Co–O and Cu–O bonds, respectively (He et al., Reference He, Lv, Pillai, Wang, Xue and Ma2021), confirming the formation of the spinel structure. The pure biochar shows a complex absorption profile at ∼2150 cm–1, originating from superimposed signals of C=O, C=C conjugated structures, as well as phenolic hydroxyl (O–H) and carboxylic acid (C–OH) groups, indicating the presence of abundant oxygen-containing functional groups on the surface after pyrolysis. These surface groups not only increase the chemical adsorption capacity for VOC molecules but also provide ideal coordination sites for anchoring and dispersing active components. In the CuCo2O4/biochar/ATP composite, all of these characteristic peaks are effectively retained, suggesting successful integration of the active phases with the biochar matrix via chemical bonding. Raman spectroscopy was further employed to investigate the carbon structure (Fig. 4b). The presence of carbonaceous structures in both biochar and the CuCo2O4/biochar/ATP composite is evidenced by the characteristic Raman D and G bands at ∼1346 and 1570 cm–1 (Liu et al., Reference Liu, Zhang, Huhe, Yao and Li2025b). The D band is associated with structural defects and the degree of disorder in sp3-hybridized carbon, while the G band corresponds to the in-plane vibration of sp2-hybridized graphitic carbon. The intensity ratio I D/I G was found to be lower for the composite, indicating a higher density of structural defects and a relatively low degree of graphitization (Lin et al., Reference Lin, Xue and Du2024).
(a) Comparative FTIR spectroscopy analysis of CuCo2O4/biochar/ATP, CuCo2O4/ATP and CuCo2O4/ biochar. (b) Raman spectroscopy characterization of biochar and the CuCo2O4/biochar/ATP composite material.

Figure 4 Long description
The image A showing a line plot with three spectra and a legend listing CuCo2O4 slash biochar slash ATP, CuCo2O4 slash biochar and ATP. The y-axis label reads Intensity (a.u.). The x-axis label reads Wavenumber (nm), with tick labels at 4000, 3500, 3000, 2500, 2000, 1500, 1000 and 500. A vertical shaded band is marked at 3420. Vertical dashed guide lines are marked at 2147, 2030, 1026, 695 and 598. The CuCo2O4 slash biochar slash ATP spectrum shows local maxima near 2147 and 2030, a downward feature near 1026 and smaller features near 695 and 598. The CuCo2O4 slash biochar spectrum shows a broad rise around the shaded region at 3420 and smaller changes near 2147, 2030, 1026, 695 and 598. The ATP spectrum shows downward features near 2147 and 2030 and a pronounced downward feature near 1026, with smaller changes near 695 and 598. The image B showing a line plot with two spectra labeled biochar and CuCo2O4 slash biochar slash ATP. The y-axis label reads Intensity (a.u.). The x-axis label reads Raman shift (nm), with tick labels at 800, 1000, 1200, 1400, 1600 and 1800. Two annotations mark 1346 cm minus 1 labeled D band and 1570 cm minus 1 labeled G band. The biochar spectrum rises from 800 to a broad high region between about 1200 and 1700, then declines toward 1800. The CuCo2O4 slash biochar slash ATP spectrum shows a smaller feature near 1346 and a larger peak near 1570, followed by a decrease toward 1800.
XPS analysis
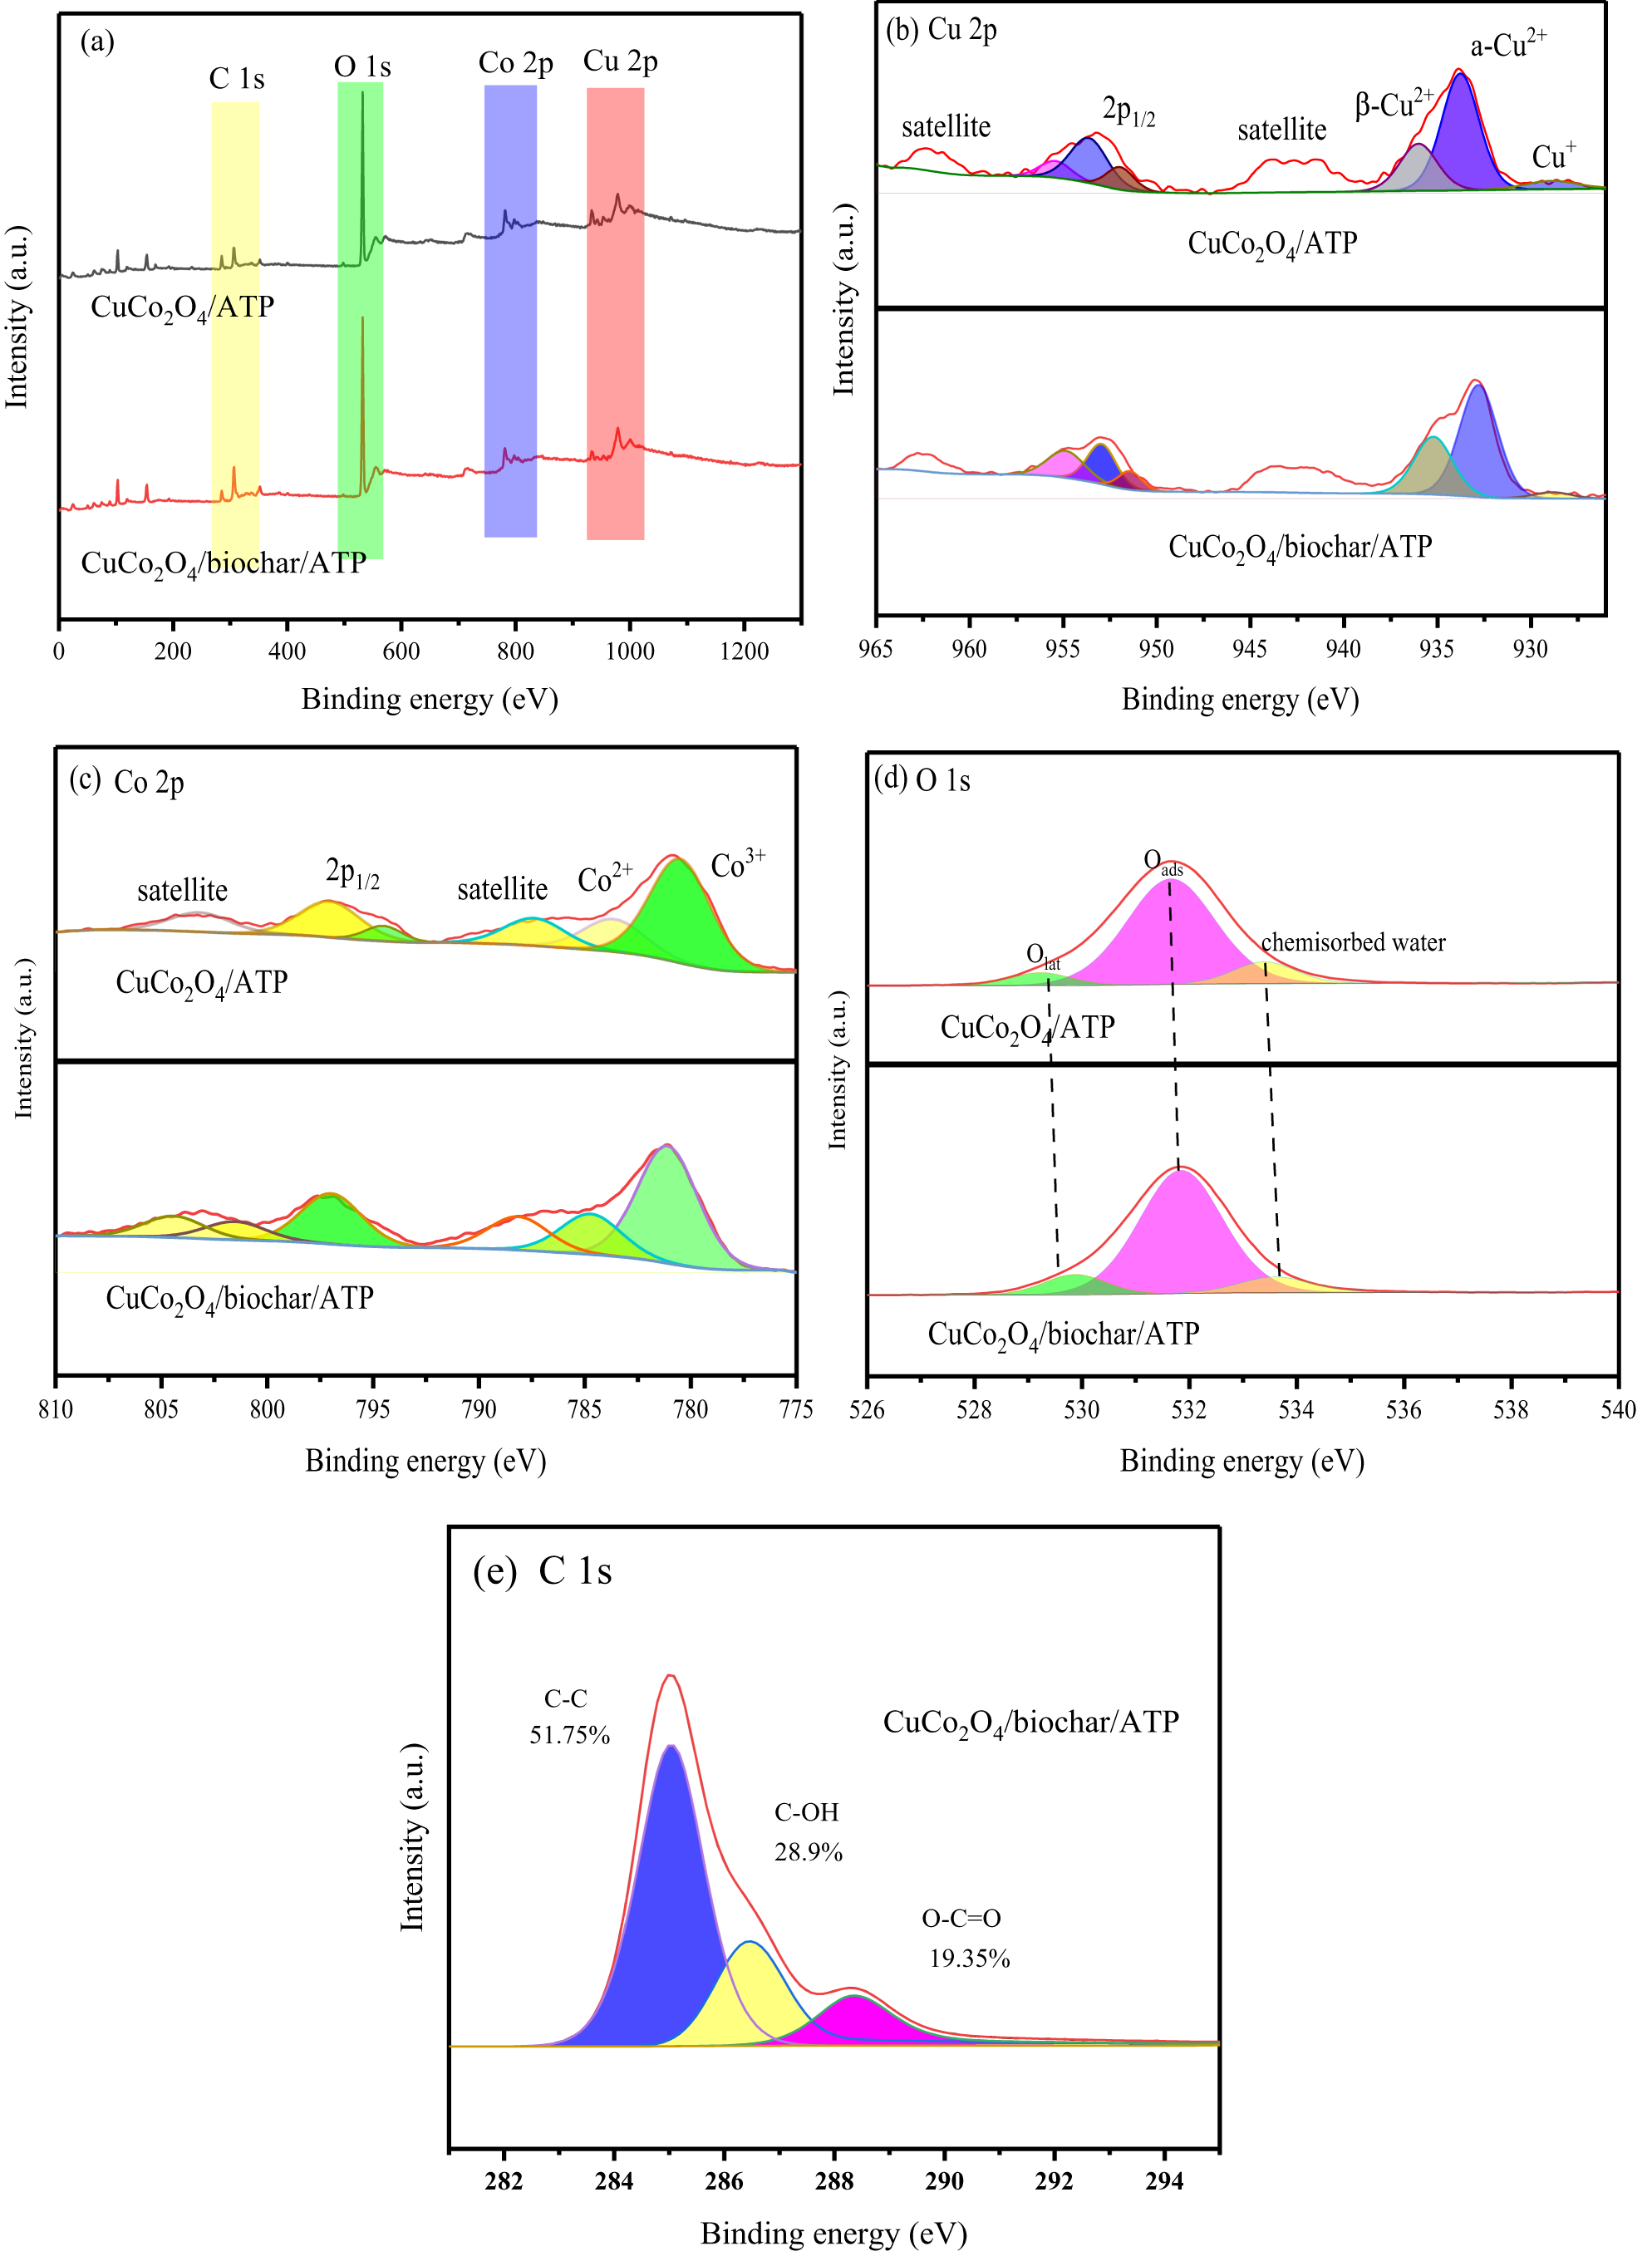
XPS was further employed to evaluate the surface elemental states and chemical composition of the catalysts. The full-scan spectra of CuCo2O4/biochar/ATP and CuCo2O4/ATP are shown in Fig. 5a, confirming the presence of Cu, Co, O and C. As shown in the Cu 2p spectrum (Fig. 5b), the characteristic peaks located at binding energies of 932 eV (Cu 2p3/2) and 951 eV (Cu 2p1/2) are attributed to Cu+ species, while those at 934 eV (Cu 2p3/2) and 952 eV (Cu 2p1/2) correspond to Cu2+ species (Li et al., Reference Li, Qiu, Tang, Duan, Gu and Yang2023). After compositing with biochar, the molar ratio of Cu+ increased significantly, probably due to the partial reduction of Cu2+ to Cu+ induced by the reductive surface functional groups of biochar. The presence of Cu+ improves the adsorption, activation and migration of oxygen species. In the Co 2p spectrum (Fig. 5c), the peaks observed at 781.2 and 779.5 eV are assigned to Co3+ and Co2+ in the 2p3/2 orbital, respectively, while those at 795.0 and 796.5 eV correspond to Co3+ and Co2+ in the 2p1/2 orbital, respectively. Compared with CuCo2O4/ATP, the CuCo2O4/biochar/ATP composite exhibits increased ratios of Cu+:Cu total and Co2+:Co total after the introduction of biomass. These results suggest that compositing with biochar promoted the formation of more low-valence metal sites within the spinel structure, which facilitated the activation and migration of lattice oxygen, thereby increasing the catalytic reactivity (Zhang et al., Reference Zhang, Cao, Zhang, Wang and Tian2024). The high-resolution O 1s spectrum (Fig. 5d) is deconvoluted into three contributions, where lattice oxygen (Olat) locates at ∼529.5 eV, surface-adsorbed oxygen species (Oads) locates at ∼531 eV and surface hydroxyl groups locates at ∼533.5 eV. After the incorporation of biomass, the increased proportion of Oads indicates the formation of more surface oxygen vacancies on CuCo2O4, suggesting that CuCo2O4/biochar/ATP possesses a greater concentration of surface defects beneficial for catalytic activity. As observed in the C 1s spectrum (Fig. 5e), the CuCo2O4/biochar/ATP composite exhibits abundant carbon functional groups. The presence of a high proportion of C–OH and O–C=O bonds further corroborates the successful incorporation of biochar, which is conducive to increasing the adsorption of toluene molecules (Lv et al., Reference Lv, She, Zhong, Chen, Ye and Zeng2025).
XPS spectra of CuCo2O4/biochar/ATP and CuCo2O4/ATP: (a) full survey scan, (b) Cu 2p, (c) Co 2p, (d) O 1s and (e) C 1s.

Figure 5 Long description
The XPS spectra compare CuCo2O4/ATP and CuCo2O4/biochar/ATP across five panels. Panel (a) shows a full survey scan with peaks for C 1s, O 1s, Co 2p and Cu 2p. Panel (b) displays Cu 2p spectra, highlighting peaks at 932 electron volt and 951 electron volt for Cu plus and 934 electron volt and 952 electron volt for Cu2 plus, with biochar increasing Cu plus ratio. Panel (c) shows Co 2p spectra with peaks at 781.2 electron volt for Co3 plus and 779.5 electron volt for Co2 plus, indicating increased Co2 plus in biochar composite. Panel (d) presents O 1s spectra, with lattice oxygen at approximately 529.5 electron volt and surface-adsorbed oxygen at approximately 531 electron volt, showing more surface oxygen vacancies in biochar composite. Panel (e) illustrates C 1s spectra with C dash C at 51.75 percent, C dash OH at 28.9 percent and O dash C equals O at 19.35 percent, confirming biochar incorporation. Intensity represents the relative abundance of elements and fitted components indicate chemical states.
EPR and H2-TPR analysis
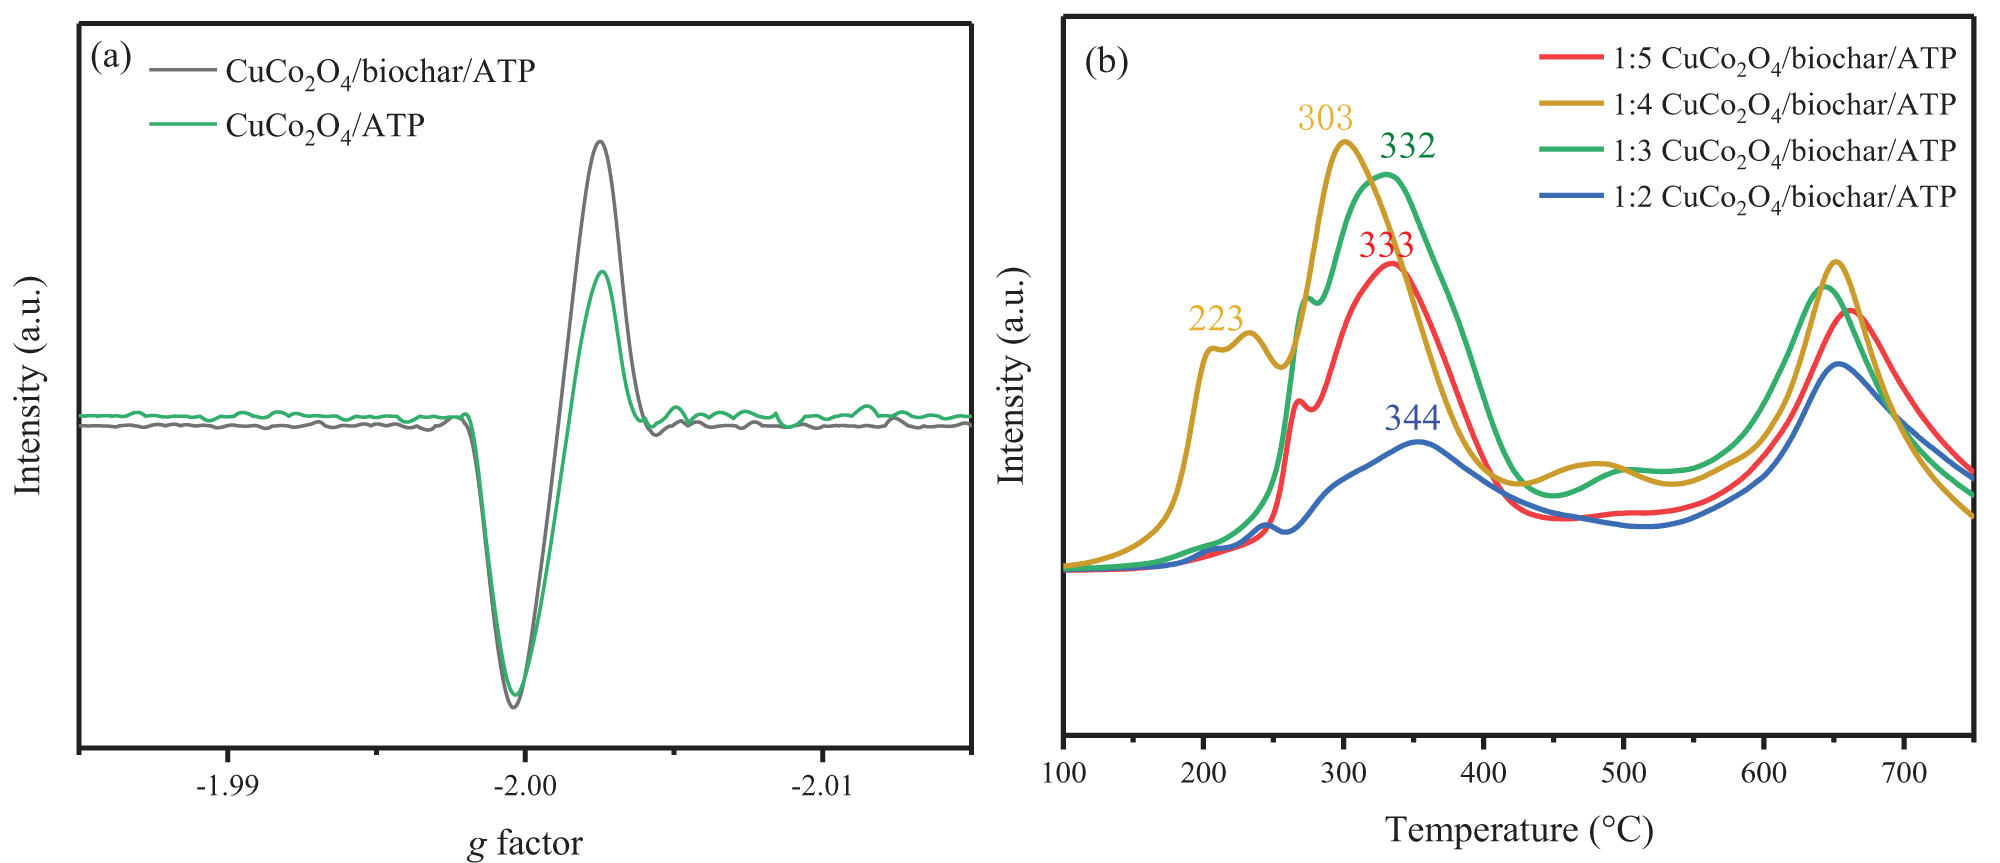
To investigate the effect of the introduction of waste walnut shell biomass on the oxygen vacancy concentration, EPR spectroscopy was performed. As shown in Fig. 6a, CuCo2O4/biochar/ATP, CuCo2O4/biochar and CuCo2O4/ATP exhibited a similar EPR signal at g = 2.003, which characterizes electrons trapped in oxygen vacancies. It is well established that the intensity of this EPR signal positively correlates with the concentration of oxygen vacancies. Notably, CuCo2O4/biochar/ATP exhibited the highest EPR signal, indicating that it possessed the highest number of oxygen vacancies among the three catalysts. Combined with aforementioned XPS results (Fig. 5b,c) revealing that the introduction of biochar increased the ratios of Cu+:Cu2+ and Co2+:Co3+, this is indicative of a strong interplay between oxygen vacancy formation and the redox cycles of the metal cations. This suggests that the incorporation of ATP and biochar promoted the formation of oxygen vacancy defects. These defects could serve as unsaturated sites for oxygen adsorption, facilitating the generation of more active oxygen species and increasing the adsorption and conversion of VOCs.
(a) EPR spectra of CuCo2O4/ATP, CuCo2O4/biochar and CuCo2O4/biochar/ATP. (b) H2-TPR profiles of 1:2–1:5 CuCo2O4/biochar/ATP and CuCo2O4/ATP.

Figure 6 Long description
The image A showing a line graph with the vertical axis label Intensity (a.u.) and the horizontal axis label g factor. The horizontal axis shows tick labels -1.99, -2.00 and -2.01. A legend lists CuCo2O4/biochar/ATP and CuCo2O4/ATP. Two lines run close to a flat baseline, then drop to a trough near the -2.00 tick, then rise to a sharp peak just to the right of -2.00 and then return toward the baseline. The image B showing a line graph with the vertical axis label Intensity (a.u.) and the horizontal axis label Temperature (degree celsius). The horizontal axis shows tick labels 100, 200, 300, 400, 500, 600 and 700. A legend lists 1:5 CuCo2O4/biochar/ATP, 1:4 CuCo2O4/biochar/ATP, 1:3 CuCo2O4/biochar/ATP and 1:2 CuCo2O4/biochar/ATP. Four curves rise from near the left side, form a first peak region between about 200 and 400 with numeric labels 223, 303, 332, 333 and 344 placed near the curves, then dip and form a smaller hump around about 450 to 550, then rise again to a second peak region around about 600 to 700 before decreasing toward the right edge.
The reducibility of the CuCo2O4/biochar/ATP catalysts synthesized with four different biomass ratios was evaluated using H2-TPR. As shown in Fig. 6b, all of the catalysts exhibited two characteristic hydrogen consumption peaks. The low-temperature reduction peak corresponds to the reduction of Co3+ to Co2+, while the high-temperature peak can be attributed to the reduction of Cu species (Lin et al., Reference Lin, Xue and Du2024). Remarkably, the 1:4 CuCo2O4/biochar/ATP catalyst displayed distinct reduction behaviour, and the reduction peak for Co species shifted to lower temperature by ∼30°C compared to those of the other three catalysts, indicating increased synergistic interaction between Cu and Co species promoted by the introduction of biomass. Quantitative analysis revealed that the total H2 consumption of the 1:4 catalyst was significantly higher than that of the other samples. The reducibility of the catalysts is in the following order in terms of biomass ratio: 1:2 < 1:5 < 1:3 < 1:4. This superior reducibility can be attributed to the optimal biomass ratio (1:4) facilitating a more efficient distribution of active sites and effectively balancing the dispersion and interaction of bimetallic components, thereby endowing this catalyst with the greatest reducibility.
Catalytic oxidation of toluene performance
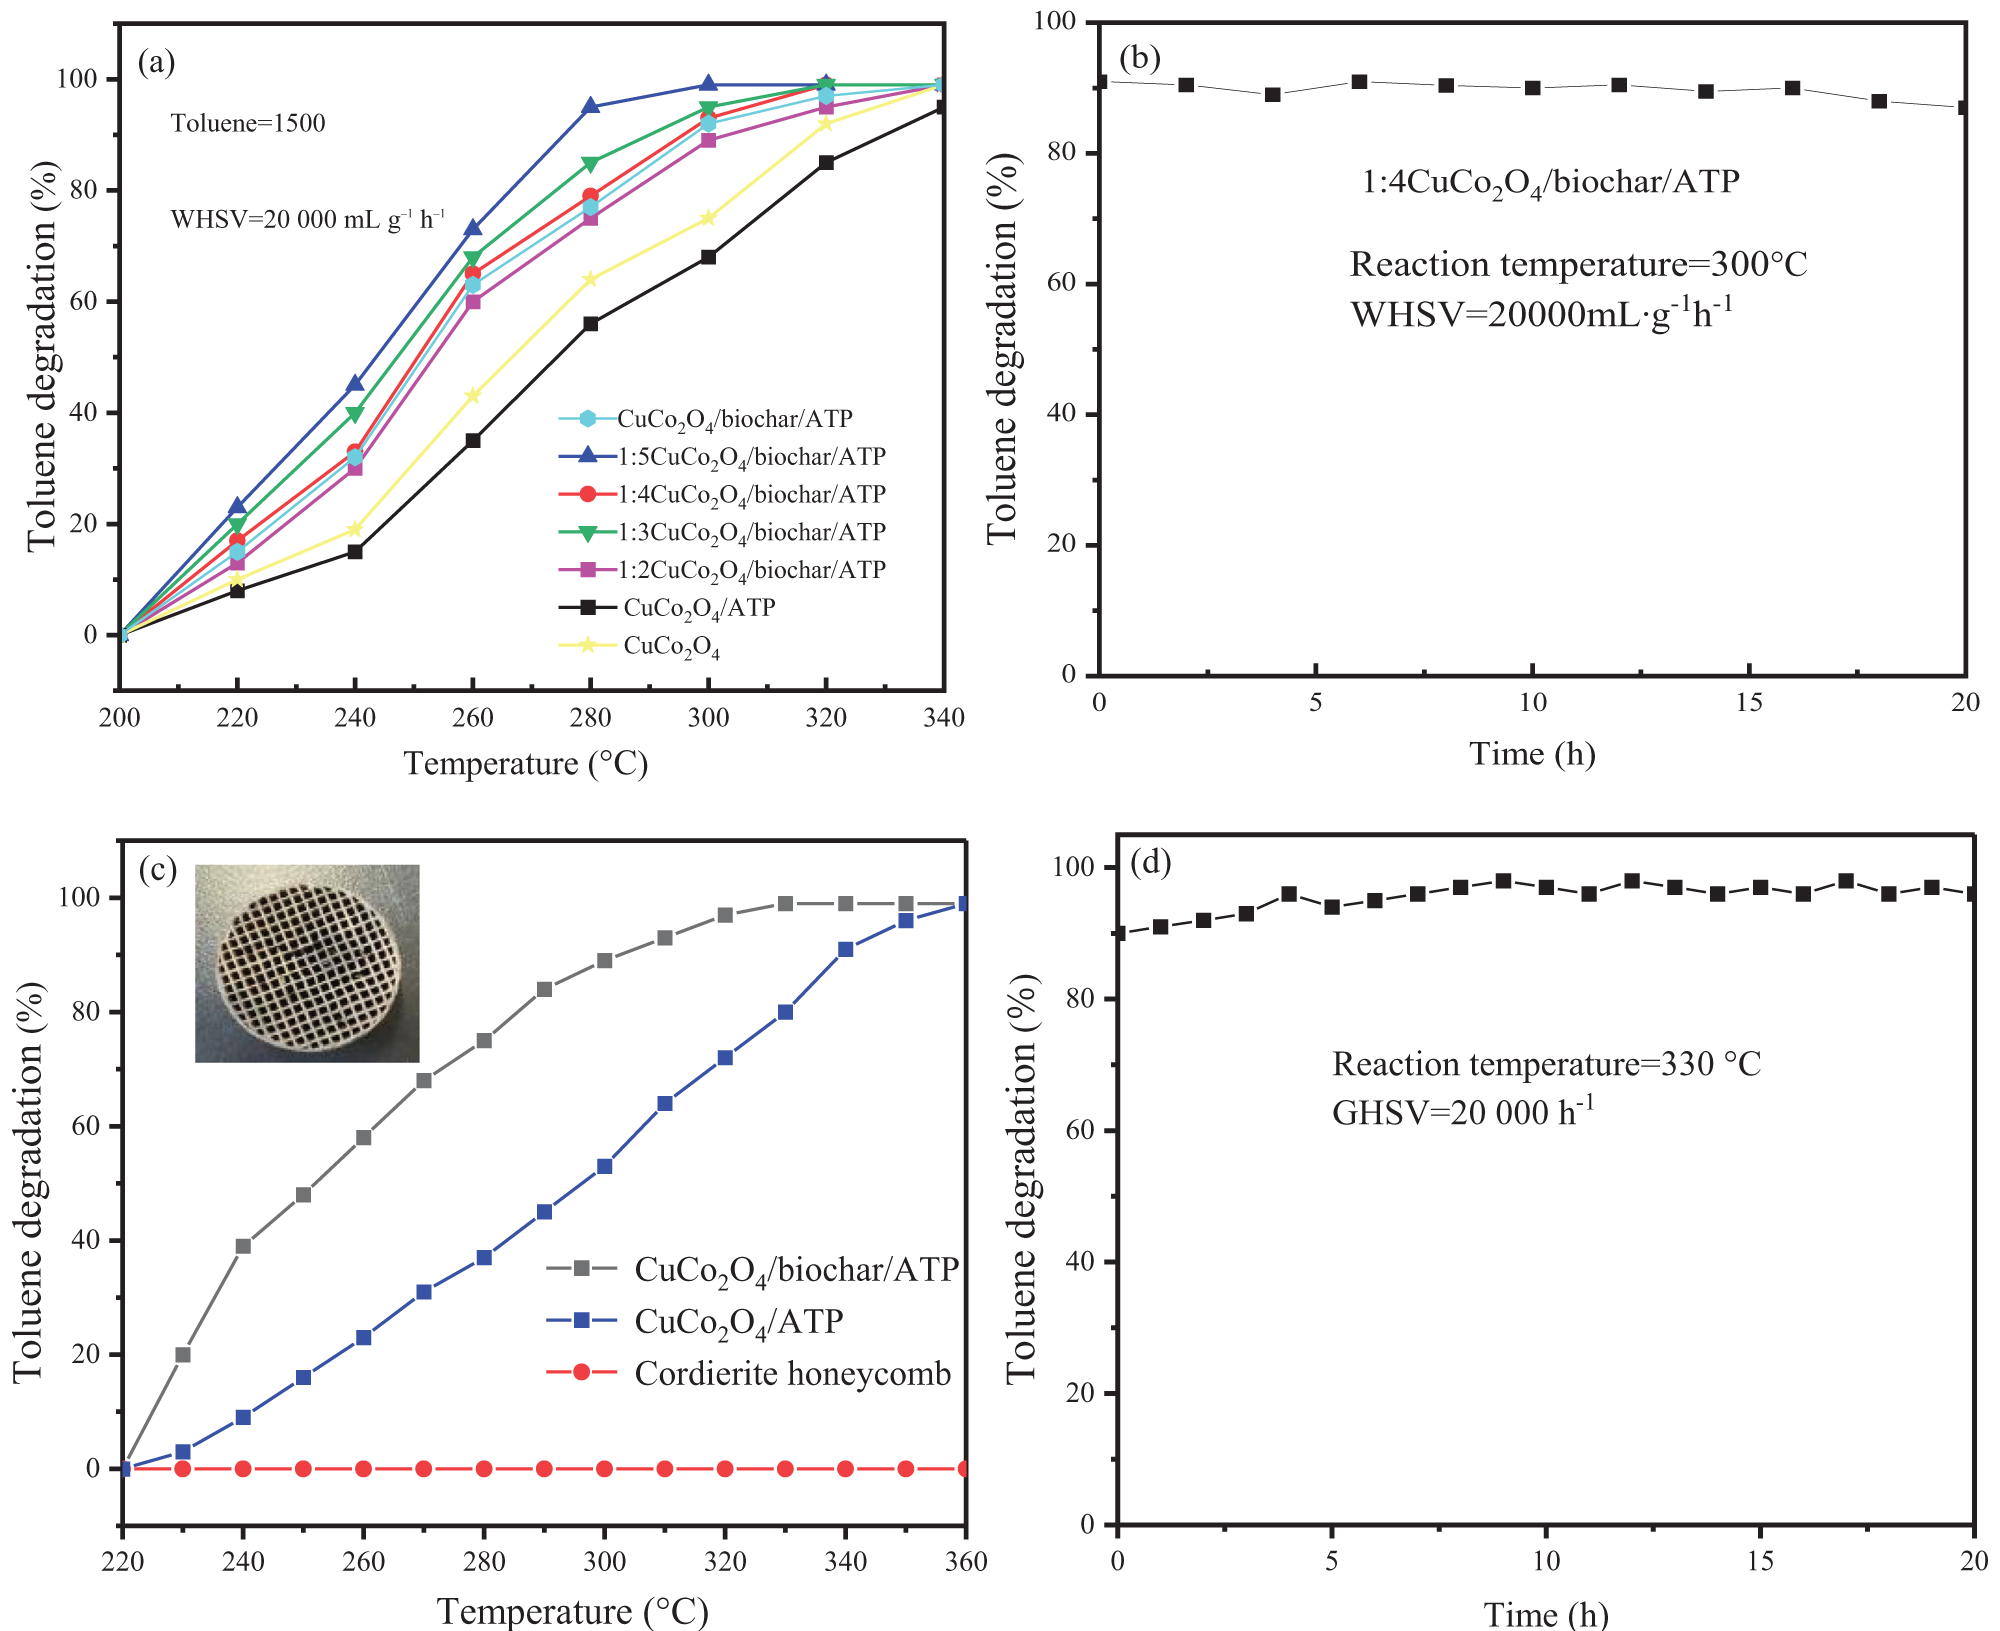
The catalytic oxidation of toluene over CuCo2O4, CuCo2O4/ATP and 1:2–1:5 CuCo2O4/biochar/ATP catalysts was investigated using 1500 ppm toluene as the target pollutant under a weight hourly space velocity (WHSV) of 20 000 mL g–1 h–1. In Fig. 7a, the 1:4 CuCo2O4/biochar/ATP catalyst exhibits the highest catalytic activity, achieving 99% toluene conversion temperature (T 99) at 300°C, which is superior to what has been previously reported (Cha et al., Reference Cha, Kim, Choi, Rhee, Song and Jeon2022; Liu et al., Reference Liu, Zhang, Cai, Zhang, Ouyang and Wang2025a). Further analysis revealed that this catalyst possessed the highest concentration of surface defects and oxygen vacancies in the CuCo2O4 phase, contributing to the increased oxidation of toluene at relatively low temperatures. Compared to CuCo2O4/ATP, the T 99 of the walnut shell-derived CuCo2O4/biochar/ATP catalyst was ∼20°C lower. This improvement can be attributed to the reductive atmosphere generated during the pyrolysis of lignin-rich walnut shells, which promotes the formation of defects and oxygen vacancies on the spinel surface, thereby improving catalytic performance. To assess the long-term stability of the catalyst, a 20 h continuous test was conducted under the same reaction conditions at 300°C. As depicted in Fig. 7b, the 1:4 CuCo2O4/biochar/ATP catalyst maintained a high toluene conversion efficiency throughout the 20 h period, demonstrating excellent stability, and the morphology showed no obvious change, which can be verified in Fig. S2. The industrial potential of the catalyst was further verified by coating cordierite honeycomb substrates with 1:4 CuCo2O4/biochar/ATP and CuCo2O4/ATP and testing their catalytic performance under a gas hourly space velocity (GHSV) of 20 000 h–1. As displayed in Fig. 7c, the bare cordierite honeycomb sample showed negligible catalytic activity within the temperature range of 180–340°C. In contrast, the 1:4 CuCo2O4/biochar/ATP catalyst achieved nearly complete toluene conversion at 330°C, while the CuCo2O4/ATP-coated cordierite required ∼350°C for a similar level of conversion, highlighting the promotional role of biochar. Furthermore, as illustrated in Fig. 7d, the 1:4 CuCo2O4/biochar/ATP catalyst retained high catalytic activity during a 20 h stability test conducted at 330°C.
(a) Toluene oxidation performance of various CuCo2O4/biochar/ATP and CuCo2O4/ATP catalysts. (b) Cyclic stability test of 1:4 CuCo2O4/biochar/ATP in toluene catalytic oxidation at 300°C. (c) Catalytic performance of the monolithic catalyst for toluene oxidation and (d) corresponding stability test.

Figure 7 Long description
The image A showing a line graph with the text “Toluene=1500” and “WHSV=20 000 mL g minus 1 h minus 1”. The horizontal axis label is “Temperature (°C)” with values 200, 220, 240, 260, 280, 300, 320, 340. The vertical axis label is “Toluene degradation (%)” with values 0, 20, 40, 60, 80, 100. Legend entries: “CuCo2O4/biochar/ATP”, “1:5CuCo2O4/biochar/ATP”, “1:4CuCo2O4/biochar/ATP”, “1:3CuCo2O4/biochar/ATP”, “1:2CuCo2O4/biochar/ATP”, “CuCo2O4/ATP”, “CuCo2O4”. Multiple lines with different marker shapes are plotted for the legend entries. All plotted lines rise as temperature increases from 200 to 340. Several lines reach values near 100 at temperatures around 300 to 340, while one line remains lower than the others across the temperature range and reaches near 100 only at the highest temperatures. The image B showing a line graph with the text “1:4CuCo2O4/biochar/ATP”, “Reaction temperature=300°C” and “WHSV=20000mL·g minus 1 h minus 1”. The horizontal axis label is “Time (h)” with values 0, 5, 10, 15, 20. The vertical axis label is “Toluene degradation (%)” with values 0, 20, 40, 60, 80, 100. A single line with square markers stays near the upper part of the scale across time 0 to 20, with small up and down changes. The image C showing a line graph with an inset photo of a circular honeycomb structure. The horizontal axis label is “Temperature (°C)” with values 220, 240, 260, 280, 300, 320, 340, 360. The vertical axis label is “Toluene degradation (%)” with values 0, 20, 40, 60, 80, 100. Legend entries: “CuCo2O4/biochar/ATP”, “CuCo2O4/ATP”, “Cordierite honeycomb”. Three lines with different marker shapes are plotted. “CuCo2O4/biochar/ATP” increases from near 0 at 220 to near 100 by about 340 to 360. “CuCo2O4/ATP” increases more gradually and reaches near 100 closer to 360. “Cordierite honeycomb” stays near 0 across 220 to 360. The image D showing a line graph with the text “Reaction temperature=330 °C” and “GHSV=20 000 h minus 1”. The horizontal axis label is “Time (h)” with values 0, 5, 10, 15, 20. The vertical axis label is “Toluene degradation (%)” with values 0, 20, 40, 60, 80, 100. A single line with square markers stays near the upper part of the scale across time 0 to 20, with small up and down changes.
In situ DRIFTS analysis
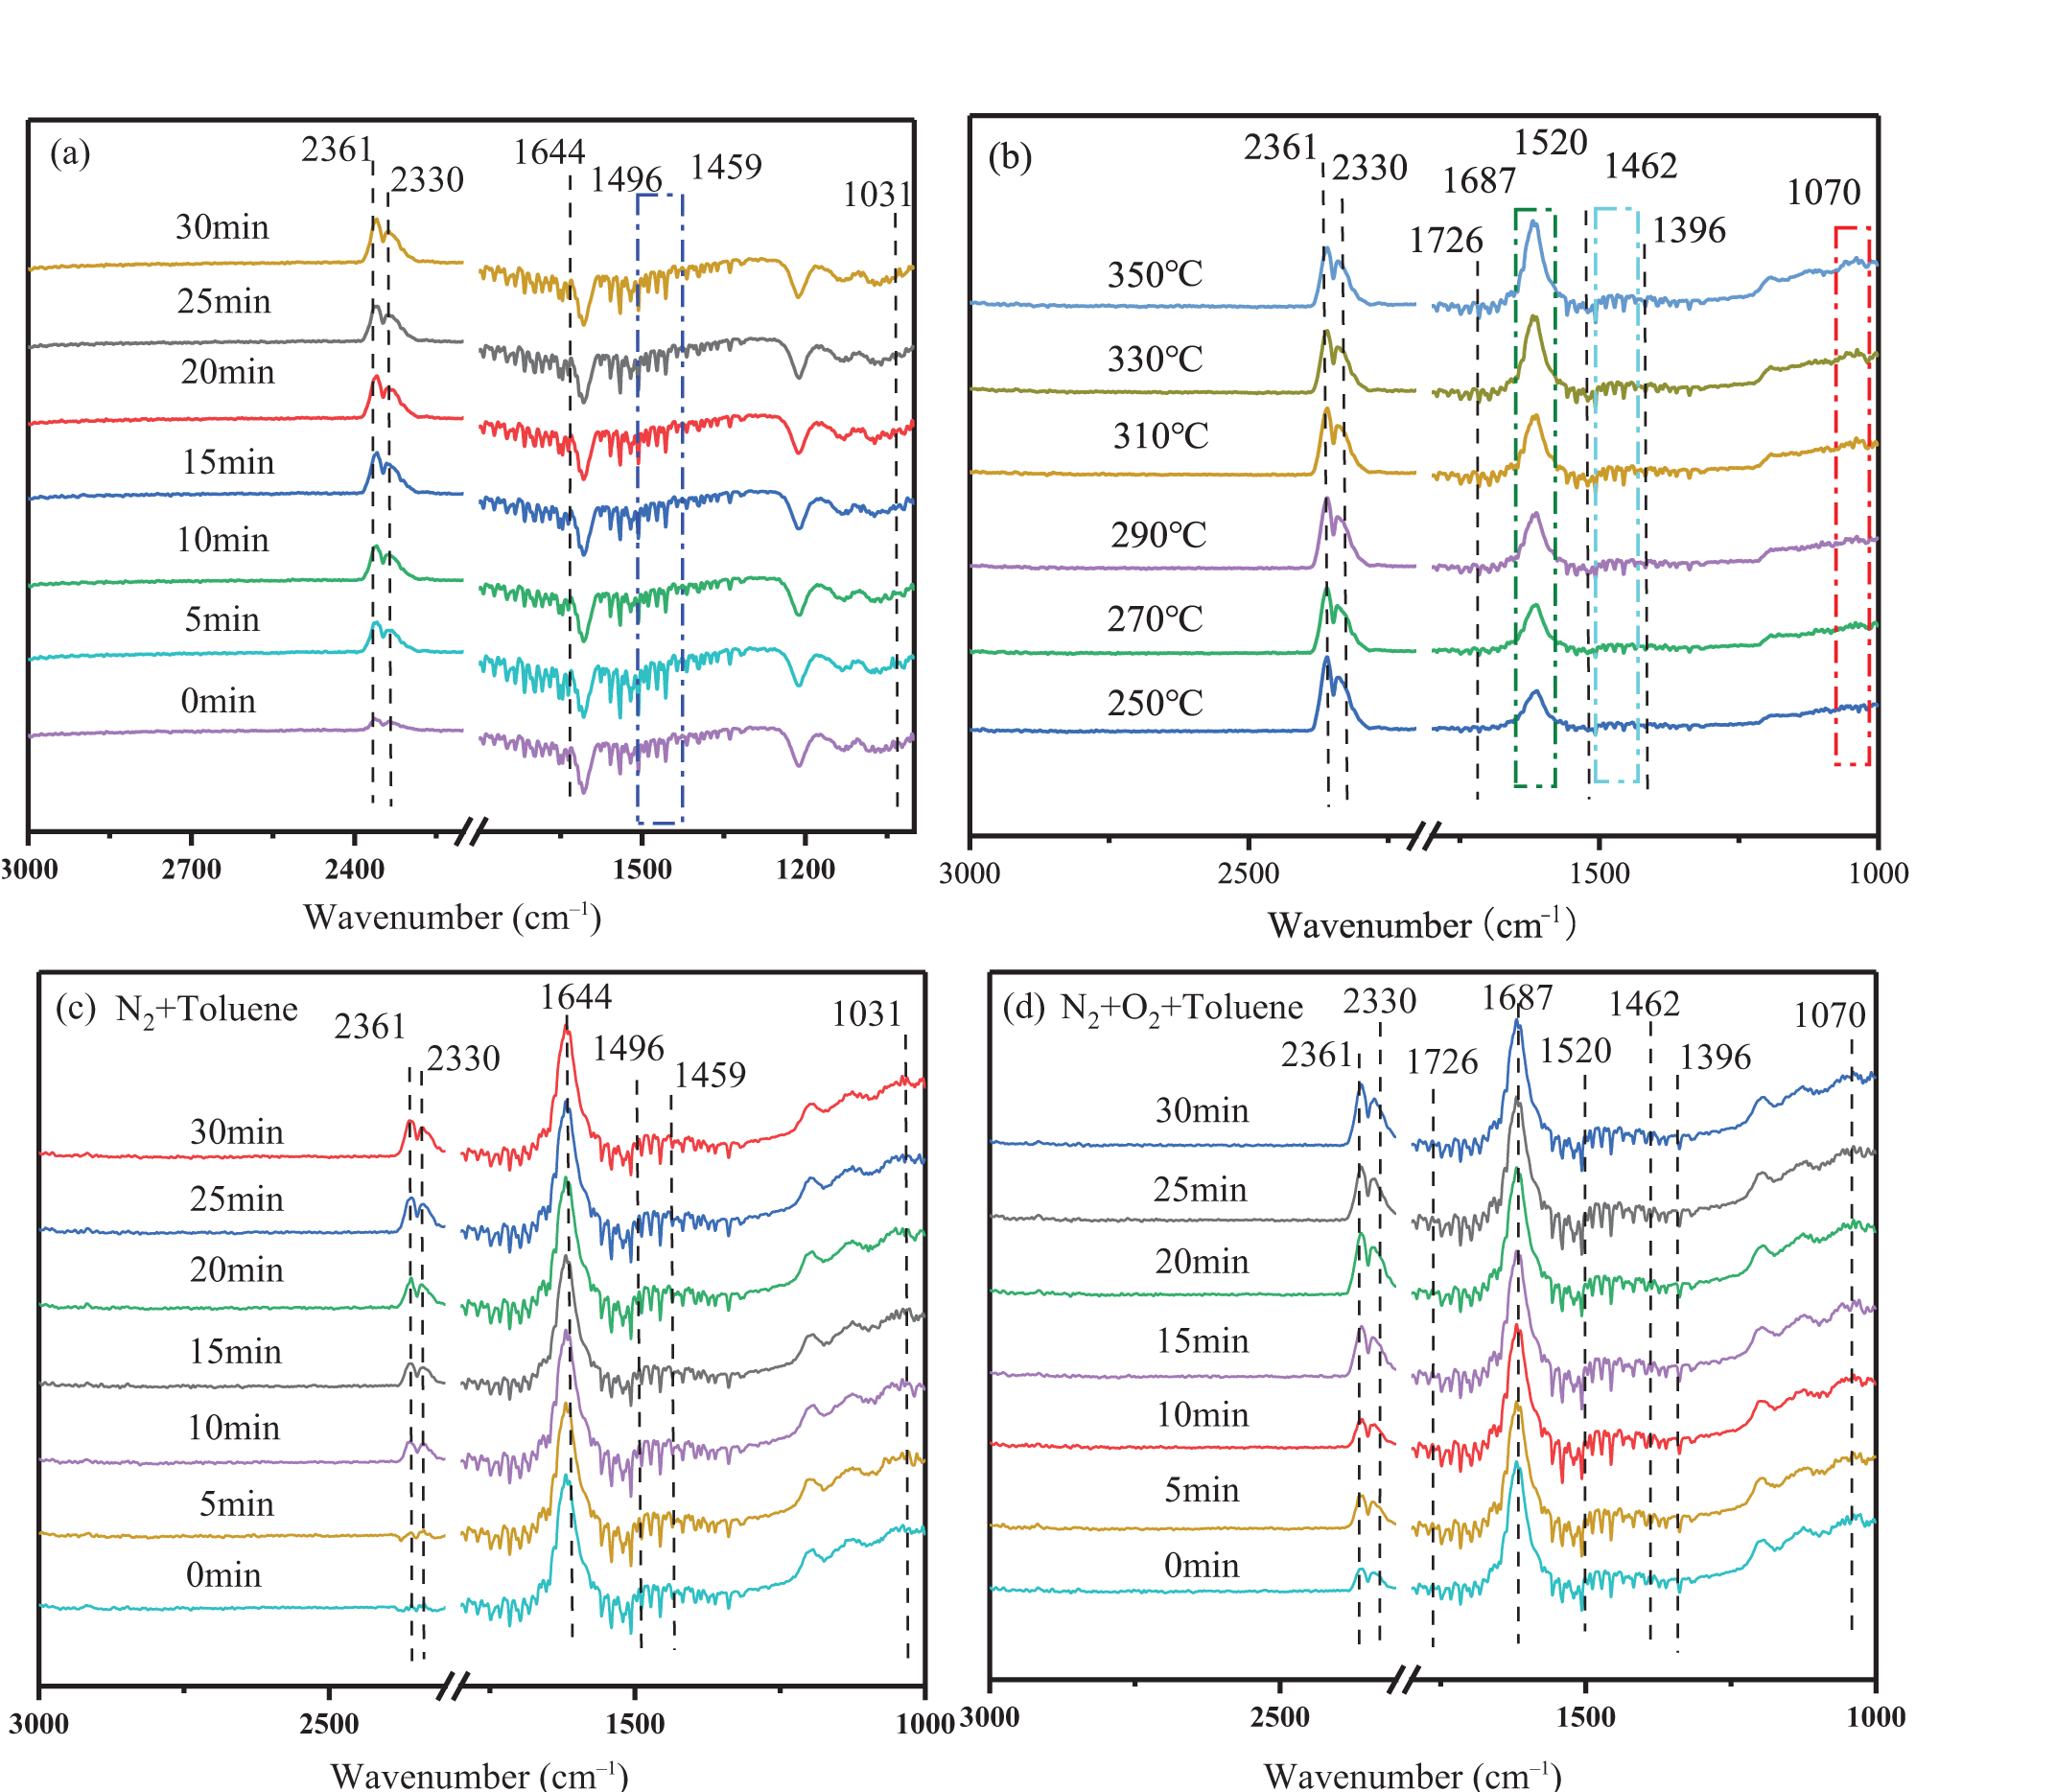
The reaction pathway of toluene degradation over the CuCo2O4/biochar/ATP catalyst was systematically investigated using in situ DRIFTS. At the adsorption equilibrium stage (50°C) in Fig. 8a, characteristic peaks can be observed at 1459 and 1496 cm–1, corresponding to skeletal vibrations of the benzene ring (C=C), along with a peak at 1031 cm–1 attributed to the C–H bending vibration of the methyl group (Cheng et al., Reference Cheng, Yang, Li, Wang, Wang and Zhang2023). These features confirm the effective adsorption of toluene molecules on the catalyst surface (Hernández-Alonso et al., Reference Hernández-Alonso, Tejedor-Tejedor, Coronado and Anderson2011). When the temperature was increased from 250°C to 350°C under a toluene/air mixture (Fig. 8b), significant changes occur in the infrared spectra peaks appeared at 1070 and 1462 cm–1, assigned to benzyl alcohol. The band at 1687 cm–1 corresponds to the C=O stretching vibration of benzaldehyde, and the bands at 1396 and 1520 cm–1 can be attributed to benzoic acid (Zhang et al., Reference Zhang, Shi, Han, Song, Xiao and Li2025). The sequential emergence of these intermediate species indicates continuous oxidation of the methyl group on the catalyst surface. Additionally, C–H stretching vibrations of benzoate were detected at 1533 and 1543 cm–1, while a new peak appeared at 1726 cm–1, characteristic of oxalic acid, confirming the deep oxidation of toluene. As illustrated in Fig. 8c,d, after reaching adsorption equilibrium, the temperature of the in situ cell increased to 300°C. The system was first exposed to toluene and N2 for 30 min, followed by the introduction of air for another 30 min. The intensities of the intermediate species peaks became more pronounced after switching to an oxygen-containing atmosphere, indicating active oxidation of intermediates on the catalyst surface.
In situ DRIFTS spectra of CuCo2O4/biochar/ATP (a) during toluene adsorption within 30 min, (b) during catalytic oxidation at various temperatures, (c) under toluene and N2 atmosphere at 300°C and (d) under toluene, N2 and O2 atmosphere at 300°C.

Figure 8 Long description
The DRIFTS spectra display the behavior of toluene adsorption and oxidation over CuCoO/biochar/ATP. The x-axis is labeled Wavenumber (centimeter superscript minus 1), ranging from 3000 to 1000, with a break between 2400 and 1500. The y-axis is not labeled. In image A, spectra are shown for toluene adsorption over time, with traces annotated at 0, 5, 10, 15, 20, 25 and 30 minutes. Peaks are observed at 2361, 2330, 1644, 1496, 1459 and 1031, indicating adsorption characteristics. Image B presents spectra during catalytic oxidation at temperatures 250, 270, 290, 310, 330 and 350 degrees Celsius. Peaks at 2361, 2330, 1726, 1687, 1520, 1462, 1396 and 1070 show changes in oxidation products. Image C shows spectra under toluene and nitrogen at 300 degrees Celsius, with time annotations similar to image A. Peaks at 2361, 2330, 1644, 1496, 1459 and 1031 are noted. Image D displays spectra under toluene, nitrogen and oxygen at 300 degrees Celsius, with time annotations. Peaks at 2361, 2330, 1726, 1687, 1520, 1462, 1396 and 1070 indicate oxidation processes. Each panel includes condition labels and the spectra reveal peak intensity changes and shifts across different conditions, highlighting adsorption and oxidation dynamics.
Mechanism for the catalytic oxidation of toluene
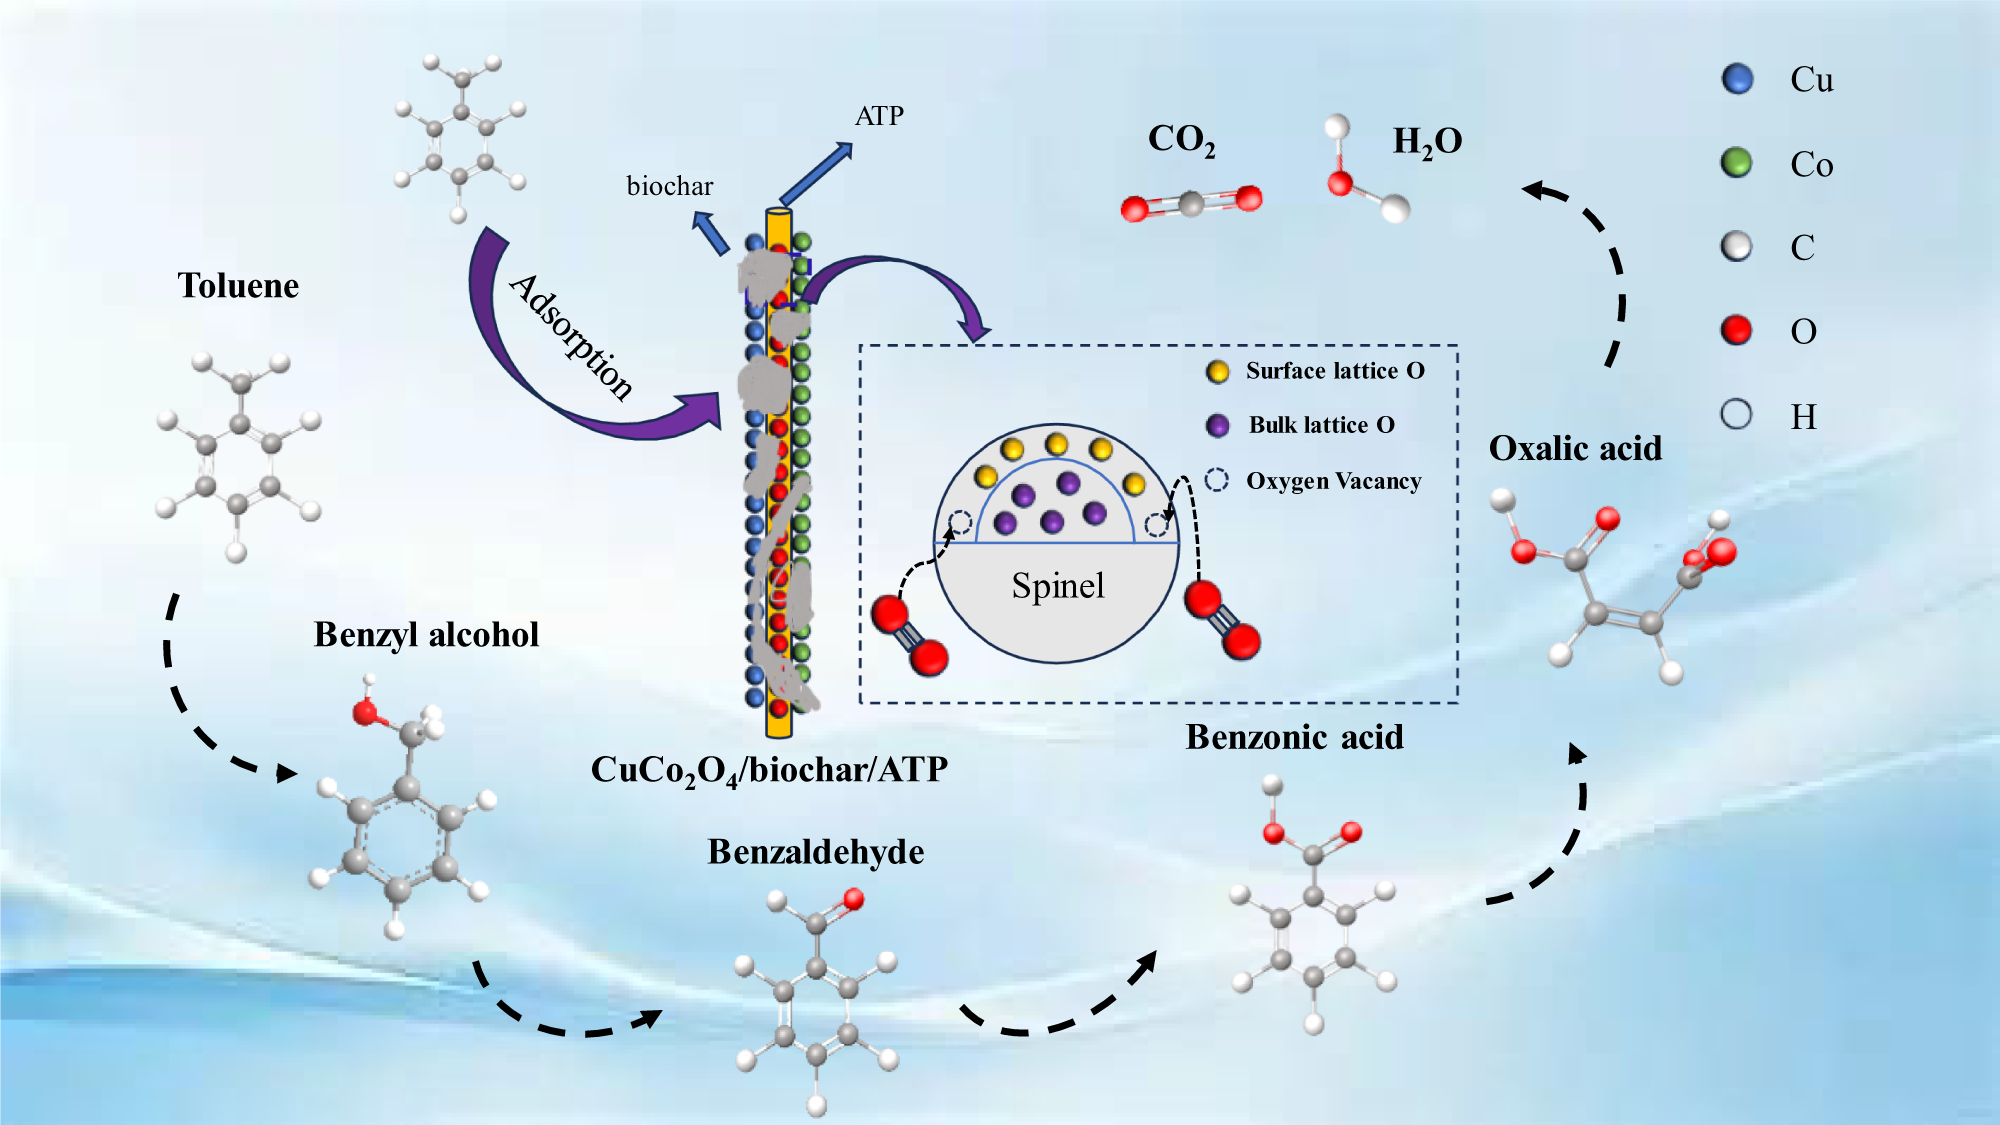
In Fig. 9, the reaction pathway of toluene over CuCo2O4/biochar/ATP, inferred from in situ DRIFTS analysis, aligns with the Mars–van Krevelen mechanism. Initially, toluene molecules adsorb onto the active sites of the catalyst surface at low temperatures (Yang et al., Reference Yang, Si, Peng, Wang, Liu, Su and Li2022). With increasing temperature, toluene is continuingly oxidized to benzyl alcohol, benzaldehyde, benzoic acid and oxalic acid, which are ultimately completely oxidized into CO2 and H2O by surface lattice oxygen and desorb from the catalyst. Concurrently, a dynamic redox cycle involving cobalt valence states occurs on CuCo2O4. In the initial state, Co exists primarily as Co3+ along with a fraction of Co2+, where Co3+ acts synergistically with Cu2+ to activate lattice oxygen (O2⁻), forming highly reactive oxygen species (Gao et al., Reference Gao, Lv, Zhang, Li, Chen, Hu and Jia2022). During toluene oxidation, lattice oxygen is consumed for product formation, reducing Co3+ to Co2+ and generating oxygen vacancies. Subsequently, gaseous O2 is adsorbed on those oxygen vacancies and dissociates into active oxygen species, while Co2+ is re-oxidized to Co3+, thereby restoring the active structure of the catalyst (Wan et al., Reference Wan, Liao, Huang, Li, Zhan, Xiao and Jiang2025). These results indicate that the incorporation of waste biomass enhances the catalytic oxidation activity of the composite. This improvement can be attributed to the reductive atmosphere generated during biochar pyrolysis, which promotes the formation of abundant oxygen vacancies on the CuCo2O4 surface. Furthermore, optimizing the proportion of waste biomass introduces additional lattice distortion and increases the number of oxygen vacancies, resulting in more surface lattice oxygen species participating in the toluene oxidation process and thereby enhancing reactivity. Additionally, the introduction of biochar improves the adsorption and activation capacity of the catalyst.
Schematic mechanism for the catalytic oxidation of toluene over CuCo2O4/biochar/ATP.

Figure 9 Long description
The diagram illustrates the catalytic oxidation pathway of toluene over CuCo2O4/biochar/ATP. Toluene is shown adsorbing onto the catalyst surface, indicated by a purple arrow labeled ′Adsorption′. The catalyst is depicted as a vertical structure with biochar and ATP. Toluene is converted to benzyl alcohol, then to benzaldehyde, followed by benzoic acid and oxalic acid, as shown by dashed arrows. The final products are carbon dioxide and water. A detailed inset shows a spinel structure with surface lattice oxygen, bulk lattice oxygen and oxygen vacancies. The color key identifies elements: copper (blue), cobalt (green), carbon (gray), oxygen (red) and hydrogen (white).
Conclusion
In this study, a CuCo2O4/biochar/ATP composite catalyst was successfully synthesized via a sol–gel method using waste walnut shell biomass as both complexing agent and combustibility promoter. Under the mass ratio of CuCo2O4/ATP to biomass precursor of 1:4, the composite exhibited excellent catalytic degradation of toluene performance, achieving 99% conversion at 300°C, along with remarkable stability after 20 h of use. Due to their abundant surface hydroxyl groups and acid sites, the ATP nanorods provided a robust scaffold that anchored CuCo2O4 crystallites and ensured their uniform dispersion, while the reducing atmosphere generated during biomass pyrolysis together with biochar effectively suppressed the overgrowth of CuCo2O4 crystallites, increased the exposure of active sites and promoted the formation of surface defects and oxygen vacancies in the spinel oxide. Furthermore, the rich surface functional groups of biochar increased the adsorption capacity for toluene molecules. This work presents a promising strategy for the design of high-performance spinel-based catalysts and demonstrates considerable potential for their application in industrial waste gas treatment.
Supplementary material
The supplementary material for this article can be found at https://doi.org/10.1180/clm.2026.10038.
Financial support
This work was supported by the National Natural Science Foundation of China (51674043) and the National Students Platform for Innovation and Entrepreneurship Training Program (X202510292018).
Competing interests
There authors declare none.