





Satisfaction with democracy serves as a mid-level indicator of political support, positioned between diffuse (broad) regime approval and confidence in political figures and institutions (Norris Reference Norris, Zmerli and van der Meer2017). At the individual level, satisfaction with democracy is less stable than support for democratic principles and values but more stable than trust in the regime’s main representatives. Therefore, it is widely used as a metric to assess public perceptions of the performance of political institutions and, by extension, the legitimacy of democratic regimes as a whole (Anderson, Blais, Bowler et al. Reference Anderson, Blais, Bowler, Donovan and Listhaug2005; Claassen and Magalhães Reference Claassen and Magalhães2022; Singh and Mayne Reference Singh and Mayne2023: 193–196; Valgarðsson and Devine Reference Valgarðsson and Devine2022).Footnote 1
A central finding in the scholarship on satisfaction with democracy is that citizens who support a political party elected into government are consistently more satisfied with the functioning of democracy in their country than supporters of opposition parties (Blais and Gélineau Reference Blais and Gélineau2007; Singh, Karakoç, and Blais Reference Singh, Karakoç and Blais2012). This winner-loser gap has been systematically identified across time and contexts, earning its place ‘among the most well-established relationships in comparative political behavior research’ (Singh and Mayne Reference Singh and Mayne2023: 199).
Although the underlying mechanism remains debated (Daoust, Plescia, and Blais Reference Daoust, Plescia and Blais2023), winners’ higher satisfaction is commonly attributed to their favorable view of the government. Prior research distinguishes between policy-driven and emotion-driven mechanisms. The policy-driven mechanism emphasizes voters’ assessment of how well the political system delivers on their preferences. Winners can reasonably assume that the party they voted for, now in power, will implement policies aligned with their preferences (Aarts and Thomassen Reference Aarts and Thomassen2008; Ferland Reference Ferland2021; Stecker and Tausendpfund Reference Stecker and Tausendpfund2016). Losers, by contrast, are aware that their representatives have restricted opportunities to advance their political priorities; thus, they are likely to receive fewer policy benefits from the system. This asymmetric congruence between citizens’ preferences and actual governing outputs leads winners to view the political system as more responsive and legitimate, while losers perceive diminished responsiveness and therefore express lower satisfaction with democracy (Kern, Marien, and Muradova Reference Kern, Marien and Muradova2024; Kern and Kölln Reference Kern and Kölln2022; Singh Reference Singh2018). From this perspective, the winner-loser gap arises because government supporters obtain more benefits from the political system in terms of policies, whereas opposition supporters derive fewer.
The second mechanism is emotion-driven. Like in sports (see Bernhardt, Dabbs, Fielden et al. Reference Bernhardt, Dabbs, Fielden and Lutter1998), the simple fact of winning or losing can generate positive or negative emotions that spill over into political attitudes and evaluations of democratic performance (Thaler Reference Thaler1994; Webster and Albertson Reference Webster and Albertson2022). From this perspective, the winner-loser gap does not arise because government supporters receive more favorable policy outcomes from the system, but because winning itself produces a positive emotional state. Conversely, losers feel less satisfied with democracy simply because ‘their side lost’, independent of any substantive benefits or disadvantages delivered by the political system, as emphasized by Kuechler (Reference Kuechler, Reif and Inglehart1991: 280), Anderson and Guillory (Reference Anderson and Guillory1997: 70), and Pierce, Rogers and Snyder (Reference Pierce, Rogers and Snyder2016).
An important distinction between these two mechanisms concerns their temporal dynamics. Emotion-driven reactions should appear right after voters learn who is in government: affective responses occur quickly and should translate into instant shifts in democratic satisfaction (Singh, Fournier, and Roy Reference Singh, Fournier and Roy2026). Policy-driven reactions, however, should unfold more slowly – especially under coalition governments where government policy often reflects complex inter-party negotiations. Meaningful updates in satisfaction should therefore occur only after new incumbents begin articulating or implementing policy initiatives. This distinction parallels Bäckström’s (Reference Bäckström2026) framework of short-and long-term effects, whereby immediate affective responses represent only the first stage of attitude formation, with winner-loser polarization continuing to deepen gradually as voters encounter and process new political information in the postelection period.
The relationship between winning or losing and satisfaction with democracy is stronger in contexts where there is high ideological congruence between the electorate and the government (Bernauer and Vatter Reference Bernauer and Vatter2012; Gärtner, Gavras, and Schoen Reference Gärtner, Gavras and Schoen2020; Mayne and Hakhverdian Reference Mayne and Hakhverdian2017; Ridge Reference Ridge2022a) and in systems where winning parties exert greater control over the government or legislature (Anderson and Guillory Reference Anderson and Guillory1997; Blais, Morin-Chassé, and Singh Reference Blais, Morin-Chassé and Singh2017; Nadeau, Daoust, and Dassonneville Reference Nadeau, Daoust and Dassonneville2023; Singh Reference Singh2014). In contexts with low democratic quality, voters across the board are more likely to doubt whether political institutions can respond to their demands at all, highlighting the limited extent to which electoral outcomes and political representation structure satisfaction with democracy (Dahlberg and Linde Reference Dahlberg and Linde2016; Daoust and Nadeau Reference Daoust and Nadeau2023; Ridge Reference Ridge2025).
Given the fundamental role of legislative elections in government formation within parliamentary democracies, much of the existing research on the winner-loser gap has focused on the period surrounding election day. Most studies have analyzed the winner-loser gap using cross-sectional surveys and short panel inquiries, primarily examining its manifestations in postelection contexts (for review, see Singh and Mayne, Reference Singh and Mayne2023). The limited research exploring the temporal dynamics of the winner-loser gap throughout the electoral cycle suggests that the gap persists well beyond election day (Dahlberg and Linde Reference Dahlberg and Linde2017; Loveless Reference Loveless2021) when political conditions remain relatively stable (Higashijima and Kerr Reference Higashijima and Kerr2023; Nemčok and Wass Reference Nemčok and Wass2021). When government transitions occur, however, the gap may initially reverse before gradually re-emerging over subsequent weeks as voters realign their attitudes (Bäckström Reference Bäckström2026). While these studies enhance our understanding of the dynamics and causes of the gap, they remain tied to elections, where shifts in satisfaction with democracy coincide with many election-related factors, such as party vote shares, their translation into seat shares, changes in these figures compared to previous elections, media coverage of elections, and speculation surrounding post-electoral coalition negotiations (Blais, Morin-Chassé, and Singh, Reference Blais, Morin-Chassé and Singh2017; Mayne and Hakhverdian, Reference Mayne and Hakhverdian2017; Nemčok Reference Nemčok2020). In contrast, far less is known about how winner–loser dynamics unfold between elections, when governing power can shift without voters being directly involved. Mid-cycle government reshuffles are increasingly common in parliamentary democracies (Laver Reference Laver2003; Müller and Louwerse Reference Müller and Louwerse2020), yet their implications for citizens’ satisfaction with democracy remain understudied. Examining such cases offers an opportunity to understand how changes in who governs – in the absence of elections – shape the winner-loser gap and its temporal dynamics.
To explore these mid-cycle dynamics, we leverage the unexpected government reshuffle in Estonia in 2016 that took place more than 20 months after parliamentary elections and during the fieldwork for Round 8 of the European Social Survey (ESS). In this reshuffle, the largest party in the ruling three-party coalition, which had supplied the Prime Minister (PM), was relegated to the opposition. Simultaneously, the largest opposition party assumed leadership of the government, with its chairperson becoming the new PM. As a result, approximately half of Estonian voters experienced a change in their winner/loser status, while the status of the remaining half remained unchanged, providing a baseline for comparison.
We employ fixed effects models, including a difference-in-differences design, to compare changes in satisfaction with democracy among voters whose winner/loser status shifted with the reactions of those whose preferred parties’ status remained unchanged. The findings provide stronger evidence for the losing side than for the winning side. The difference-in-differences design yields no statistically significant effect of becoming a winner at any post-intervention period, though point estimates are consistently in the expected positive direction. The losing effect reaches statistical significance but rests on a small number of respondents in the final observation window and is sensitive to sample composition. The effect emerged around six weeks after the government reshuffle, following the adoption of an extensive package of tax reforms, suggesting that voter reactions are driven, at least to an extent, by policy considerations, rather than being purely emotional responses.
Empirical context: The 2016 government replacement in Estonia
More than 20 months after the general election held on 1 March 2015, the Reform Party, the largest government party, was unexpectedly replaced by the largest opposition party, the Centre Party. This government reshuffle occurred during the data collection period for Round 8 of the ESS (1 October 2016 – 31 January 2017) available at https://ess.sikt.no/en/data-builder/. Aside from the two largest parties, all other parties in Estonia’s multiparty system retained their government or opposition status, and the new coalition remained in office until the next scheduled general election (3 March 2019).
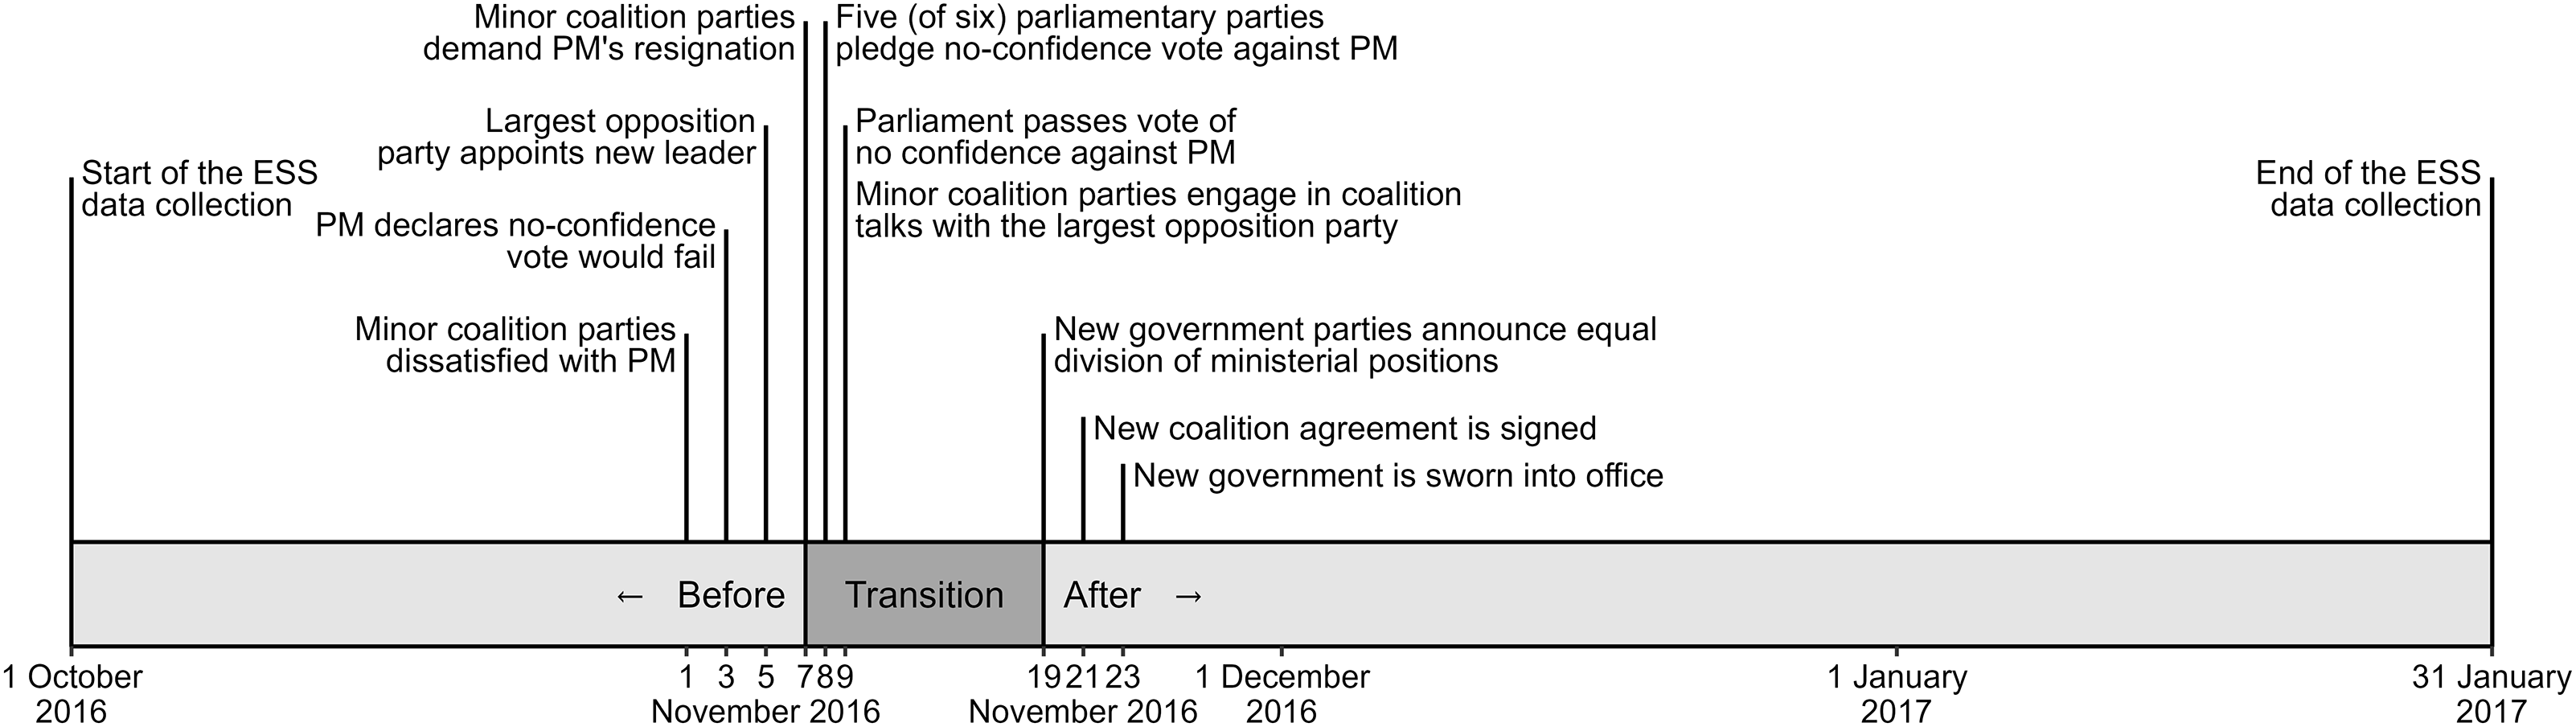
The episode – summarized in Figure 1 – began in early November 2016 when the two junior government parties, the Social Democrats and national-conservative Pro Patria, voiced their dissatisfaction with Taavi Rõivas, the PM supplied by the Reform Party. In a quick response, the PM dismissed their criticism as baseless and publicly asserted that any vote of no confidence would fail. While such struggles are not uncommon in parliamentary democracies, the situation escalated on 7 November 2016, when the two junior coalition parties demanded the PM’s resignation. The following day, they joined opposition parties in pledging to vote against the PM. On 9 November 2016, the Parliament confirmed the vote of no confidence, and the two junior coalition parties began negotiations with the largest opposition force, the Centre Party. A new government coalition, led by PM Jüri Ratas (Centre Party), was quickly formed and publicly announced on November 19, 2016.Footnote 2
Timeline of the 2016 government reshuffle in Estonia and the data collection period for Round 8 of the European Social Survey (ESS).

Hence, the government reshuffle took only 12 days – from 7 November, when the junior coalition parties demanded the PM’s resignation and the crisis became public, to 19 November, when the parties forming the new parliamentary majority announced the composition of the new government, including the allocation of ministerial portfolios. Yet despite this swift replacement of the leading coalition party, little changed for the junior coalition partners. Pro Patria gained one additional ministerial portfolio in the Ratas cabinet, but of the 10 Pro Patria and Social Democratic ministers who entered the new government, nine had already served in the Rõivas cabinet, mostly continuing in the same posts.
The government change was unexpected, made possible by the Centre Party’s recent leadership transition, which instantly altered coalition dynamics. On 5 November, Jüri Ratas was elected leader of the Centre Party at an extraordinary party congress involving a competitive vote by 1,016 delegates. He replaced Edgar Savisaar, whose long tenure had been marred by corruption scandals and ties to Russia. Under Savisaar, the Centre Party had been deemed unacceptable by the Social Democrats and Pro Patria. The lifting of the veto prompted the junior coalition partners to abandon the Reform-led government and, within two days, to pass a no-confidence vote that brought an end to the Reform Party’s longstanding dominance of the premiership. The public had little to no reason to anticipate this outcome: the Reform Party had held the premiership continuously since 2005, remained the largest parliamentary party since 2007, and the internal coalition maneuvering only entered the media spotlight after Savisaar’s replacement. These features – the speed of the reshuffle, its magnitude, and its invisibility to voters until the last moment – qualify it as an unexpected event during survey design (Muñoz, Falcó-Gimeno, and Hernández Reference Muñoz, Falcó-Gimeno and Hernández2020).
Considering that supporters of the largest party ‘almost unanimously believe that their party won’ (Stiers, Daoust, and Blais Reference Stiers, Daoust and Blais2018: 21), this sudden change of government – in which the prime ministerial party was relegated to the opposition – provides a unique opportunity to study the effects of winning and losing without elections. Voters of the largest governing party lost their status as electoral winners, while voters of the largest opposition party, which assumed leadership of the government and supplied the new PM, became electoral winners. Given the significant ideological and policy differences among the parties (see online Appendix B), the replacement of Reform by Centre moved the government markedly to the left.
Data and methods
Recent research on the winner-loser gap has been marked by notable methodological advancements. Beyond early split-sample cross-sectional studies (Anderson, Blais, Bowler et al. Reference Anderson, Blais, Bowler, Donovan and Listhaug2005; Anderson and Guillory Reference Anderson and Guillory1997; Wells and Krieckhaus Reference Wells and Krieckhaus2006), panel designs reduced omitted-variable bias (Blais and Gélineau Reference Blais and Gélineau2007; Gärtner, Gavras, and Schoen Reference Gärtner, Gavras and Schoen2020; Karp and Bowler Reference Karp and Bowler2001; Mongrain Reference Mongrain2023; Singh, Karakoç, and Blais Reference Singh, Karakoç and Blais2012), while matching techniques have strengthened causal identification (Ridge Reference Ridge2022b). Other approaches exploit exogenous shocks, such as delays in announcing election winners (Halliez and Thornton Reference Halliez and Thornton2023) or government formation during postelection survey studies, enabling a discontinuity design (Daoust, Nemčok, Broniecki et al. Reference Daoust, Nemčok, Broniecki and Loewen2024; Nemčok Reference Nemčok2020).
Despite this methodological diversity, nearly all existing studies analyze survey data collected around election periods and therefore examine how government formation affects individuals’ satisfaction with democracy shortly after voting. Yet changes of government can also occur at other points in the electoral cycle (Laver Reference Laver2003; Müller and Louwerse Reference Müller and Louwerse2020), and we know surprisingly little about how voters react to changes in their winner/loser status when these changes occur in the absence of an election.
The 2016 government replacement in Estonia offers an opportunity to address this question. As noted earlier, the reshuffle took place 20 months into the 2015–2019 electoral cycles, with the parliamentary representation of all parties remaining unchanged. Estonia’s government change occurred during the ESS Round 8 data collection period, which spanned from 1 October 2016 to 31 January 2017. The interview date for each respondent is recorded as part of the administrative data in the ESS database.Footnote 3 Respondents interviewed between 7 November and 19 November (when the government crisis and coalition talks were ongoing, see Figure 1) were excluded from the analysis, as it was not possible to unambiguously classify voters as winners or losers during this period.Footnote 4
The ESS in Estonia employed a multistage probability design stratified by gender and five NUTS3 geographical regions, with individuals systematically selected by age in proportion to the population size within each stratum. Interviews were conducted face-to-face, and because the date of each interview was independent of respondents’ preferences, the timing of the interview before or after the government change approximates randomization. This allows observed shifts in satisfaction with democracy to be interpreted as causal effects of changes in respondents’ winner/loser status (Muñoz, Falcó-Gimeno, and Hernández Reference Muñoz, Falcó-Gimeno and Hernández2020).
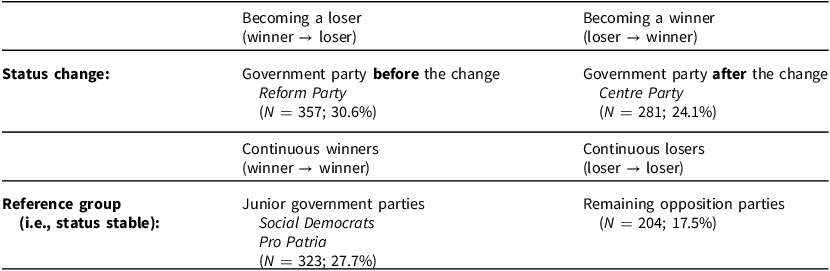
The sample consists of 2,008 individuals, of whom 1,247 (62.1%) reported voting in the most recent national election. Of these, 1,165 respondents (58.0%) disclosed their party choice in response to the question, ‘[w]hich party did you vote for in the last national election?’, followed by the list of relevant parties in Estonia.Footnote 5 Using this information, the research design identifies two types of winner/loser status changes: (1) respondents who had voted for the Reform Party, which was relegated from government to opposition, are coded as becoming losers (N = 357; 30.6%), whereas (2) individuals who had voted for the Centre Party, which joined the governing coalition, are coded as becoming winners (N = 281; 24.1%), as shown in Table 1.Footnote 6 The two additional groups include voters whose winner/loser status remained unchanged: (3) continuous winners, i.e., those who supported the two junior parties that retained government positions after the reshuffle (N = 323; 27.7%), and (4) continuous losers, i.e., those who voted for parties that remained in opposition both before and after the government change (N = 204; 17.5%).Footnote 7
Classification of voters based on vote choice in 2015 general election

We leveraged fixed effects models to estimate group-specific dynamics in 14-day intervals across the entire data collection period.Footnote 8 However, government crises can have repercussions for the attitudes of all voters. Therefore, after we examine the temporal trends within each group, we further compare individuals whose status changed relative to reference groups that had the same initial winner/loser status and whose status remained constant throughout the ESS fieldwork. Specifically, individuals who were winners but later became losers are compared to continuous winners, whereas individuals who were losers but later became winners are compared to continuous losers. Using this specification, the difference-in-differences approach can account for the attitudinal changes of all voters in response to the present government crisis, thereby isolating the differences in satisfaction with democracy attributable specifically to the change in winner/loser status.Footnote 9
The outcome variable, satisfaction with democracy, is measured using the question: ‘And on the whole, how satisfied are you with the way democracy works in Estonia?’ Responses are recorded on an 11-point scale, ranging from 0 (‘extremely dissatisfied’) to 10 (‘extremely satisfied’). In the Estonian subset of the ESS Round 8 data, the mean satisfaction with democracy is 5.08, the median is 5.00, and the standard deviation is 2.38.
Findings: winning and losing in the absence of elections
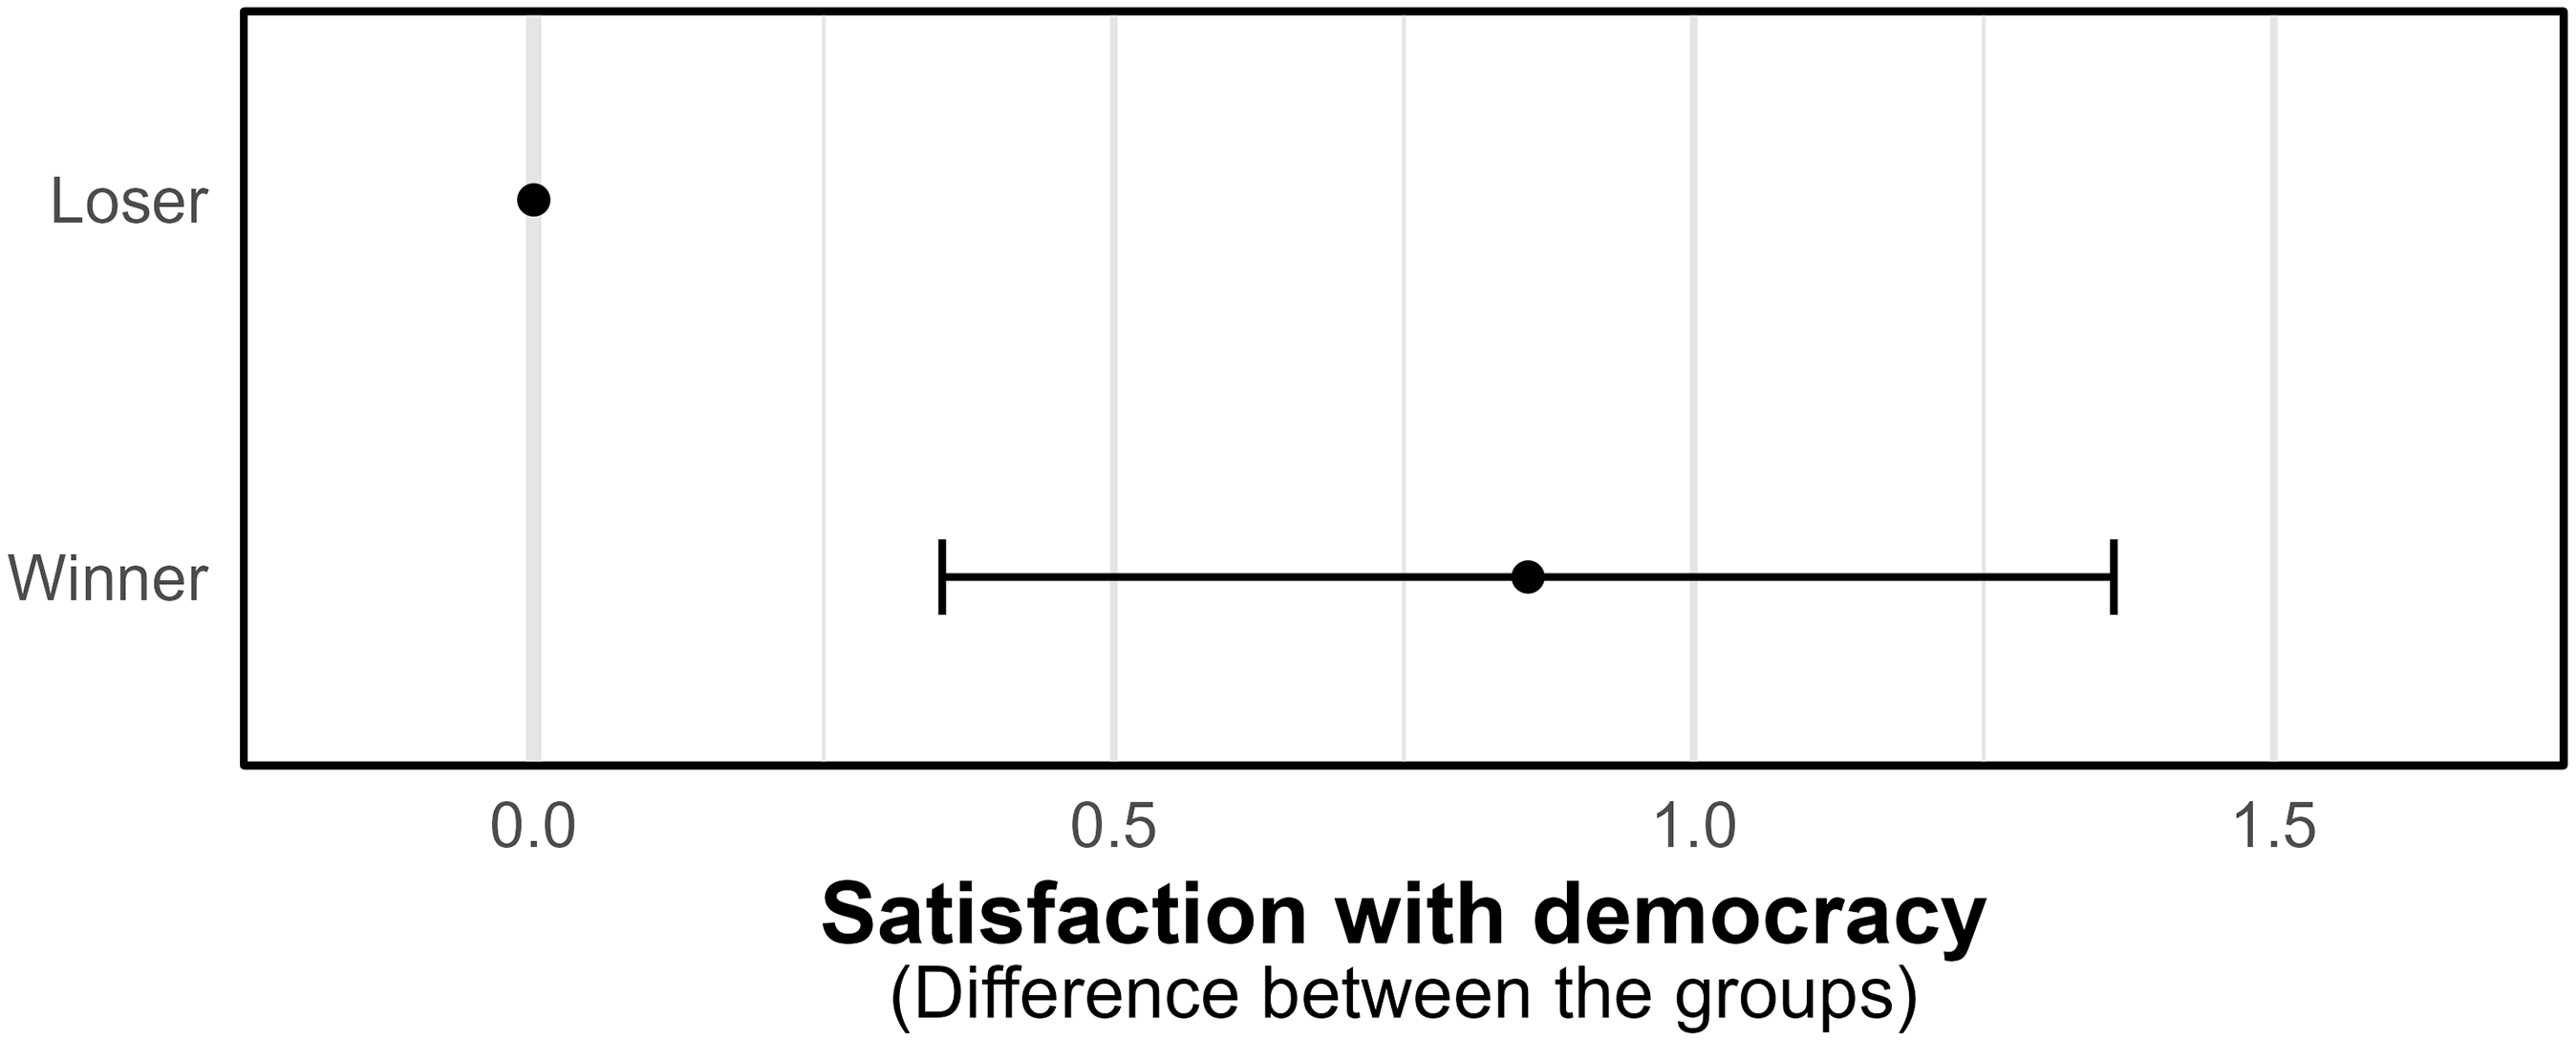
Using ESS Round 8 data collected in Estonia before the government change, we first examine whether the winner-loser gap in democratic satisfaction aligns with established findings in the literature. The results across three model specificationsFootnote 10 consistently show that winners are approximately 8%–10% more satisfied with democracy than losers, corresponding to a 0.9–1.1-point difference on the 11-point scale. Figure 2 illustrates this gap (based on the most conventional specification in model E2 in Table E1 of the online Appendix), which is consistent with the typical magnitude of winner-loser gaps observed in comparative studies (Daoust and Nadeau Reference Daoust and Nadeau2023). These findings confirm that satisfaction with democracy in Estonia, based on ESS data, is consistent with broader trends reported in the literature (see, e.g., Anderson, Blais, Bowler et al. Reference Anderson, Blais, Bowler, Donovan and Listhaug2005; Blais and Gélineau Reference Blais and Gélineau2007; Gärtner, Gavras, and Schoen Reference Gärtner, Gavras and Schoen2020; Singh, Karakoç, and Blais Reference Singh, Karakoç and Blais2012). As such, the dataset is well-suited for analyzing the effects of winner/loser status changes in the absence of elections.
The magnitude of the winner-loser gap in Estonia before the government change in 2016.
Note: Predicted values are based on the relevant coefficient from an OLS regression (model E2 controlling for gender, age, education, and income), included in Table E1 of the online Appendix. The horizontal line represents the 95% confidence intervals. Data from ESS Round 8 conducted in Estonia.

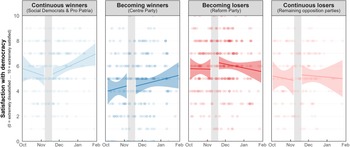
The analysis now examines the dynamics of satisfaction with democracy before and after the government change across the four groups of interest, as outlined in Table 1. Figure 3 visualizes these trends descriptively with fitted lines representing ordinary least squares (OLS) best fits for each group (without incorporating control variables). The figure confirms that groups classified as electoral winners before the government change (i.e., continuous winners and winners becoming losers) exhibited higher levels of satisfaction with democracy than groups composed of electoral losers.
The temporal dynamics of satisfaction with democracy across the four groups of voters.
Note: Lines show linear fits with 95% confidence intervals (shaded areas). Data from ESS Round 8 conducted in Estonia. The grey rectangle marks the period of coalition negotiations.

Figure 3. Long description
The image contains four line graphs, each representing the satisfaction with democracy over time for different voter groups. The vertical axis represents satisfaction levels, ranging from 0 (extremely dissatisfied) to 10 (extremely satisfied). The horizontal axis represents time, spanning from October to February. Panel A: Continuous winners (Social Democrats & Pro Patria) shows a line graph with a blue line indicating an upward trend in satisfaction over time. Panel B: Becoming winners (Centre Party) also shows a line graph with a blue line, indicating a slight upward trend in satisfaction. Panel C: Becoming losers (Reform Party) displays a line graph with a red line, showing a slight downward trend in satisfaction. Panel D: Continuous losers (Remaining opposition parties) features a line graph with a red line, indicating a relatively stable trend with a slight downward slope. Each graph includes individual data points and shaded areas representing confidence intervals.
After 19 November, when the composition of the new government was definitively established, two distinct patterns became evident. Comparing averages among subsets of voters before and after the government change, satisfaction with democracy increased among the two groups classified as winners – continuous winners and losers becoming winners. In contrast, satisfaction declined among voters whose preferred parties were in opposition after the government change, specifically among continuous losers and winners becoming losers. These trends highlight the temporal dynamics of satisfaction with democracy, suggesting that being confirmed as a winner or loser after a period of uncertainty may have an effect on democratic satisfaction, regardless of one’s initial status. However, this effect seems to require time to fully develop within the relevant groups.
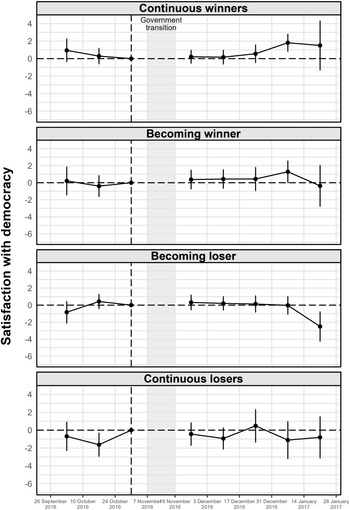
Next, we estimate four fixed effects models, one for each voter group of interest, to examine the temporal dynamics of satisfaction with democracy. Each model relies only on observations from the relevant group and combines separate time dummies for each 14-day period with party fixed effects to estimate average group-level satisfaction with democracy at specific time points.Footnote 11 The predicted values are visualized in Figure 4, based on the regression models reported in Section E of the online Appendix.
Temporal dynamics of satisfaction with democracy across the four groups of interest.
Note: Predicted values based on the OLS regression controlling for gender, age, education, and (household) income. Full results are presented in Table G1 of the online Appendix. The timeline refers to the timing of the survey interview. The vertical lines represent the 95% confidence intervals. Data from ESS Round 8 conducted in Estonia.

Among the two groups of winners – continuous winners and becoming winners – we observe a positive within-group trend in the period around six to eight weeks, though the effect is more pronounced among continuous winners. In the becoming-winner panel, the modest positive estimate at t + 4 is almost entirely reversed in the subsequent period. As a result, there is no pair of consecutive post-intervention periods in which a positive effect is sustained. Such instability is difficult to interpret as evidence of a systematic response to winning and is equally consistent with period-specific noise. Notably, among voters who became losers, satisfaction with democracy remains stable from t + 1 to t + 4, with the entire observed decline concentrated in the final observation window (t + 5). Consequently, the within-group pattern hinges on that single period.
The delayed emergence of this effect suggests that it was not triggered by the government reshuffle itself but more probably by the substantive policy agenda advanced by the new coalition. Most notably, within its first month in office, the new coalition introduced a bundle of extensive tax reforms (Estonian Public Broadcasting 2016). Adopted by the parliament on 19 December 2016, these reforms were far-reaching, controversial, and fiercely opposed by the opposition parties, in particular the Reform Party, long associated with fiscal conservatism (see, e.g., Raudla and Kattel Reference Raudla and Kattel2011), which even called on the President to not proclaim the law (Riigikogu 2016). While we cannot directly test whether changes in satisfaction with democracy among the four voter groups were driven by policy considerations, such an interpretation aligns with the delayed emergence of the observed effects.
Other contextual factors may also help explain the increase, albeit statistically insignificant, in satisfaction with democracy among continuous winners, even though they had already been electoral winners before the reshuffle. For Social Democratic voters, the new coalition likely represented a more ideologically proximate government compared to the Reform-led cabinet.Footnote 12 The coalition was also perceived as more balanced, with the Centre Party holding fewer seats in the parliament than Reform and dividing ministerial portfolios equally with its partners. Moreover, the Social Democratic and Pro Patria ministers were older and more experienced than their Centre Party colleagues (Helme and Koorits Reference Helme and Koorits2016), which may have lent the government additional credibility in the eyes of their voters. Finally, a honeymoon effect cannot be ruled out: winners often respond positively in the early months of a government, before disappointment typically sets in (see Dewan and Myatt Reference Dewan and Myatt2012).
The final part of the analysis employs a difference-in-differences (two-way fixed effects) approach, comparing voters whose status changed to reference groups that shared the same initial status but remained constant throughout the period: specifically, the becoming losers group is compared to continuous winners, and the becoming winners group to continuous losers. This design yields two pre-intervention estimates, enabling validation of the parallel trends assumption, and five estimates for post-intervention periods, offering insights into temporal shifts in satisfaction with democracy among the groups affected by the government change. To account for potential variations in group composition over time, the models include a standard set of control variables: gender, age, education, and household income.Footnote 13 The regression tables are presented in Section H of the online Appendix.
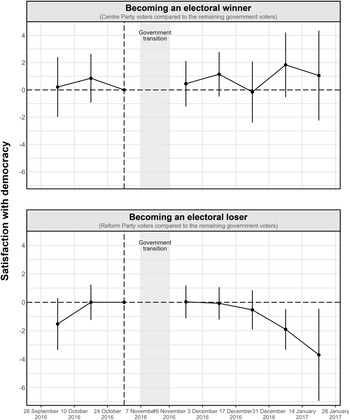
The upper part of Figure 5 tracks satisfaction with democracy among voters of the Centre Party, who transitioned from losers to winners, compared to voters of the remaining opposition parties (the reference group). The parallel trends assumption appears to hold. The post-intervention estimates are not only uniformly nonsignificant but also follow a nonmonotonic pattern across periods: slightly positive at t + 1, somewhat larger at t + 2, close to zero at t + 3, rising again at t + 4, and then declining at t + 5. This erratic sequence does not seem to suggest a coherent positive response to gaining government status. The jackknife analysis (Figure H1 of the online Appendix) corroborates this interpretation: all iterations yield nonsignificant estimates at both t + 4 and t + 5, regardless of sample composition. We therefore interpret this as a null result, while noting that the point estimates are directionally consistent with the expected effect.
Difference-in-differences: The effect of becoming a winner (upper panel) and becoming a loser (lower panel) on satisfaction with democracy.
Note: Predicted values based on the OLS regression controlling for gender, age, education, and (household) income. Full results are presented in Tables H1 and H2 of the online Appendix. The timeline refers to the timing of the survey interview. The vertical lines represent the 95% confidence intervals. Data from ESS Round 8 conducted in Estonia.

The lower panel in Figure 5 presents the effect of becoming a loser. Supporters of the Reform Party, which exited the government, are compared to voters of the two junior coalition parties, who remained winners (the reference group) throughout the study period. The two groups display broadly similar trends in satisfaction with democracy prior to the government reshuffle. However, the earliest pre-intervention estimate for the becoming-loser group is visibly negative rather than close to zero. Although the confidence interval is wide and the two-period pre-intervention window limits statistical power for formal testing, this pattern suggests that the groups may not have been on fully identical trajectories prior to the government change.
The estimate at t + 4 is statistically significant, but (based on the previous analysis) it appears to be driven primarily by an increase in satisfaction among the reference group rather than a decline among the new losers – a mechanism not fully consistent with the theoretical expectation. In the subsequent period, the point estimate increases to 3.6 points (approximately one-third of the scale range) and remains statistically significant, albeit with substantially wider confidence intervals.Footnote 14 However, the t + 5 estimate should be interpreted with caution: the number of respondents is small, and the jackknife analysis shows that in 2 of 58 iterations the effect loses statistical significance, including one instance in which it disappears entirely. This degree of sensitivity suggests that the t + 5 estimate depends heavily on a small number of observations and may not reflect a stable underlying pattern. We therefore interpret this period as providing suggestive rather than conclusive evidence.
This pattern is consistent with the view that the formation of the winner–loser gap is driven primarily by policy-based considerations rather than emotional responses. Voters needed time to process their changed status, acknowledge their party’s reduced influence, and adjust their expectations regarding policy implementation. Moreover, the difference-in-differences results suggest that the gap is driven primarily by changes on the losing side, consistent with prior research (Esaiasson Reference Esaiasson2011; Kern, Marien, and Muradova Reference Kern, Marien and Muradova2024; Kern and Kölln Reference Kern and Kölln2022). To the extent this asymmetry is real, it would align with loss aversion theory, whereby losses carry greater psychological weight than equivalent gains (Hansen, Klemmensen, and Serritzlew Reference Hansen, Klemmensen and Serritzlew2019; Pierce, Rogers, and Snyder Reference Pierce, Rogers and Snyder2016). However, given the fragility of the loser estimates and the null result for winners, we treat this asymmetry as a tentative interpretation rather than a firm conclusion.
Conclusion
The key contribution of this research lies in extending the analysis of the winner–loser gap beyond the immediate postelection period – deep into the electoral cycle. Whereas most existing studies examine how government formation influences satisfaction with democracy shortly after citizens cast their ballots, our approach leverages an unexpected mid-cycle change in government to assess how shifts in winner/loser status influence democratic satisfaction in the absence of elections. In doing so, the study advances debates about democratic representation and political support by demonstrating that mid-cycle government changes offer a viable avenue for studying winner–loser dynamics independently of election-related factors and by providing suggestive evidence that such dynamics may extend beyond the electoral context.
Our analysis employed fixed effects models, including a difference-in-differences design, to assess the effect of a change in winner/loser status in the absence of elections. The results are directionally consistent with theoretical expectations, though the evidence is fragile: the difference-in-differences design yields no statistically significant winning effect, and the losing effect, while significant at two time points, is sensitive to sample composition. The transition from winner to loser appears to matter more than the transition from loser to winner – a tentative asymmetry consistent with the loss aversion theory (Hansen, Klemmensen, and Serritzlew Reference Hansen, Klemmensen and Serritzlew2019), whereby worsening prospects of having one’s political priorities addressed weigh more heavily on democratic satisfaction than an equivalent improvement.
Moreover, the effects emerged approximately six weeks after the government change, aligning with recent research (e.g., Bäckström Reference Bäckström2026; Gärtner, Gavras, and Schoen Reference Gärtner, Gavras and Schoen2020; Nadeau, Daoust, and Dassonneville Reference Nadeau, Daoust and Dassonneville2023) and suggesting that the winner–loser gap is driven more by policy-based considerations than by immediate emotional responses. A comprehensive tax reform coinciding with this timing provides a plausible narrative, though we note that these mechanistic interpretations rest on fragile estimates, and alternative explanations – including statistical noise – cannot be ruled out. Overall, the effects were short-lived, underscoring that satisfaction with democracy reflects contemporaneous evaluations of policy development and institutional performance (see also Claassen and Magalhães Reference Claassen and Magalhães2022; Linde and Ekman Reference Linde and Ekman2003; Singh and Mayne Reference Singh and Mayne2023: 193–196).
The study faces several limitations that bear on the interpretation of the results. First, the research design relies on a sample of respondents who happened to be surveyed during arbitrarily defined periods, which limits control over sample size across periods. Several critical post-intervention windows contain relatively few respondents, making the estimates susceptible to noise. These limitations mean that the findings are better read as suggestive evidence consistent with theoretical expectations rather than strong empirical confirmation, and future research should seek to validate them using more controlled designs.
Supplementary material
The supplementary material for this article can be found at https://doi.org/10.1017/S1475676526101479
Data availability statement
The replication package for this article (including data, code, and media excerpts) is available in the Harvard Dataverse at https://doi.org/10.7910/DVN/JYH2C7.
Acknowledgments
The authors gratefully acknowledge the helpful comments received on earlier versions of this paper presented at the Sixth Annual Tartu Conference (12–14 June 2022), the ‘Voter Perceptions of PostElection Outcomes’ Workshop (Vienna, 25–26 May 2023), the EPSA Annual Conference (Glasgow, 22–24 June 2023), the ECPR General Conference (Prague, 4–8 September 2023), and a research seminar at KU Leuven’s Voting and Democracy Unit (21 October 2024).
Funding statement
Miroslav Nemčok acknowledges funding from the Research Council of Norway for the WELTRUST project (grant number 301443).
Competing interests
The authors declare no competing interests.
Ethical standards
The authors declare that this research relies exclusively on publicly available, anonymized data and did not involve any interaction with human subjects or the collection of personal or sensitive information. In line with institutional and national regulations, no formal ethical approval was required. The study complies with the ethical standards of the European Journal of Political Research, and no ethical concerns were identified.


 Open access

