


1. Introduction
Several previous studies have examined whether longevity has a positive effect on per capita income. Acemoglu and Johnson (Reference Acemoglu and Johnson2007) concluded that “there is no evidence that the large increase in life expectancy raised income per capita” (p. 925). However, Bloom et al. (Reference Bloom, Canning and Fink2014) found that “in a more general empirical framework in which we include initial life expectancy, the Acemoglu and Johnson results are reversed, with both levels and changes in health displaying positive associations with” per capita income growth. Kuhn et al. (Reference Kuhn, Minniti, Prettner and Venturini2024) also found there to be a highly significant positive effect of longevity on per capita income.
Even if longevity growth has no effect on per capita income growth, it has a positive effect on economic growth (or “human development”), broadly defined. Health and longevity are valued for their own sake, not merely because they may increase per capita income. Nordhaus (Reference Nordhaus, Murphy and Topel2003) argued that “to a first approximation, the economic value of increases in longevity in the last hundred years is about as large as the value of measured growth in non-health goods and services.” Life expectancy at birth is one of the three components of the United Nations’ Human Development Index (United Nations Development Programme, 2024), a summary measure of average achievement in key dimensions of human development.Footnote 1
Many leading economists believe that economic growth is primarily driven by technological progress, which is generated by R&D investment. Romer (Reference Romer1990, p. S72) argued that “technological change…lies at the heart of economic growth.” Jones (Reference Jones1998, pp. 89–90) argued that “technological progress is driven by research and development (R&D) in the advanced world.” Jones (Reference Jones2002) presented a model in which long-run growth is driven by the discovery (via research effort) of new ideas throughout the world. His model built upon a large collection of previous research, including Grossman and Helpman (Reference Grossman and Helpman1991) and Aghion and Howitt (Reference Aghion and Howitt1992), as well as earlier contributions by Phelps (Reference Phelps1966), Shell (Reference Shell1966), Nordhaus (Reference Nordhaus1969), and Simon (Reference Simon1986). Cutler et al. (Reference Cutler, Deaton and Lleras-Muney2006) concluded that “knowledge, science, and technology are the keys to any coherent explanation” of mortality.
In this study, we propose to investigate econometrically the overall impact that biomedical innovation had on premature mortality in the US during the period 1999–2019. We will use a difference-in-differences research design: we will investigate whether the diseases for which there was more biomedical innovation had larger reductions in premature mortality (e.g., the number of years of potential life lost before age 75). Biomedical innovation related to a disease will be measured by the change in the mean vintageFootnote 2 of Medical Subject Headings (MeSH) descriptors in PubMed articles about the disease.Footnote 3
Our methodology is similar to the one used in a previous study (Lichtenberg, Reference Lichtenberg2018). The present study will build on the previous study in several important ways. First, the previous study only covered cancer. While cancer is certainly an important disease, it accounted for only 19% of years of potential life lost before age 75 in the US in 2019. The present study will analyze data on all diseases. Second, the previous study did not examine whether biomedical innovation had different effects on the mortality of different racial groups. The present study will examine that issue. Third, the previous study analyzed cancer mortality during the period 1999–2013; the present study will analyze mortality from all diseases during the period 1999–2019. We will also reexamine cancer mortality during a longer period (1975–2019) and using an alternative mortality measure (the age-adjusted mortality rate).
In the next section, we explain how we constructed measures of biomedical innovation, by disease. In section 3, we present our econometric model of mortality. Data sources and descriptive statistics are presented in section 4. Empirical results are presented in section 5. Implications of the estimates are discussed in section 6. The final section provides a summary.
2. Measurement of biomedical innovation, by disease
Our measures of biomedical innovation, by disease, were constructed from data contained in PubMed, a literature database available to the public online since 1996, developed and maintained by the National Center for Biotechnology Information, part of the US National Library of Medicine (NLM). The PubMed database contains more than 36 million citations and abstracts of biomedical literature. PubMed data can be downloaded as described on the Download PubMed Data page. The PubMed database has three components: MEDLINE, PubMed Central (PMC), and Bookshelf.Footnote 4
MEDLINE is the largest component of PubMed and consists primarily of citations from journals selected for MEDLINE. MEDLINE is NLM's premier bibliographic database that contains more than 31 million references to journal articles in life sciences with a concentration on biomedicine. Currently, there are citations from more than 5,200 worldwide journals in about 40 languages.
The subject scope of MEDLINE is biomedicine and health, broadly defined to encompass those areas of the life sciences, behavioral sciences, chemical sciences, and bioengineering needed by health professionals and others engaged in basic research and clinical care, public health, health policy development, or related educational activities. MEDLINE also covers life sciences vital to biomedical practitioners, researchers, and educators, including aspects of biology, environmental science, marine biology, plant and animal science as well as biophysics and chemistry. The majority of the publications in MEDLINE are scholarly journals; however, a small number of newspapers, magazines, and newsletters considered useful to particular segments of the NLM broad user community have historically been included.
MEDLINE is the online counterpart to the MEDical Literature Analysis and Retrieval System (MEDLARS) that originated in 1964. MEDLINE includes literature published from 1966 to present, and an OLDMEDLINE subset that has selected coverage of literature prior to that period. The OLDMEDLINE subset represents journal article citations from two print indexes: the 1946–1959 Current List of Medical Literature (CLML), and the 1960–1965 Cumulated Index Medicus (CIM). There are approximately 2,011,000 article citations from international biomedical journals that cover the fields of medicine, preclinical sciences and allied health sciences from 1946 through 1965.Footnote 5
A distinctive feature of MEDLINE/PubMED is that the records are indexed with MeSH. MeSH is the NLM's controlled vocabulary thesaurus; the NLM says that MeSH “is one of the most highly sophisticated thesauri in existence today.” It consists of sets of terms (“descriptors”) in a hierarchical structure that permits searching at various levels of specificity.Footnote 6 There were 30,454 descriptors in 2023 MeSH. The MeSH Section staff continually revise and update the MeSH vocabulary.Footnote 7 Staff subject specialists are responsible for areas of the health sciences in which they have knowledge and expertise. In addition to receiving suggestions from indexers and others, the staff collect new terms as they appear in the scientific literature or in emerging areas of research; define these terms within the context of existing vocabulary; and recommend their addition to MeSH. Professionals in various disciplines are also consulted regarding broad organizational changes and close coordination is maintained with various specialized vocabularies. Between 2003 and 2023, the number of MeSH descriptors increased from 21.4 thousand to 30.5 thousand. On average, about 453 descriptors were added per year. The mean number of descriptors per article is 10.6; the 27 million PubMed articles published by 2019 have 286 million descriptors.
The NLM's MeSH Descriptor file and website indicates the year in which each MeSH descriptor was established.Footnote 8 However, a descriptor can appear in PubMed articles that were published many years before the descriptor was established. For example, as shown in Appendix Fig. 1, the descriptor “female” (unique ID D005260) was established in 1966 but appears in PubMed articles as early as 1942; it appeared in 12,370 articles in 1964. In this study, we will define the vintage of a descriptor as the earliest publication year of PubMed articles in which the descriptor occurs.
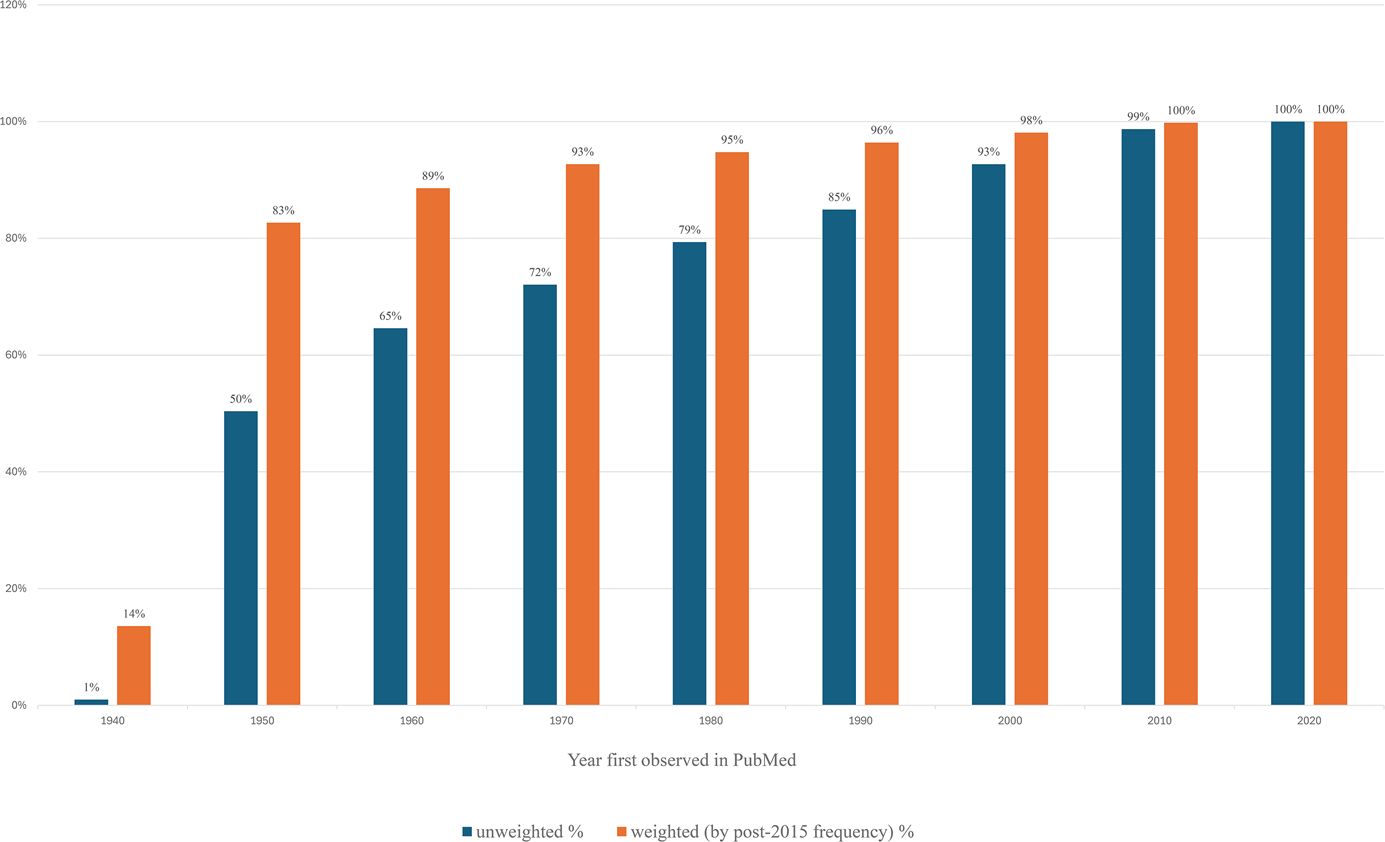
Although the number of MeSH descriptors has increased substantially, the average frequency at which recent descriptors occur in PubMed is much lower than the average frequency at which earlier-vintage descriptors occur. Consequently, the mean vintage of descriptors is quite old, and has not increased much. As shown in Fig. 1, half of the descriptors that ever appeared in PubMed first appeared after 1960, but only 17% of the (frequency-weighted) descriptor citations occurring in post-2015 publications were for descriptors that first appeared after 1960.
Fraction of 2023 MeSH descriptors first appearing in PubMed by year (1940, 1950, …, 2020): unweighted, and weighted by frequency in post-2015 PubMed articles.

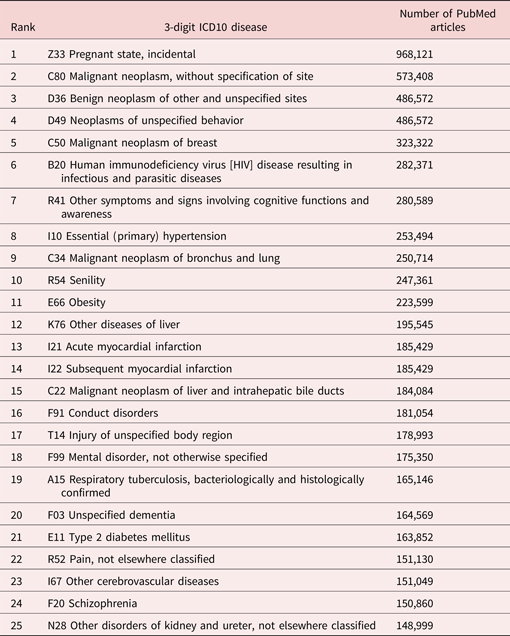
A substantial number of MeSH descriptors (in section C of the MeSH tree) are about diseases. Hence, we can identify articles that are about different diseases. By using the NLM's Unified Medical Language System, we can determine the ICD10 codes corresponding to MeSH disease descriptors. Table 1 shows the top 25 (out of 1028) 3-digit ICD10 diseases, ranked by number of PubMed articles. (Some articles may discuss several diseases.) Not surprisingly, highly prevalent diseases including breast neoplasms, HIV, hypertension, lung neoplasms, acute myocardial infarction, and diabetes are included in this list.
Top 25 (out of 1028) 3-digit ICD10 diseases, ranked by number of PubMed articles

The measure of disease-specific biomedical innovation we will employ is the long-run change in the mean vintage of descriptors of articles about each disease. We hypothesize that, in general, diseases for which there were larger increases in vintage had smaller increases, or larger declines, in mortality.
The hypothesis that later vintage goods and services tend to be of higher quality than earlier vintage goods has been advocated by many economists since it was first formulated in the 1950s.Footnote 9 Johansen (Reference Johansen1959) developed a theoretical model of vintage capital in which there are technological improvements in capital in later vintages. Intriligator (Reference Intriligator1992, p. S77) said that “the newer capital is more productive than the older capital as a result of technological improvements in the later vintages.” Bresnahan and Gordon (Reference Bresnahan and Gordon1997) said that “new goods are at the heart of economic progress.” As noted by Jovanovic and Yatsenko (Reference Jovanovic and Yatsenko2012), in “the Spence–Dixit–Stiglitz tradition…new goods [are] of higher quality than old goods.” Bohlmann et al. (Reference Bohlmann, Golder and Debanjan2002, p. 1177) said that “technology improves over time…As technology advances, later entrants can utilize a more recent and efficient vintage of technology than an earlier entrant who has committed to older technology…vintage effects will benefit later entrants…We refer to ‘vintage effects’ as any technology shift that results in lower costs for a later entrant, enabling it to achieve higher product quality.” In 1987, the Royal Swedish Academy of Sciences awarded the Alfred Nobel Memorial Prize in Economic Sciences to Robert Solow for his contributions to the theory of economic growth. The Academy cited Solow's (Reference Solow, Arrow, Karlin and Suppes1960) article, Investment and Technical Progress, in which he presented a
new method of studying the role played by capital formation in economic growth. His basic assumption was that technical progress is “built into” machines and other capital goods and that this must be taken into account when making empirical measurements of the role played by capital. This idea then gave birth to the “vintage approach” (a similar idea was discussed by Leif Johansen in Norway at about the same time)…The most important aspect of Solow's article was not so much the empirical outcome, but the method of analyzing “vintage capital.” Nowadays, the vintage capital concept has many other applications and is no longer solely employed in analyses of the factors underlying economic growth…The vintage approach has proved invaluable, both from the theoretical point of view and in applications such as the analysis of the development of industrial structures.
We measure the vintage of “ideas” (MeSH descriptors), not the vintage of physical capital. Ideas may or may not be embodied in physical capital. If technological change is “disembodied,” it affects output growth independently of capital accumulation. In contrast, “embodied” technological change requires investment to affect output. The “embodiment” controversy between Jorgenson and Solow in the 1960s centered on the importance of capital-embodied technological change (Hercowitz, Reference Hercowitz1998).
3. Econometric model of mortality
To investigate econometrically the impact that biomedical innovation had on premature mortality in the US during the period 1999–2019, we will estimate many versions of the following model:

where mortalitydt is one of the following variables:

and vintage_measured,t−k is one of the following variables:

vint_meand,t−k was computed as follows:

where

post1990%d,t−k was computed as follows:

where
In equation (1), αd is a fixed effect for disease d, and δt is a fixed effect for year t. The year fixed effects (δt's) in equation (1) control for the effects of changes in aggregate demographic and macroeconomic variables (e.g., population size and age structure, GDP, educational attainment), to the extent that those variables have similar effects on mortality from different diseases. Equation (1) will be estimated by weighted least squares, weighting by (∑t mortalitydt). Disturbances will be clustered within diseases.
vint_meand,t−k is our principal measure of vintage. But the data on the vintages of MeSH descriptors are clearly left-censored: only 2% of MeSH descriptors first appeared in PubMed before 1945, and 40% first appeared during 1945–1947. Therefore, we will also estimate some versions of equation (1) in which vintage_measured,t−k = post1990%d,t−k.
Estimates of equation (1) will not capture cross-disease spillover effects: the potential effects of biomedical innovation for one disease (e.g., hypertension) on mortality from other diseases (e.g., acute cerebrovascular disease [stroke]). Although some spillover effects are adverse, others – perhaps most – are positive. For example, Prince et al. (Reference Prince, Patel and Saxena2007) argued that “mental disorders increase risk for communicable and non-communicable diseases, and contribute to unintentional and intentional injury. Conversely, many health conditions increase the risk for mental disorder, and comorbidity complicates help-seeking, diagnosis, and treatment, and influences prognosis.” Also, the NIH National Institute on Aging (2024) says that “conditions such as diabetes, depression, and stroke may increase a person's risk for Mild Cognitive Impairment.”
The relationship between biomedical innovation, as measured by the change in PubMed descriptor vintage, and the change in mortality is unlikely to be contemporaneous and may be subject to a substantial lag. Innovations may be discussed in biomedical literature several years before they are most frequently used, and improvement in outcomes may occur several years after changes in treatment (Barter and Waters, Reference Barter and Waters2018; van de Glind et al., Reference van de Glind, Willems, Eslami, Abu-Hanna, Lems, Hooft, de Rooij, Black and van Munster2016). For one important type of descriptors – drug descriptors – we can obtain insight into the timing of the relationship between the frequency of PubMed descriptors and the frequency of use of the drug. From the Medical Expenditure Panel Survey Prescribed Medicines files, we can obtain estimates of the number of US outpatient prescriptions, by (Multum MediSource Lexicon) generic drug name and year (1996–2021). We can also compute the annual number of PubMed descriptors of each of these drugs.Footnote 11 Using these data, we estimated the following model, using data on about 600 drugs:

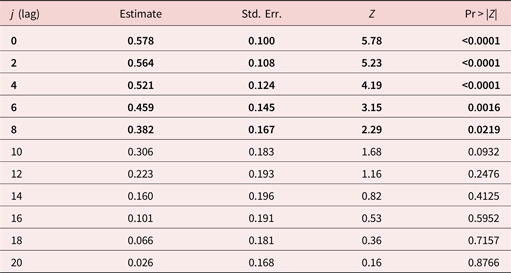
where

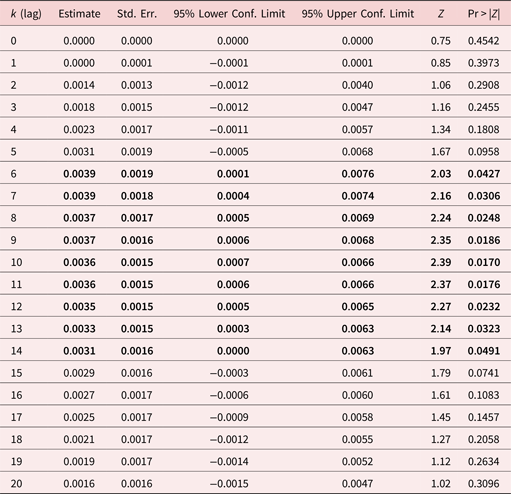
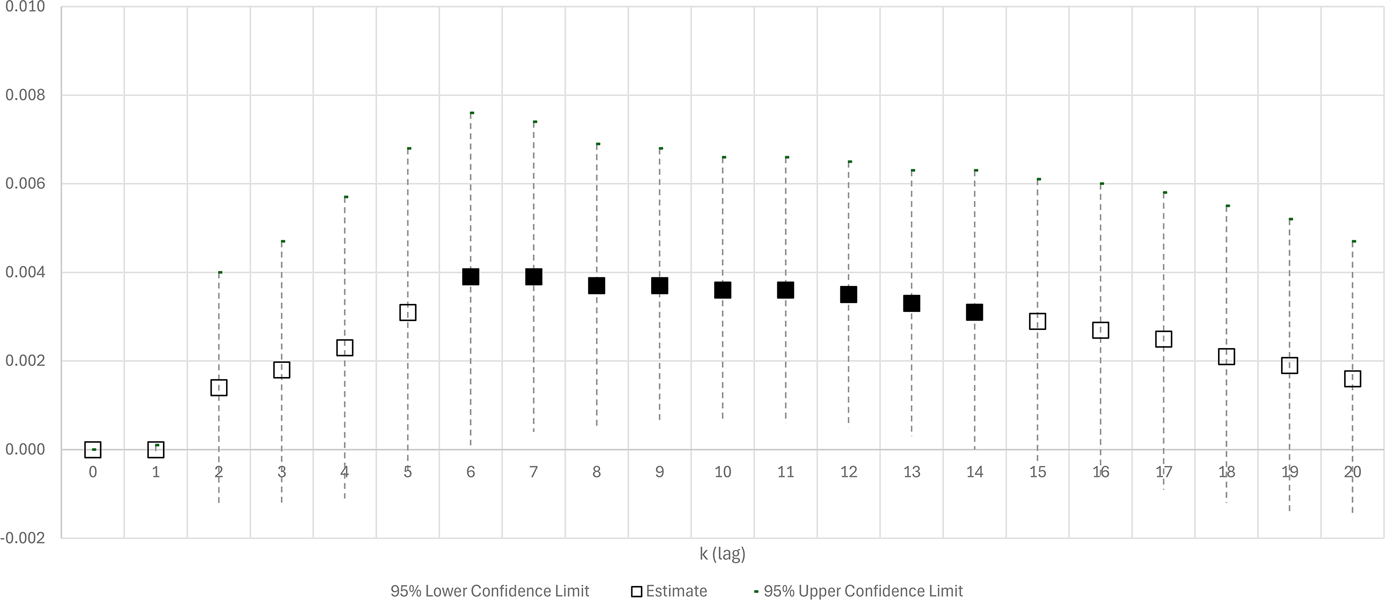
Estimates of ρk from equation (2) are shown in Table 2 and plotted in Fig. 2. Each estimate is from a separate regression. For k ⩽ 5, the estimates of ρk are not statistically significant: the number of prescriptions for a drug is not significantly related to the number of PubMed descriptors of the drug 0–5 years earlier. However, for 6 ⩽ k ⩽ 14, the estimates of ρk are positive and statistically significant: the number of prescriptions for a drug is significantly positively related to the number of PubMed descriptors of the drug 6–14 years earlier. It is most strongly related to the number of PubMed descriptors of the drug 10 years earlier. The point estimate of ρ 10 (0.0036) indicates that one additional descriptor of a drug is associated with 3,600 additional outpatient prescriptions for the drug 10 years later.
Estimates of ρk from equation (2), based on data on about 600 drugs: n_rxst = ρk n_descriptorss ,t−k + αs + δt + εst

Each estimate is from a separate regression.
Disturbances were clustered within drugs.
Estimates in bold are statistically significant (p-value < 0.05).
n_rxst = the estimated number (in millions) of US outpatient prescriptions for drug (chemical substance) s in year t (t = 1996, 1997, …, 2021).
n_descriptorss,t−k = the number of times the descriptor of drug s occurred in PubMed in year t − k (k = 0, 1, 2, …, 20).
Estimates of ρk from equation (2), based on data on about 600 drugs: n_rxst = ρk n_descriptorss,t−k + αs + δt + ɛst. Each estimate is from a separate regression. Disturbances were clustered within drugs. n_rxst = the estimated number (in millions) of US outpatient prescriptions for drug (chemical substance) s in year t (t = 1996, 1997, …, 2021). n_descriptorss,t−k = the number of times the descriptor of drug s occurred in PubMed in year t − k (k = 0, 1, 2, …, 20).

Considering this evidence, it would not be surprising if mortality from a disease is most strongly inversely related to the mean vintage of descriptors of articles about the disease years (e.g., 6–14 years) earlier.
As noted above, in addition to estimating equation (1) using data on mortality of the entire population, we will estimate equation (1) using data on mortality by race for two groups – whites and blacks – to explore whether biomedical innovation had different effects on the mortality of the two groups. Such disparities could occur because some groups may have greater access to innovations than other groups. Wang et al. (Reference Wang2006) found significant racial disparities in use of drugs approved within the previous 5 years. Data from the 2016–2021 Medical Expenditure Panel Survey Prescribed Medicines Files indicate that the mean FDA approval year of outpatient antineoplastic drugs taken by black Americans was over 4 years earlier than the mean FDA approval year of outpatient antineoplastic drugs taken by white Americans (1970.2 vs. 1974.4). Lichtenberg (Reference Lichtenberg2024) found that the approval of one additional drug for a cancer site 6–10 years earlier reduced the black female mortality rate 58% as much as it reduced the white female mortality rate.
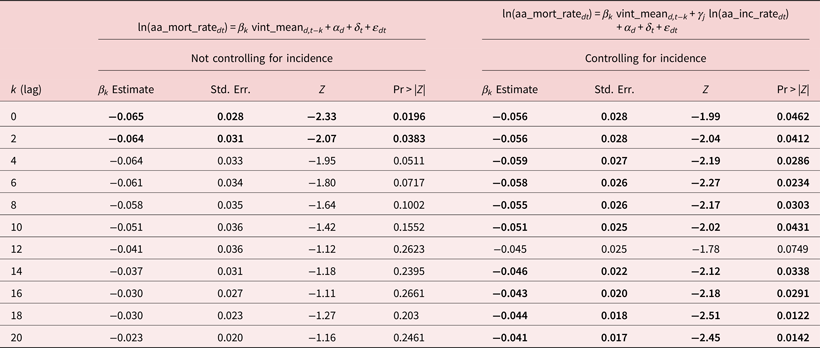
The change in mortality from a disease is likely to depend on the change in incidence of the disease as well as on biomedical innovation for the disease. The change in incidence might be correlated across diseases with biomedical innovation (the change in descriptor vintage).Footnote 12 Unfortunately, data on incidence, by disease and year, are not available for all diseases. However, annual 1975–2019 data on age-adjusted incidence ratesFootnote 13 (and on age-adjusted mortality rates), by disease and year, are available for an important subset of diseases: 43 types of cancer (e.g., breast, colon, lung). These data enable us to determine if and how controlling for incidence affects estimates of the effect of biomedical innovation on mortality.
First, we examined the “simple” relationship between incidence and mortality by estimating the following equation:

where

Equation (3) was estimated by weighted least squares, weighting by (∑t aa_mort_ratedt). Disturbances were clustered within cancer sites. The estimates are shown in Table 3. The growth in mortality is significantly positively correlated with the growth in incidence 0–8 years earlier; it is most strongly correlated with the contemporaneous growth in incidence. A 10% increase in the incidence rate in year t is associated with a 5.8% increase in the mortality rate in year t.
Estimates of γj from equation (3): ln(aa_mort_ratedt) = γj ln(aa_inc_rated ,t−j) + αd + δt + ɛdt

aa_mort_ratedt = the age-adjusted mortality rate from disease (cancer site) d in year t (t = 1975, 1976, …, 2019).
aa_inc_rated,t−j = the age-adjusted incidence rate of disease (cancer site) d in year t.
Each estimate is from a separate regression.
Equation (3) was estimated by weighted least squares, weighting by (∑t aa_mort_ratedt).
Disturbances were clustered within cancer sites.
Estimates in bold are statistically significant (p-value < 0.05).
Next, we examined the “simple” relationship between incidence and descriptor vintage by estimating the following equation:

Equation (4) was estimated by weighted least squares, weighting by n_descriptorsd,t = the total number of descriptors of articles about disease (cancer site) d in year t. Disturbances were clustered within cancer sites. The estimates are shown in Appendix Table 1. The change in mean descriptor vintage is not significantly related to either contemporaneous or lagged changes in incidence.
This suggests that controlling for incidence will not have a significant effect on estimates of the effect of biomedical innovation on mortality. This can be verified by estimating two versions of the following equation, one excluding and the other including ln(aa_inc_ratedt) as a regressor:Footnote 14

Equation (5) was estimated by weighted least squares, weighting by (∑t aa_mort_ratect). Disturbances were clustered within cancer sites. Estimates of both versions of equation (5) are shown in Table 4. When we don't control for incidence, the estimates of βk are negative and significant (p-value < 0.04) when k ⩽ 2, and negative and at least marginally significant (p-value < 0.08) when k ⩽ 6. When we control for incidence, the estimates of βk are negative and significant (p-value < 0.05) for all values of k but one. This suggests that failure to control for incidence will not result in overestimation of the effect of biomedical innovation on mortality.
Estimates of the effect of descriptor vintage on age-adjusted cancer mortality rate, not controlling and controlling for incidence

aa_mort_ratedt = the age-adjusted mortality rate from disease (cancer site) d in year t (t = 1975, 1976, …, 2019).
aa_inc_ratedt = the age-adjusted incidence rate of disease (cancer site) d in year t.
vint_meand,t−k = the mean vintage (year of first appearance in PubMed) of descriptors of articles about disease d published in year t − k (k = 0, 2, …, 20).
Each estimate is from a separate regression.
Equation (5) was estimated by weighted least squares, weighting by (∑t aa_mort_ratedt).
Disturbances were clustered within cancer sites.
Estimates in bold are statistically significant (p-value < 0.05).
4. Data sources and descriptive statistics
Mortality data (yll85dt, yll75dt, yll65dt) for all diseases were computed from 1999 to 2019 Multiple Cause-of-Death Mortality Data files posted on the NBER website (National Bureau of Economic Research, 2024).
Vintage data (vintage_measured,t−k, post1990%d,t−k) and other attributes of PubMed articles (n_descriptorss,t) were computed from the PubMed annual baseline files.
Prescription drug data. Estimates of the number of US outpatient prescriptions, by (Multum MediSource Lexicon) generic drug name and year (1996–2021) (n_rxst) were computed from Medical Expenditure Panel Survey Prescribed Medicines files (Agency for Healthcare Research and Quality, 2024).
Cancer incidence and mortality data (aa_mort_ratect, aa_inc_ratec,t−j) for 1975–2019 were obtained from Cancer Query Systems (National Cancer Institute, 2024b).
Mappings from MeSH descriptors to ICD10 codes and to Multum MediSource Lexicon generic drug names were computed from the Unified Medical Language System Concept Names and Sources (MRCONSO) File (National Library of Medicine, 2024e).
Mappings from ICD10 codes to SEER cancer site codes were obtained from the SEER Cause of Death Recode 1969+ (National Cancer Institute, 2024a).
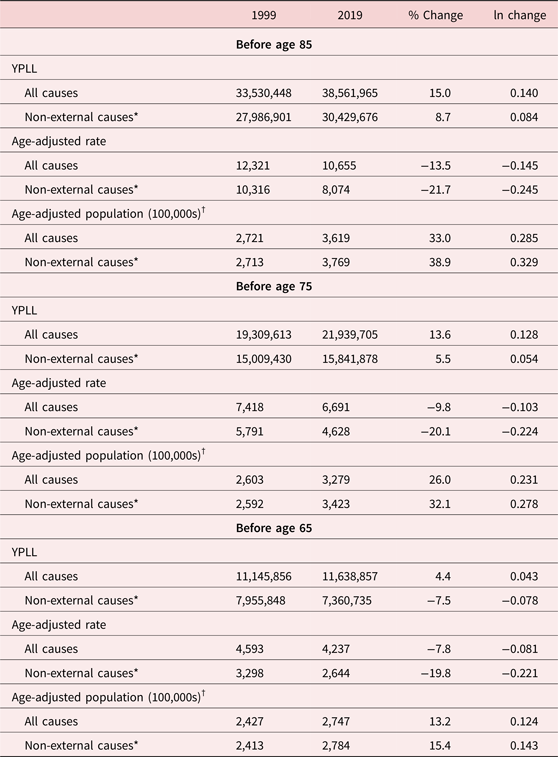
Descriptive statistics. Aggregate data on years of potential life lost before ages 85, 75, and 65 in 1999 and 2019 are shown in Table 5. Between 1999 and 2019, YPLL before age 85 (YPLL85) increased by 15.0%, from 33.5 million to 38.6 million. When deaths from three external causes (unintentional injury, suicide, and homicide) are excluded, YPLL85 increased by 8.7%, from 28.0 million to 30.4 million. During that period, the population below age 85 increased, so the age-adjusted YPLL85 rate declined by 13.5%; excluding deaths from three external causes, the YPLL85 rate declined by 21.7% – about 1% per year. Excluding deaths from the three external causes, the age-adjusted rates of years of potential life lost before ages 75 and 65 (YPLL75 and YPLL65, respectively) declined by similar amounts: 20.1% and 19.8%, respectively.
Years of potential life lost before ages 85, 75, and 65 in 1999 and 2019

* Deaths from unintentional injury, suicide, and homicide are excluded.
† Age-adjusted population = YPLL/age-adjusted rate.
Source: CDC, WISQARS Years of Potential Life Lost (YPLL) Report, 1981–2020, https://wisqars.cdc.gov/ypll
Table 5 also shows the “age-adjusted population below age 85” which we define as the ratio of YPLL85 to the age-adjusted YPLL85 rate. The age-adjusted population below age 85 increased by 33.0% (38.9% when deaths from three external causes are excluded).
Aggregate data on PubMed descriptor vintage during 1979–2019 are shown in Appendix Table 2. The data shown are weighted means across diseases; diseases are weighted by total YPLL75 during 1999–2019. From 1979 to 1999, vint_mean increased by 3.0 years, from 1943.1 to 1946.1. From 1999 to 2019, vint_mean increased by about half that much, by 1.4 years. From 1979 to 1999, post1990% increased from 0.0% to 0.9%. From 1999 to 2019, post1990% increased from 0.9% to 3.5%.
Appendix Table 3 shows the 20 most frequently occurring MeSH descriptors that first appeared in PubMed after 1990.
Appendix Table 4 shows data on mortality and descriptor attributes for the top 25 diseases, ranked by total ypll75 during 1999–2019.
5. Empirical results
Estimates of many versions of equation (1) are reported in Table 6 and plotted in Fig. 3. Each estimate is from a separate equation. On the left side of the table and figure are estimates when the vintage measure is vint_mean; on the right side are estimates when the vintage measure is post1990%. In the table, estimates in bold are statistically significant (p-value < 0.05). In the figure, solid squares denote statistically significant estimates, the large solid squares denote the most significant estimates, and hollow squares denote statistically insignificant estimates.
Estimates of βk from equation (1): ln(mortalitydt) = βk vintage_measured ,t−k + αd + δt + ɛdt

Each estimate is from a separate equation. Estimates in bold are statistically significant (p-value < 0.05).
Estimates of βk from equation (1): ln(mortalitydt) = βk vintage_measured ,t−k + αd + δt + εdt. (a) vint_mean ==> YPLL85. (b) post1990% ==> YPLL85. (c) vint_mean ==> YPLL75. (d) post1990% ==> YPLL75. (e) vint_mean ==> YPLL65. (f) post1990% ==> YPLL65. Each estimate is from a separate regression. Disturbances were clustered within diseases. Solid squares denote statistically significant estimates; the large solid squares denote the most significant estimates, and hollow squares denote statistically insignificant estimates.

Rows 1–11 of the table and panels A and B of the figure show estimates when the dependent variable is ln(YPLL85dt). When the vintage measure is vint_mean, the estimates are negative and statistically significant when 2 ⩽ k ⩽ 16: YPLL85 is significantly inversely related to the mean vintage of descriptors 2–16 years earlier. It is most strongly inversely related to the vintage of descriptors 6 years earlier. The point estimate of β 6 when the vintage measure is vint_mean (−0.086) implies that a one-year increase in vintage is associated with an 8.3% reduction in YPLL85 6 years later. Further implications of the magnitudes of the estimates will be discussed in the next section. When the vintage measure is post1990%, the estimates are negative and statistically significant when 0 ⩽ k ⩽ 8: YPLL85 is significantly inversely related to the fraction of post-1990 descriptors 0–8 years earlier. It is most strongly inversely related to the vintage of descriptors 2–4 years earlier.
Rows 12–22 of the table and panels C and D of the figure show estimates when the dependent variable is ln(YPLL75dt). When the vintage measure is vint_mean, the estimates are negative and statistically significant when 2 ⩽ k ⩽ 16: YPLL75 is significantly inversely related to the mean vintage of descriptors 2–16 years earlier. It is most strongly inversely related to the vintage of descriptors 12 years earlier. When the vintage measure is post1990%, the estimates are negative and statistically significant when 0 ⩽ k ⩽ 20: YPLL75 is significantly inversely related to the fraction of post-1990 descriptors 0–20 years earlier. It is most strongly inversely related to the vintage of descriptors 4 years earlier.
Rows 23–33 of the table and panels E and F of the figure show estimates when the dependent variable is ln(YPLL65dt). When the vintage measure is vint_mean, the estimates are negative and statistically significant when 6 ⩽ k ⩽ 16: YPLL65 is significantly inversely related to the mean vintage of descriptors 6–16 years earlier. It is most strongly inversely related to the vintage of descriptors 12 years earlier. When the vintage measure is post1990%, the estimates are negative and statistically significant when 0 ⩽ k ⩽ 20: YPLL65 is significantly inversely related to the fraction of post-1990 descriptors 0–20 years earlier. It is most strongly inversely related to the vintage of descriptors 14 years earlier.
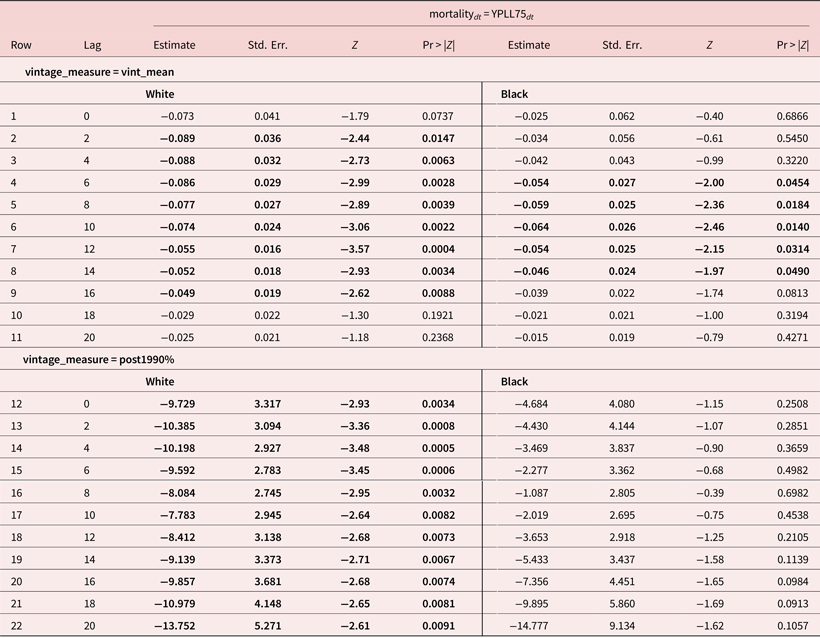
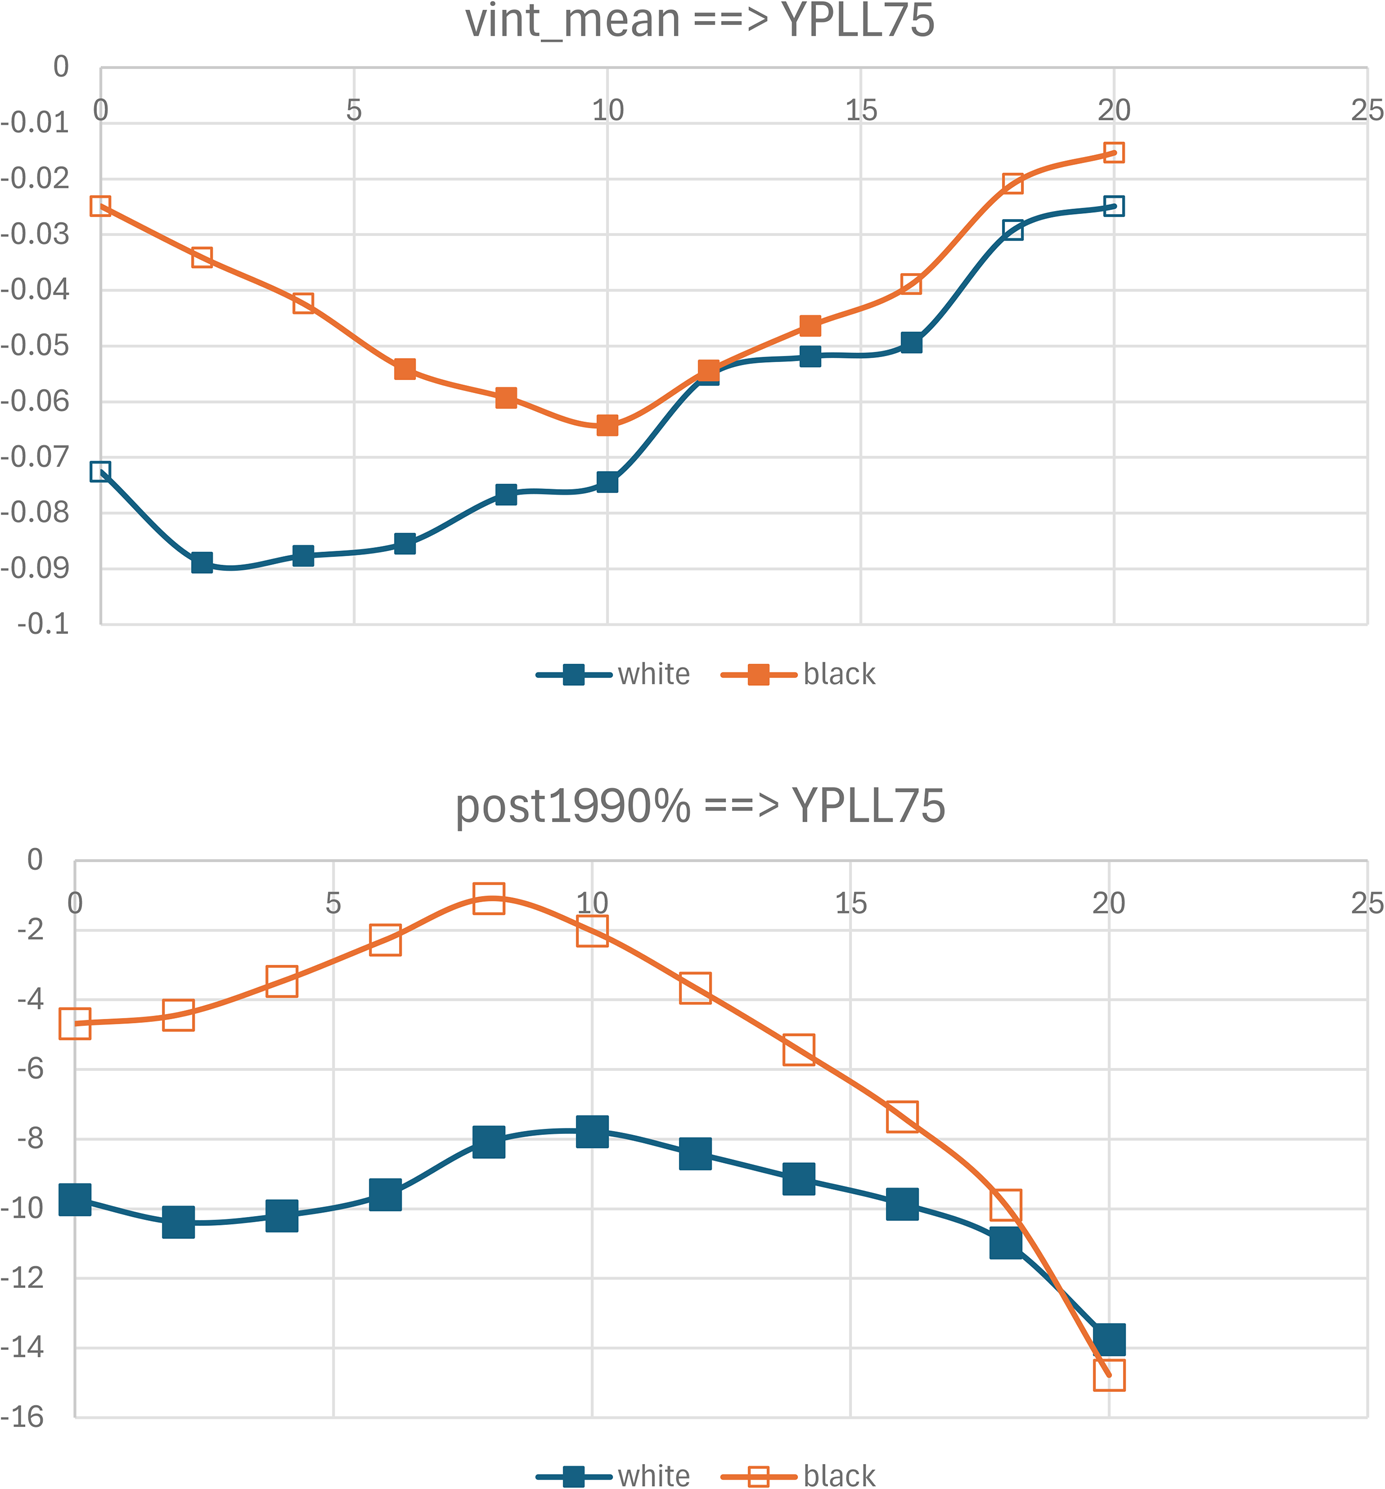
As discussed above, to explore whether biomedical innovation had different effects on the mortality of whites and blacks, equation (1) can be estimated using race-specific mortality data. (The same descriptor vintage data are used to estimate the white and black mortality equations.) Estimates of equation (1) when mortalitydt = YPLL75dt, by race, are shown in Table 7 and plotted in Fig. 4. In rows 1–11 of the table, the vintage measure is vint_mean. The estimates of βk from the white mortality equation are negative and statistically significant when 2 ⩽ k ⩽ 16: YPLL75 of whites is significantly inversely related to the mean vintage of descriptors 2–16 years earlier. It is most strongly inversely related to the vintage of descriptors 12 years earlier. The estimates of βk from the black mortality equation are negative and statistically significant when 6 ⩽ k ⩽ 14: YPLL75 of blacks is significantly inversely related to the mean vintage of descriptors 6–14 years earlier. It is most strongly inversely related to the vintage of descriptors 12 years earlier.
Estimates of βk from equation (1): ln(mortalitydt) = βk vintage_measured ,t−k + αd + δt + ɛdt, by race

YPLL75dt = the number of years of potential life lost before age 75 due to disease d in year t (t = 1999, 2000, …, 2019).
vint_meand,t−k = the mean vintage (year of first appearance in PubMed) of descriptors of articles about disease d published in year t − k (k = 0, 2, …, 20).
Each estimate is from a separate regression.
Equation (1) was estimated by weighted least squares, weighting by (∑t YPLL75dt).
Disturbances were clustered within diseases.
Estimates in bold are statistically significant (p-value < 0.05).
Estimates of βk from equation (1): ln(mortalitydt) = βk vintage_measured ,t−k + αd + δt + ɛdt, by race.

In rows 12–22 of the table, the vintage measure is post1990%. All 11 estimates of βk from the white mortality equation are negative and statistically significant. None of the 11 estimates of βk from the black mortality equation are statistically significant. These estimates indicate that biomedical innovation reduced the mortality of white people sooner than it reduced the mortality of black people, and that the mortality of black people was not reduced by the most recent innovations.
6. Discussion
Estimates of two versions of equation (1) – including and excluding vintage_measured,t−k as a regressor – enable us to estimate how much biomedical innovation reduced age-adjusted mortality rates during the period 1999–2019. When vintage_measured,t−k is included in equation (1), δ 2019 is an estimate of the 1999–2019 change in mortality, holding constant vintage_measured,t−k, i.e., in the absence of biomedical innovation. (δ 1999 is normalized to zero.) When vintage_measured,t−k is excluded from equation (1), δ 2019 is an estimate of the 1999–2019 change in mortality in the presence of biomedical innovation. Changes in age-adjusted mortality rates can be computed by subtracting the corresponding log-change in age-adjusted population shown in Table 5 (e.g., 0.329 for the population below age 85) from the δ 2019 estimates.
These calculations are shown for each of the three mortality measures and both of the vintage measures in Fig. 5. In each case, we use the lag for which the relationship is most significant. Panel A shows estimates of the growth in the age-adjusted YPLL85 rate in the presence and absence of the change in vint_mean 6 years earlier. The growth (log-change) in the presence of biomedical innovation is −0.20 and is significantly different from zero. The growth in the absence of biomedical innovation is 0.02 and is not significantly different from zero. We cannot reject the null hypothesis that in the absence of biomedical innovation, as measured by the lagged change in vint_mean, the age-adjusted YPLL85 rate would not have declined during the period 1999–2019. The estimates for the other mortality and vintage measures are quite similar. The growth (ln change) in the presence of biomedical innovation is −0.19 to −0.16 and is significantly different from zero; the growth in the absence of biomedical innovation is not significantly different from zero.
Estimated 1999–2019 changes in age-adjusted mortality rates from all diseases in the presence and absence of biomedical innovation. (a) vint_meand,t −6 ==> ypll85dt. (b) post1990%d,t −6 ==> ypll85dt. (c) vint_meand,t −12 ==> ypll75. (d) post1990%d,t −4 ==> ypll75dt. (e) vint_meand,t −12 ==> ypll65dt. (f) post1990%d,t −14 ==> ypll65dt.

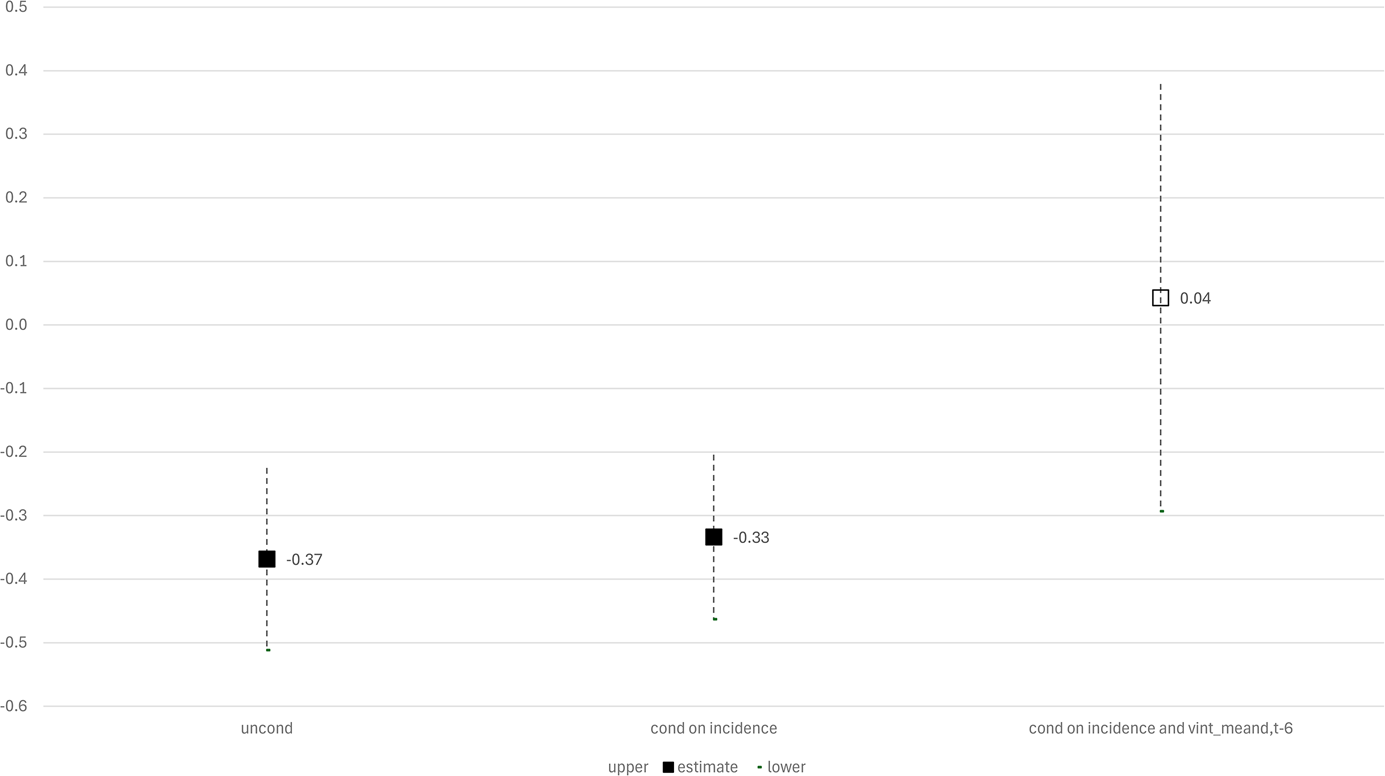
Similarly, by estimating three versions of equation (5), we can estimate how much biomedical innovation and changes in cancer incidence reduced the age-adjusted cancer mortality rate during the period 1975–2019. Those calculations are shown in Fig. 6. In the presence of changes in cancer incidence and biomedical innovation, the log-change in the age-adjusted cancer mortality rate was −0.37. Only a small part of that decline was due to the decline in cancer incidence: controlling only for cancer incidence, the estimated log-change in the age-adjusted cancer mortality rate was −0.33, and is significantly different from zero. But when we control for vint_meand,t −6 as well as for ln(aa_inc_ratedt), the estimated log-change in the age-adjusted cancer mortality rate was 0.04, and is not significantly different from zero.
Estimated 1975–2019 change in age-adjusted cancer mortality rate in the presence and absence of changes in cancer incidence and biomedical innovation.

From 1999 to 2019, age-adjusted mortality rates (excluding deaths from unintentional injury, suicide, and homicide) declined by approximately 20% – about 1% per year. Our estimates imply that, in the absence of biomedical innovation, age-adjusted mortality rates would not have declined. Some factors other than biomedical innovation probably contributed to the decline in mortality. The adult cigarette smoking rate declined from 23.5% in 1999 to 13.7% in 2018 (American Lung Association, 2024). The fraction of adults who had at least a bachelor's degree increased from 23.9% in 1997 to 34.2% in 2017 (American Council on Eduction, 2024). However, other factors probably contributed to an increase in mortality. From 1999–2000 through 2017–March 2020, US obesity prevalence increased from 30.5% to 41.9%, and the prevalence of severe obesity increased from 4.7% to 9.2%. Obesity-related conditions include heart disease, stroke, type 2 diabetes, and certain types of cancer. These are among the leading causes of preventable, premature death (Centers for Disease Control, 2024a, 2024b). And between 2007 and 2018, the prevalence of 14 out of 21 chronic conditions among male Medicare beneficiaries increased, and the prevalence of 16 out of 21 chronic conditions among female beneficiaries increased (Center for Medicare and Medicaid Services, 2024).
7. Summary
We investigated econometrically the overall impact that biomedical innovation had on premature mortality in the US during the period 1999–2019. We used a difference-in-differences research design: we investigated whether the diseases for which there was more biomedical innovation had larger reductions in premature mortality. Biomedical innovation related to a disease was measured by the change in the mean vintage of descriptors of PubMed articles about the disease. We analyzed data on 286 million descriptors of 27 million articles about over 800 diseases.
Our estimates indicated that premature mortality from a disease is significantly inversely related to the lagged vintage of descriptors of articles about the disease. For example, the number of years of potential life lost before age 75 due to a disease is significantly inversely related to the mean vintage of descriptors 2–16 years earlier; it is most strongly inversely related to the vintage of descriptors 12 years earlier. This lag is not surprising: we showed that the number of prescriptions for a drug is significantly positively related to the number of PubMed descriptors of the drug 6–14 years earlier. It is most strongly related to the number of PubMed descriptors of the drug 10 years earlier.
To explore whether biomedical innovation had different effects on the mortality of whites and blacks, we also estimated models using race-specific mortality data. Our estimates indicated that biomedical innovation reduced the mortality of white people sooner than it reduced the mortality of black people, and that the mortality of black people was not reduced by the most recent innovations.
From 1999 to 2019, the age-adjusted mortality rate (excluding deaths from unintentional injury, suicide, and homicide) from all diseases declined by approximately 20% – about 1% per year. Our estimates implied that, in the absence of biomedical innovation, age-adjusted mortality rates would not have declined. Also, from 1975 to 2019, the age-adjusted cancer mortality rate declined by approximately 27%. Our estimates also implied that, in the absence of biomedical innovation, the age-adjusted cancer mortality rate would not have declined. Some factors other than biomedical innovation (e.g., a decline in the smoking rate and an increase in educational attainment) probably contributed to the decline in mortality. But other factors (e.g., a rise in obesity and the prevalence of chronic conditions) undoubtedly contributed to an increase in mortality.
Our estimates do not capture cross-disease spillover effects: the potential effects of biomedical innovation for one disease on mortality from other diseases. Although some spillover effects are adverse, others are positive.
Supplementary material
The supplementary material for this article can be found at https://doi.org/10.1017/dem.2024.27.
Data
All data used in this research are publicly available.
Funding statement
The authors did not receive any financial support for this research.
Competing interests
The authors do not have any conflicts of interest.
Ethical standards
Ethical approval was not required.


 Open access