Introduction
There is public concern that warmer climates in the future may cause increased melting of glaciers which will lead to a rise in world sea level (Reference Warrick, Oerlemans, Houghton, Jenkins and EphraumsWarrick and Oerlemans, 1990). Warmer climates will certainly give increased melting at the margin of the Greenland ice sheet, and an immediate increase in run-off to the ocean (Reference Braithwaite and OlesenBraithwaite and Olesen, 1990; Reference Huybrechts, Letréguilly and ReehHuybrechts and others, 1991).
In the lower accumulation area of the Greenland ice sheet, air temperatures are presently high enough in summer for melting to occur, but snow temperatures are low enough for meltwater to refreeze, so there is no runoff to the ocean. The lower boundary of the zone where all meltwater is refrozen is the run-off limit (Reference KasserKasser, 1959), and there is run-off from the lowest part of the accumulation area between the run-off limit and the equilibrium line. The refreezing of meltwater is a key process affecting Greenland’s contribution to sea-level change (Polar Research Board, 1985). In a warmer climate, any extra meltwater generated above the present run-off limit will initially be refrozen and will not run off to the ocean. However, the refreezing process will eventually create an impermeable surface so that meltwater will then run off to the ocean and cause a rise in sea level (Reference Pfeffer, Meier and IllangasekarePfeffer and others, 1991), i.e. the run-off limit will rise as a delayed response to climate warming.
In the present paper, we examine the variations of firn density in the lower part of the accumulation area of the Greenland ice sheet, and interpret them in terms of melting and refreezing. The main data are firn densities determined in May 1992 at Pâkitsoq, West Greenland (Fig. 1), as a follow up to field work in 1991 (Reference Braithwaite, Pfeffer, Blatter and HumphreyBraithwaite and others, 1992b), which strongly suggested that the firn-ice transition is a key process determining the extent of refreezing.
Field area at Pâkitsoq, West Greenland.

Background and Setting
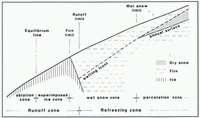
The concept of different zones in the accumulation area is implicit for the present study. For convenience, the terminology used in this paper is illustrated in Figure 2, based on Reference BensonBenson (1959) and Reference MüllerMüller (1962), via Reference Paterson,Paterson (1981, p. 6-9). The zones of percolation, wet snow and superimposed ice appear to be almost the same as the recrystallization-infiltration, cold-infiltration and infiltration-congelation zones of Reference ShumskiiShumskii (1964, p. 410-20, 427-31). The relative locations of run-off limit and firn limit are discussed later in this paper.
Zones in the accumulation area. Based on Reference BensonBenson (1959) and Reference MüllerMüller (1962), via Reference Paterson,Paterson (1981, p. 7).

The lower accumulation area above Pâkitsoq, east of Ilulissat (Fig. 1), was chosen as the study area, because (1) it is easily reached by helicopter from Ilulissat, (2) data are available from the nearby ablation area since 1982 (Reference Thomsen, Olesen, Braithwaite and WeidickThomsen and others, 1989), and (3) the nearby “Swiss Camp′ (Reference OhmuraOhmura and others, 1991, Reference Ohmura1992) could be used as a logistics staging post and as a source of climate data.
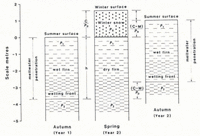
A line of ten accumulation stakes (Fig. 3) was established with helicopter support in 1990 and 1991, and thermistor strings were emplaced to a depth of 10 m at six stakes. The stakes are 6 m aluminium tubes drilled 2-3 m deep into the ice-sheet surface and marked with black flags. The profile extends from the equilibrium line to well within the accumulation area.
Sketch map of the study area at Pâkitsoq, with stake locations and surface hydrological features.

Three-dimensional stake positions were measured at various times (August 1991, May 1992 and August 1992) with a hand-held receiver for the Global Positioning System (GPS), which was also invaluable for refinding the stakes. Stake elevations are shown in Table 1. The elevations (actually 30 point averages) replicate them-selves with a standard deviation of ± 23 m, although there may also be a large systematic error in elevations due to the poorly known relation between ellipsoid and geoid in this area. The hydrological features shown in Table 1 and Figure 3, i.e. lakes, rivers and slush fields, and dangerous crevasses, are those which were clearly visible in August 1990 but have been obscured by snow since then.
Elevations of stakes and surface features in the study area, Pâkitsoq, West Greenland

The following summary of glaciological conditions is based on field work in 1991 (Reference Braithwaite, Pfeffer, Blatter and HumphreyBraithwaite and others, 1992b). The equilibrium line is not well defined but lies in a zone at around 1200 m a.s.l. near the Swiss Camp and stake 122. Both the firn limit and run-off limit are between stakes 141 and 151, i.e. at about 1400 m a.s.l., apparently coinciding with the upper limit of visible surface features like crevasses and slush fields, in agreement with Reference HolmesHolmes (1955). The annual accumulation at the upper stakes, i.e. 151-165, is about 500600 kg m−2, which is somewhat larger than found by Reference Echelmeyer, Harrison, Clarke and BensonEchelmeyer and others (1992) on Jakobshavns Isbne just to the south of the present field area. The temperatures at 10 m below the surface range from −9.9°C at stake 157 to −12.5°C at stake 165. The depth of meltwater penetration into the firn in late summer is between 2 and 4 m, according to temperature profiles at stakes 157 and 163 (Reference BraithwaiteBraithwaite, 1993). This shows that meltwater at the higher stakes 151-165 penetrates into the snow accumulation of previous years and refreezes, i.e. the sites belong to the wet-snow zone (Fig. 2) or cold-infiltration zone of (Reference ShumskiiShumskii 1964, p. 411-20). The upper boundary of the wet-snow zone, i.e. the wet-snow limit, was observed at about 1800 m a.s.l. on a traverse to the east of the study area in August 1991 (Reference Braithwaite, Pfeffer, Blatter and HumphreyBraithwaite and others, 1992b). By comparison, Reference Echelmeyer, Harrison, Clarke and BensonEchelmeyer and others (1992) placed the wet-snow limit on Jakobshavns Isbræ at only 1500 m a.s.l., but this was based on firn temperatures measured in 1986, which was a relatively cool summer.
Data Collection
Snow pits were dug in the 1991-92 winter snow at stakes 151-165, and snow samples were taken throughout the winter snowpack. Firn samples were also taken below the 1991 summer surface by SIPRE coring to depths of nearly 10 m at stakes 157 and 163, and to depths of nearly 5 m at the other three sites. Sample densities were taken and the thicknesses of any ice layers were also measured, although their recognition is quite subjective, and could have been improved by photographing cores over a light-table as done by Reference KoernerKoerner (1977). Samples from the SIPRE corer were sometimes badly broken and an “effective” sample length had to be estimated for the density calculation. By comparing borehole depths and cumulated sample lengths, sample depths can be determined with an accuracy of about 5-10%.
Results
Density values were obtained for a total of 221 samples taken by SIPRE coring from below the 1991 summer surface at the five stakes. The samples can be divided conveniently into those containing no ice layers (“firn” samples), those consisting solely of ice (“ice” samples) and the remainder with ice layers (“firn”/“ice” samples). Additionally, 15 samples were taken from the 1991-92 winter snow (“snow” samples).
The mean densities of the different sample types are compared in Table 2. Despite a considerable scatter around the mean values, there is a clear agreement in the densities of the different kinds of samples at the different sites.
Densities of “snow”, “firn” and “ice” samples measured in May 1992 at Pâkitsoq, West Greenland. Units are in kg m-3

The “snow” densities refer to well-packed settled snow without obvious ice layers, underlain by a 5-10 cm layer of well-developed depth-hoar crystals. There were also thin layers of depth hoar within the snowpack.
Densities of “fim” and “ice” samples at Pâkitsoq are compared in Table 3 with those at Nordbogletscher, south Greenland, collected by Reference Braithwaite, Clement and ClausenBraithwaite and others (1982). The density differences between the two sites are not statistically significant at the 95% level. The “ice” densities here are higher than the values of 817 and 830 kg m−3 assumed by Reference Pfeffer, Meier and IllangasekarePfeffer and others (1991) and Reference OzawaOzawa (1991), respectively. However, their densities refer to the pore close-off density that is appropriate for compressive densification of dry snow but probably has no special significance for densification by melting and refreezing. For example, air can escape from wet firn before it refreezes to form ice with a relatively high density, i.e. “infiltration ice” (Reference ShumskiiShumskii, 1964, p. 299). We, therefore, follow Reference Wakahama, Kuroiwa, Hasemi and BensonWakahama and others (1976) in using a higher “ice” density of 890 kg m−3 which is well within the error bounds of the present data (Table 3).
Densities of “firn” and “ice” samples at Nordbogletscher, South Greenland, and Pâkitsoq, West Greenland. Units are in kg m-3

Simple Refreezing Model
In cold snow or firn, as in the accumulation area of the Greenland ice sheet, meltwater infiltrates cold snow in the early summer and raises the temperature to 0°C by refreezing and latent-heat release. Further water percolates deeper into the snow cover when the residual water content is exceeded, or runs off if it meets an impermeable surface at the melting point. Any water remaining within the snow refreezes into ice at the end of the summer. These processes involve a complex interplay of hydraulics and heat transfer which is difficult to model, e.g. Reference ColbeckColbeck (1976) and Reference Illangasekare, Walter, Meier and PfefferIllangasekare and others (1990). A simpler approach has been used by Reference Pfeffer, Meier and IllangasekarePfeffer and others (1991), which does not describe detailed physical processes but generates plausible ideas about the effect of refreezing on Greenland’s contribution to sea-level rise under a warmer climate.
The snow density ρ increases by Δρ when the latent heat released by freezing warms the snow by ΔT to the melting point 0°C. For a unit thickness of snow, the latent-heat release is LΔT and the snow warming is cρΔT (Reference ShumskiiShumskii, 1964, p. 287), where L and c are respectively the specific latent heat of fusion and the specific heat capacity of ice. The relative change in density is:
where c = 2009 J kg−1 C−1 and L = 335 kJ kg−2 (Reference Paterson,Paterson, 1981, p. 186). For a typical change in snow temperature of + 15°C (Reference BraithwaiteBraithwaite, 1993) in the Pâkitsoq profile in early summer, the density increases by 9% due to refreezing of meltwater. By comparison, the amount of meltwater refrozen after the melting season is uncertain; Reference ShumskiiShumskii (1964, p. 288) stated that it is negligible compared with refreezing densification, while Reference BazhevBazhev (1973) and Reference Trabant and MayoTrabant and Mayo (1985) said that it is significant.
Reference Pfeffer, Meier and IllangasekarePfeffer and others (1991) estimated the melting at the run-off limit, in terms of snow temperature and two density parameters: the initial density of the snow before melting and the pore close-off density. Simple refreezing schemes have also been used by Reference AmbachAmbach (1985), Reference Braithwaite and ThomsenBraithwaite and Thomsen (1989), Reference Huybrechts, Letréguilly and ReehHuybrechts and others (1991) and Reference OzawaOzawa (1991), and a similar approach is taken below where an estimate of density changes in the wet-snow zone is made using a simple “mixing” model (Fig. 4).
Principles of the simple refreezing model. Elevations are measured in local coordinates.

A surface layer of fim is wetted during the summer (year 1) by meltwater which reaches to a maximum depth of h in the autumn (year 1). In the wet-snow zone, this wetted surface layer includes firn from several years but annual layers are not distinct because meltwater alters the original stratigraphy. Below this surface wetted layer, the firn remains dry but it has itself passed through the wetted layer in previous years. The density at the bottom of the wetted layer is ρ2 and further densification of this firn can only occur at greater depths by compression (assumed to be much slower than infiltration densification). The wet firn freezes in the winter (between year 1 and year 2) and an accumulation C of new snow, of thickness h 0 and density ρ 0 is added to the firn in spring (year 2). Melting M at the surface of the new snow in summer (year 2) and refreezing of the meltwater results in a new surface layer of wet firn in the autumn (year 2). For a steady state, this new firn layer in the autumn of year 2 has the same thickness h and same density gradient p 1-ρ 2 as the surface firn layer in the autumn of year 1. The ice-sheet surface rises by h0 = C/p0 in local coordinates, i.e. as measured against an accumulation stake, due to snow accumulation C, and then falls again by M/ρ 0 due to melting M at the surface. The net change of surface elevation (in local coordinates) from autumn to autumn is then (C-M)/ρ 0 and the bottom of the wetted layer, i.e. where the density becomes ρ 2, rises by the same amount that represents the thickness of an annual layer.
As there is no run-off, and neglecting density variations below the wetted layer, the net result of an annual cycle of accumulation, melting and refreezing is to add a new firn layer, of density ρ 2 and thickness (C-M)/ρ 0 to the ice-sheet surface. From conservation of mass, the material in this layer must be equal to the snow accumulation:

With some re-arrangement, the density of firn just below the wetted layer is:
Alternatively, the melting M/C required to achieve the density ρ 2 is:
which is given by (Reference ShumskiiShumskii 1964, p. 416). The density ρ 0 increases with the melt M in agreement with (Reference BensonBenson 1959, p. 35).
The density within the wetted layer increases with depth because firn at the top, with density ρ 1 has only experienced one melting/refreezing event compared with deeper firn which may have experienced several events before being buried too deep for further wetting (Reference OzawaOzawa, 1991, Fig. 8). In particular, an annual layer of accumulation loses mass in its first year due to melting at the surface, and then gains mass in subsequent years due to refreezing of meltwater from the surface snow.
The upper boundary of the wet-snow zone is the wet-snow limit. At the wet-snow limit, the wetting front only penetrates through the annual accumulation and there is only one cycle of melting and refreezing. The change in density between ρ 0 and ρ 2 is then given by Equation (1). For a typical firn-temperature change ∂T = +15°C and ρ 0 = 375 kg m−3, according to Table 2, the density ρ 0 = 408 kg m−3. Substitution of this range into Equation (4) gives a melt/accumulation ratio M/C of 0.09 at the wet-snow limit.
Equation (4) can also be applied to the run-off limit. Here, the whole surface layer of firn is completely wetted by the end of the summer and the underlying material is impermeable to meltwater, i.e. the wetting front reaches ice as shown in Figure 2. This is necessary for any extra increment of meltwater to contribute to run-off. In this case, the density ρ 2 refers to impermeable ice. The run-off limit defined in this way need not coincide exactly with the firn limit, as there can be some run-off from within the firm area, according to Reference LaChapelleLaChapelle (1955), but we suggest the wet firn layer must be fairly shallow for run-off to occur, i.e. not thicker than the few metres of annual meltwater penetration. This is why Figure 2 is drawn with the run-off limit higher than the firn limit, although the relative distance between them is greatly exaggerated. By comparison, the Polar Research Board (1985, p. 8) said “runoff possible” for the whole wet-snow zone, while Reference Trabant and MayoTrabant and Mayo (1985, Fig. 3) placed the run-off limit within the wet-snow zone at the location with “maximum wetted depth”. The latter seems more correct according to the present study.
Using snow and ice densities of 375 and 890 kg m−3 which are indicated by the field data (Table 2), the ratio M/C is 0.58 at the run-off limit. This is somewhat lower than 0.7 given by Reference Pfeffer, Meier and IllangasekarePfeffer and others (1991), but part of the difference is due to the lower snow and ice densities used by Reference Pfeffer, Meier and IllangasekarePfeffer and others (1991), and substitution of our higher densities into their formula reduces M/C at the run-off limit to 0.62 by their formula which is only slightly larger than our figure of 0.58. In this connection, it is noteworthy that Reference Huybrechts, Letréguilly and ReehHuybrechts and others (1991) assumed that run-off only occurs when melt is 0.6 times accumulation, although they did not explain why.
Reference ShumskiiShumskii (1964, p. 416) gave a similar equation to Equation (4) but assumed a higher snow density and a lower ice density, so that his melt/accumulation ratio is only 0.4 at the lower boundary of his cold-infiltration zone, which corresponds to the wet-snow zone here. Reference OzawaOzawa (1991) similarly used a higher snow density and lower ice density than indicated by Table 2. The correct choice of snow and ice densities for relations like Equation (4) is therefore not completely straightforward.
Effect of Ice Content
From the discussion of the simple refreezing model, the density of samples should depend upon the amount of melting and refreezing and, in fact, the density of “firn”/ “ice” samples is obviously controlled by the amount of ice in the sample. This is illustrated by the high correlation between sample density and percentage of ice shown in Figure 5 for stakes 157 and 163, where samples were taken to a depth of 10 m. It is also shown by the regression equations for all five sites in Table 4. The correlation coefficients are significant at greater than 5% probability and the regression models for the different sites are very similar.
Regression models of sample density versus ice content measured in May 1992 at Pâkitsoq, West Greenland

Sample density versus percentage of ice.

The regression model linking density to ice content can be explained by a simple mixing model, i.e. using mixtures of “firn” and “ice” with the densities given in Table 2. For example, the mean slope of the regression equation (385 kg m−3) agrees well with the difference between “ice” and “firn” densities, i.e. 891-510 = 381 kg m−3.
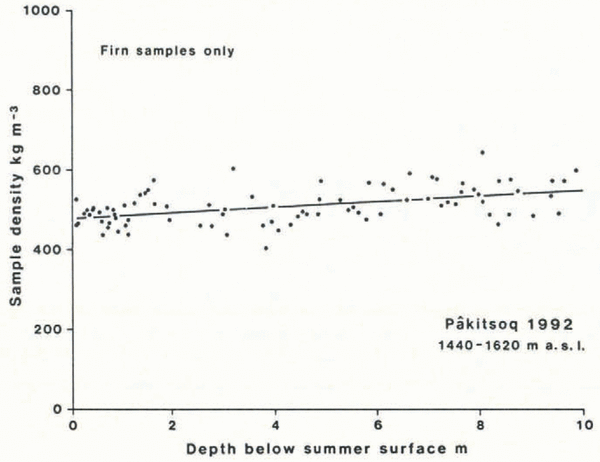
Density should also increase with depth due to compression (Reference BaderBader, 1954; Reference Anderson, Benson and KingeryAnderson and Benson, 1963; Reference Herron and LangwayHerron and Langway, 1980) but this effect is probably obscured in the full data set by the high correlation between density and ice content. The effect of the latter can be excluded by only considering “fim” samples and, in fact, there is a slight increase of “firn” density with depth (Fig. 6), although the main control on near-surface firn density in the field area is ice content, and thereby meltwater refreezing. This is in contrast to the lesser effect of refreezing on firn-density variations for temperate glaciers (Reference Trabant and MayoTrabant and Mayo, 1985; Reference Ambach, Eisner, Meyer and SchneiderAmbach and others, 1986).
Density versus depth for pure firn samples.

The present discussion relates to the relative amount of ice in the firn and not to the thickness or frequency of ice layers, which may be controlled by more subtle factors. For example, Reference KoernerKoerner (1970) said the frequency of ice layers depends upon the timing of melt events relative to the general warming of the snow cover.
The occurrence of a thick firn layer, i.e. greater than 10 m, so close to the firn limit is one of the surprising findings of the present study. However, the relation between firn density /¾ and the melt/accumulation ratio M/C is non-linear according to Equation (3), such that large density gradients can be expected close to the runoff limit.
Effect of Altitude
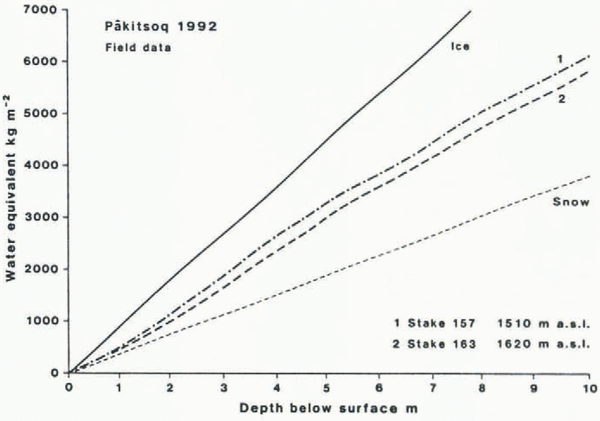
The variation of near-surface firn density with altitude is illustrated by plotting cumulative water equivalent at the different stakes against depth below summer surface (Fig. 7). Such curves have been termed depth-load curves by (Reference BensonBenson 1959, Reference Benson1962) and their slopes represent densities. The lines for “ice” and “snow”, using densities of 375 and 890 kg m−3, respectively, are given as guidelines because all depth-load curves should lie somewhere between them.
Water equivalent versus depth for five 5 m cores.

The fluctuations in local slopes of the depth-load curves (Fig. 7) show little agreement. This is consistent with the fact that ice-layer stratigraphy seldom agrees exactly even between cores taken very close to each other, and mainly reflects the sporadic and discontinuous nature of melt features (Reference KoernerKoerner, 1977). Densities at each site fluctuate greatly in the first few metres but achieve a maximum at depths of 3-4 m below the summer surface. If this is interpreted as the density gradient p 1-ρ 2 in the simple refreezing model (Fig. 4), the depth of 3-4 m represents the depth of meltwater penetration which is in fair agreement with the 2-4 m based on firn-temperature measurements (Reference Braithwaite, Pfeffer, Blatter and HumphreyBraithwaite and others, 1992b).
Mean densities at a depth of 3-i m are shown in Table 5 together with the estimated melt rate M/C from Equation (3). There is a general decrease of density with elevation which is also shown by the monotonic spread of the curves in Figure 7. In view of the close correlation between density and ice content, this suggests a decrease of ice content with elevation similar to that found by Reference KoernerKoerner (1970) on the Devon Island ice cap. The decrease of M/C with increasing elevation is consistent with the suggestion that M/C = 0.6 represents a minimum condition at the run-off limit.
Mean densities and estimated melting MIC for different depths below summer surface at five stakes, May 1992, Pâkitsoq, West Greenland

Stake 151 is relatively close to the estimated elevation of the run-off limit, i.e. at about 1400 m a.s.l., and the density at 3-4 m is close to the density of “ice” according to Table 2. For annual accumulation, C = 500-600 kg m−2, the estimated annual melt M is about 200-300 kg m−2 between stakes 151 and 165. This agrees with 200 kg m−2 obtained by crude mass-balance measurements (Reference Braithwaite and ThomsenBraithwaite and others, 1992b). The annual melt gradient is therefore about −50 kg m−2 per 100 m elevation, which is an order of magnitude less than melt gradients in the ablation area.
Effect of Climate
The variation of firn density with greater depth is illustrated by plotting cumulative water equivalent versus depth for the two 10 m cores (Fig. 8). Within limits, the fluctuating gradients of the curves describe density variations with time because depth reflects age. For example, at stake 157, a depth of 10 m corresponds to 10-12 years of record (annual accumulation 500-600 kg m−2).
Water equivalent versus depth for two 10 m cores.

A rapid density increase is clearly visible down to 3-4 m (mid-1980s) as already mentioned, but the density then again becomes smaller rather than increasing slowly due to compression. For example, average densities at depths of 4-10 m (mid-1980s-late 1970s) are much lower than in the first 4 m (Table 5). There is no plausible steady-state model which behaves in this way and it is most likely that the steady-state assumption is wrong, e.g. densities below about 4 m are lower because there was less melting and/or higher accumulation a few years ago when this firn was passing through the wetted layer.
Data for the melt/accumulation parameter M/C are not directly available to test the above. However, temperature and precipitation data can be used as proxy variables for melt and accumulation, respectively. The short-term fluctuations of climate are therefore illustrated by the variations of a temperature/precipitation index over the past 31 years (Fig. 9). The index is obtained by dividing the estimated degree-day total (DDT) for each summer at 1510 m a.s.l., used as a proxy for melt, by the annual precipitation (P) in the same hydrological year (September-August in the following year) as a proxy for accumulation.
Temperature / precipitation index for the past 31 years.

The climate data are taken from weather stations at Ilulissat and Aasiat (Fig. 1), monthly temperatures are extrapolated to 1510 m a.s.l. using the lapse rate between the Swiss Camp (Fig. 3) and the weather stations, and degree-day totals are calculated from the monthly temperatures using the method of Reference BraithwaiteBraithwaite (1985). As the absolute magnitude of the DDT/P index is arbitrary, it is resampled to give a mean value of 0.5 over the 31 year period.
There was a very high temperature/precipitation index in 1985, which caused exceptionally high melting in the ablation area (Reference BraithwaiteBraithwaite, 1986), and probably also formed the high-density layer observed in the firn profiles at depths of 3-4 m, as well as the extensive ice layer observed at a depth of about 0.2-0.4 m in the summer of 1986 (Reference Echelmeyer, Harrison, Clarke and BensonEchelmeyer and others, 1992). The temperature/precipitation ind ex was then fairly low for the early 1980s and throughout the 1970s, which probably accounts for the low-density firn observed at depths of 4-10 m and suggests that it probably extends to even greater depths than measured. Relatively high values of the index then occurred again in the 1960s and should have formed high-density firn at some depth below the measured profiles.
If short-term climate fluctuations cause the formation of firn layers with different densities, higher melt under future climate warming may raise the run-off limit by a combination of two processes: (1) formation of massive impermeable ice layers close to the surface, overlying deeper firn and extending well into the present firn area, along which meltwater can flow, or (2) transformation of the whole lower part of the present firn area into solid ice, allowing meltwater to flow. Reference Pfeffer, Meier and IllangasekarePfeffer and others (1991) suggested that (1) could occur in only a few years, while (2) needs more than a century. Unfortunately, there is still too little information about meltwater hydraulics and heat transfer to choose between these possibilities. Detailed measurements of firn density and temperature immediately above the present run-off limit, i.e. at several points between stakes 141 and 151 in the Pâkitsoq profile, would be useful to understand better the firn-ice transition.
Surface-Elevation Changes
According to satellite-radar altimetry, the average surface elevation of the southern part of the Greenland ice sheet (accumulation and ablation areas together) rose by + 0.20 ± 0.06 m year−1 over the period 1978-85 (Reference Zwally, Brenner, Major, Bindschadler and MarshZwally and others, 1989). Reference ZwallyZwally (1989) explained this relative thickening in terms of a precipitation increase (without actually showing that such an increase had occurred), but variations in the density of near-surface firn could have caused surface-elevation changes even if the accumulation did not change. This point is illustrated by Table 6 using density data for stakes 157 and 163, and assuming an annual accumulation of 600 kg m−2.
Thickness of annual fun layer and melt rate estimated as a function of firn density

The argument rests on the assumption that the submergence velocity is in equilibrium with the accumulation at the long-term mean density (which is not known). Densities at depth 3-4 m are assumed to be higher than the long-term mean, while densities at 4-10 m are anomalously low, and the mean density for the present discussion is taken as the average of these high and low-density cases. The corresponding thicknesses of annual firn layers (C/ρ 2) are estimated for stakes 157 and 163 (Table 6). Assuming long-term equilibrium with a mean density of 730 kg m−3 at stake 157, the formation of low-density firn (600 kg m−3) would cause an average surface rise of +0.18 m year−1 during the period of its deposition. Similarly, formation of high-density firn (850 kg m−3) at stake 157 would cause a surface lowering of −0.11 m year−1. Corresponding figures for stake 163 are −0.09 to +0.09 m year−1.
The above figures should not be taken too literally, because the correct long-term densities are not known, but they strongly suggest that annual surface changes of the order of ±0.1 - ±0.2 m can occur in the lower accumulation area solely due to firn-density variations. The low-density layer at 4-10 m depth may therefore have partly contributed to the 1978-85 thickening observed by Reference Zwally, Brenner, Major, Bindschadler and MarshZwally and others (1989) just as low melting in the ablation area in the same period (Reference Braithwaite, Olesen and Thomsen.Braithwaite and others, 1992a) may also have contributed.
Implications for Monitoring
The melt rates required to form high-, low-and mean-density firn are also estimated according to Equation (3) and are given in Table 6. With the same accumulation as before, the low-density firn at stakes 157 and 163 could have been produced by reducing annual melt by only −30 and −60 kg m−2, respectively. It is impossible to measure annual firn melt with this precision by conventional mass-balance methods, although an increase of the same magnitude in annual melt is nearly enough to transform firn at stake 157 into ice and thus to raise the run-off limit and increase run-off to the ocean.
Even relatively small changes in annual melt and/or annual accumulation can have a visible effect on firn-density profiles such that repeated measurements may be useful for monitoring and early detection of climate changes. For example, firn-density profiles could be measured down to 10 m at selected locations in the lower accumulation area at intervals of a decade or so (using the GPS to find sites again). Increases (decreases) of average firn density at many locations would be a sign of increased (decreased) melting or decreased (increased) accumulation. According to the simple refreezing model discussed earlier, the largest variations in firn density will be close to the present run-off limit. However, firnstratigraphic studies should also be made higher up, above the present wet-snow limit where annual layers can be recognized, for direct assessment of accumulation changes. Repeated measurements of firn temperatures at the same sites to depths of 10-15 m might also be useful for detecting changes of temperature.
Aside from direct field measurements, higher near-surface firn density and increased formation of ice layers due to climate change might also be detectable by remote sensing. For example, synthetic aperture radar (SAR) penetrates the surface and gives information about the near-surface layer (Reference Bindschadler, Jezek and CrawfordBindschadler and others, 1987).
Conclusions
The density of near-surface firn in the lower accumulation area of the Greenland ice sheet is mainly controlled by the formation of ice layers by refreezing of meltwater within a wetted layer of thickness 2-4 m. Density is related to the ratio of annual melt M to annual accumulation C, and decreases with elevation. Even small changes in annual melt and/or annual accumulation have a visible effect on firn-density profiles. For example, lower firn densities occur at depths of 4-10 m below the 1991 surface because there was lower melt and/or higher accumulation a few years ago when this firn was formed. Time variations of near-surface firn density can cause annual surface-elevation changes of the order of ±0.1 to ±0.2 m, and may have partly contributed to the recent thickening of the Greenland ice sheet observed by satellite-radar altimetry.
Acknowledgements
This paper is published by permission of the Geological Survey of Greenland (GGU). R.J. Braithwaite (GGU) was supported by the European Community through contract EPOC-CT90-0015, co-ordinated by Professor D. Smith (Coventry University, England). W.T. Pfeffer (University of Colorado) was supported by the CO2 Research Division of the U.S. Department of Energy through contract number DE-FG02-90ER61078. G. F. Hansen (GGU) drew the figures.
The accuracy of references in the text and in this list are the responsibility of the authors, to whom queries should be addressed.