

1. Introduction
Throughout the twentieth century, the size of governments in Western economies has steadily increased, and its role has changed. In the beginning of the century, public spending represented between 10 to 20 percent of the GDP. Defense and justice administration departments were the largest spending categories in the government's budget, and social spending on programs related to education or pensions, for instance, was the smallest. By the end of the century, governments had transitioned into the large so-called modern “welfare states”. Many such modern welfare states are characterized by deep allocations (sometimes nearly half of the state's GDP) of government expenditure towards social spending. This work seeks to contribute to our understanding of what drives this major shift.
Parallel to this development, Western economies have undergone a process of rapid growth and structural transformation. Earlier theories on the structural transformation process focused on the simultaneous decline of agriculture and rise of industrial and service sectors. More recent developments in the literature, however, have assigned increasing importance to the role of the household sector (Ngai and Pissarides, Reference Ngai and Pissarides2008). In less developed economies, home production (sometimes referred to as informal production) is not restricted to household chores and the care of household dependents, but can further include agricultural production and a variety of crafts. As countries develop, these activities increasingly transfer to formal market sectors, a process known as marketization that has been documented to be an empirical regularity (Bridgman et al., Reference Bridgman, Duernecker and Herrendorf2018).
In this article, I tie government spending trends to modern theories of the structural transformation. I argue that the same factors that induce this broader structural transformation and marketization, namely differential sector productivity growth, are also contributors to the growth of public spending. That is, the diminishing importance of home production is the result of a reallocation of production and labor that involves not only private sectors, but also overtures by the government. Home production declines as the household sector lags behind market sectors in productivity growth, and, as a result, families acquire market alternatives to goods and services previously produced within the household (Ngai and Pissarides, Reference Ngai and Pissarides2008).Footnote 1 There are, however, important economic activities that have not directly transferred over to the market sectors; the provision of old age security is a prominent case and the focus of this article. Nonetheless, the same reasoning may apply to other transfers within families, such childcare or informal insurance provision agreements.
I study the empirical significance of the association in a panel of nine Western democracies for over the last century (1900–2011). In an approach most similar to Shelton (Reference Shelton2007), I study the impact of structural transformation, as measured by the employment share of the service sector (a proxy for marketization), on the size of government in a model that also includes a variety of prominent existing theories of the growth of government. These include factors such as per capita income (Wagner's Law), country size, age structures (aging), income inequality or women's suffrage. The results of the empirical exercise confirm the importance of structural transformation in explaining government growth. The share of the service sector is not also highly significant, but also quantitatively relevant across a variety of specifications and robustness checks.
After I establish the empirical validity, I provide a potential mechanism with an application to the development of public old-age pensions. In Western developed economies, family-based transfers and care services have been substituted, to a large extent, by government's transfers and direct provision of services (Lampman and Smeeding, Reference Lampman and Smeeding1983). In the case of old-age interventions, these take the form of public pensions and the direct provision of services for the elderly such as long-term care. Decades after their introduction, and with the additional combined pressure of sustained and long periods of low fertility rates and increasing longevity in Western countries, pension spending has become a major component of the government's budget, and is projected to increase further in future decades (OECD, 2020). I argue that marketization is a key force behind the dissolution of the family-based transfers, including informal arrangements for old age security, and that the introduction of government programs was, in part, a poverty relief measure aimed at providing support for the most immediately vulnerable to the disappearance of family institutions.
To study the impact of marketization on intergenerational family transfers, I extend Cigno (Reference Cigno2006)'s seminal model to include market and home production and elderly care. Families decide their time allocation, and choose between family-based old age transfers and private savings. In the model, the relatively higher productivity growth of the market sector is captured by wage increases, which lead to a reduction in both the home production of consumption goods and the benefits of family-based old age security schemes. As the later are arrangements that rely on the home production of services, wages increases render market alternatives for elderly relatively more attractive; at some point, if wages increase enough, households renege on the family constitution. If this change is not well anticipated, a cohort of old individuals is left with neither a market-based alternative nor family support. I hypothesize that, as a result, the government then can gather political support to institute a pension scheme as a poverty relief measure for the elderly; a review of the historical development of pension systems supports this hypothesis.Footnote 2 In the discussion, I propose that similar mechanisms can be established to relate other social spending programs to the decline of family-based transfers; public pensions may feature as a prominent example of a more general mechanism.
The rest of the article is organized as follows: I present a brief overview of the literature and stylized facts on the growth of government spending, marketization and structural transformation in Sections 2 and 3. I conduct an empirical test of my hypothesis on a panel of countries, against the background of existing theories of government growth in Section 4. This is followed by a review of a formal model illustrating a specific mechanism linking the growth of government and marketization in Section 5. A discussion and final remarks conclude.
2. Related literature
The expansion of government spending across developed countries over the twentieth century has prompted the growth of a vast literature attempting to identify its causes. Early economic observers noted that government growth appeared to go hand-in-hand with economic development, an observation formalized as Wagner's Law. Originally proposed by Wagner (Reference Wagner1892), the hypothesized underlying mechanism was that, as it developed, a society would become more complex and require greater government regulatory activity; in addition, real income growth would increase the demand for income-elastic goods, including welfare and cultural expenditures. Over time Wagner's law has gained prominence as a stylized fact, and much of the literature has focused on establishing its empirical validity (see Durevall and Henrekson, Reference Durevall and Henrekson2011 for a thorough compilation of work on Wagner's Law). Much less emphasis has been placed on its theoretical underpinnings, to the extent that some authors consider Wagner's Law a black box (Lindert, Reference Lindert1996).
Work that has focused on unpacking the mechanisms behind government growth is divided between theories that emphasize supply side factors and theories that focus on demand side ones (Kau and Rubin, Reference Kau and Rubin2002). Among the explanations that highlight that the forces behind public sector growth originate in the government itself, some argue that this might be due to the self-interest of actors within the government, such as bureaucrats (Niskanen, Reference Niskanen1968). Alternatively, spending might be driven by the lower productivity growth of the services provided by the government, such as education or healthcare (Baumol, Reference Baumol1993). Demand-side based theories focus instead on identifying the specific interest groups campaigning for higher government spending and their motivations. Much of this literature studies developed countries with democratic regimes and thus involves political economy considerations.
A prominent part of the literature analyzes the consequences of the expansion of voting rights, with an emphasis on the introduction of women's voting rights (Aidt and Dallal, Reference Aidt and Dallal2008). More recently, scholars have developed theories that link government growth to the sustained aging process experienced by developed countries (Casamatta and Batté, Reference Casamatta and Batté2006). A larger fraction of elderly citizens might be mechanically related to government spending given that the elderly consume a relatively larger amount of Social Security services such as long-term care, healthcare, and pension spending. In addition, an increasingly aged population pushes the demands from the median voter towards services used by the elderly (Michailidis et al., Reference Michailidis, Patxot and Solé2019). This can be both at the expense of other services, such as education, or can result in high fiscal pressure to sustain Social Security programs at constant benefits despite the added funding pressure. Section 4 provides a more detailed overview of some of these explanations in the context of the empirical analysis of the proposed theory.
This paper complements some of the demand side explanations. The marketization process is a key determinant of the diminishing role of the household, not only in the production of consumption goods but also in the provision of services, including old age security. As a result, some interest groups might demand greater government involvement in the production of such services. These could include programs designed to smooth economic shocks, childcare services, or the provision of old age security and care. In this view, marketization generates the initial impulse and political economy considerations moderate its final effect.
A closely related to a body of work has linked the introduction of public pensions with family transfers and fertility (Guinnane, Reference Guinnane2011). According to this literature, one of the key explanations behind the fertility decline throughout the twentieth century is the introduction of public pensions. If one of the motives behind childbearing is access to old age security and thus a form of savings, the introduction of an alternative scheme would diminish the drive to have children. This reasoning has been formalized in Cigno (Reference Cigno1993, Reference Cigno2006) and several subsequent contributions have established the role of Social Security in the decline of fertility, both in formal models (Van Groezen et al., Reference Van Groezen, Leers and Meijdam2003) and empirically (Fenge and Scheubel, Reference Fenge and Scheubel2017; Godard and Rossi, Reference Godard and Rossi2021). However, the mechanism behind the adoption of public pensions is less understood (Barnett et al., Reference Barnett, Bhattacharya and Puhakka2018). This work fills this gap providing a rationale for the appearance of public pension schemes.
3. Evidence on government spending and the structural transformation
3.1. The size of government
While countries differ in the proportion of GDP dedicated to government spending both across time and space, it is evident from Figure 1 that the overall pattern has been an increase in government spending over time, even for countries with historical preferences for smaller government, such as the U.S.Footnote 3 The dark time series trend depicts the average government spending for our sample of ten countries across 1900–2011, with individual country data plotted in colors specific to each country. World War I and World War II periods were associated with sharp spikes upwards in government spending followed by periods of decreasing spending, but the upwards trend is evident for all countries, even accounting for some missingness in different periods in the century of time. By the middle of the 20th century the average government spending over GDP had grown nearly 10 percent points and by the end of 2011 it had tripled in size.
Patterns of government spending over GDP across time. The black time series line represents the average government spending for the ten countries across time, while the scatterplot displays the individual data, colored to indicate corresponding country. I highlight the two periods of the World Wars in as war times are associated with sudden changes in government spending.

3.2. Public spending composition
Figure 2 depicts the average proportion of types of government spending over GDP across the sample over 1900–2011, and the proportion of that devoted to overall welfare spending, overall social security spending and overall pension spending. At the start of the century, government spending was less than a fifth of GDP with very small percentages further allocated towards welfare, social security spending, and pensions. As the size of governments grew, so too did the spending on welfare, which was itself dominated by spending on social security, and at midcentury, a growth in pensions. Current governments in the sample allocate more than half of government spending towards welfare, of which social security constitutes the majority share.
Average proportion of types of government spending over GDP across countries over time. The gray area is associated with overall government spending, blue with welfare, orange social security and finally yellow with pension spending.

Breaking down by country provides similar patterns (Fig. 3). While Switzerland and the U.S. has historically devoted lower proportions of their respective GDPs towards government expenditures compared to Nordic countries such as Sweden and Norway, the increase in government size is evident for each country across time, as is the growing importance in that expenditure of welfare spending (and specifically social security spending). Note data availability varies across countries; France and Ireland suffer severe missingness in information on allocations of government expenditures towards welfare, social security and pensions in the earliest parts of the century, though post mid-century the sample is quite well represented.
Proportion of types of government spending over GDP across time.

Not only did the size of welfare spending grow alongside general government size across the sample, the proportion of government spending devoted towards social security grew in the 111 years as well. In Figure 4 plots the average ratio of social security spending over total government spending across our sample from 1900–2011 in black. A scatterplot of the underlying data, colored by country, is presented simultaneously. At the start of the century, the proportion of government spending allocated towards social security programs was under 2% the total budget, and grew steadily (with drops around each of the World Wars) to the current half proportion in modern day.
Ratio of social security spending over total government spending across countries over time. Yearly average ratio in black.

3.3. Structural transformation
The structural transformation process is depicted in Figure 5, which captures the distribution of labor across sectors over time. Generally speaking, the countries in the sample follow the expected trajectories (Herrendorf et al., Reference Herrendorf, Rogerson and Valentinyi2014). Agriculture declines in importance throughout the period, mirrored by the steady increase in the labor share of services. Finally, the industrial sector share follows a U-shaped trajectory, more pronounced for countries, such as Finland, with a relatively low share of industry in the beginning of the period.
Labor share of agriculture, industry, and services across countries over time. The dark time series line represents the average labor share, while individual country data are plotted in colors respective to the legend.

4. Empirics
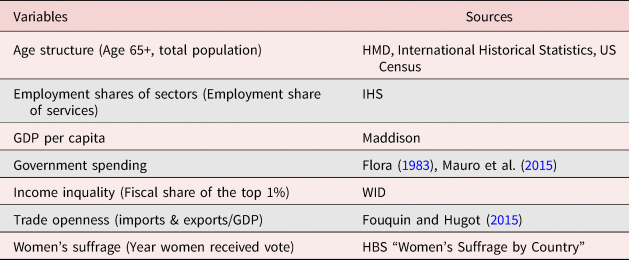
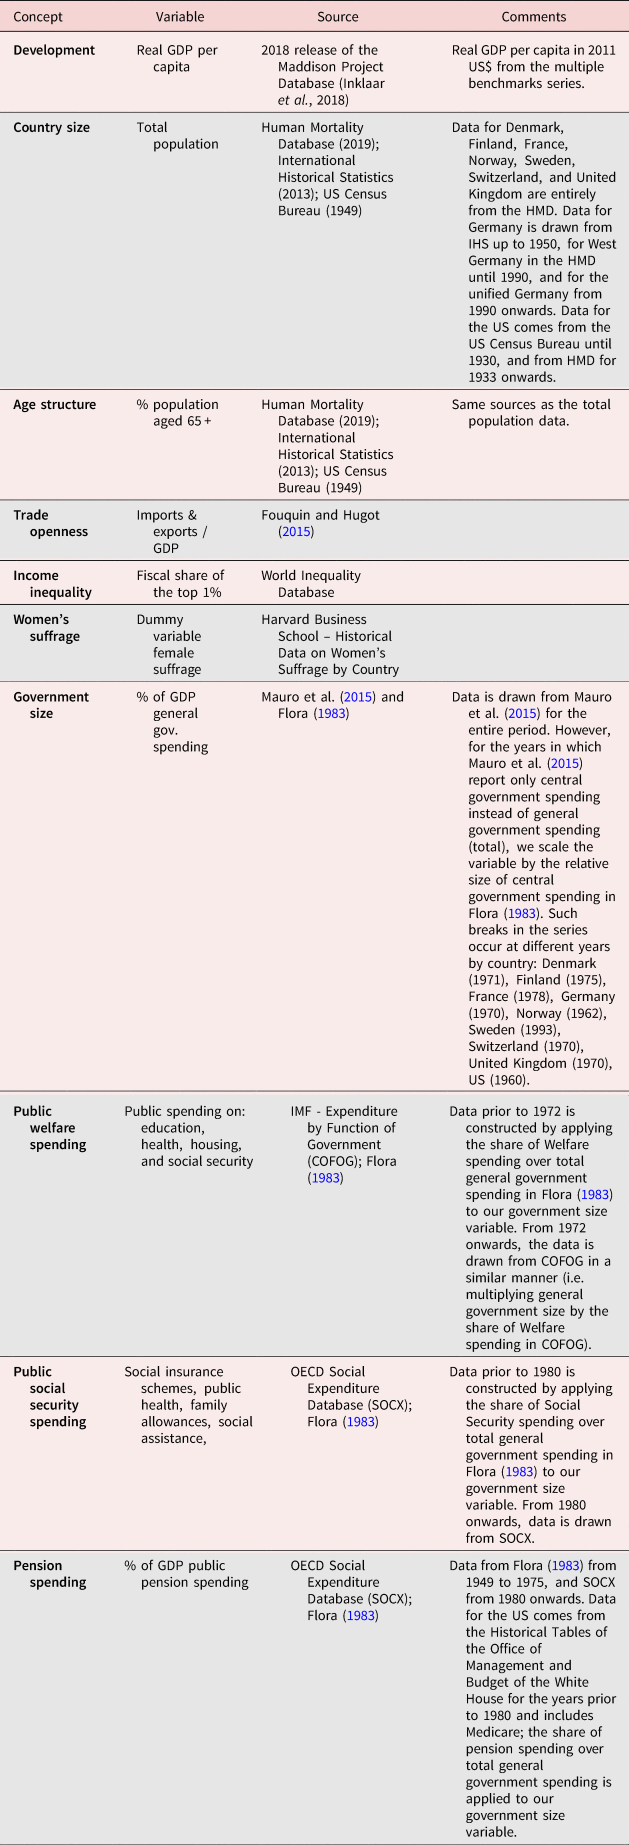
Is the hypothesized positive association between the broader structural transformation process and the growth of government empirically supported? To answer this question, I assemble and study a panel of data on nine Western countries from 1900 to 2011, described in Table 1, including measures representing notable forces behind the growth of government spending (e.g. income inequality, trade openness).
Summary of data sources

For sources above: “HMD” refers to the Human Mortality Database, “IHS” to International Historical Statistics (Palgrave Macmillan, 2013), “Maddison” to the Maddison Project Database (2018), “WID” to the Source for Global Inequality Data, and HBS refers to the Harvard Business School Historical Data on Women's Suffrage by Country. A full description of the data is provided in table A1 the appendix.
The remainder of the section is organized as follows. I review existing alternative theories on the determinants of government spending growth and their operationalization. This is followed by a discussion on data availability considerations and limitations in this work. It includes the choice of countries in the sample, the construction of the government spending series and treatment of missing data. Statistical properties of the series in the panel are then evaluated, explicitly testing for the presence of long-run (cointegrating) relationships. The subsequent modeling choices are grounded on the characteristics of the data, including the model specification. Finally, I present the main findings, followed by robustness checks on the stability of the results.
4.1. Alternative theories
I test my theory on marketization and family transfers against a number of alternative explanations for the growth of government, drawing from the related literature, partially summarized in section 2 and expanded on below.
Trade openness
Trade openness has been theoretically motivated as related to and empirically demonstrated to predict government finance (Cameron, Reference Cameron1978; Rodrik, Reference Rodrik1998). Postulated mechanisms behind the connection include open trade creating more heavily unionized organizations which can lead to more demand for government transfers and premeditated insurance against increased external risks brought on by open trade. As a result, it may serve as a confounding variable, affecting both the share of services within country and the amount of government spending. I capture and control for the variation of trade openness in the “openness” variable, measured as a country's imports and exports over GDP (Fouquin and Hugot, Reference Fouquin and Hugot2015).
Country size
The literature on country formation suggests that country size serves as another variable that simultaneously affects both the share of social services and the size of government spending. A combination of greater efficiency in larger countries to deliver public goods per capita and more resilience to closed world trading systems compared to smaller ones, implies larger countries may be less open to trade while spending less on public goods (see Alesina and Spolaore, Reference Alesina and Spolaore1997; Alesina and Wacziarg, Reference Alesina and Wacziarg1997 among others). I capture country size with total population size, gathered from a combination of sources: Human Mortality Database (HMD), International Historical Statistics and the U.S. Census.
Income
Wagner's Law suggests that wealthier societies simultaneously prefer growth in public services and some “luxury”-type public goods (e.g. education); differing empirical evidence has been produced on if and how much the correlation stands between richer countries and preferences for levels of public services and public goods (see among others, Oxley, Reference Oxley1994). Here wealthier societies are measured through the log GDP per capita from the Maddison Project Database.
Income inequality
Likewise, income disparities have also been postulated to simultaneously affect both levels of service and public spending Meltzer and Richard (Reference Meltzer and Richard1983). The combination of majoritarian rule (democracies) and citizens who can vote on redistribution policies results in voters who are taxed proportional to their incomes while receiving redistribution-based benefits proportional to the mean income of society. As a result we might see that variation in income inequality may affect levels of government spending on redistribution. I measure inequality through the fiscal share of the top 1% with data from the Source for Global Inequality Data.
Political franchise
While universal suffrage may be more prevalent in theory in modern Western democraciesFootnote 4, the historical trajectory of most countries (and all countries investigated in this study) involved differing extensions of suffrage across society, often based on different identities. Small privileged classes were more likely to have early and constant access to political franchise. If wealthier individuals are better represented in the voting population and if newly enfranchised groups are likely to be poorer than the original voters, the extent to which political franchise is defined in theory and practice may affect both the share in services and the size of government through mechanisms similar to those outlined in income inequality (Benabou, Reference Benabou1996). A major extension of the franchise in all countries in our sample was for the women's vote, which occurred throughout the 20th century. As such, I control for the change to political franchise by including a variable capturing women's suffrage for each country year.
4.2. Data limitations
According to the mechanism highlighted in introduction, marketization is associated with higher social spending. I am unable to directly test this due to data limitations, and instead provide evidence on the association between structural transformation and overall government spending. Nevertheless, I believe that the proxy measures utilized here are strongly related and should sufficiently capture the mechanism.
First, as shown in Section 3, social security, and welfare spending growth more generally constitute the main forces behind the expansion of government spending in the period. Hence, any strong determinant of the government expansion is bound to, at least, act partially through its influence on these types of spending. Second, while I am unable to directly measure home production for all countries across the time span under study here, the existing literature provides evidence of the strong linkage between market services and the decline of home production (Friedman and Schettkat, Reference Friedman and Schettkat2005). In my empirical specification, I capture structural transformation through the labor share of the market sectors in the economy (Herrendorf et al., Reference Herrendorf, Rogerson and Valentinyi2014); in particular, I use the labor share of services to characterize the stage within the structural transformation process. Unfortunately, to the best of our knowledge, there is no source that provides evidence on household production for the historical period covered in this analysis. Ramey and Francis (Reference Ramey and Francis2009) covers the U.S. exclusively and, while (Bridgman et al., Reference Bridgman, Duernecker and Herrendorf2018) compile a large cross-section of countries, the earliest data included refers to the 1970s.
Given the length of the period covered, data availability has heavily influenced the final selection of countries; the decision is a compromise between the length of the available variable series and the number of countries included in the sample. Working with such long historical series offers an important advantage in timeline, as I am able to capture the majority of the structural transformation process, as well as the transformation of government both in size and functions. This is key to testing this theory. Yet it simultaneously incurs limitations on the types of countries under study – an important one being that all the countries in our sample are democracies. However, this also ensures a certain degree of commonality behind the political considerations affecting government spending; the mechanisms we study might have very different effects under non-democratic regimes.
Priority has been given to sources that cover the majority of the period to avoid comparability issues and minimize the impact of data artifacts on the results. Accordingly, the main variable of study, government spending, is drawn from Mauro et al. (Reference Mauro, Romeu, Binder and Zaman2015) for the majority of countries and years. A characteristic of the data in Mauro et al. (Reference Mauro, Romeu, Binder and Zaman2015) is that, for all countries and at different years, the level of government changes from central government to total government spending. This can be particularly problematic given the heterogeneity across government levels in the trends, relative size, and functions undertaken across countries and time. My solution consists of scaling up government spending in Mauro et al. (Reference Mauro, Romeu, Binder and Zaman2015) using data on the degree of centralization from Flora (Reference Flora1983). Flora (Reference Flora1983) provide data on the fraction of total government spending utilized at the central and local government levels for the majority of the twentieth century. Further details on the data used and the integration of data across sources can be found in table 8 in the appendix.
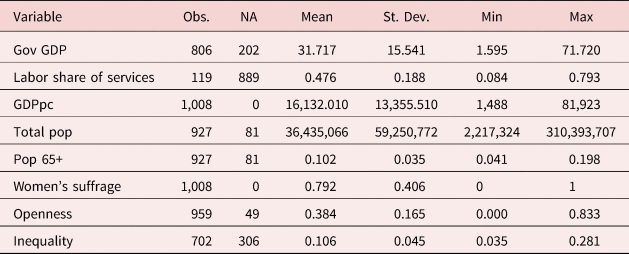
A further important data issue is the frequency of missing values for some of the variables in the panel; a detailed account is given in Table 2, along with a summary of the sample. For all subsequent tests and results, the series are log-transformed. In some instances, missing values are due simply to the periodicity of the original sources; this would be the case for population data from the census. More importantly, census data is also the basis of the sector labor shares, which results in measures that are periodically measured but show large numbers of missing values. My general approach to this issue consists in imputing the data for the missing values using interpolation methods. In the particular cases of population measures and sector labor shares, I believe that the nature of the data supports such an approach; both series are known to have steady trends over the period under consideration. As imputation of the outcome variable is more suspect, I opt instead to estimate the model with and without imputation for that particular variable. The results do not differ much at a qualitative level across options, though in some specifications this results in larger standard errors. To contextualize, note that roughly a quarter (21%) of the missing values for the outcome variable are related to the World Wars, during which a large fraction of the sample have no records of government spending. This represents a clear example of missing-not-at-random and, as such, is expected to influence the results. As I discuss in the context of model specification, I also test the theory in samples without war years, for which the differences between the models with and without imputations become smaller. This lends support to the hypothesis that, global warring periods aside, the gaps in our government spending series are largely due to observations missing at random.
Variable summary statistics

4.3. Modeling choices
Beyond the normal statistical considerations for long panels, such as testing for unit roots, or the existence of a cointegrating relationship between the series, the historical context studied bears some consideration. The sample includes two World Wars which, as noted in the stylized facts section, resulted in major and arguably unexpected expansions of government sizes. The explanatory variables included in the model are meant to explain the long-run determinants of government spending; thus, I examine the influence that these short term shocks have on the results, as well as in the preliminary tests. In particular, I examine these in a sample without war years (sans 1914–1918, 1940–1945).
4.3.1. Properties of the series
Given the length of the panel (over a century), and the nature of the economic series included, it is natural to expect stationarity-related issues in standard panel approaches. The caution over spurious associations between non-stationary variables in a time series context (Granger and Newbold, Reference Granger and Newbold1974) also apply to panel data (Kao, Reference Kao1999). The results from unit root tests adapted to panel data reveal that, in this instance, these concerns are warranted.
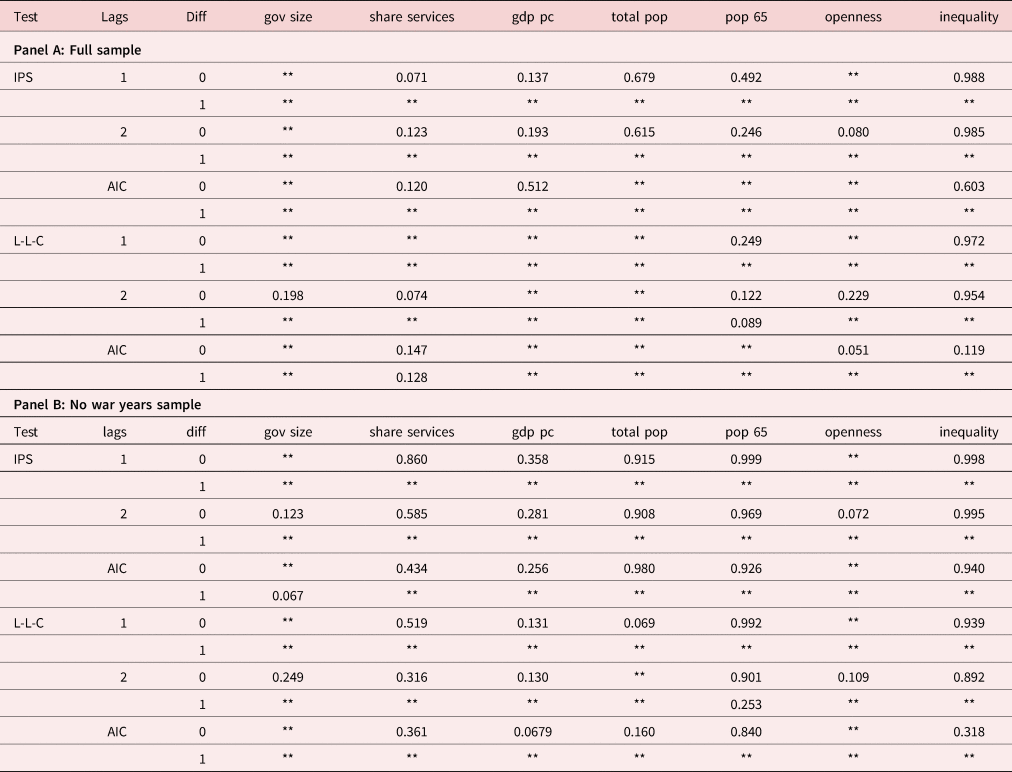
Im-Pesharan-Shin (Im et al., Reference Im, Pesaran and Shin2003) and Levin-Li-Chu (Levin et al., Reference Levin, Lin and Chu2002) tests indicate the presence of unit roots in both government spending and the share of services, as well as in all of the other variables considered (Table 3, Panel A). Furthermore, taken together, tests after taking first differences of all the variables are generally supportive of the assumption that the series are integrated of order one, I(1) (Table 3, Panel A). Additionally, I conduct the same tests in the sample without war years (Table 3, Panel B). The results for this sample are similar, and display even stronger support in favor of an I(1) interpretation.
Panel unit root tests

Note: Im-Pesharan-Shin (IPS) and Levin-Li-Chu (L-L-C) panel unit root tests for the full sample (Panel A) and the sample without war years (Panel B). Lags indicate the number of lags used in the Augemented Dickey-Fuller regressions with trends (1, 2, or automatically selected based on the Akaike information criterion); differences whether it is the original series (0) or its first differences (1). P values are reported in the main table, with **p < 0.05.
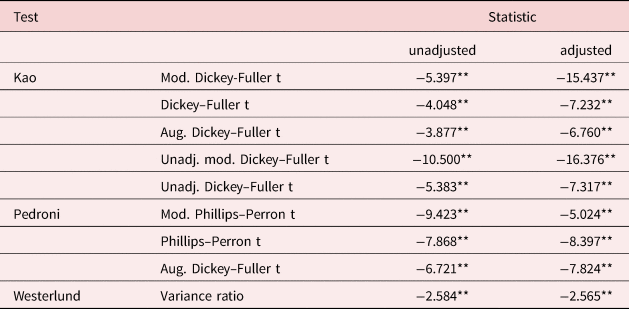
Having shown that the variables considered are nonstationary and share the same order of integration, the next set of tests investigate the presence of a long-run equilibrium. Is there any evidence of a potential long-run relation between the government size and its hypothesized determinants? To answer this, the (panel) cointegration hypothesis is assessed with three of the most commonly utilized tests. These are ones developed by Kao (Reference Kao1999), Pedroni (Reference Pedroni1999), and Westerlund (Reference Westerlund2005). When considering only government size and the share of services (Table 4, Column 1), the null hypothesis of no cointegration is rejected in favor of the alternative hypothesis of cointegration in all panels (for Kao and Pedroni), and some panels (Westerlun). Similarly, the hypothesis of a cointegrating relationship holds for the full set of hypothesized alternative determinants (Table 4, Column 2).
Panel cointegration tests

Note: Panel cointegration tests on the unadjusted (only gov. size and services) and adjusted (including all other determinants) sets of variables. Lags are automatically selected based on the Akaike information criterion (exc. for Westerlund's), trends included (exc. Kao's), and cross-sectional eans substracted. Test statistics are reported in the main table, with **p<0.05.
4.3.2. Approach and specification
Immediate approaches towards correcting stationarity-related issues in traditional models, such as those taken when modeling the panel in differences, are not acceptable in this context, given the loss of information on the long-run relationship between the variables of interest (Granger, Reference Granger1986). Thus, the interest in modeling a potentially dynamic relation between nonstationary series rules out standard static fixed effects approaches. Additionally, the historical panel under examination is a long panel (large T), with a relatively small number of countries (small N), invalidating approaches that require large N, such as the generalized methods of moments (Arellano and Bond, Reference Arellano and Bond1991).
The substantive objective of modeling the long-run determinants of government spending, net of short-term deviations, jointly with the considerations above, make an error-correction model representation particularly suitable. The results in the previous section reassure us that the order of integration requirements of panel autoregressive distributive lag (ARDL) models (the variables of interest must be I(0) or I(1) ) do not pose a problem (Pesaran et al., Reference Pesaran, Shin and Smith1999).
I use the pooled mean-group model developed by Pesaran et al. (Reference Pesaran, Shin and Smith1999). This approach considers homogeneous long run effects, while allowing for some country specific heterogeneity in the intercepts and short run dynamics (short run lag structure). While there exist alternatives that explicitly test and consider heterogeneity in long-run effects (Pesaran and Smith, Reference Pesaran and Smith1995), these rely on large N and are therefore less suitable in this case. The general ARDL representation of orders p and q is given by:

where $i = 1,\; \, 2,\; \, \dots ,\; \, N$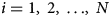 are countries; years are denoted $t = 1,\; \, 2,\; \, \dots ,\; \, T$
 ; y it is government size; X it are the various hypothesized determinants for country i in time t; μ i serve as country-specific intercepts; $\epsilon _i$
 is the error term. This can be expressed in the equivalent error-correction model (ECM) form using levels and first differences, which is more suitable for interpretation:

where ϕ i represents the error-correcting speed of adjustment (equal to 0 when there are no long-run relationships); Θ′ are the long-run coefficients on determinants, our parameters of interest.
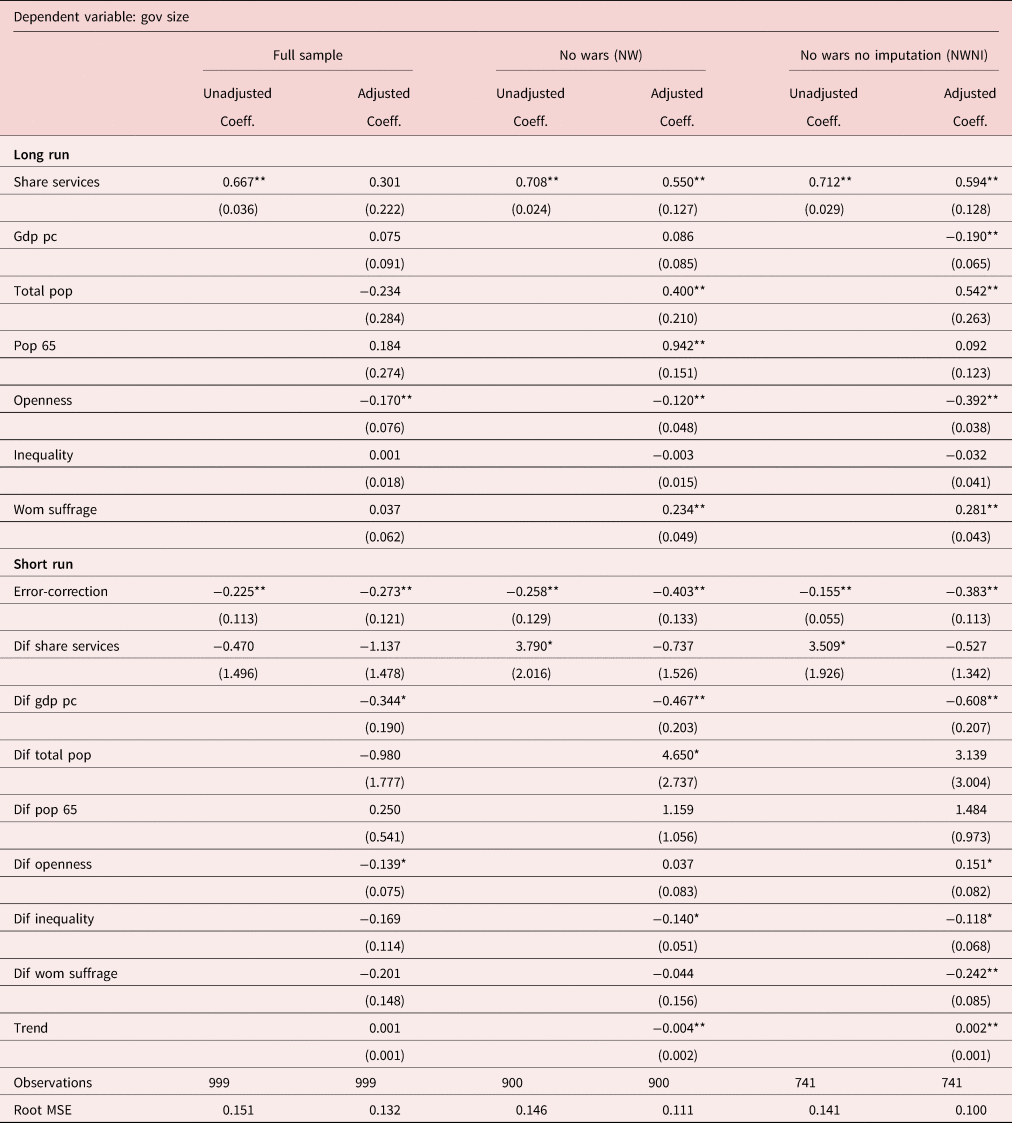
The main models and their variations are estimated across three different samples, based on the discussion in the previous section. The first is the full sample (FS), which includes all years and imputed values for both dependent and independent variables. The second is the sample with no war years (NW), which does not contain values for the main World War years (1914–1918, and 1940–1945). In short, the rationale for this exclusion is that the large and arguably unexpected government spending shocks during the wars are outside of the scope of the theories tested. The third sample uses the non-imputed series of government size in addition to no war years (NWNI), documenting the influence of the imputation procedure on the results. For each of these samples, two specifications are presented: (i) unadjusted, including only government size and the share of services; (ii) adjusted, which incorporates the full set of potential determinants, as well as a linear time trend. Both specifications are the ECM representation of a parsimonious ARDL model which includes one lag for the dependent and independent variables. Further sample restrictions and specifications are reported in the robustness checks section.
4.4. Results
4.4.1. Main results
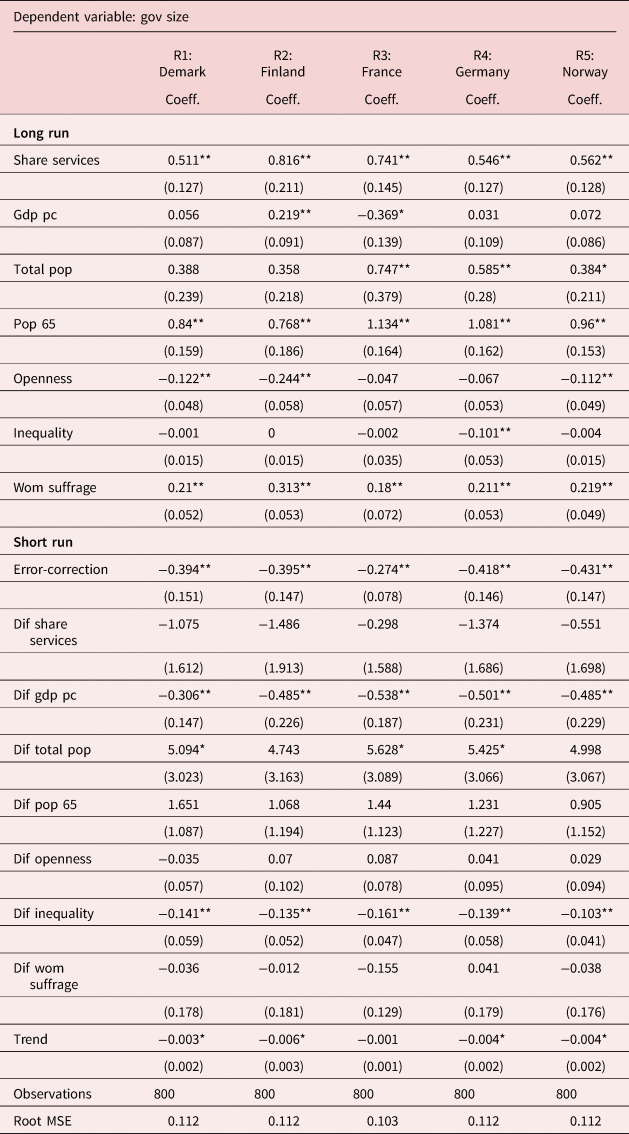
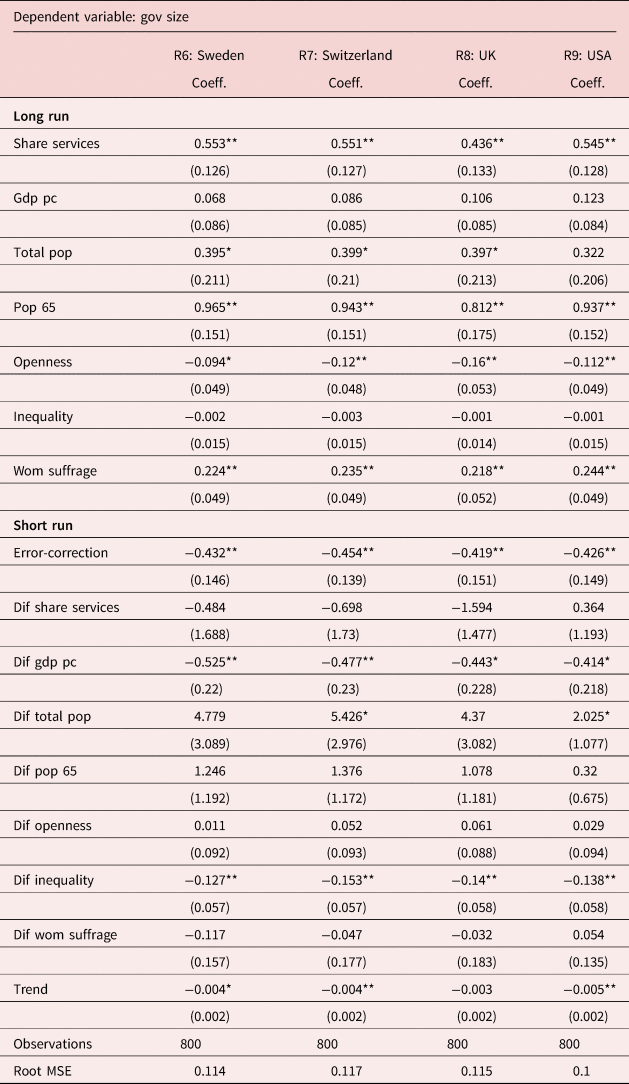
Taken together, the empirical findings generally support the significance of the positive contribution of marketization to government growth. Furthermore, the size of the contribution of marketization is of a similar order of magnitude as that from other well-established determinants, such as the share of elderly in the population. Table 5 reports the findings for all the main samples and specifications. Across all reported specifications, the presence of long-run associations is confirmed, given the significance of the error correction terms (ϕ i ≠ 0). The rest of the commentary refers to the determinant-specific long-run estimates, the focus of this work. The results of the unadjusted specification (Table 5, Columns 1,3, and 5) are qualitatively similar across samples. A strongly significant long-run association between government size and the labor share of services is found in all cases. However, the magnitude of the point estimate is larger for the NW and NWNI samples, and the standard errors smaller. This difference, that also appears for the adjusted specifications, is consistent with the expected influence of war periods, as discussed earlier.
Main results

Note: Std. errors in parenthesis; *p < 0.1; **p < 0.05.
The results of the adjusted specification show more important disparities across samples (Table 5, Columns 2,4, and 6). First, the inclusion of additional determinants of government spending reduces the influence of the share of services, but substantially more so for the full sample. The coefficient is $\sim 55\%$ (1 − (.30/.66)) smaller for the full sample, but $\sim 22\%$
 (1 − (.55/.71)) and $\sim 16\%$
 (1 − (.59/.71)) for the NW and NWNI samples, respectively. Second, the estimates are much noisier in the full sample, challenging the significance of the coefficients for the associations of most determinants. Third, the estimated coefficients for the share of the services are similar in the NW and NWNI samples in sign, significance, and magnitude, while less precise in the NWNI case; this is to be expected, given the smaller sample size. In light of these results, the focus of this work on long-run determinants, and the disruptive nature of the war episodes, the focus on interpretation is on the results of the adjusted specification in the NW sample. Not only does it captures a wider time span, given the presence of sporadic missing values in the early periods, it also better reflects the substantive focus of this exercise.
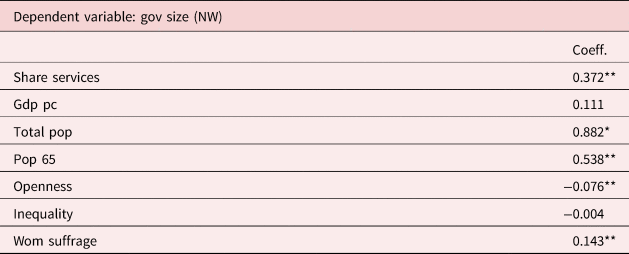
The positive result is not only highly significant across specifications, it is also quantitatively important. The point estimate (in the preferred model) on the share of services indicates that, in the long run, an increase of 1 percent increase in the share of services is associated with a 0.55 additional percent increase in government spending. Is this a large effect? The magnitude of this effect is over half the size of that of the share of elderly (65 +) in the country (0.55/0.94 = 0.59), which is a variable that has gained prominence in quantitative and theoretical work as one of the main contributors to government spending growth (Shelton, Reference Shelton2007; Lindert, Reference Lindert2004). Furthermore, beyond point estimates, it is important to consider the range of variation of the variables. While the share of labor for services has grown from 10–20% to 60–70% for most countries during the period, the share of elderly has increased more modestly. In the 1900s, the elderly typically represented less than 10% of the population, and by the end of the period this had grown to just under 20% for the countries with the highest elderly shares. To reflect this, Table 6 reports the standardized coefficients, i.e. the coefficient now indicates the effect of a one standard deviation increase in the independent variable on the dependent variable. This representation of the effects reveals a narrower gap between the effect magnitudes; the share of services effect size is over 2/3 (0.37/0.54 = 0.69) that of the share of elderly. Nonetheless, while these findings point to a large role for structural transformation in the past growth of government, aging is likely to become increasingly relevant in the coming decades. The share of services appears to be stabilizing after a sustained period of growth, and the share of elderly is predicted to increase substantially in the coming decades. Taken together, my main results suggest that the structural transformation process has been a key contributor to the growth of government throughout the twentieth century.
Standardized coefficients

Note: Std. errors in parenthesis; *p < 0.1; **p < 0.05.
4.4.2. Secondary results, robustness, and limitations
In my empirical exercise, alternative theories of government growth are incorporated in the model as controls to test the strength of the proposed theory, not to ascertain their validity. The exercise is data constrained regarding which theories can be included, and compromises were made on the choice of measures to represent said theories. For example, inequality is captured by the fiscal share of the top 1%, which does not fully capture some of the points made in theories of inequality such as Meltzer and Richard (Reference Meltzer and Richard1983). Furthermore, some of the results such the effect of per capita GDP, or that of total population, unlike the main finding, are not robust to the exclusion of certain countries (see the Appendix, Tables 2 and 3). As such, the results regarding competing explanations must be interpreted with caution.
Despite these caveats, a number of the results from the presented models are consistent, at a qualitative level, with those of similar exercises by Shelton (Reference Shelton2007) or Lindert (Reference Lindert1996), and more recent references (Krieger and Meierrieks, Reference Krieger and Meierrieks2020). Besides aging, discussed earlier, the results also point at the positive role other determinants, such as population size, or women's suffrage. The influence of per capita GDP (Wagner's law) remains inconclusive, in line with work that also fails to establish its validity in the long-run (Durevall and Henrekson, Reference Durevall and Henrekson2011). Finally, I also fail to find robust evidence on the influence of trade openness (see Appendix, Tables 2 and 3). This might be related, in part, to the fact that I study overall government spending, whereas trade openness has been found to be related to specific spending categories, such as education (Benarroch and Pandey, Reference Benarroch and Pandey2012).
Besides the iterated removal of countries to assess the influence of potential outliers (alluded to earlier), I also evaluate the robustness of the results to particular specification choices. The evaluated alternatives include lag structure specifications (single lag or automatic lag selection based on the Bayesian information criterion) and the inclusion of time trends, for adjusted and unadjusted models across all three samples (full, NW, NWNI). These results can be found in the replication materials in the OSF repository of the paper. While the specific estimates vary, the general findings remain qualitatively similar for the main coefficients of interest.
Regardless, the presented results should be taken with some caution, as the analysis does not employ a quasi-experimental set up, instrument, or related approach that is heavily focused on causal identification. This is an issue, however, that plagues the question itself given its theoretical and time-ranging scope. A further relevant caveat is that, given the length of period under study, proxies for some variables representing a number of alternative theories of government growth are severely limited. An important such absence are measures of ethnic fragmentation, which are known to influence public provision Alesina et al. (Reference Alesina, Baqir and Easterly1999). There is a trade off between studying longer periods and data coverage, and in this study I have opted for a broader overview. In doing so, I am able to study the growth of government from its inception in the wake of the twentieth century, and the empirical findings I report represent the long run determinants of government spending. Finally, despite these shortcomings, the fact that sign, significance, and coefficient magnitudes remain constant across specifications lends support to the robustness of the relationship between the share of services and government size.
5. Mechanisms
The previous results empirically support validity of the association between marketization and government spending, but do not elucidate the reasons or mechanisms behind it. Here, I suggest one such possible mechanism in an application to the development of public pensions. I provide a discussion of the historical context surrounding the introduction of public pensions (for the same countries included in my sample). Consistent with my proposed explanation, early pensions had a strong component of poverty relief. I develop a stylized theoretical model which replicates the historical development, in which the marketization process causes the disruption of informal old age provision agreements, leading to increases in old-age pauperism. This creates a rationale for the types of government intervention that I document.
5.1. Early public pensions
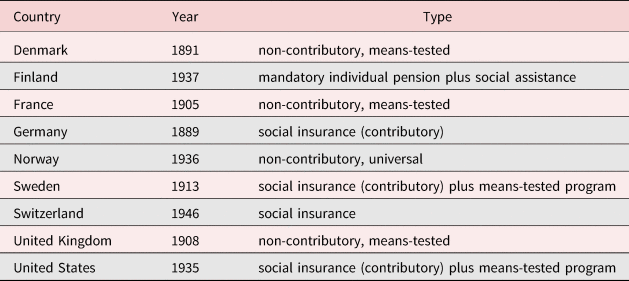
Public pensions, along with other large government Social Security programs such as unemployment insurance and disability pensions, were first introduced in the first third of twentieth century (see Table 7). However, the involvement of governments in old age support did not commence with public pensions (Boyer, Reference Boyer2016). Several of the countries considered in this work provided economic support to the elderly through general poverty relief programs or poor laws (Petersen, Reference Petersen1990; Boyer and Schmidle, Reference Boyer and Schmidle2009; Hagen, Reference Hagen2013). Though they were not the only intended targets, a large fraction of the recipients of poverty relief were the elderly, a fact well understood at the time (Booth, Reference Booth1894).

At the time, income sources for older individuals consisted of a combination of government support (through poverty relief laws), family support, their own work, and early forms of private pensions. The later include occupational pensions (often associated to trade unions) and friendly societies; however, those were not universal in coverage, and were deemed, in some cases, insufficient to cover living expenses (Boyer and Schmidle, Reference Boyer and Schmidle2009). The consensus is that the elderly of that time was one of the most vulnerable groups, with high poverty rates (Booth, Reference Booth1899; NAH, 1911; Seager, Reference Seager1910).
The debate over the necessity to increase public support for old age comes at a time in which the transformation of production activities and family structures and support go hand in hand (Ruggles, Reference Ruggles2015). The transition from a family or home production based economy to market production diminishes opportunities for the elderly to participate in productive activities. The necessity for old age provision prior to the structural transformation process must not be overstated: in many societies, past and present, the elderly produce close to their consumption needs (Lee, Reference Lee2020). However, especially in the case of industrial workers, productivity (and salaries) declined steeply with age, often the result of transitioning to less well paid occupations at older ages (Johnson, Reference Johnson1994). This was highlighted by commentators of the era, who noted that the elderly faced particularly harsh conditions in urban environments, with low wages and were often not cohabiting with their offspring (Booth, Reference Booth1899). In this context, public pensions were introduced in several countries as a form targeted poverty relief in the form of non-contributory mean-tested pensions, or with at least a poverty relief component (Table 7).
5.2. Formal model
The model developed in this section formally ties in marketization with the dissolution of family-based arrangements for old age support, following the historical developments reviewed above. It is a partial equilibrium model in which prices and productivity are parameters. The driving force behind marketization, the higher relative growth of productivity over home production (Ngai and Pissarides, Reference Ngai and Pissarides2007), is taken as a external force. The purpose here is to show the pathway through which these broader economic changes can influence intergenerational transfers within the family. Insofar as these forces operate mainly through the channels highlighted in my model, the partial equilibrium approach may provide valuable insights.
The formal exercise captures the decision between having children as an investment in old age support and relying on market based alternatives, in line with the literature linking fertility with pensions. The model, heavily based on the seminal contributions by Cigno (Reference Cigno1993, Reference Cigno2006), features selfish agents that may only have children as a savings device.Footnote 5 The main difference with respect to the aforementioned studies is the introduction of home production goods, following on the marketization literature (Ngai and Pissarides, Reference Ngai and Pissarides2007, Reference Ngai and Pissarides2008) . Individuals allocate labor between home and production sectors, with no leisure, and make a savings decision. In addition, agents decide whether they enter into an intergenerational agreement for old age support or whether they invest in a market alternative. The market option could represent an asset or participation in a private pension scheme.
5.2.1. Agents
Individuals live in three periods as children, adults, and elderly. Only individuals in their adult periods make decisions. I abstract from genders; individuals can be regarded as a couple. The utility of an adult depends only on present consumption (C 1) and consumption in old age (C 2) and takes the following form:

where time preference parameters are omitted for ease of exposition. Consumption in the first period is given by a consumption aggregator C over market (c m) and home (c) goods: $C_{1} = [ \nu c_{m}^{\varepsilon } + ( 1-\nu ) c_{h}^{\varepsilon }] ^{{1}/{\varepsilon }}$ . For simplicity, I assume perfect substitutability between home and market produced services for period two consumption. Production technologies are linear in time for both goods, with c m = w ⋅ l m and c h = ψ ⋅ l h.
As adults, individuals decide between two options to ensure consumption in old age. They may have children and enter a family agreement with the children on future transfers; following Cigno (Reference Cigno2006) I call this a family constitution. Alternatively, individuals can save in the form of the market alternative. I assume that individuals are selfish in the sense that they do not consider the utility of their children; furthermore, I assume that children do not provide any utility by themselves. This is designed to capture a stylized version of the framework in which individuals have children strictly as a form of savings.
5.2.2. Regimes
Family constitution
Individuals in a family constitution agree to devote a given amount of time (T o) caring for their parents, which is exogenously determined, and this in turn will be allocated to them by each of their children. A deviation from this agreement can be credibly punished by their own children simply by not providing any care for them (Cigno, Reference Cigno2006). In this arrangement, consumption in the second period is simply given by C 2 = n ⋅ T o, whereby n is the number of children, decided based on a function of childcare, presented shortly. During their work age, divide their time endowment L between market work (l m) house work, (l h) elderly care, (T o) and childcare, T y:

The number of children n, as mentioned before, is linear in childcare and, for simplicity, I assume that it shares the same productivity parameter as the home production of goods, n = ψT y. Total home production aggregates over the time spent in the production of home produced consumption goods, as well as elderly care and childcare. Under the family constitution regime, agents maximize utility (3) subject to (4) and the relevant production functions.
Private alternative
When an agent chooses not to subscribe to a family constitution, consumption in period 2 depends on savings (S) and interest rates (or returns to the private pension scheme) (R): C 2 = S ⋅ R. In this context, time devoted to market work can have two purposes: (i) consumption in period 1 ($l_{m, c_m}$ ), (ii) savings for period 2 (l m,S). This notation simplifies the presentation of later results. Then, the budget constraints of the household are given by:

Time can be spent in home and both types of market work:

Finally, the agent maximizes Eq. (3) subject to (5), (6), and technology.
5.2.3. Regime choice
It is not necessary to fully determine the solution of the model to characterize it to the extent that is needed here. As pointed out by Cigno (Reference Cigno2006), it can be a useful exercise to consider the family constitution as a two-part tariff. Individuals pay a fixed cost T o to have access to the rate of return given by the family constitution. Then, it follows that (as I will show below) a necessary (but not sufficient) condition for the superiority of the family constitution is that its rate of return is greater than that of the private alternative.
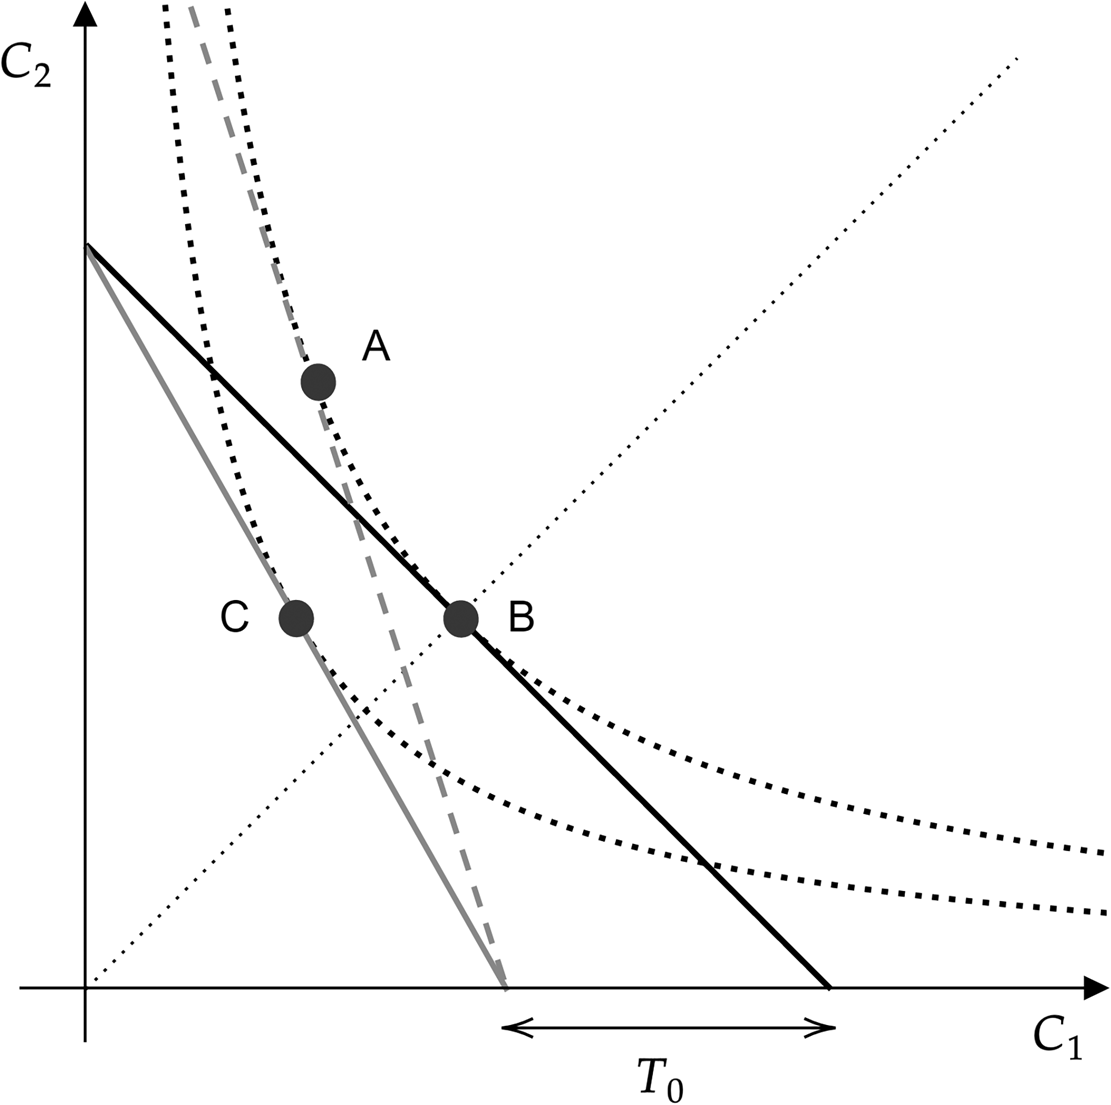
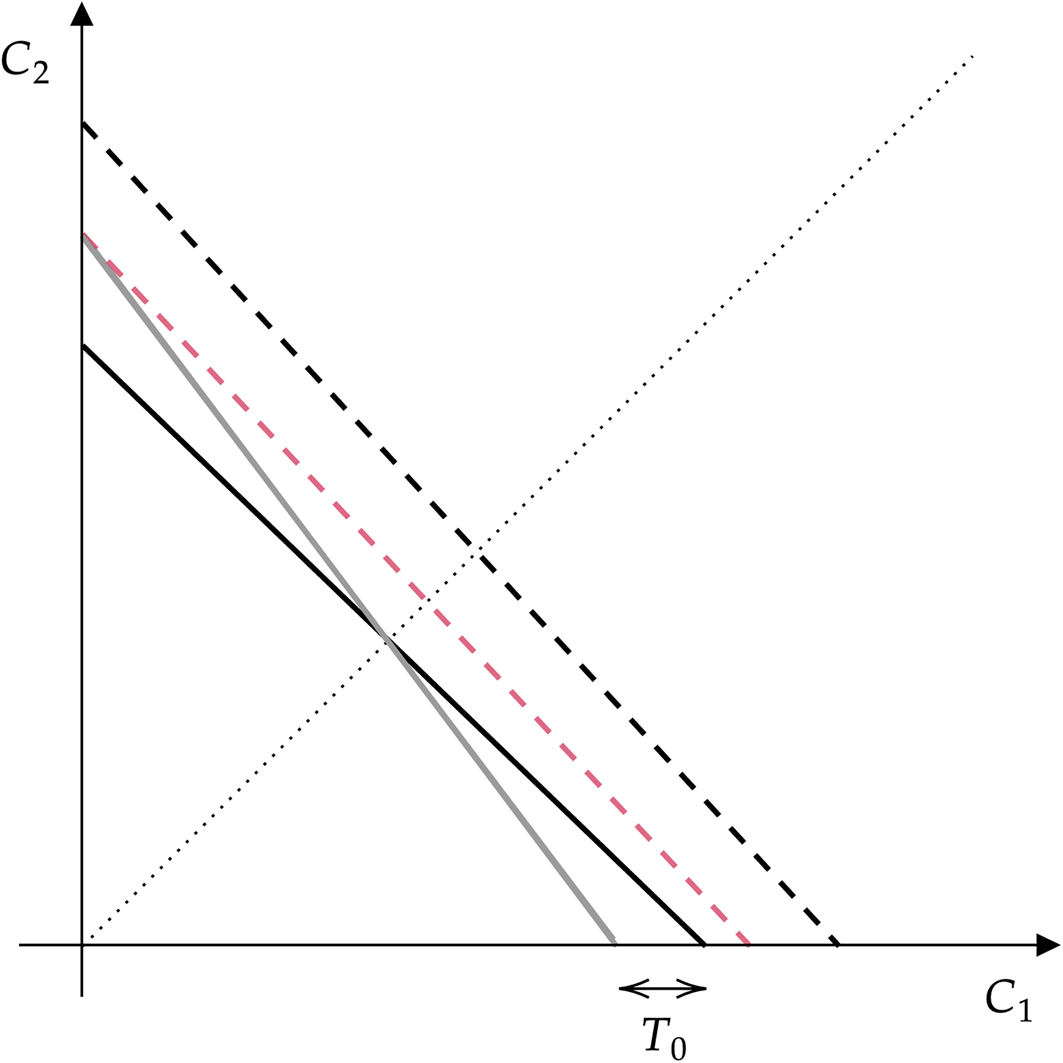
This intuition is formalized through an examination of the frontier of possibilities of consumption (FPC) under the two regimes, illustrated in Figure 6. The analysis will leverage the fact that a particular regime cannot be preferred if its FPC is strictly dominated (always lower consumption bundles) by the alternative. If that were the case, it would be possible to find a higher utility consumption bundle in the other regime. In the Figure, solid black line represents the private alternative, and the two gray lines the family constitution with relatively higher and lower returns (dashed and solid lines, respectively). The 45$^\circ$ line denotes the levels of the different indifference curves from the utility equation (Eq. (3)) and allows us to compare the utility attained under the two regimes. The slope of the FPCs for each regime are its rates of return, capturing the tradeoff between consumption in the first and second periods.
Comparing family-based transfers and private savings. The solid black line represents the private alternative, and the two gray lines the family constitution with relatively higher and lower returns (dashed and solid lines, respectively). The 45$^\circ$ line denotes the levels of the different indifference curves from the utility equation (Eq. (3)).

To demonstrate that regime choices boil down to a comparison between the respective rates of return, I proceed as follows. First, I show that the intratemporal decision (i.e. home and market production for period 1 consumption) is independent of regime choice. Then, I characterize the maximum feasible consumption in period 1 for either regime, and show that it is lower for the FC than for PS. It follows that, in order for the FC regime not to be fully dominated (strictly higher FPC) by the PS option, the slope of the FPC (rate of return) must be higher under the FC alternative.
For a given level of consumption in period 1, both regimes utilize the same ratio of home and market labor and thus the same shares of both consumption goods (market and home produced). To reach this conclusion, note that, under both regimes, agents will allocate time such that the marginal utility across labor types is equal. Equalizing the marginal utility of home and market labor allocations towards period 1 consumption results in an identical ratio across regimes (a more thorough derivation of this result is left for the Appendix A.1, for this and subsequent results), given by:

where the superscripts FC and PS indicate the time allocations for the family constitution and private savings regimes, respectively. This expression mirrors the labor ratio in standard models of structural transformation (Ngai and Pissarides, Reference Ngai and Pissarides2008).
Given the above result (7), we can characterize the maximum feasible level of period 1 consumption ($C_{1}^{max}$ ) under each regime and show that, as expected, it is lower for the FC alternative. Let τ = l h/l m for period 1 oriented consumption, and normalize the total labor allocation to 1 (L = 1). Given that T 0 > 0, allocating all labor to period 1 consumption results in a lower level of consumption under the family constitution:

Next, I show that the comparison between the slopes of the FPC essentially results in the comparison between the rates of return to savings across regimes. Note that, given (7), the opportunity cost in terms of foregone period one consumption by (marginally) shifting consumption to period 2, denoted Γ, is identical across regimes. Thus, the slope of the FPC under the private alternative regime is wR/Γ, and ψT o/Γ for the family constitution. Therefore, given that $C_{1}^{max}$ is smaller under the FC, in order for its FPC not to be strictly to the left of that of the PS option, its slope must be steeper. In other words, a necessary condition for the family constitution to dominate the private savings regime is that its returns must be higher:

Figure 6 illustrates how (8) is a necessary but not sufficient condition. The rate of return of the family constitution is superior to the return on private savings options in both scenarios (solid and dashed gray lines). However, the maximum achievable utility is the same for both regimes in points A and B, but inferior in the case of point C.
5.2.4. Structural change
In this simple model, we introduce structural change via a wage increase (parameter w under a competitive market) while keeping the remaining productivity parameters constant. This is the parallel of the faster relative productivity growth of the market sector in general equilibrium marketization models (Ngai and Pissarides, Reference Ngai and Pissarides2008). Figure 7 depicts this scenario; in gray and black the family and private options respectively, discontinuous lines indicate those options after wage increases.
Comparing family-based transfers and private savings. In gray and black the family and private options respectively, discontinuous lines indicate those options after wage increases. The 45$^\circ$ line denotes the levels of the different indifference curves from the utility equation (Eq. (3)).

A wage increase equally expands the FPC along the horizontal axes for both regimes as the labor allocation for the production of consumption in the first period is unrelated to the intertemporal decision. However, this symmetry is broken for second period consumption. The corner solution whereby all resources are devoted to childbearing is unchanged for the family constitution regime, as wages play no role. At the same time, an increase in the productivity of the private consumption goods market expands for the private savings option. All together, these changes diminish the appeal of the family constitution with respect to the outside (market) alternative.
We arrive at a similar conclusion by examining the effect of a wage increase on (8), since ${\partial \ \psi T_{o}}/{\partial \ w} = 0$ , and ∂ wR/∂ w > 0. That is, as long as there are positive returns on savings, an expansion of wages increases the rate of return on the private regime alternative, increasing the space of parameter configurations for which the family constitution does not dominate the private savings regime. Figure 7 displays the case in which both regimes yield the same utility prior to wage increases, but the family transfers are dominated after the productivity increase in the market sector.
I posit that the dissolution of the family constitution played a key role in the introduction of public pensions. In the presented model, adults renege on their agreement to provide old age support as a result of increasing wages; if this change is unexpected, a cohort is left without private option or family support. I believe that this describes the situation of the elderly in industrializing and urban environments. Thus, the introduction of government support can be seen as a feasible response to a social emergency. The fact that several such pension schemes emerge from poor laws and were means-tested (not contributory) supports this interpretation as well.
This model describes a mechanism that builds a direct link between sector shifts in the allocation of labor, from home to market production, and pension spending. A broader interpretation of the model could also include, within old age support, the long term care services provided to the elderly and adult dependents. The key element driving the disruption of family-based transfers is the differential productivity growth for market and home based production. Insofar as these productivity growth differentials affect other services, the mechanism I highlight could drive a broader substitution of home by market production. I return to this point in the discussion, where I also provide other examples of the substitution between family and market based transfers.
6. Discussion
This work posits that the process of marketization is an important contributor to the growth of public spending and thereby the growth of government generally. I provide two pieces of evidence to bear in support of this hypothesis. First, I investigate its empirical validity in a long panel of over a hundred years for nine Western countries. The results of this exercise not only highlight the validity and robustness of the association, but also its quantitative importance. Next, I illustrate a significant potential mechanism tying together government growth and marketization. For this purpose, I develop a model that formalizes the linkage between the decline in family-based intergenerational transfers to the elderly and the productivity forces behind marketization. In this context, I hypothesize that the adoption of public pension schemes can be understood as a poverty relief measure aimed at reducing the growth of old age poverty brought on by the decline of family-based old age security. This is consistent with evidence on the development of early public pension systems.
My suggested mechanism is heavily focused on old-age security and transfers, and similar models are typically used to discuss the role of pension systems. Nevertheless, it is possible to interpret family constitutions as wider arrangements that include the provision of long term care, and thus pension spending would only be a fraction of the total cost assumed by a government that attempts to substitute family-based transfers. Along those lines, my argumentation can extend to other significant services previously produced almost exclusively by the (extended) family, such as childcare, or the provision of insurance and compensation against economic shocks. For example, Di Tella and MacCulloch (Reference Di Tella and MacCulloch2002) study how government provided unemployment benefits crowd-out family risk-sharing devices. More generally, the relationship between family structures and relations and public spending is well-established (Attanasio and Rıos-Rull, Reference Attanasio and Rıos-Rull2000; Anderberg, Reference Anderberg2007; Halla et al., Reference Halla, Lackner and Scharler2016). This work offers an explanation for the adoption of such institutions.
While differential home and market productivity growth provides a rationale for marketization, it does not directly inform whether provision will be primarily public or private. In the case of pensions, I have provided a narrative framed around the exceptionality of a transitional period. However, this need not apply to other government programs. To explain these cases, we may turn to the alternative theories that emphasize other mechanisms; efficiency (market failures) and equity considerations are central to the debate on private and public provision, as are the political economy interests shaping the policy debate. I view my contribution as complimentary to these existing theories, as the forces behind marketization may provide the impulse for phasing out home production and in turn different mechanisms might dictate whether it ultimately fuels private or public sector growth.
Data
Data and code for replication can be found at: https://osf.io/bjkp8/
Acknowledgements
I thank Adeline Lo, Luís Pinheiro de Matos, Menzie Chinn, and Tim Smeeding for their careful reading of the paper and numerous suggestions. For their helpful comments, I thank the participants of the 20th Journées Louis-André Gérard-Varet, the XXVII Meeting on Public Economics, and the anonymous reviewers at this journal.
Competing interests
The author declares no conflict of interests.
Appendix A: Appendix
A.1 Formal model
This part provides additional detail on the results highlighted in Section 5.2.
Claim 1: the intratemporal allocation is independent of regime choice
Substituting in the consumption and production functions for C 1 and C 2 we obtain the expressions the following from of the utility functions:

In any regime, the solution to the labor allocation problem of the household is given by the time split that equalizes the marginal utility across time uses. In the case of choice in period 1 between market and home produced consumption goods, that is given by ∂U FC/∂l m = ∂U FC/∂l h and ${\partial U^{PS}}/{\partial l_m^c} = {\partial U^{PS}}/{\partial l_h}$ . Developing these expressions and solving for the labor ratio gives the result:

Data sources and harmonization details

Robustness checks – country exclusion (part 1)

Robustness checks – country exclusion (part 2)

Claim 2: characterization of the maximum feasible consumption in period 1
Starting with the PS case, let the optimal labor ratio (characterized earlier) be l h/l m = τ. Then, if normalizing the total amount of time to 1 (L = 1 and assume that all labor is allocated towards consumption in period 1, using the time constraint we obtain l m = 1/1 + τ and l h = τ/1 + τ. Substituting these into the expression for C 1:

The expression for $C_1^{FC}$ is obtained similarly, keeping into consideration that the total available time is 1 − T o given that the family is still providing care for the elderly (T o).
Claim 3: opportunity cost of consumption in period 1
From Claim 1 we know that any total amount of labor allocated to the production of goods for period one consumption is split equally (l h/l m = τ), regardless of the regime. Thus, for any given allocation of time towards period 1 production, $L_1^{PS}$ and $\check {L}_{1}^{FC} = {L_1^{FC}-T_o}$
 :
:

Let ∂U/∂l m = ∂U/∂l h = Γ. From the expression above, the following holds:

In other words, no regime has an advantage in the production of period 1 consumption bundles.
Claim 4: slope of the frontier of possibilities of consumption (FPC)
The slopes of the FPCs are:

Thus, given that ${\partial C_1^{PS}}/{\partial L_1} = {\partial C_1^{FC}}/{\partial L_1} = \Gamma$ , a comparison between the slopes boils down to the terms ${\partial C_2^{PS}}/{\partial L_1}$
 and ${\partial C_2^{PS}}/{\partial L_1}$
 . That is, following the definition of C 2 under each regime, the slope of the FPC under the FC is greater than that of the PS alternative if ψT 0 > wR.


 Open access