



1 INTRODUCTION
The current paradigm of galaxy formation, known as cold dark matter (CDM), holds that structures in the universe grow in a bottom-up hierarchical fashion (e.g. White & Rees Reference White and Rees1978). The universe’s initial conditions are conceived as a smooth roughly homogeneous expanse of gas and dark matter (DM). In CDM, small perturbations imprinted on the primordial density field grow via gravitational instabilities and then merge with each other to create the complex structures (such as clusters, groups of galaxies, galactic haloes, filaments, sheets, and voids) we observe today.
Warm DM (WDM), an alternative to CDM, suggests that initial perturbations below a certain mass cannot collapse and as such the smallest structures to form out of gravitational instability are fairly large (e.g.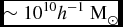 $\sim 10^{10}h^{-1}\text{ M}_{\odot }$
; Bode, Ostriker, & Turok Reference Bode, Ostriker and Turok2001; Zavala et al. Reference Zavala, Jing, Faltenbacher, Yepes, Hoffman, Gottlöber and Catinella2009). This is because the temperature of the DM particle at decoupling (specifically, whether it was relativistic or not) can cause the DM particle to escape from and erase the underlying density fluctuation. This process, known as ‘free streaming’, inhibits the formation of small structures by gravitational collapse.
$\sim 10^{10}h^{-1}\text{ M}_{\odot }$
; Bode, Ostriker, & Turok Reference Bode, Ostriker and Turok2001; Zavala et al. Reference Zavala, Jing, Faltenbacher, Yepes, Hoffman, Gottlöber and Catinella2009). This is because the temperature of the DM particle at decoupling (specifically, whether it was relativistic or not) can cause the DM particle to escape from and erase the underlying density fluctuation. This process, known as ‘free streaming’, inhibits the formation of small structures by gravitational collapse.
The initial power spectrum of fluctuations, which can be measured directly from the CMB, describes the degree of ‘contrast’ in the density field and can be compared with the large-scale clustering of galaxies observed in sky surveys (such as the SDSS or 2DF). These measurements probe the power spectrum on scales much greater than those scales where the nature of the dark matter can be probed.
A number of suggestions as to the mass of DM particles have recently been proposed (e.g. Boyarsky et al. Reference Boyarsky, Lesgourgues, Ruchayskiy and Viel2009a; Boyarsky, Ruchayskiy, & Shaposhnikov Reference Boyarsky, Ruchayskiy and Shaposhnikov2009b), which correspond to the lack of DM haloes less than $\sim 10^{6}\,\text{M}_{\odot }$
– roughly the mass of the smallest DM-dominated dwarf galaxy. Indeed invoking a warmer flavour of DM (such as a 2-keV sterile neutrino; see Lovell et al. Reference Lovell2011) may solve a number of issues related to dwarf satellite galaxies, including the missing satellite problem’ (Moore et al. Reference Moore, Ghigna, Governato, Lake, Quinn, Stadel and Tozzi1999; Klypin et al. Reference Klypin, Kravtsov, Valenzuela and Prada1999) as well as the ‘massive failure problem’ (Boylan-Kolchin, Bullock, & Kaplinghat Reference Boylan-Kolchin, Bullock and Kaplinghat2011, Reference Boylan-Kolchin, Bullock and Kaplinghat2012). Despite the many successes of CDM, there is thus more than just a hint that WDM may solve some of the fundamental problems in galaxy formation.
$\sim 10^{6}\,\text{M}_{\odot }$
– roughly the mass of the smallest DM-dominated dwarf galaxy. Indeed invoking a warmer flavour of DM (such as a 2-keV sterile neutrino; see Lovell et al. Reference Lovell2011) may solve a number of issues related to dwarf satellite galaxies, including the missing satellite problem’ (Moore et al. Reference Moore, Ghigna, Governato, Lake, Quinn, Stadel and Tozzi1999; Klypin et al. Reference Klypin, Kravtsov, Valenzuela and Prada1999) as well as the ‘massive failure problem’ (Boylan-Kolchin, Bullock, & Kaplinghat Reference Boylan-Kolchin, Bullock and Kaplinghat2011, Reference Boylan-Kolchin, Bullock and Kaplinghat2012). Despite the many successes of CDM, there is thus more than just a hint that WDM may solve some of the fundamental problems in galaxy formation.
Regardless of the nature of the DM, the gravitational collapse of structures in the universe is a highly non-linear process and can only be modelled by using numerical methods, such as N-body simulations (Springel et al. Reference Springel2005) of the cosmic density field. Numerical simulations have successfully probed a myriad of scales: from the largest conceivable simulations of the universe (e.g. the Horizon, Millenium-XXL, and MultiDark runs; Kim et al. Reference Kim, Park, Rossi, Lee and Gott2011; Angulo et al. Reference Angulo, Springel, White, Jenkins, Baugh and Frenk2012; Riebe et al. Reference Riebe2011), through clusters (e.g. the Phoenix project; Gao et al. Reference Gao, Navarro, Frenk, Jenkins, Springel and White2012), to Milky Way (MW)-type galaxies filled with small substructures (Springel et al. Reference Springel2008; Stadel et al. Reference Stadel, Potter, Moore, Diemand, Madau, Zemp, Kuhlen and Quilis2009).
Within the CLUES projectFootnote
1
we have used constrained simulations to show that the specific environment of the Local Group (LG) is an important ingredient in the formation of the MW and Andromeda galaxies (e.g. Libeskind et al. Reference Libeskind, Frenk, Cole, Helly, Jenkins, Navarro and Power2005; Knebe et al. Reference Knebe, Libeskind, Knollmann, Yepes, Gottlöber and Hoffman2010; Libeskind et al. Reference Libeskind, Knebe, Hoffman, Gottloeber and Yepes2011a, Reference Libeskind, Knebe, Hoffman, Gottloeber and Yepes2011b; Knebe et al. Reference Knebe, Libeskind, Knollmann, Martinez-Vaquero, Yepes, Gottlöber and Hoffman2011b). Indeed, the often-used term ‘MW-type galaxy’, which lumps all galaxies in haloes of $\sim 10^{12}\text{M}_{\odot }$
together, may be considered a stereotype given the wide differences in merger history, morphology, and other properties among these galaxies (e.g. de Rossi et al. Reference de Rossi, Tissera, De Lucia and Kauffmann2009; Busha et al. Reference Busha, Wechsler, Behroozi, Gerke, Klypin and Primack2011; Forero-Romero et al. Reference Forero-Romero, Hoffman, Yepes, Gottoeber, Piontek, Klypin and Steinmetz2011). Since the simulations can be directly compared with observations, constrained simulations are extremely useful to study the formation of the LG galaxies (e.g. Knebe et al. Reference Knebe, Libeskind, Doumler, Yepes, Gottloeber and Hoffman2011a; Di Cintio et al. Reference Di Cintio, Knebe, Libeskind, Yepes, Gottlöber and Hoffman2011, Reference Di Cintio, Knebe, Libeskind, Brook, Yepes, Gottloeber and Hoffman2013, Reference Di Cintio, Knebe, Libeskind, Hoffman, Yepes and Gottlöber2012; Dayal and Libeskind Reference Dayal and Libeskind2012).
$\sim 10^{12}\text{M}_{\odot }$
together, may be considered a stereotype given the wide differences in merger history, morphology, and other properties among these galaxies (e.g. de Rossi et al. Reference de Rossi, Tissera, De Lucia and Kauffmann2009; Busha et al. Reference Busha, Wechsler, Behroozi, Gerke, Klypin and Primack2011; Forero-Romero et al. Reference Forero-Romero, Hoffman, Yepes, Gottoeber, Piontek, Klypin and Steinmetz2011). Since the simulations can be directly compared with observations, constrained simulations are extremely useful to study the formation of the LG galaxies (e.g. Knebe et al. Reference Knebe, Libeskind, Doumler, Yepes, Gottloeber and Hoffman2011a; Di Cintio et al. Reference Di Cintio, Knebe, Libeskind, Yepes, Gottlöber and Hoffman2011, Reference Di Cintio, Knebe, Libeskind, Brook, Yepes, Gottloeber and Hoffman2013, Reference Di Cintio, Knebe, Libeskind, Hoffman, Yepes and Gottlöber2012; Dayal and Libeskind Reference Dayal and Libeskind2012).
Constrained simulations have also been used to study the velocity function of disc galaxies in the Local Volume by Zavala et al. (Reference Zavala, Jing, Faltenbacher, Yepes, Hoffman, Gottlöber and Catinella2009). By using a simple model to populate haloes with disc galaxies, Zavala et al. (Reference Zavala, Jing, Faltenbacher, Yepes, Hoffman, Gottlöber and Catinella2009) showed that the velocity functions in the two regions explored by the ALFALFA survey agree quite well with both CDM and WDM cosmologies, as long as one considers massive galaxies with circular velocities in the range between 80 and 300 km s1. However, for galaxies with circular velocities below 80 km s−1, only the predictions of a 1-keV WDM particle agree with observations. On the other hand, at a circular velocity of ≈35 km s−1, the CDM scenario predicts about 10 times more sources than observed.
Using the same set of simulations as Zavala et al. (Reference Zavala, Jing, Faltenbacher, Yepes, Hoffman, Gottlöber and Catinella2009), Tikhonov et al. (Reference Tikhonov, Gottlöber, Yepes and Hoffman2009) found that the observed spectrum of mini-voids in the local volume is in good agreement with the WDM model but can hardly be explained within the CDM scenario.
Given the importance of the LG on the formation of the MW, in this paper we examine the effect of the type of DM assumed, on forming such a group. We use the same model as Zavala et al. (Reference Zavala, Jing, Faltenbacher, Yepes, Hoffman, Gottlöber and Catinella2009) but run gas dynamical simulations with much higher resolution as described in Section 2. In Section 3, we study the cosmography of the simulated groups and in Section 4 the internal halo properties. In Section 4, we summarise and discuss our results.
2 SIMULATIONS
In this section, we describe briefly the numerical methods used to run our simulations as well as the methods to identify haloes in the simulation. We refer the reader to Libeskind et al. (Reference Libeskind, Yepes, Knebe, Gottlöber, Hoffman and Knollmann2010) for details. As mentioned before, the original CDM simulation was constrained by present-day observations of our local universe (Willick et al. Reference Willick, Courteau, Faber, Burstein, Dekel and Strauss1997; Tonry et al. Reference Tonry, Dressler, Blakeslee, Ajhar, Fletcher, Luppino, Metzger and Moore2001; Karachentsev et al. Reference Karachentsev, Karachentseva, Huchtmeier and Makarov2004; Reiprich & Böhringer Reference Reiprich and Böhringer2002). Initial conditions are then produced following the method described by Hoffman & Ribak (Reference Hoffman and Ribak1991). The zoomed DM initial conditions for a 2h −1 Mpc sphere were generated following the prescription set out in Klypin et al. (Reference Klypin, Kravtsov, Bullock and Primack2001). The reader should note that the constraints we have applied to the initial conditions are on linear scales at z = 0 and are identical in the two cosmologies. The unconstrained phases, namely the power responsible for the internal dynamics of the groups embedded in the constrained realisations, are effectively random. ‘Effectively’ because they have been selected in the CDM case (by trial and error) to produce a group which resembles the LG in terms of number, mass, geometry, and kinematics of three galaxies. Therefore, an unconstrained random realisation which produced a LG looking candidate with CDM initial conditions would have equally sufficed for the purposes of our study.
Gas particles are included in the high-resolution regions of both the WDM and CDM initial conditions with a mass of $m_{\rm GAS} = 4.4 \times 10^{4} h^{-1} \text{\,M}_{\odot }$
, during the evolution of the simulation they may spawn star particles (see below), whose mass is
$m_{\rm GAS} = 4.4 \times 10^{4} h^{-1} \text{\,M}_{\odot }$
, during the evolution of the simulation they may spawn star particles (see below), whose mass is $m_{\rm STAR} = 0.5m_{\rm GAS} = 2.2 \times 10^{4} h^{-1} \text{\,M}_{\odot }$
. Star, gas, and high-resolution DM particles are all softened on the same length scale of 150 h
−1 pc. Star formation rules are described in detail in Libeskind et al. (Reference Libeskind, Yepes, Knebe, Gottlöber, Hoffman and Knollmann2010). The Springel & Hernquist (Reference Springel and Hernquist2003) method is used to model gas in the interstellar medium (ISM). A uniform but evolving ultraviolet background is switched on at z = 6 (Haardt & Madau Reference Haardt and Madau1996). Only atomic cooling is assumed. Cold gas cloud formation by thermal instability, star formation, the evaporation of gas clouds, and the heating of ambient gas by supernova-driven winds all occur at the same instant. Each star formation event injects energy and metals into the ISM instantaneously. Feedback from SN explosions is modelled kinetically using the stochastic approach developed by Springel & Hernquist (Reference Springel and Hernquist2003).
$m_{\rm STAR} = 0.5m_{\rm GAS} = 2.2 \times 10^{4} h^{-1} \text{\,M}_{\odot }$
. Star, gas, and high-resolution DM particles are all softened on the same length scale of 150 h
−1 pc. Star formation rules are described in detail in Libeskind et al. (Reference Libeskind, Yepes, Knebe, Gottlöber, Hoffman and Knollmann2010). The Springel & Hernquist (Reference Springel and Hernquist2003) method is used to model gas in the interstellar medium (ISM). A uniform but evolving ultraviolet background is switched on at z = 6 (Haardt & Madau Reference Haardt and Madau1996). Only atomic cooling is assumed. Cold gas cloud formation by thermal instability, star formation, the evaporation of gas clouds, and the heating of ambient gas by supernova-driven winds all occur at the same instant. Each star formation event injects energy and metals into the ISM instantaneously. Feedback from SN explosions is modelled kinetically using the stochastic approach developed by Springel & Hernquist (Reference Springel and Hernquist2003).
The PMTree-SPH MPI code Gadget2 (Springel Reference Springel2005) is used in both runs to simulate the evolution of a periodic cosmological box with a side length of L box = 64h − 1Mpc. Using the same subgrid physics, we modified only the initial power spectrum of fluctuations to simulate a WDM model. Since the phases of the constrained initial conditions in both cases are identical, any differences in galaxy or halo properties are directly due to the effect of changing the DM power spectrum. Both runs employ cosmologies that assume WMAP3 parameters (Spergel et al. Reference Spergel2007), i.e. Ω m = 0.24, Ω b = 0.042, ΩΛ = 0.76. The rms mass fluctuation in spheres of 8 Mpc is σ8 = 0.73 and n = 0.95 is the slope of the power spectrum.
When simulating WDM, we suppress the power spectrum below scales representative of a 1-keV WDM particle (see Figure 1). The initial conditions are generated by rescaling the CDM power spectrum and fitting it with an approximation to the transfer function representative of the free-streaming effect of WDM particles (Viel et al. Reference Viel, Lesgourgues, Haehnelt, Matarrese and Riotto2005). The free-streaming length of such a WDM particle is $350h^{-1} \text{ kpc}$
, which corresponds to a filtering mass of
$350h^{-1} \text{ kpc}$
, which corresponds to a filtering mass of $\sim 1.1\times 10^{10}h^{-1}\text{\,M}_{\odot }$
(Bode et al. Reference Bode, Ostriker and Turok2001): the WDM power spectrum, shown in Figure 2, thus contains a sharp cut-off at this free-streaming length.
$\sim 1.1\times 10^{10}h^{-1}\text{\,M}_{\odot }$
(Bode et al. Reference Bode, Ostriker and Turok2001): the WDM power spectrum, shown in Figure 2, thus contains a sharp cut-off at this free-streaming length.
The power spectrum used in this work. In black, we show the CDM power spectrum, in red, the WDM power spectrum. The vertical dashed lines indicate the k interval used to generate the initial conditions from the fundamental mode (k ~ 2π/L box≈0.1) to the Nyquist frequency (k ~ 200).

A density map containing the three haloes that make up the simulated group at z = 0 in CDM (left) and WDM (right). The CDM group is more compact and collapsing while the WDM is more diffuse and still expanding. Each plot is projection of a 2h −1 Mpc cube.

In order to identify haloes and subhaloes in our simulation, we have run the MPI+OpenMP hybrid halo finder ahf Footnote 2 . We refer the reader to the code description papers (Gill et al. Reference Gill, Knebe, Gibson and Dopita2004; Knollmann & Knebe Reference Knollmann and Knebe2009) for details. ahf locates local overdensities in an adaptively smoothed density field as prospective halo centres. The potential minimum of each density peak is then calculated; bound particles are then associated with possible haloes.
In the WDM simulation, discreteness effects which can cause haloes below a specific limit mass ( $M_{\text{lim}}$
) to arise from the unphysical numerical fragmentation of filaments, is an issue. In order to protect our analysis against these artificially formed haloes, we use the value of
$M_{\text{lim}}$
) to arise from the unphysical numerical fragmentation of filaments, is an issue. In order to protect our analysis against these artificially formed haloes, we use the value of $M_{\text{lim}}$
provided by Wang & White (Reference Wang and White2007) as the minimum trusted mass for a halo in the WDM simulation. Their expression, originally based upon hot DM models, reads
$M_{\text{lim}}$
provided by Wang & White (Reference Wang and White2007) as the minimum trusted mass for a halo in the WDM simulation. Their expression, originally based upon hot DM models, reads $M_{\text{lim}}=10.1\bar{\rho }d/k_{\text{peak}}^{2}$
, where
$M_{\text{lim}}=10.1\bar{\rho }d/k_{\text{peak}}^{2}$
, where $\bar{\rho }$
is the mean density, d is the mean interparticle separation, and
$\bar{\rho }$
is the mean density, d is the mean interparticle separation, and $k_{\text{peak}}$
is the wavenumber at which Δ2(k) = k
3
P(k) reaches its maximum. In our WDM run, where the power spectrum has been modified to correspond to a
$k_{\text{peak}}$
is the wavenumber at which Δ2(k) = k
3
P(k) reaches its maximum. In our WDM run, where the power spectrum has been modified to correspond to a $1 \text{-keV}$
particle, the value of this limiting mass is
$1 \text{-keV}$
particle, the value of this limiting mass is $M_{\text{lim}}\sim 2.6 \times 10^7 \text{ M}_{\odot }/h$
, which corresponds roughly to a 100-particle limit. In practice, in both the CDM and WDM simulations, only objects whose mass is greater than 500 particles are used. We note that since the simulations have identical baryonic physics, particle mass, and spatial resolutions, any of the differences reported here are due entirely to the nature of the DM model.
$M_{\text{lim}}\sim 2.6 \times 10^7 \text{ M}_{\odot }/h$
, which corresponds roughly to a 100-particle limit. In practice, in both the CDM and WDM simulations, only objects whose mass is greater than 500 particles are used. We note that since the simulations have identical baryonic physics, particle mass, and spatial resolutions, any of the differences reported here are due entirely to the nature of the DM model.
3 COSMOGRAPHY
We begin with a cosmographic description of the two simulated groups. Our simulations produce three dominant objects which we name galaxy A, B, and C in decreasing mass. In the CDM case, these closely resemble the MW, Andromeda (M31), and Triangulum (M33). An image of the two groups can be seen in Figure 2. Two salient aspects of WDM are immediately apparent from this figure: (1) there are far fewer small substructures and (2) the two groups differ substantially, cosmographically speaking.
In Figures 3(a and c), we show the co-moving and physical distance between the three pairs of group members as a function of look-back time, normalised to the z = 0 value. In the CDM simulation, the physical separation of each pair of galaxies reaches a maximum ‘turn around’ (at a look-back time of around 6 Gyr for galaxy B–A and galaxy B–C pair and around a few Gyrs later for galaxy A–C). In the WDM simulation, this is not the case: the physical distance between each pair of haloes at every redshift is smaller than the corresponding distance at redshift zero, indicating that the Hubble expansion is the dominant force at every epoch and that all three pairs of galaxies have yet to begin approaching each other. Accordingly, the group is more compact in CDM than in WDM. Using these specific initial conditions, over densities that turn around and are on a collision course at a given epoch in cosmic time in CDM, have yet to approach each other in WDM, where CDM produces an attracting, collapsing group of galaxies, WDM produces a still expanding version. This is our first result. Using initial conditions, whose only difference is a suppression of small-scale power, the defining dynamics of the a group of galaxies are completely different in CDM and WDM, with the former predicting an attracting group that resembles the LG, while the latter predicting a still expanding one.
Upper panels: CDM; lower panels: WDM. Left panels (a, c): the physical (thin line) and co-moving (thick line) distance as a function of look-back time between the three pairs of LG haloes. We show the distances between the A and B in blue, the B and C in red, and A and C in green. Each curve is normalised to its z = 0 value which can be found in Table 1. Right panels (b, d): the mass growth for haloes A (red), B (blue), and C (green) as a function of look-back time. The solid dots denote the time at which half the z = 0 mass was assembled.

The co-moving distances (shown as the thick lines in Figures 3 a and c) show monotonic attractions. In the WDM case, the simulated haloes are closer to each other (relative to their z = 0 distances) at early times than the CDM haloes. In the CDM case, by z = 0 the haloes have been brought closer. Note that the small kinks in the A–C system (CDM) and the B–C system (WDM case) appear due to false identification of the main progenitor in the merger tree construction at a given snapshot.
We now examine the evolution of the three individual group members by examining the mass accretion history shown in Figures 3 (b and d). In both the CDM and WDM runs, the two most massive galactic haloes (A and B) show jumps in the mass accretion history characteristic of merger activity occurring more or less continuously. Often, these haloes appear to lose mass after a violent major merger. This is because of the unique merger history of these objects – violent mergers may bring material into the virial radius that is bound at one redshift, but which may become unbound and flung out at a later time. The smallest halo (C), on the other hand, shows little evidence of major mergers in its past.
Although the mass growth histories look similar, in fact they differ slightly. The time at which half of the z = 0 mass has been assembled is shown in each plot as a filled circle. In the WDM simulation, each halo assembles 50% of its mass later with respect to the CDM model. Specifically, in the WDM run, haloes A, B, and C accrete half-mass at a look-back time of ~4, ~6, and ~9.5 Gyr, respectively. In the CDM case, this occurs at ~7, ~7, and ~10 Gyr, that is ~3, ~1, ~0.5 Gyr earlier. Since B and C are smaller mass haloes, their half-mass times are considerably earlier and the delay is considerably smaller than for halo A.
A characteristic feature of the WDM model emerges here: the finite primordial phase-space density due to the large thermal velocities of the particles causes most of the mass to undergo gravitational collapse at later redshift (z<5), resulting in the suppression of halo formation at higher redshift (Bode et al. Reference Bode, Ostriker and Turok2001). Halo collapse is thus delayed with respect to the CDM model. Although not a new result, this finding directly informs the main differences we find between CDM and WDM.
4 INTERNAL HALO PROPERTIES
How do the different cosmographies and histories change the internal structure of each of our three LG objects? In Figures 4(a–c), we show the density profile of the three LG members in both WDM (dashed) and CDM (solid) simulations. All density profiles are standard NFW fits, and in all three cases the WDM is nearly indistinguishable from the CDM. That said, owing to the lower mass of the WDM haloes, their density profiles are systematically shifted to slightly lower densities.
Internal properties of the three main haloes simulated as function of radius. Properties for haloes A (red, left panel), B (blue, centre panel), and C (cyan, right panel) are shown for WDM (dashed) and CDM (solid). Top row (a–c): density profile. Middle row (d–f): baryon fraction. Bottom row (g–i): gas fraction.

In Figures 4(d–f), we show the cumulative baryon fraction as a function of radius. Again, WDM and CDM show broad similarities in shape and value of the baryon fraction. In the inner parts, WDM shows a systematically lower baryon fraction. At around ~0.03r vir, the total fraction of internal mass in baryons is roughly the same in both cosmologies. Towards the outer parts of the halo, the baryon fraction of both cosmologies drops, reaching a cosmic mean of ~0.1 at the virial radius. The fact that CDM haloes have more concentrated baryons is likely due to a number of combining factors: their earlier formation time, their greater mass, and thus their deeper potential. This is our second main result: WDM haloes have lower baryon fractions in their inner parts where baryons dominate, than CDM haloes.
The baryonic properties of the three LG members are summarised in Table 2.
The z = 0 properties of a simulated group in CDM and WDM. Note that the WDM group has little resemblance to the CDM one (which closely matched the real LG, see Libeskind et al. Reference Libeskind, Yepes, Knebe, Gottlöber, Hoffman and Knollmann2010). We show the following properties: the mass of haloes A, B, and C (M A, M B, and M C), the distance between haloes A, B, and C (d A,B, d A-C, and d B-C), and the relative line of sight velocity for each pair (V A,B, V A,C, and V AB,C).

Properties of the three main galaxies in the CDM and WDM simulation. For each halo, we show the number (N vir) and mass (M vir) of stars, gas, and all particles within the virial radius. We present the baryon fraction within the virial radius (f b, vir).

The fraction of mass in the gaseous component is presented in Figures 4(g–i). Although each halo shows different specific behaviour, some interesting similarities exist. First, the fraction of mass in gas is almost always greater in WDM than in CDM. This is true for all radii in halo A, and for radii greater than 0.03r vir for haloes B and C (although in halo B, there is more gas in CDM for r<0.2r vir). The higher gas fractions in WDM may inhibit infalling substructures from depositing their material in the centre of the halo, thereby suppressing the baryon fraction in the inner parts of WDM haloes, as seen in Figures 4(d–f).
Both gas and stars form well-defined discs, a consequence of the star formation rules we have used. This can be quantified by performing a dynamical bulge–disc decomposition. There are a number of ways this is done in the literature (e.g. Abadi et al. Reference Abadi, Navarro, Steinmetz and Eke2003; Scannapieco et al. Reference Scannapieco, Gadotti, Jonsson and White2010; Sales et al. Reference Sales, Navarro, Theuns, Schaye, White, Frenk, Crain and Dalla Vecchia2012). In this work, we dynamically decompose star and gas particles within the inner 10 kpc into disc-like and bulge-like components using two methods, one for each component (as in Knebe et al. Reference Knebe2013). For both methods, a ‘disc axis’, taken to be the total angular momentum of all baryonic particles within 10 kpc, must be assumed.
For gas particles, we follow Scannapieco et al. (Reference Scannapieco, Gadotti, Jonsson and White2010); the component of each particle’s angular momentum in this direction (Jz ) is computed and compared with the angular momentum a particle would have at that radius if it were on a circular orbit. The ratio Jz /J circ is computed where
 \begin{eqnarray}
J_{\rm circ}&=& r \times v_{\rm circ}\\
\end{eqnarray}
\begin{eqnarray}
J_{\rm circ}&=& r \times v_{\rm circ}\\
\end{eqnarray}
 \begin{eqnarray}
&=&r \times \sqrt{\frac{GM(r)}{r}}.
\end{eqnarray}
\begin{eqnarray}
&=&r \times \sqrt{\frac{GM(r)}{r}}.
\end{eqnarray}
For star particles, we follow Abadi et al. (Reference Abadi, Navarro, Steinmetz and Eke2003) and compare the component of the angular momentum in the z-direction with the angular momentum of a circular orbit of the same energy, J c(E). First, the total (kinetic plus potential) energy of each particle is computed. Since circular orbits maximise angular momentum, the maximum value of Jz for all particles with a given energy is taken as J c(E). In this case, the ratio Jz /J c(E) is confined to the interval [−1, 1], where negative values imply counter-rotation with respect to the total angular momentum of all baryonic particles within 10 kpc.
Two different methods for gas and star particles are used because of the nature of the methods themselves. The Abadi et al. method is more appropriate for N-body particles, where the energy is simply kinetic plus potential. Gas particles have an extra component (internal energy) which informs their dynamics. In this case, it is better to use the Scannapieco approach.
In Figure 5, we present histograms of Jz /J c(E) (left column, star particles) and Jz /J circ (right column gas particles) for the CDM (bottom row) and WDM (top row) simulations. In the CDM simulation, gas in both B and C clearly defines a very thin disc, while A’s gas is less ordered. Star particles, on the other hand, show a well-defined disc in C’s case, a ‘fat’ disc in B’s case, and no disc in A’s case.
The fraction of stellar (gas) particles within 10 kpc at z = 0 with a given ratio of Jz /Jc (E) (Jz /J circ) for the galaxies in haloes A (red), B (blue), and C (green). Particles with Jz /J circ≈1 are on circular orbits and thus compose a disc. Note that the gas particles nearly all constitute a disc, while star particles populate both disc and bulge components. The dip at Jz /J circ≈1 of the gas component of galaxy A is due to warping of the disc. The dotted green line indicates a decomposition into bulge and disc star particles for galaxy C.

In the WDM run, the gas particles of halo C appear to define a clear disc while haloes A and B have poorer gaseous discs. With respect to the stars we see a similar situation to the CDM case. Halo C has a disc component, B has a thicker disc and A has no real disc.
Due to the fact that halo A has a significative stellar bulge, the corresponding star particle histogram has been rescaled by a factor of four with respect to the stellar particle histogram of the other two galaxies, for both the CDM and WDM runs (the peak of the star component of halo A was 20 in both runs).
It is interesting to note that the discs of B and C are smaller in the WDM case than in the CDM case. This may again be a result of the delayed formation time of WDM haloes and the consequent lower mass. It is interesting that the bulge component (namely the peak at Jz /J c(E) = 0) seems to be roughly of the same size in both A and B.
Note that the dip at Jz /J circ≈1 in the gas distribution of A in the CDM simulation is due to a warping of the disc.
C is the only galaxy that, owing to its quiet merger history, forms a clearly identifiable stellar disc, decomposed in Figure 5 into bulge and disc components (see dashed lines). The total mass in each component is similar. In CDM, 44% and 56% of halo C’s galaxy is attributed to a bulge and disc, respectively. These fractions are nearly perfectly inverted in WDM: 45% and 55% of halo C’s stellar component are disc and bulge, respectively.
Although our sample size is small, we note that one of the more unanticipated consequences of haloes forming later in WDM is their smaller and thicker disc. Indeed this may simply be a reflection of the different dynamical environments of the two groups. More work on the relationship of disc thickness to DM particle mass is encouraged to see if one can constrain the other.
Since the dynamical decomposition indicates that the galaxies within each halo differ substantially, it is perhaps no surprise that so too do their star formation histories. Although not shown here, the star formation rate (being a reflection of the merger history) is quantitatively very different in the two cosmologies.
As expected (and seen elsewhere), our WDM simulation has far fewer satellites than our CDM simulation. WDM produces roughly the same number (~20) of subhaloes as satellites observed to be in orbit about the MW. However, it is unclear if, owing to feedback and other star formation suppression mechanisms, WDM subhaloes are luminous enough to match the MW’s satellite luminosity function.
5 SUMMARY AND DISCUSSION
Since the temperature of the DM particle at decoupling determines its ability to ‘free-stream’ out of potential wells, it also sets the scale at which structures are able collapse. In principle, this characteristic can be used to constrain DM to be either ‘cold’, ‘warm’, or ‘hot’. Hot DM, such as neutrinos which travel at relativistic speeds, was at first hailed as the solution to the DM problem but has now been effectively ruled out (Bertone, Hooper, & Silk Reference Bertone, Hooper and Silk2005) since it can escape most potential wells and prevent structures from formation via gravitational instability. CDM, on the other hand, moves non-relativistically and as such is able to collapse into objects as small as an Earth mass (Ishiyama, Makino, & Ebisuzaki Reference Ishiyama, Makino and Ebisuzaki2010). The prediction of small substructures embedded in larger objects is a generic feature of the CDM model and, since such objects are unobserved in the MW, this has led to the famed ‘missing satellite problem’ (Moore et al. Reference Moore, Ghigna, Governato, Lake, Quinn, Stadel and Tozzi1999; Klypin et al. Reference Klypin, Kravtsov, Valenzuela and Prada1999), often dubbed a crisis for CDM. Astrophysical processes (such as photoevaporation of star-forming gas due to UV radiation; see Benson et al. Reference Benson, Bower, Frenk, Lacey, Baugh and Cole2003) are invoked to inhibit the gas cooling into small subhaloes. These processes do not erase substructures, they simply ensure that they remain non-luminous. A large population of dark subhaloes detectable via gamma-ray emission from DM annihilation (Stoehr et al. Reference Stoehr, White, Springel, Tormen and Yoshida2003) or via strong gravitational lensing of background sources (Xu et al. Reference Xu2009) is thus predicted, albeit unobserved, in the MW halo.
As a result of the apparent failures of CDM in overproducing and hot DM in underproducing the number of dwarf satellites around the MW, WDM has recently been suggested and studied ( e.g. Bode et al. Reference Bode, Ostriker and Turok2001; Avila-Reese et al. Reference Avila-Reese, Colín, Valenzuela, D’Onghia and Firmani2001; Knebe et al. Reference Knebe, Devriendt, Mahmood and Silk2002, Reference Knebe, Arnold, Power and Gibson2008; Macciò & Fontanot Reference Macciò and Fontanot2010; Lovell et al. Reference Lovell2011; Macciò et al. Reference Macciò, Ruchayskiy, Boyarsky and Muñoz-Cuartas2013). In this paper, we have used a set of initial conditions that constrain scales unaffected by the nature of the DM to test the effect of the type of DM on a group of galaxies (i.e. ~1 Mpc). Within the scales that are still linear at z = 0 (the ‘local environment’), a group of galaxies that in CDM resembles the LG is re-simulated at high resolution, with gas dynamics. In the CDM run, this local group includes three galaxies that have the same mass, geometry, and kinematics as the MW, M31, and M33. Thus, our simulation allows us to study in detail the merger history and internal structure of these galaxies as well as their baryonic properties. Since the local environment has been kept identical, we can directly measure the effect the type of DM has on our CDM LG.
The main difference between our CDM and WDM simulations is that structure formation is delayed in WDM. This is a direct result of the suppression of small-scale power which, owing to the lack of mergers below the filtering mass, means that it takes longer for haloes to grow to a given mass. The greatest effect this has is to inhibit the collapse of a group of galaxies in WDM. All our results regarding the differences in the galaxies themselves follow directly from this main difference.
-
• A group of galaxies which at z = 0 closely resembles the LG in CDM is dynamically very different in WDM. Although in CDM the group is collapsing and is compact, in WDM it is still expanding and is much more diffuse.
-
• Delayed halo collapse implies that at z = 0 WDM haloes are smaller than their CDM counterparts.
-
• Baryons are more centrally concentrated in CDM versus WDM haloes.
-
• In one of the galaxies we simulated, a clearly identifiable disc is found. This is fatter and smaller in WDM, a consequence of it being younger and having more recent merger activity.
Our conclusions are all consequences of the delayed formation and collapse of haloes in WDM cosmologies with respect to CDM. This simple attribute, a direct result of the lack of small-scale power due to free streaming of DM at early times, informs a myriad of physical properties, from star formation rates to bulge/disc ratios to colours. One of the more intriguing findings of this work is the thickening of the one disc we formed (in halo C) in our WDM run. It remains to be seen if this is simply due to the unique dynamical history of this particular realisation or if WDM generically and systematically produces thicker discs than CDM.
ACKNOWLEDGEMENTS
NIL is supported through a grant from the Deustche Forschungs Gemeinschaft (DFG). ADC acknowledges the AIP – Leibniz-Institut für Astrophysik, where this work was partially carried out. AK is supported by the Spanish Ministerio de Ciencia e Innovación (MICINN) in Spain through the Ramon y Cajal program as well as the grants AYA 2009-13875-C03-02, AYA2009-12792-C03-03, CSD2009-00064, and CAM S2009/ESP-1496 and the Ministerio de Economía y Competitividad (MINECO) through grant AYA2012-31101. GY also acknowledges support from MINECO through research projects CSD2007-0050, AYA 2009-13875-C03-02, and AYA 2012-31101, and from Comunidad de Madrid through ASTROMADRID project (CAM S2009/ESP-1496). YH has been partially supported by ISF 1013/12. The simulations were performed and analysed at the Leibniz Rechenzentrum Munich (LRZ) and at the Barcelona Supercomputing Center (BSC).



