


Introduction
There are growing calls from think tanks and other organisations for reform of the UK tax system (Broome et al., Reference Broome, Corlett and Thwaites2023; Jung and Nanda, Reference Jung and Nanda2021; Robinson and Shorthouse, Reference Robinson and Shorthouse2022; Tax Policy Associates, 2024). The most recent General Election was marked by debate on particular taxes without consideration for the wider system (Institute for Fiscal Studies, 2024). As such, the Chancellor of the Exchequer, Rachel Reeves, simultaneously described the UK economy as being in its worst state since the aftermath of the Second World War, but also constrained Labour’s ability to fund regeneration by raising particular taxes. In contrast, the Labour Party of 1945 committed to implement largescale reform of Britain’s economy through a programme of capital investment in nationalisation of industry and infrastructure and ongoing redistribution through implementation of the Beveridge Report (Beveridge, Reference Beveridge1942). This provided decades of stability and growth (Common Sense Policy Group, 2024a, p. 15). However, the current Labour Government appears to be committed to a programme of renewed austerity due, both to its commitment to spending rules that are subject to economic criticism and to the belief that tax increases are not electorally feasible. The notion of taxation in general being unpopular is under-researched in a UK context. Whilst there is recognition of the role of special interests amongst specific sectors of the economy, the part played by the media – itself a special interest – and political expediency (Prabhakar, Reference Prabhakar2023), there are few studies of public opinion on transformative tax reform overall in the UK. There are, though, international studies that suggest support for increased taxation of wealth on the wealthiest members of society (Kalleitner and Bobzien, Reference Kalleitner and Bobzien2024; Mathisen, Reference Mathisen2024; Prabhakar, Reference Prabhakar2023; Rowlingson et al., Reference Rowlingson, Sood and Tu2021). Indeed, there is some evidence that partisan differences and income levels notably had little impact on support for progressive reform in this area (Barnes et al., Reference Barnes, De Romémont and Lauderdale2024).
After 14 years of intermittent austerity measures, on top of a further three decades of neoliberal reform, the UK is increasingly ‘a poor country with a few rich residents’ (Burn-Murdoch, Reference Burn-Murdoch2022). Productivity growth, measured as output per worker, has declined from 2.9 per cent per annum in the 1960s to 1.9 per cent in the 1980s to 0.7% in the 2010s (ONS, 2024b). Growth by gross domestic product (GDP) per head of the population has reduced from 2.8 per cent per annum in the 1950s to 0.5 per cent in the 2022s (ONS, 2022, 2024a). The UK’s high levels of inequality mean that average household incomes are some 10–12 per cent lower than in Germany and France (Shah and Thwaites, Reference Shah and Thwaites2023). This is due to long-term underinvestment in public and private sectors (Samiri and Millard, Reference Samiri and Millard2022), poor infrastructure (Mallows, Reference Mallows2023), low-skilled workforce (Brinkley and Crowley, Reference Brinkley and Crowley2017) and lack of innovation (Farmer and Gabriel, Reference Farmer and Gabriel2020), all exacerbated by inequality (Resolution Foundation, 2022) and climate change (IPCC, 2018). This all poses a real obstacle to Labour’s proposed means of improving standards of living, since, having committed to avoiding public investment, the Government is dependent on private investment for capital projects, trickle-down for wages and increases in tax yields (Reed et al., Reference Reed, Thew, Stark, Nettle, Johnson and Johnson2025). As such, Labour has committed to not introducing the very investment and reform that would produce the outcomes that they wish to achieve (Economic Affairs Committee, 2023). The consequence is also that the Government’s popularity is rapidly declining, despite belief that Labour needs to exercise financial restraint to survive in Government.
In this article, we report findings from a series of mixed-methods surveys conducted between November 2023 and January 2024 examining the nature and fluidity of public perception of a progressive programme of taxation reform designed to support highly progressive distributive outcomes, reducing poverty and inequality and investing in capital projects to repair Britain’s infrastructure. The full programme of investment is outlined in Act Now (Common Sense Policy Group, 2024a). We outline a series of findings from these survey data from UK residents that suggest high levels of support for progressive taxation reform overall, particularly where burdens are placed on wealth and business, significant impact from narratives, particularly on ‘haters’, and clear associations between risk of destitution and various other socio-economic characteristics, health status and levels of support. We present structural equation modelling (SEM) of these associations. We also report moderately strong positive correlations with levels of support for key infrastructural policies. Finally, we place these findings against the backdrop of elements of the Labour Government’s approach to reform, suggesting that the economic evidence on the need for progressive reform is complemented by public levels of support that suggest an electoral imperative. We begin by describing evidence on public opinion and set out the illustrative programme of reform and its impacts that we use to assess preferences.
What do people say they want from tax reform and why?
The tax system in the United Kingdom (UK) is multifaceted and is the key mechanism for revenue generation for both local and central government. The way in which the government then allocates the revenue has wide-ranging implications for society including in welfare, healthcare and education. The UK tax system is made up of both direct and indirect taxes. Direct taxes such as income tax and capital gains tax are paid directly by an individual or business on the basis of earnings. Council Tax in England and Wales is payable by residents to Local Authorities with fixed rates dependent on the 1991 estimate of the property value in which individuals reside. There are also indirect taxes, such as value added tax (VAT), which is paid on the majority of goods purchased. Some taxes, such as income tax, are progressive, such that higher earners pay more than lower earners, and others, such as VAT, are regressive, disproportionately impacting lower-earning households. The relative rates of income tax have reduced and VAT increased since the introduction of the latter in 1973 (Weston, Reference Weston2023). Further, taxes that tend to impact the wealthiest, such as those on capital gains and investment income, are the lowest taxed forms of income, further increasing the inequities in the tax burden amongst different socio-economic groups (Advani et al., Reference Advani, Ooms and Summers2024).
This shift in taxation has contributed to increased inequality of wealth (Kerr and Vaughan, Reference Kerr and Vaughan2024). The inequality that has increased steadily since the end of the post-war consensus in the late 1970s radically increased following the 2007/08 Global Financial Crisis and subsequent austerity measures and only decreased briefly during the coronavirus disease 2019 (Covid-19) pandemic due to state income support (Blundell et al., Reference Blundell, Dias, Cribb, Joyce, Waters, Wernham and Xu2022), before continuing to widen again (Francis-Devine, Reference Francis-Devine2024). Figures for the financial year 2021/22 show that the poorest fifth of the population paid 28.3 per cent of their disposable income in indirect taxes whilst the wealthiest fifth paid just 9% (ONS, 2023). The subsequent cost-of-living crisis and rising energy payments have placed additional financial strain on households (Nettle et al., Reference Nettle, Chevallier, de Courson, Johnson, Johnson and Pickett2023), with significant impacts on in-work poverty (Dorling, Reference Dorling2024). This disparity is more likely to impact those in precarious and low-paid employment, those with fewer assets and those with loans that are subject to fluctuating interest rates, all of whom are more likely to be younger than older (Khan and Blavo, Reference Khan and Blavo2022). Inequalities between age groups are exacerbated by respective security of pensions and income from passive wealth, the latter often supported by tax reliefs (Common Sense Policy Group, 2024a).
Successive reductions in rates of corporation tax, justified as means of attracting business, have failed on their own terms of growth, productivity and poverty reduction, whilst shrinking the UK’s tax base further. The Laffer-curve-inspired notion that tax revenue increases as tax rates reduce due to increased compliance by businesses has been shown to have contributed directly to reduced tax bases and increased inequality (Morgan, Reference Morgan2021). Indeed, recent Conservative Government fiscal reforms intended to increase disposable income and electoral support have failed to increase spending power amongst those groups that need that intervention most whilst also exacerbating the budget deficit. For example, the 2023 reduction in employee National Insurance contributions (NIC) by 4 per cent equated to a reduction of £900 a year for the average employee earning the median £35,400 per annum. Levels of wage stagnation and growing cost of living mean that the median worker is still much worse off than they were in 2010 after the NIC cut, but those below the median are much worse off still, since they benefit much less from the NIC rate change. With neoliberal fiscal reform having failed even on its own terms, the only alternative is much more substantive progressive reform to shift the burden away from the vast majority of the workforce.
A recent YouGov poll showed support for the protection of public services over tax cuts, but when asked about support with the cost-of-living crisis over spending to public services, people favoured individual support (YouGov, 2024a). This highlights that framing of proposed changes significantly affect perception of specific taxes and the introduction of basic income. A more recent poll following the General Election, undertaken in August 2024, continues to highlight that the public agree that public services should be protected, however, it did not show favour for tax increases, with only those impacting the wealthiest (such as top level income tax; corporation tax and capital gains tax) reaching a majority in favour (YouGov, 2024b). The National Centre for Social Research’s British Social Attitudes has measured public opinion on taxation and public spending since 1983, with fluctuations over time on whether a majority of the public support maintaining the status quo or increasing taxation and public spending (Butt et al., Reference Butt, Curtice and Clery2024). The longitudinal study shows a sharp contrast between public preferences and successive governments’ focus on tax cuts. The majority of the public have consistently opposed reductions to taxation and public spending, with support for being ≤10 per cent across all years, despite politicians consistently focussing on cuts to taxation or the threat of increases in electoral campaigns (Institute for Fiscal Studies, 2024). Whilst the majority supported no change to the status quo in the wake of the Global Financial Crisis of 2007/08, support for increases rose in 2016 after the impact of austerity measures introduced in 2010 by the Coalition Government began to be felt (Butt et al., Reference Butt, Curtice and Clery2024).
In this article, we seek to explore the nature, fluidity and bases of public perception of tax reform. To do this, we set out a programme of reform to serve as the basis for assessment.
Overview of reforms
To examine perception of tax reform, it was necessary to develop a substantive programme that would significantly increase tax base and yield; clearly focus on sources that do not exacerbate the cost-of-living, housing and other crises; redistribute resources from the wealthiest; and not diminish socially valuable and productive activity. Prior research on progressive taxation to fund redistributive social security mechanisms has highlighted the relative preference of UK residents for reforms that do not increase income tax from work or constrain non-committed income via VAT increases (Nettle et al., Reference Nettle, Chrisp, Johnson and Johnson2023). As such, we developed a programme that focussed on simplification, redistribution and shifting of burdens from work to wealth.
The programme begins by equalising rates of income tax across all sources of income, such as employment, self-employment, and critically, wealth (e.g. dividends), closing the fairness deficit faced by workers (Gov.uk, 2024). This is supplemented by an annual progressive tax of 2 per cent for wealth between £2m and £5m, 3 per cent between £5m and £10m, 4 per cent between £10m and £15m and so on up to 10 per cent for £40m+. The £2m threshold is significantly above any level at which wealth can be viewed as essential merely to life, with the progressive marginal rates extending prior work on wealth tax (Reed, Reference Reed2022). Principal residences are included to avoid a significant loophole, but payments are offset under a local property tax. This flat rate 0.7 per cent per annum property tax on current values replaces the more regressive council tax, with a double rate for second homes and empty properties (Fairer Share, 2023; Reed, Reference Reed2023). To mitigate capital flight and avoidance rates of 5 per cent for property wealth and 40 per cent for financial assets (Office for National Statistics, 2024), a tax on large financial transactions is implemented commensurate with the wealth tax rates. This means that, for example, £20m sent overseas across a 12-month period would incur 6 per cent in tax. To mitigate climate change contributing economic activity and achieve net zero (Millard, Reference Millard2023), we add a carbon tax of £55–60 per tonne in 2024, rising to £75 per tonne in 2030 and a permanent excess tax on fossil fuel companies combined with a redirection of current subsidies to fossil fuel producers (Burke et al., Reference Burke, Fankhauser, Kazaglis, Kessler, Khandelwal, Bolk and O’Boyle2020). This is complemented by reversing the cut to fuel duty, effectively returning the UK to the level it would have had if fuel duty had risen in line with inflation since 2010 (Office for Budget Responsibility, 2023), and adding a luxury consumption tax on private jets departing from the UK set at £780 per passenger per flight, which is ten times the current highest rate of Air Passenger Duty for domestic flights (Blom and Walsh, Reference Blom and Walsh2023; Chapman et al., Reference Chapman, Murray, Carpenter, Heisse and Prieg2021). We suggest reversing corporation tax reductions and raising to the same level as Germany, 30%, which has a higher rate of growth, productivity and equality (Bray, Reference Bray2023). This may actually increase inward investment and reduce dividend payments and share buy backs that increase private debt. Finally, a raft of poorly targeted, economically ineffective or morally indefensible tax reliefs are removed (HM Revenue & Customs, 2023; House of Commons Treasury Committee, 2023).
The full calculations for the tax reforms are publicly available (Reed, Reference Reed2024). Using the Landman tax-transfer model, the Institute for Innovation and Public Purpose’s (IIPP) central multiplier effect of capital investment of 2.74 over 5 years (Deleidi et al., Reference Deleidi, Iafrate and Levrero2019, Reference Deleidi, Iafrate and Levrero2020) and a conservative estimate of current spending impact on health and other public goods of one-third of capital spending (0.91) (Reed et al., Reference Reed, Johnson, Stark, Nettle, Pickett and Johnson2024), the overall programme is projected to raise £338.7bn per annum in the first year, leading to £514.6bn in productivity increases, with second round increases in tax yields of £205.9bn by the end of the 2024–2029 Parliament, meaning a total increase in tax yield of £544.6 per annum by year 5. This expansion of the tax base is sufficient to fund core investment to address the UK’s core infrastructural, climate change and social crises. This programme delivers, then, the outcomes to which the current Government is committed, but in ways that have been rejected in part for reasons of apparent lack of popularity. It is, then, precisely the sort of policy programme that is suitable for public opinion testing, which is the main focus of this article.
Methods
We followed the methods outlined in Johnson, Johnson and Nettle (Johnson et al., Reference Johnson, Johnson and Nettle2022; Johnson et al., Reference Johnson, Johnson, Reed and Nettle2023). These included adversarial co-production of narratives with opponents of policies to persuade people like them to support the policies. The narratives were then presented to a larger group of participants to establish levels of support for policies pre- and post-presentation of narratives. The use of narratives has been previously utilised in similar studies where the presentation of novel ideas, not in wide discussion, as well as providing real-world examples rather than abstract information, are required to gain understanding of support for policy reforms (François et al., Reference François, Lee, Roman and Maréchal2025; Sachweh and Eicher, Reference Sachweh and Eicher2025). Ethics approval was granted by the Faculty of Health Sciences Ethics Committee (5814). No identifying information was solicited.
Survey 1: Screener to assess initial level of support for policies
We conducted a 15-minute screening survey with 693 participants with Red Wall constituency postcodes, or due to platform limitations, area postcodes with a large proportion of Red Wall constituencies on Prolific, an online survey panel. ‘Red Wall’ constituencies are those in the North and Midlands of England and parts of Wales that were traditionally Labour voting but switched to, or came close to switching to, the Conservatives. They played an important role in the outcome of the 2019 General Election and voters in those areas therefore received significant attention from political parties (Johnson et al., Reference Johnson, Johnson and Nettle2022; Kanagasooriam and Simon, Reference Kanagasooriam and Simon2021; MacKinnon, Reference MacKinnon2020). We thus engaged with residents of those constituencies in narrative adversarial co-production and ensured that residents were represented within the final survey sample. There were three survey stages.
We presented brief, bullet-point outlines of proposals for tax reform (see supplementary file) and asked people to rate them on a 100-point sliding scale in which via a horizontal slider anchored with 0 = strongly disagree and 100 = strongly agree. This elicited very basic popularity data to enable identification of firm opponents of tax reform for adversarial co-production of narratives. Participants received £2 in compensation.
Survey 2. Adversarial co-production of narratives
We identified ten Red Wall opponents (≤20 levels of support for tax reform) from within the screening survey and invited them to develop narratives that elicit features of the policies to persuade residents like them of its merits. Participants produced written narratives (minimum 150 words) that we standardised for language, style and length (150 words + 10 per cent max). We co-produced four narratives (see supplementary file) around the most cohesive ideas expressed, using the text provided by participants to organise prose around four specific justificatory elements.
Absolute gains
These tax reforms are for the greater good of society, making society fairer, more equal and better off overall. Overall, taxing wealth and making people who benefit from tax reliefs pay more than they currently do will add more to the social pot and contribute to the health of the UK economy overall. By implementing these policies, we can help towards the infrastructure of society, leading to a healthier, happier country with more money to spend on essential services for the NHS, transport, housing and education. Giving back through these policies would enable us all to have a better life with better expectations from society and from our communities. No Britons should be hungry, worried about heating or be without a roof over their heads. The top 1% would never notice the additional tax and it would create a huge pot to be reinvested where it would make a difference. In an equal society, those that have more should help those who have less.
Relative gains
The current tax system disproportionately benefits the wealthiest. They can avoid taxes by paying themselves through dividends, they pay a lower proportion of Council Tax on their properties and they pay less tax on passive wealth than those of us who go out to work do on our income. The reforms will ensure that the richest pay more to close the gap for workers and that they cannot hide their money overseas without being taxed, removing the benefits they currently have. There is only so much money anyone needs to live a comfortable life and we now have a small number of people who have endless luxury whilst the rest of us who work hard struggle. Imagine the impact of a billionaire for once being forced to pay a fair share of wealth into tax. It would make a difference where it matters: taxing the wealthy more will close the gap, bringing workers towards a better quality of life.
Security
As the Covid-19 pandemic and impact of the war in Ukraine have shown, Britain is exposed to global insecurity. We need to increase taxation on the highest earners and reduce the burden on low-middle income workers to secure our society and the resilience of our public funds. Having more money in the Government pot will secure us against another shock to the country such as Covid and the impacts it had on our economy. We need a reliable source of funding by increasing tax on corporations that currently do not pay their way. These reforms bring multinational companies such as Amazon into line with UK companies by stopping them from using offshore tax havens such as Luxembourg. Introducing tax on large financial transactions also removes the insecurity of big corporations threatening to move their businesses overseas and sending money abroad without paying tax on transfers. Taxing businesses that contribute to climate change will also reduce floods, heatwaves and rising sea levels that are an increasing threat to Britain.
Environmental benefit
These reforms target those businesses and corporations that produce goods and services that cause pollution, use valuable natural resources in the production of said goods and reduce air quality with their gas-guzzling fleets of vehicles. Those that cause the harm should expect to pay back more into the environment and people that they have helped to damage, rather than profiting from their actions. We all have a responsibility towards the wellbeing of this planet because without it we cannot survive. Carbon taxes on large companies are fair insofar as they do not deter the businesses we need from setting up in this country, which include manufacturers of electric vehicles, batteries and renewable energy infrastructure. The companies that are currently profiting from the climate crisis are causing long-term costs to the economy that outweigh their current benefits. We need a new system that makes our economy sustainable and protects us in the process.
Participants received £5 remuneration for adversarial co-production.
Survey 3: Public opinion assessment
A final, 30-minute public opinion survey was conducted between 20 and 26 January 2024 with 2,200 adult UK residents. To ensure effective representation amongst Red Wall constituents, we first opened the survey to 916 residents with Red Wall postcodes or area postcodes with a large proportion of Red Wall constituencies. We then opened the survey to a further 1,305 participants across Britain. Participants were presented with a description of a series of areas of tax reform as one of ten policy areas (welfare reform (Stark et al., Reference Stark, Johnson, Ahmed, Kamalakannan, Reed, Flinders, Nettle, Johnson and Degerman2025), Green New Deal (Ardron et al., Reference Ardron, Stark, Meller, Reed, Johnson and Johnson2025), public utilities (Johnson et al., Reference Johnson, Johnson, Stark, Reed, Lee and Johnson2025), health and social care, childhood and early years, education (Hudson et al., Reference Hudson, Mulholland, Croft, Benton, Stark, Littlefair, Atkinson, Johnson, Reed, Johnson and Johnson2025), housing, transport (Littlefair et al., Reference Littlefair, Stark, Johnson, Atkinson, Reed, Johnson and Johnson2025), democratic reform, taxation) along with the impacts such reforms evidence indicates will follow from their implementation (Johnson et al., Reference Johnson, Johnson and Nettle2024). Participants were asked to rate their opposition or support to those policies on a scale of 0–100. They were then shown a randomised adversarially co-produced narrative and asked to rate its persuasiveness on a scale of 0–100 and then to rate their opposition or support for the policy again on a scale of 0–100. Participants were then asked to provide basic demographic data, socio-economic data, including self-rating status on the MacArthur ladder of subjective socio-economic status (Adler et al., Reference Adler, Epel, Castellazzo and Ickovics2000), and perceived risk of destitution on a 100-point sliding scale, health status, including Depression PHQ-8 (Kroenke et al., Reference Kroenke, Spitzer and Williams2001), Anxiety GAD7 (Spitzer et al., Reference Spitzer, Kroenke, Williams and Löwe2006), single-item life satisfaction (Guney et al., Reference Guney, Kalafat and Boysan2010; Mamani-Benito et al., Reference Mamani-Benito, Esteban, Castillo-Blanco, Caycho-Rodriguez, Tito-Betancur and Farfán-Solís2022), political affiliation, voting intention and faith in politicians established by six items in prior project iterations (Johnson et al., Reference Johnson, Johnson, Reed and Nettle2023). Participants received £4.50 in remuneration.
Data analysis
Data were analysed using Julia; 212 responses were removed on account of being incomplete. Relative to General Election voting intention in January 2024, our remaining sample over-represented people who voted as compared with not voting, over-represented Labour voters and under-represented Conservative voters.
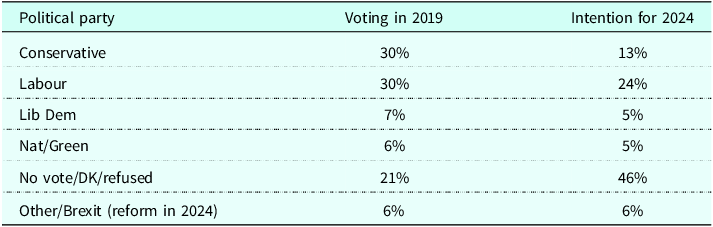
In the statistical analyses that follow, we have therefore applied post-stratification weights that make our sample representative of age and contemporary voting intention as of 26 January 2024, which recorded the following: Labour 45%, Conservatives 24%, Reform 11%, Lib Dems 10%, Greens 6%, SNP 3% and Plaid 1% (Politico, 2024). We excluded NI parties and independents for the sake of simplicity. Categorical variables were contrast coded, and continuous variables scaled. The distribution of residuals for all models was satisfactory. All p-values are two sided. Our confirmatory predictions were that those who strongly rejected tax reform would be homeowners, express low risk of destitution on scale of 0–100 (<30) and intend to vote Conservative in 2024. The rest of the analyses are considered exploratory.
We also used structural equation modelling (SEM) in R package lavaan (Rosseel, Reference Rosseel2012). We followed our previous examination of welfare reform (Johnson et al., Reference Johnson, Johnson, Reed and Nettle2023) in presenting the following latent variables: socio-economic position, indexed by perceived risk of destitution and self-placement on the MacArthur SES ladder; mental distress, indexed by the (square-root transformed) PHQ depression score, the (square-root transformed) GAD anxiety score and the sense of being in control of life; and faith in government, indexed by the six items described earlier. Our model specified that these latent variables, plus age, could directly influence support for tax reform. We further specified that socio-economic position could have indirect influences on support for tax reform via mental distress on the one hand (with mental distress hypothesised to increase support) and cynicism about the government (with cynicism about the government hypothesised to reduce support) on the other. Our model allowed for covariances between mental distress and cynicism about government and age and socio-economic position.
Results
Participant demographic characteristics
The sample was 51 per cent female, 48 per cent male and 1 per cent who described themselves in another way; 85 per cent of respondents identified as white, slightly higher than in the 2021 England and Wales Census (81.7 per cent), and 15 per cent identified as belonging to other ethnic groups, slightly lower than the same Census (20.3 per cent), whilst the median age was 48.00 (mean 47.96, SD 16.74), higher than in the 2021 England and Wales Census (Office for National Statistics, 2022). The median annual non-equivalised household income was £34,000, higher than the national median income for the year ending 2023 of £32,500 (Department for Work and Pension, 2024). Participants reported a mean score of 26.85 for risk of destitution, with 0 representing extremely low risk and 100 extremely high risk. The mean MacArthur ladder score was 5.30, with 1 representing the worst off in society and 10 the best off. The mean average control of life score was 61.41, where 0 means completely out of control and 100 means completely in control. The mean life satisfaction score was mean 61.63, where 0 means completely dissatisfied and 100 completely satisfied. The average GAD-7 score fell within the 5–9: mild anxiety category (Sapra et al., Reference Sapra, Bhandari, Sharma, Chanpura and Lopp2020). The average PHQ-8 score fell below the minimum threshold for depression (Kroenke et al., Reference Kroenke, Strine, Spitzer, Williams, Berry and Mokdad2009). Participants indicated that they sat broadly in the middle of a left–right 100-point ideological scale (supplementary table 1).
Pre-treatment levels of support
Initial overall level of support for tax reform was high, regardless of treatment (mean 64.40, median 70.00, SD 27.69). A large proportion of respondents – whom we term lovers – expressed strong pre-treatment support (≥70, 46.64 per cent). A small proportion – haters – expressed strong opposition (≤30, 12.94 per cent); 11.89 per cent chose 100 on the scale, whilst just 2.68 per cent chose 0 (supplementary table 2).
There were statistically significant differences in pre-treatment support by voting intention (supplementary table 4). Relative to those who reported being female, white British, not working and intending to vote Conservative (p < 0.001), Labour (p < 0.001), Liberal Democrat (p < 0.001,), Green/SNP/Plaid Cymru (p < 0.001), Reform Party (p < 0.001) or not intending to vote (p < 0.001), voting intention was associated with higher levels of support for progressive tax reform.
Political preferences

Associations for ethnicity, region of residency and gender identity were not statistically significant. However, older age (p < 0.001), higher socio-economic status and better health were significant predictors of lower levels of support for reform. Higher household income (p = 0.004), home ownership (p < 0.001) and being somewhat satisfied (p < 0.001), mostly satisfied (p < 0.001) and completely satisfied (p = 0.005) with income, higher MacArthur ladder (p < 0.001) score and being in good health (p < 0.001) were predictors of lower levels of support. Conversely, dissatisfaction with income (p < 0.001), low life satisfaction (p < 0.001), low MacArthur ladder score (p < 0.001), higher risk of destitution (p < 0.001), high risk of destitution (≥70/100) (p < 0.001) and not managing well financially (p < 0.001) were significant predictors of higher levels of support. Reporting bad and very bad health (p = 0.003), higher anxiety scores (GAD-7) (p < 0.001) and depression (PHQ-8) (p < 0.001) were also significant predictors of higher levels of support.
Structural equation modelling
As discussed in methods, we fitted the SEM shown in Figure 1 to the data, collapsing across narrative conditions. The comparative fit index was 0.92; >0.90 is generally taken to indicate adequate model fit (Bentler, Reference Bentler1990). The root mean square error of approximation (RMSEA) statistic was 0.07; <0.05 is generally taken to indicate a very good fit and <0.10 reasonable fit (Fan et al., Reference Fan, Thompson and Wang1999).
Structural equation model predicting support for tax reform. Boxes show measured variables, and ovals inferred latent variables.

Standardised model parameters are shown in Figure 1 (for full model output see supplementary table 7). The modelling strongly supports prior work asserting the relationship between socio-economic status and anxiety and depression (Nettle et al., Reference Nettle, Chevallier, de Courson, Johnson, Johnson and Pickett2024; Parra-Mujica et al., Reference Parra-Mujica, Johnson, Reed, Cookson and Johnson2023; Villadsen et al., Reference Johnson, Cookson and Johnson2023) and policy preferences (Howard et al., Reference Howard, Gregory, Johnson, Goodman, Coates, Pickett and Johnson2023, Reference Howard, Gregory, Johnson, Goodman, Coates, Robson, Pickett and Johnson2024; Johnson et al., Reference Johnson, Johnson, Reed and Nettle2023). Socio-economic position affected support for progressive tax reform via three separate pathways. Lower socio-economic position directly led to greater support with a weak negative coefficient. Lower socio-economic position was strongly associated with more mental distress, and more mental distress was weakly associated with greater support for tax reform. Finally, lower socio-economic position was associated with greater cynicism about the government, which in turn weakly reduced support for the policy, with lower socio-economic position reducing support for the policy via its effects on cynicism about government but increases support directly and via its effects on mental distress. There was also a significant association between age and support for the policy (support decreasing with age), independent of the effects of age on socio-economic position, mental distress and cynicism about the government. This is partially explained by the association between age and distress, such that older participants were less likely to be distressed.
Narrative treatment and change in policy approval
As Figure 2 shows, there was evidence of a statistically significant narrative treatment effect on support for tax reform on participants overall, which increased by 3.74 points (p = 0.001) on average. There was a significant 1.21 point (p = 0.0176) increase in support amongst pre-treatment lovers. There was a large and strongly significant increase in support amongst pre-treatment haters of 6.11 points (p < 0.001). The percentage of 0 scores reduced to 2.34 and the percentage of 100 scores increased to 14.73 (see supplementary table 3).
Scattergram of change in tax preferences from pre-treatment score (<95).

Figure 3 outlines the changes in levels of support by quintiles. There was a reduction in the proportion of those who completely disagree (2.68–2.33 per cent), mostly disagree (10.26–9.39 per cent) and were mostly neutral (35.83–30.36 per cent) and an increase in those who mostly agree (39.33–43.18 per cent) and completely agree (11.90–14.74 per cent).
Change in percentages of support for democratic reform pre–post treatment by support categories (i.e. changes from completely disagree to mostly disagree, etc.).

The average change in support by narrative was 3.764 for absolute gains, 5.604 for relative gains, 4.251 for security and 1.251 for environmental benefit. Taking absolute gains as the reference category, the relative gains (p = 0.017) narrative produced a higher change in score and environmental benefit (p < 0.001) a lower change. The security narrative did not differ significantly from absolute gains (see supplementary table 6). Although the sample size is small and ought to be understood in that context, haters rated relative gains (mean 26.90, median 23.64) more highly than environmental benefit (mean 19.89, median 15.26) (see supplementary table 3).
Levels of support for progressive tax reform compared with levels of support for infrastructural investment
Levels of support for tax reform were compared with levels of support for the clearly redistributive Green New Deal and reform to transport (for description of policies please see (Johnson et al., Reference Johnson, Johnson and Nettle2024)). As Figures 4 and 5 show, results suggest that the more individuals support clearly redistributive reforms such as a Green New Deal and transport policy, the more they support progressive tax reform. Support for tax reform was moderately positively correlated with a Green New Deal (r(1986) = 0.51, p < 0.001) and moderately positively correlated with transport reform (r(1986) = 0.44, p < 0.001).
Scattergram of pre-treatment preferences for reform to tax and a Green New Deal mapped by voting intention.

Scattergram of pre-treatment preferences for reform to tax and transport mapped by voting intention.

Public finances and reform
The findings presented are necessarily subject to contextualisation of online survey participation. The panel overrepresents Labour voters and younger participants. However, data appear supported by broader trends from other public opinion measures (YouGov, 2024b, 2025). The strength of the evidence presented is that it suggests a consistent degree of support for progressive reform that is consistent with previous studies on the role of economic insecurity – risk of destitution – in driving preferences (Joseph Rowntree Foundation, 2025). The evidence suggests that there is scope for a more ambitious programme of reform to make good on the Government’s own intention to use investment to promote improved public services, national renewal and economic growth (Reeves, Reference Reeves2024). However, the Government’s thinking appears heavily constrained by inherited assumptions based on debunked analysis and a 15-year legacy of failure that those assumptions created. It has claimed to break out of the failure to invest, but the lack of substantive investment (Office for Budget Responsibility, 2024), and then pursuing further austerity measures, has expended the entirety of its borrowing headroom (Reed et al., Reference Reed, Thew, Duffy, Stark, Nettle, Pickett, Johnson and Johnson2025). It has recognised the harm to public services, but produced a current spending settlement that comes nowhere near to correcting the cuts made since 2010, and in fact may well represent a further cut to the majority of departments. Its tax changes largely continue the long-term approach of pursuing obscure and unnecessarily complex reforms (Common Sense Policy Group, 2024b). Indeed, new evidence on spending multipliers indicates that failure to invest in both current and capital spending is unaffordable, with real-terms cuts reducing both growth and tax yields (Reed et al., Reference Reed, Thew, Duffy, Stark, Nettle, Pickett, Johnson and Johnson2025).
The findings on public opinion are consistent with previous studies (Nettle et al., Reference Nettle, Chrisp, Johnson and Johnson2025). The levels of support are high and increase further as people are presented with additional justification in the form of narratives. The narratives that appear most impactful are those that make salient people’s material interests to their own circumstances. Focussing on benefit of reform to benefit the whole population are most popular and impactful overall, but those that focus on redistribution are more impactful for ‘haters’. This provides further evidence that people’s public policy preferences are influenced more by material circumstances and the prospective impact of policies on outcomes than by abstract values. This supports a consequentialist, rather than deontic, understanding of preferences (Johnson et al., Reference Johnson, Johnson and Nettle2022). This suggests that policymakers wishing to introduce more progressive tax reform are able to persuade even those fundamentally opposed to reform to be less hostile, as well as increasing levels of support overall.
Importantly, perceived risk of destitution, in particular, predicts stronger support for tax reform. Part of this association is mediated by psychological distress (depression, anxiety and lack of perceived control). There were strong associations in our data between perceived risk of destitution and psychological distress. This complements recent findings in the Changing Cost of Living Study, which found that increases in financial insecurity have immediate impacts on anxiety and depression (Nettle et al., Reference Nettle, Chevallier, de Courson, Johnson, Johnson and Pickett2023). Greater psychological distress in turn increased support for tax reform. Thus, risk of destitution motivates support for progressive socio-economic policies in part potentially because people recognize that the policy offers means of alleviating distress caused by risk of destitution.
However, greater risk of destitution is also associated with lower levels of faith in government, possibly because risk of destitution is perceived as stemming from failure in policy.
Lower faith in government in turn was associated with reduced support for tax reform, perhaps because people believe that government is incapable of implementing policy in ways that enhance their interests, with prior studies highlighting that trust in government is instrumental in predicting support for reform (Witko and Moldogaziev, Reference Witko and Moldogaziev2025). This also supports our previous findings on welfare reform, which indicated that a ‘downward spiral’ of increasing inequality can promote cynicism in ways that foster further inequality (Johnson et al., Reference Johnson, Johnson, Reed and Nettle2023). However, as in that article, we find few reasons to be fatalistic about its impacts: those exposed to greater risk of destitution are attracted to redistributive tax reform. The cost-of-living crisis has highlighted the threat to financial security not from increased taxation, but from rising costs of essentials that are currently provided largely by the private sector.
The problem, however, is that the Chancellor is committed to the very de facto austerity measures and regressive tax-benefit reforms that induce cynicism and drive support for populist right-wing parties, such as Reform. This is reflected in polling. Whilst Labour’s majority means that the Chancellor has been able to implement policies that disregard polling, increasing recognition amongst Labour MPs of declining public support for the Government and increasing threats to their re-election mean that internal opposition is growing, stifling capacity for even greater regressive reforms (Reed et al., Reference Reed, Thew, Duffy, Stark, Nettle, Pickett, Johnson and Johnson2025). The economic evidence above on the impact of progressive tax reform are now being met with calls from senior Labour figures for wealth tax (Walker, Reference Walker2025), in part because of public support. The evidence in this article suggests that there are few compelling public opinion reasons not to advance such policies.
Conclusions
This article presents further new evidence that substantive reform to tax is feasible, affordable and popular. Exposure to risk of destitution is a key determinant of policy preference at a time in which political affiliation is increasingly fluid. It is likely that differences in voting pattern by age may reflect the different degrees of exposure to risk of destitution as well as form of media consumption, with older residents more likely to hold assets, be in receipt of predictable income and to read right leaning newspapers. Our findings suggest very clear avenues to reform via narrative development that tie material interests to the specific policy in question. Given the importance of tax reform to enhancing financial security, it is worth reflecting on possible new economic rather than financial rules (Reed et al., Reference Reed, Thew, Stark, Nettle, Johnson and Johnson2025). There is both economic value and prima facie public support for projected economic outcomes that are concerned directly with the impact of spending and tax reform on poverty and inequality, public sector net worth, and in the longer term, a public sector net debt as a result of increased tax yields from investments in infrastructure and manufacturing. These economic rules offer clearer pathways to producing the increased financial security that UK residents need and want (Common Sense Policy Group, 2024b).
Supplementary material
The supplementary material for this article can be found at https://doi.org/10.1017/S0047279425101268
Data availability statement
All data is cited in text and is publicly available.
Acknowledgements
The authors wish to express their sincere gratitude to Daniel Nettle for his contribution to design of the surveys, development of methods, analysis of data and feedback on reporting.
Competing interests
Howard Reed is Director of Landman Economics. Graham Stark is Director of Virtual Worlds. The remaining authors declare no competing interests.
Ethical standards
This study has been approved by the Faculty of Health and Life Sciences ethics committee, Northumbria University (5814). This committee contains members who are internal to the Faculty. This study was reviewed by members of the committee, who must provide impartial advice and avoid significant conflicts of interests.


 Open access