


INTRODUCTION
Radiocarbon (14C) dating is a powerful tool for establishing accurate chronologies of sediments from lacustrine archives. The material used for analysis needs to be of terrestrial origin in order to avoid reservoir effects (Lanting and van der Plicht Reference Lanting and van der Plicht1998). In dating lake sediments this becomes an important factor, as the mixed aquatic and terrestrial composition of organic matter has to be resolved (Andree et al. Reference Andree, Oeschger, Siegenthaler, Riesen, Moell, Ammann and Tobolski1986; Zimmerman and Myrbo Reference Zimmerman and Myrbo2015; Schiller et al. Reference Schiller, Whitlock, Elder, Iverson and Abbott2020). Dating of terrestrial macrofossils (e.g., leaves, seeds, and twigs) separated/picked from organic remains preserved in sediment became feasible with the advent of accelerator mass spectrometry (AMS) in the 1970s (Hellborg and Skog Reference Hellborg and Skog2008). This method requires only few milligrams of organic matter and revolutionized the 14C dating of lake sediments that contain terrestrial macro-remains. More recently, the use of a gas ion source has become increasingly popular, enabling the analysis of even smaller sample sizes down to a few tens of micrograms of carbon (Ruff et al. Reference Ruff, Fahrni, Gäggeler, Hajdas, Suter, Synal, Szidat and Wacker2010; Fahrni et al. Reference Fahrni, Wacker, Synal and Szidat2013; Wacker et al. Reference Wacker, Fahrni, Hajdas, Molnar, Synal, Szidat and Zhang2013; Szidat et al. Reference Szidat, Salazar, Vogel, Battaglia, Wacker, Synal and Türler2014; Welte et al. Reference Welte, Hendriks, Wacker, Haghipour, Eglinton, Günther and Synal2018). Simultaneously to the development of AMS dating, the separation of pollen grains from bulk lacustrine sediments was proposed. These pollen grains were successfully dated in sediments where few or no terrestrial plant macrofossils are present (Brown et al. Reference Brown, Nelson, Mathewes, Vogel and Southon1989; Regnéll Reference Regnéll1992; Regnéll and Everitt Reference Regnéll and Everitt1996; Wohlfarth et al. Reference Wohlfarth, Skog, Possnert and Br1998). This is particularly important for large lakes situated in semi-arid climates with limited vegetation cover (Zimmerman and Myrbo Reference Zimmerman and Myrbo2015; Zimmerman et al. Reference Zimmerman, Brown, Hassel and Heck2019).
Current methods of extracting fossil pollen include chemical and mechanical pretreatment (Brown et al. Reference Brown, Farwell, Grootes and Schmidt1992, Reference Brown, Nelson, Mathewes, Vogel and Southon1989; Richardson and Hall Reference Richardson and Hall1994; Zhou et al. Reference Zhou, Donahue and Jull1997; Kilian et al. Reference Kilian, van der Plicht, van Geel and Goslar2002; Vandergoes and Prior Reference Vandergoes and Prior2003), heavy fluid solutions (Regnéll and Everitt Reference Regnéll and Everitt1996; Chester and Prior Reference Chester and Prior2004; Piotrowska et al. Reference Piotrowska, Bluszcz, Demske, Granoszewski and Heumann2004; Newnham et al. Reference Newnham, Vandergoes, Garnett, Lowe, Prior and Almond2007), and manual picking of the pollen grains (Long et al. Reference Long, Davis and de Lanois1992; Mensing and Southon Reference Mensing and Southon1999; Schiller et al. Reference Schiller, Whitlock, Elder, Iverson and Abbott2020). However, they all have significant disadvantages regarding the trade-off between effort (i.e., processing time) and purity of fossil pollen samples prepared for 14C dating.
The latest research has shown that the 14C analysis of pollen separated by flow cytometry has become feasible but is not routine, yet (Tennant et al. Reference Tennant, Jones, Brock, Cook, Turney, Love and Lee2013a; Holt and Bennett Reference Holt and Bennett2014; Zimmerman et al. Reference Zimmerman, Brown, Hassel and Heck2019; Tunno et al. Reference Tunno, Zimmerman, Brown and Hassel2021). Flow cytometry allows a straightforward and fast differentiation/isolation of heterogeneous material based on scattered light and fluorescence properties (Fulwyler Reference Fulwyler1965; Mitsumoto et al. Reference Mitsumoto, Yabusaki and Aoyagi2009; Tennant et al. Reference Tennant, Jones, Brock, Cook, Turney, Love and Lee2013a, Reference Tennant, Jones, Love and Lee2013b). Previous approaches of pollen dating focus primarily on the separation of large pollen grains (e.g., conifer pollen) and a relatively homogeneous pollen composition (Tennant et al. Reference Tennant, Jones, Brock, Cook, Turney, Love and Lee2013a; Zimmerman et al. Reference Zimmerman, Brown, Hassel and Heck2019; Tunno et al. Reference Tunno, Zimmerman, Brown and Hassel2021). Conifer pollen grains can be separated easily from non-pollen detritus and, due to their grain size, a low amount of pollen grains is needed to yield a sufficient initial mass for AMS 14C dating. For semi-arid climate archives such as Lake Van in Eastern Anatolia (Turkey, e.g., Wick et al. Reference Wick, Lemcke and Sturm2003; Litt et al. Reference Litt, Krastel, Sturm, Kipfer, Örcen, Heumann, Franz, Ülgen and Niessen2009) in which only a small amount of conifer pollen is preserved, it is necessary to develop an approach that allows precise dating of significantly smaller-sized terrestrial pollen and spores.
In this paper, we present a novel and innovative revised method enabling rapid purification of fossil small to medium-sized pollen and bryophyte spores for AMS 14C dating based on flow cytometry after Tennant et al. (Reference Tennant, Jones, Brock, Cook, Turney, Love and Lee2013a). This method in general has the potential to become a reliable and widely used tool in Quaternary geology that facilitates precise dating of sediments, regardless of their palynomorph composition.
MATERIAL AND METHODS
Study Area
Lake Van (Figure 1), situated on the Eastern Anatolian high plateau (38.6°N, 42.8°E), is the world’s largest soda lake (pH 9.8) with a maximum extension of 130 km and a water depth of approximately 460 m (e.g., Degens et al. Reference Degens, Wong, Kempe and Kurtman1984; Kempe et al. Reference Kempe, Kazmierczak, Landmann, Konuk, Reimer and Lipp1991; Kadioğlu et al. Reference Kadioğlu, Şen and Batur1997). The sediment cores used for this study were drilled at the Ahlat Ridge in the western part of Lake Van in 2004. In total, 34 sediment cores were recovered from three parallel sites using a Deep-Water Percussion-Style Piston Corer (UWITEC) and stored at the Institute of Geosciences (Bonn) (Litt et al. Reference Litt, Krastel, Sturm, Kipfer, Örcen, Heumann, Franz, Ülgen and Niessen2009). A composite profile with a maximum length of approximately 9 m was constructed from the Van04-2 sediment cores, based on magnetic susceptibility and 16 distinctive volcanic ash deposits, encompassing the entire Holocene to the Late Pleistocene (Litt et al. Reference Litt, Krastel, Sturm, Kipfer, Örcen, Heumann, Franz, Ülgen and Niessen2009). Using stable oxygen isotope stratigraphy (δ18O) and pollen analysis, the Pleistocene-Holocene transition was determined at a depth of 388.7 cm by Litt et al. (Reference Litt, Krastel, Sturm, Kipfer, Örcen, Heumann, Franz, Ülgen and Niessen2009). In general, the Holocene lake sediments consist of laminated clayey silts (Wick et al. Reference Wick, Lemcke and Sturm2003; Litt and Anselmetti Reference Litt and Anselmetti2014; Litt et al. Reference Litt, Pickarski, Heumann, Stockhecke and Tzedakis2014; Stockhecke et al. Reference Stockhecke, Kwiecien, Vigliotti, Anselmetti, Beer, Çağatay, Channell, Kipfer, Lachner and Litt2014).
Bathymetric map of Lake Van in Eastern Anatolia (Turkey). Lake Van is an endorheic lake in a tectonic basin, surrounded by two volcanos (Süphan Dağı and Nemrut Dağı). The Ahlat Ridge drilling site, a sublacustrine slope (at 375 m water depth), is located between the Northern Basin and the Tatvan Basin in the center of the lake.

Terrestrial pollen grains, used for AMS 14C measurements, are continuously abundant throughout the Lake Van sedimentary record (Litt et al. Reference Litt, Pickarski, Heumann, Stockhecke and Tzedakis2014 and following studies). The pollen composition is important for the optimal preparation of the sediment samples for separation. Eastern Anatolia is characterized by a semi-arid, dry continental climate (Wick et al. Reference Wick, Lemcke and Sturm2003; Çağatay et al. Reference Çağatay, Öğretmen, Damcı, Stockhecke, Sancar, Eriş and Özeren2014; Litt and Anselmetti Reference Litt and Anselmetti2014; Litt et al. Reference Litt, Pickarski, Heumann, Stockhecke and Tzedakis2014). Previous palynological studies on the vegetation history describe a characteristic shift of the Artemisia-chenopod steppe vegetation to sub-Euxinian, oak-dominated steppe forests at the Holocene-Pleistocene transition (e.g., Wick et al. Reference Wick, Lemcke and Sturm2003; Litt et al. Reference Litt, Pickarski, Heumann, Stockhecke and Tzedakis2014). Aboreal pollen composition is dominated by various oak species (Quercus calliprinos, Q. robur, and Q. brantii), Pistacia atlantica, Juniperus oxycedrus and Betula, which can account for up to 50% of all terrestrial pollen grains in the sample (Wick et al. Reference Wick, Lemcke and Sturm2003; Litt et al. Reference Litt, Krastel, Sturm, Kipfer, Örcen, Heumann, Franz, Ülgen and Niessen2009, Reference Litt, Pickarski, Heumann, Stockhecke and Tzedakis2014; Pickarski et al. Reference Pickarski, Kwiecien, Langgut and Litt2015b). Small, spherical, pale moss spores (Bryophyta) were regularly detected throughout the Holocene sediments as well as during past interglacial periods (Pickarski et al. Reference Pickarski, Kwiecien, Djamali and Litt2015a; Pickarski and Litt Reference Pickarski and Litt2017).
Sampling
A total of 11 sediment samples were used in this study. The sampling was focused in Holocene sediments, which are generally characterized by a relatively high pollen concentration (> 20,000 grains/cm3) compared to the Pleistocene (< 15,000 grains/cm³) (Litt et al. Reference Litt, Krastel, Sturm, Kipfer, Örcen, Heumann, Franz, Ülgen and Niessen2009). The sediment samples were taken directly above and below five volcanic ash layers (V-1, V-2, V-3b, V-6, and V-7; Table 1), which serve as marker layers to ensure the correlation between the three parallel cores. The total sediment volume of each sample (6 × 3 × 2–3 cm) varies between 10 to 28 cm³ (Table 1). Due to the low concentration of large conifer pollen (<5%) in the Lake Van vegetation (Litt et al. Reference Litt, Krastel, Sturm, Kipfer, Örcen, Heumann, Franz, Ülgen and Niessen2009; Wick et al. Reference Wick, Lemcke and Sturm2003), this relatively large sample volume was necessary in order to date small-sized pollen grains with similar precision to that of conifer pollen (Yamada et al. Reference Yamada, Omori, Kitaba, Hori and Nakagawa2021).
Sampling points, sediment volume (cm3) and used approach for AMS dating.

1 Two different sorting approaches: “undifferentiated – high fluorescence” (UHF) and “differentiated” (separation of “pollen” and “spores”).
Chemical Pretreatment
According to Tennant et al. (Reference Tennant, Jones, Brock, Cook, Turney, Love and Lee2013a) and Faegri and Iversen (Reference Faegri and Iversen1989), the standard chemical pretreatment for high-purity pollen samples includes HCl, NaOH, HF, HNO3, and sieving. In this study, we present a revised preparation method of Tennant et al. (Reference Tennant, Jones, Brock, Cook, Turney, Love and Lee2013a) due to the semi-arid vegetation composition with a focus on small-sized pollen grains and large initial sediment volume (Figure 2). The modified chemical treatment includes HCl (20 mL, 3.2 M for 10–15 min at room temperature) and HF (15 mL, 22.7 M for 3 days at room temperature) for the removal of carbonates and silicates. All chemical reactions were performed in 50 mL polypropylene centrifuge tubes with gentle stirring. In contrast to the standard ABA (acid-base-acid) procedure after Tennant et al. (Reference Tennant, Jones, Brock, Cook, Turney, Love and Lee2013a) the use of alkaline solutions (e.g., NaOH) was omitted due to the absence of coarse organic material in the sediments (Litt et al. Reference Litt, Krastel, Örçen and Karabiyikoglu2007; Litt et al. Reference Litt, Krastel, Sturm, Kipfer, Örcen, Heumann, Franz, Ülgen and Niessen2009; Stockhecke et al. Reference Stockhecke, Kwiecien, Vigliotti, Anselmetti, Beer, Çağatay, Channell, Kipfer, Lachner and Litt2014). After each stage of the modified ABA methodology, the samples were centrifuged (10 min at 3500 rpm), the supernatant decanted and the residuum rinsed with ultrapure water (0.055 µS).
Flow chart of the preparation steps for pollen dating consists of three parts: (1) chemical preparation of the sediment samples, (2) cytometric analysis of the pollen samples, and (3) AMS dating. The chemical processing is a shortened form of the processing according to Tennant et al. (Reference Tennant, Jones, Brock, Cook, Turney, Love and Lee2013a) and Faegri and Iversen (Reference Faegri and Iversen1989).

As an alternative to standard acetolysis, which can potentially introduce modern carbon into the sample, nitric acid (HNO3) can be used to remove the cellulosic components of the pollen wall (Descolas-Gros and Schölzel Reference Descolas-Gros and Schölzel2007; Tennant et al. Reference Tennant, Jones, Brock, Cook, Turney, Love and Lee2013a). In order to test the influence of HNO3 on the degradation of the fossil pollen and its fluorescence, we split sample CT6-1, taken directly above tephra layer V-6, and treated one half with HNO3 (10 mL, 2.2 M) for 5 min at room temperature, and omitted this step for the other half. Furthermore, we tested whether the use of HNO3 and the accompanying removal of the internal cellulose of the pollen wall ameliorates the fluorescence-based identification of pollen grains during the cytometric analysis and allows for the separation of pure pollen concentrates. Therefore, both samples were analyzed and separated using flow cytometry.
In order to facilitate the cytometric analysis, an efficient fine sieving of the sediment sample is crucial to prevent clogging of the machine. Since the diameter of the most abundant Lake Van pollen species range from 18 µm (Artemisia) to 66 µm (Poaceae, incl. Cerealia-type), the sediment was sieved using a 53 µm and a 10 µm gauze.
Flow Cytometry and Fluorescence Activated Cell Sorting
The cytometric experiments were carried out at the Flow Cytometry Core Facility at the University Hospital of Bonn, Germany (UKB) and the German Research Centre for Geosciences in Potsdam, Germany (GFZ). Both institutes use a BD FACSAriaTM III (Becton, Dickinson and Company, USA) high-speed digital sorter equipped with solid-state lasers with an excitation wavelength of 405 nm, 488 nm, 561 nm, and 640 nm. The use of emission filters enables a detectable wavelength range from 450 ± 25 nm to 780 ± 30 nm. However, the emission filters used for the sorting focus on the wavelength ranges of 450 ± 25 nm and 510 ± 25 nm. The device at the UKB is operated using water-based phosphate buffered saline (PBS), whereas the GFZ uses standard BD FACSFlowTM (97.8% water, NaCl, KCl, KH2PO4, Na2HPO4, 2-Phenoxyethan, NaF). The operating sheath pressure during the experiments is 20 psi. At the nozzle (diameter 100 µm) above the sorting unit, the particles are separated into droplets with a frequency of 30 Hz and an amplitude of 2.3. During the experiments, the sorting rate fluctuates greatly but averaged <50 events per second. Sorting is done in “4 way purity,” i.e., the simultaneous creation and sorting of a single drop. The drops are collected in 5 mL collection tubes (without buffer).
The BD FACSAriaTM III has photomultiplier tubes to detect the signal intensity and the wavelength of the reemitted light pulses. DivaSoftware V8.02 is used for the fluorescence based multiparameter analysis. The analysis of pollen samples from the same sedimentary sequence on different devices allow a comparison of the device setups and thus show whether the particle signals can be transmitted in terms of wavelength and, above all, intensity. Additionally, AMS dating of sorted pollen concentrates can show the influence of the sheath fluid, used in the fluidic systems, on the 14C age.
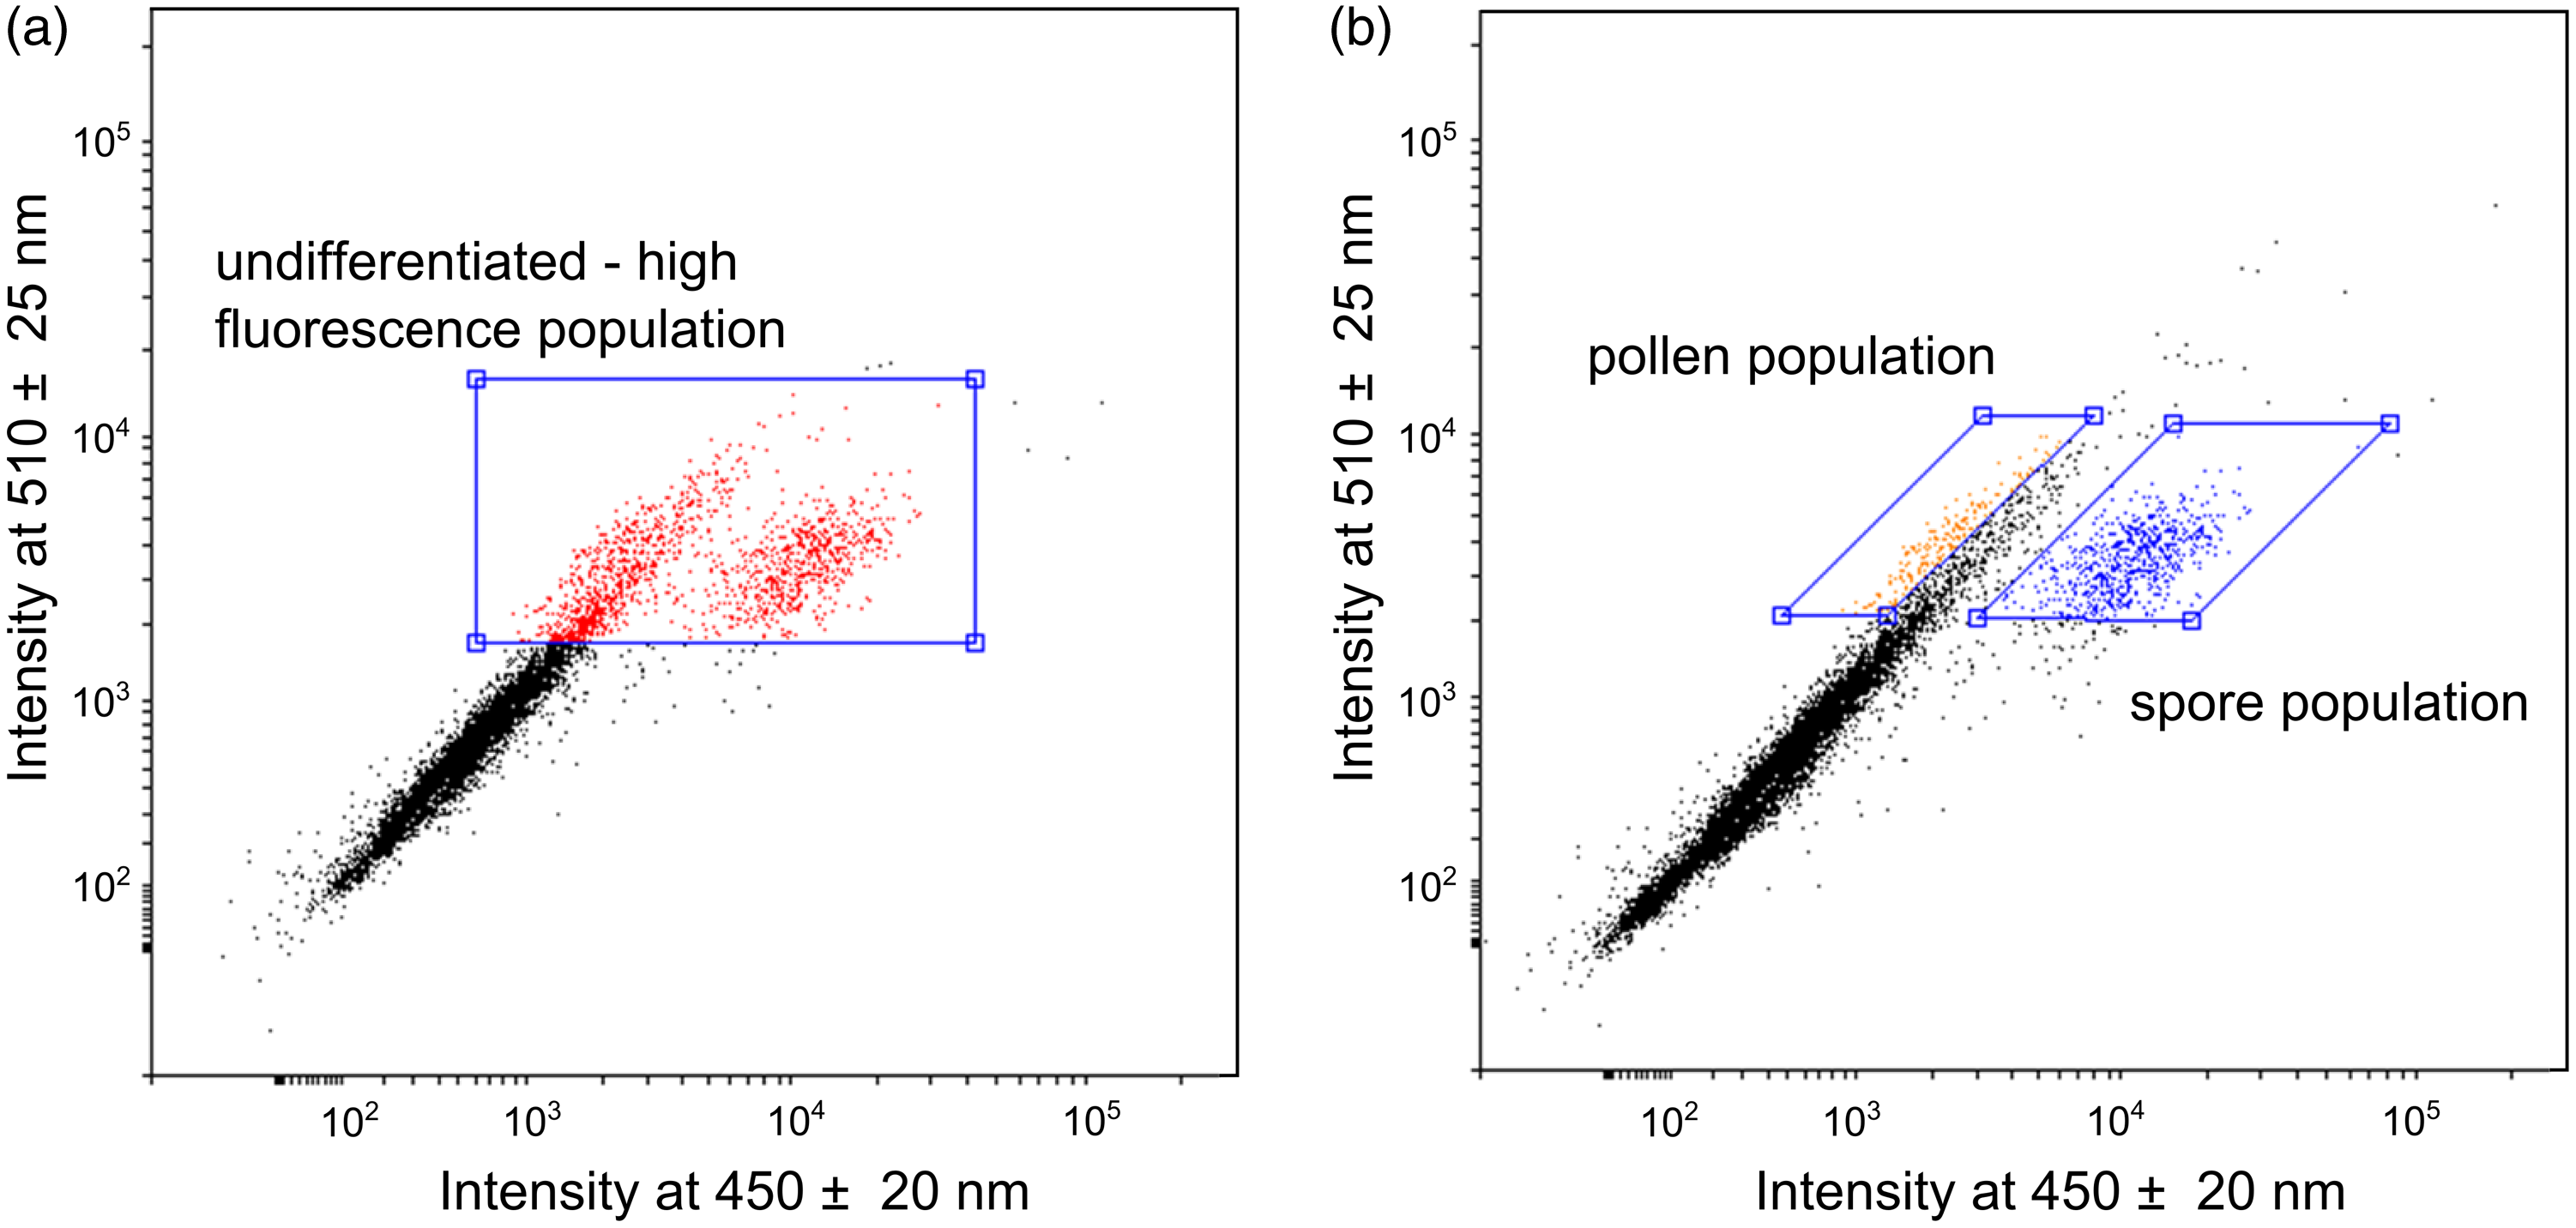
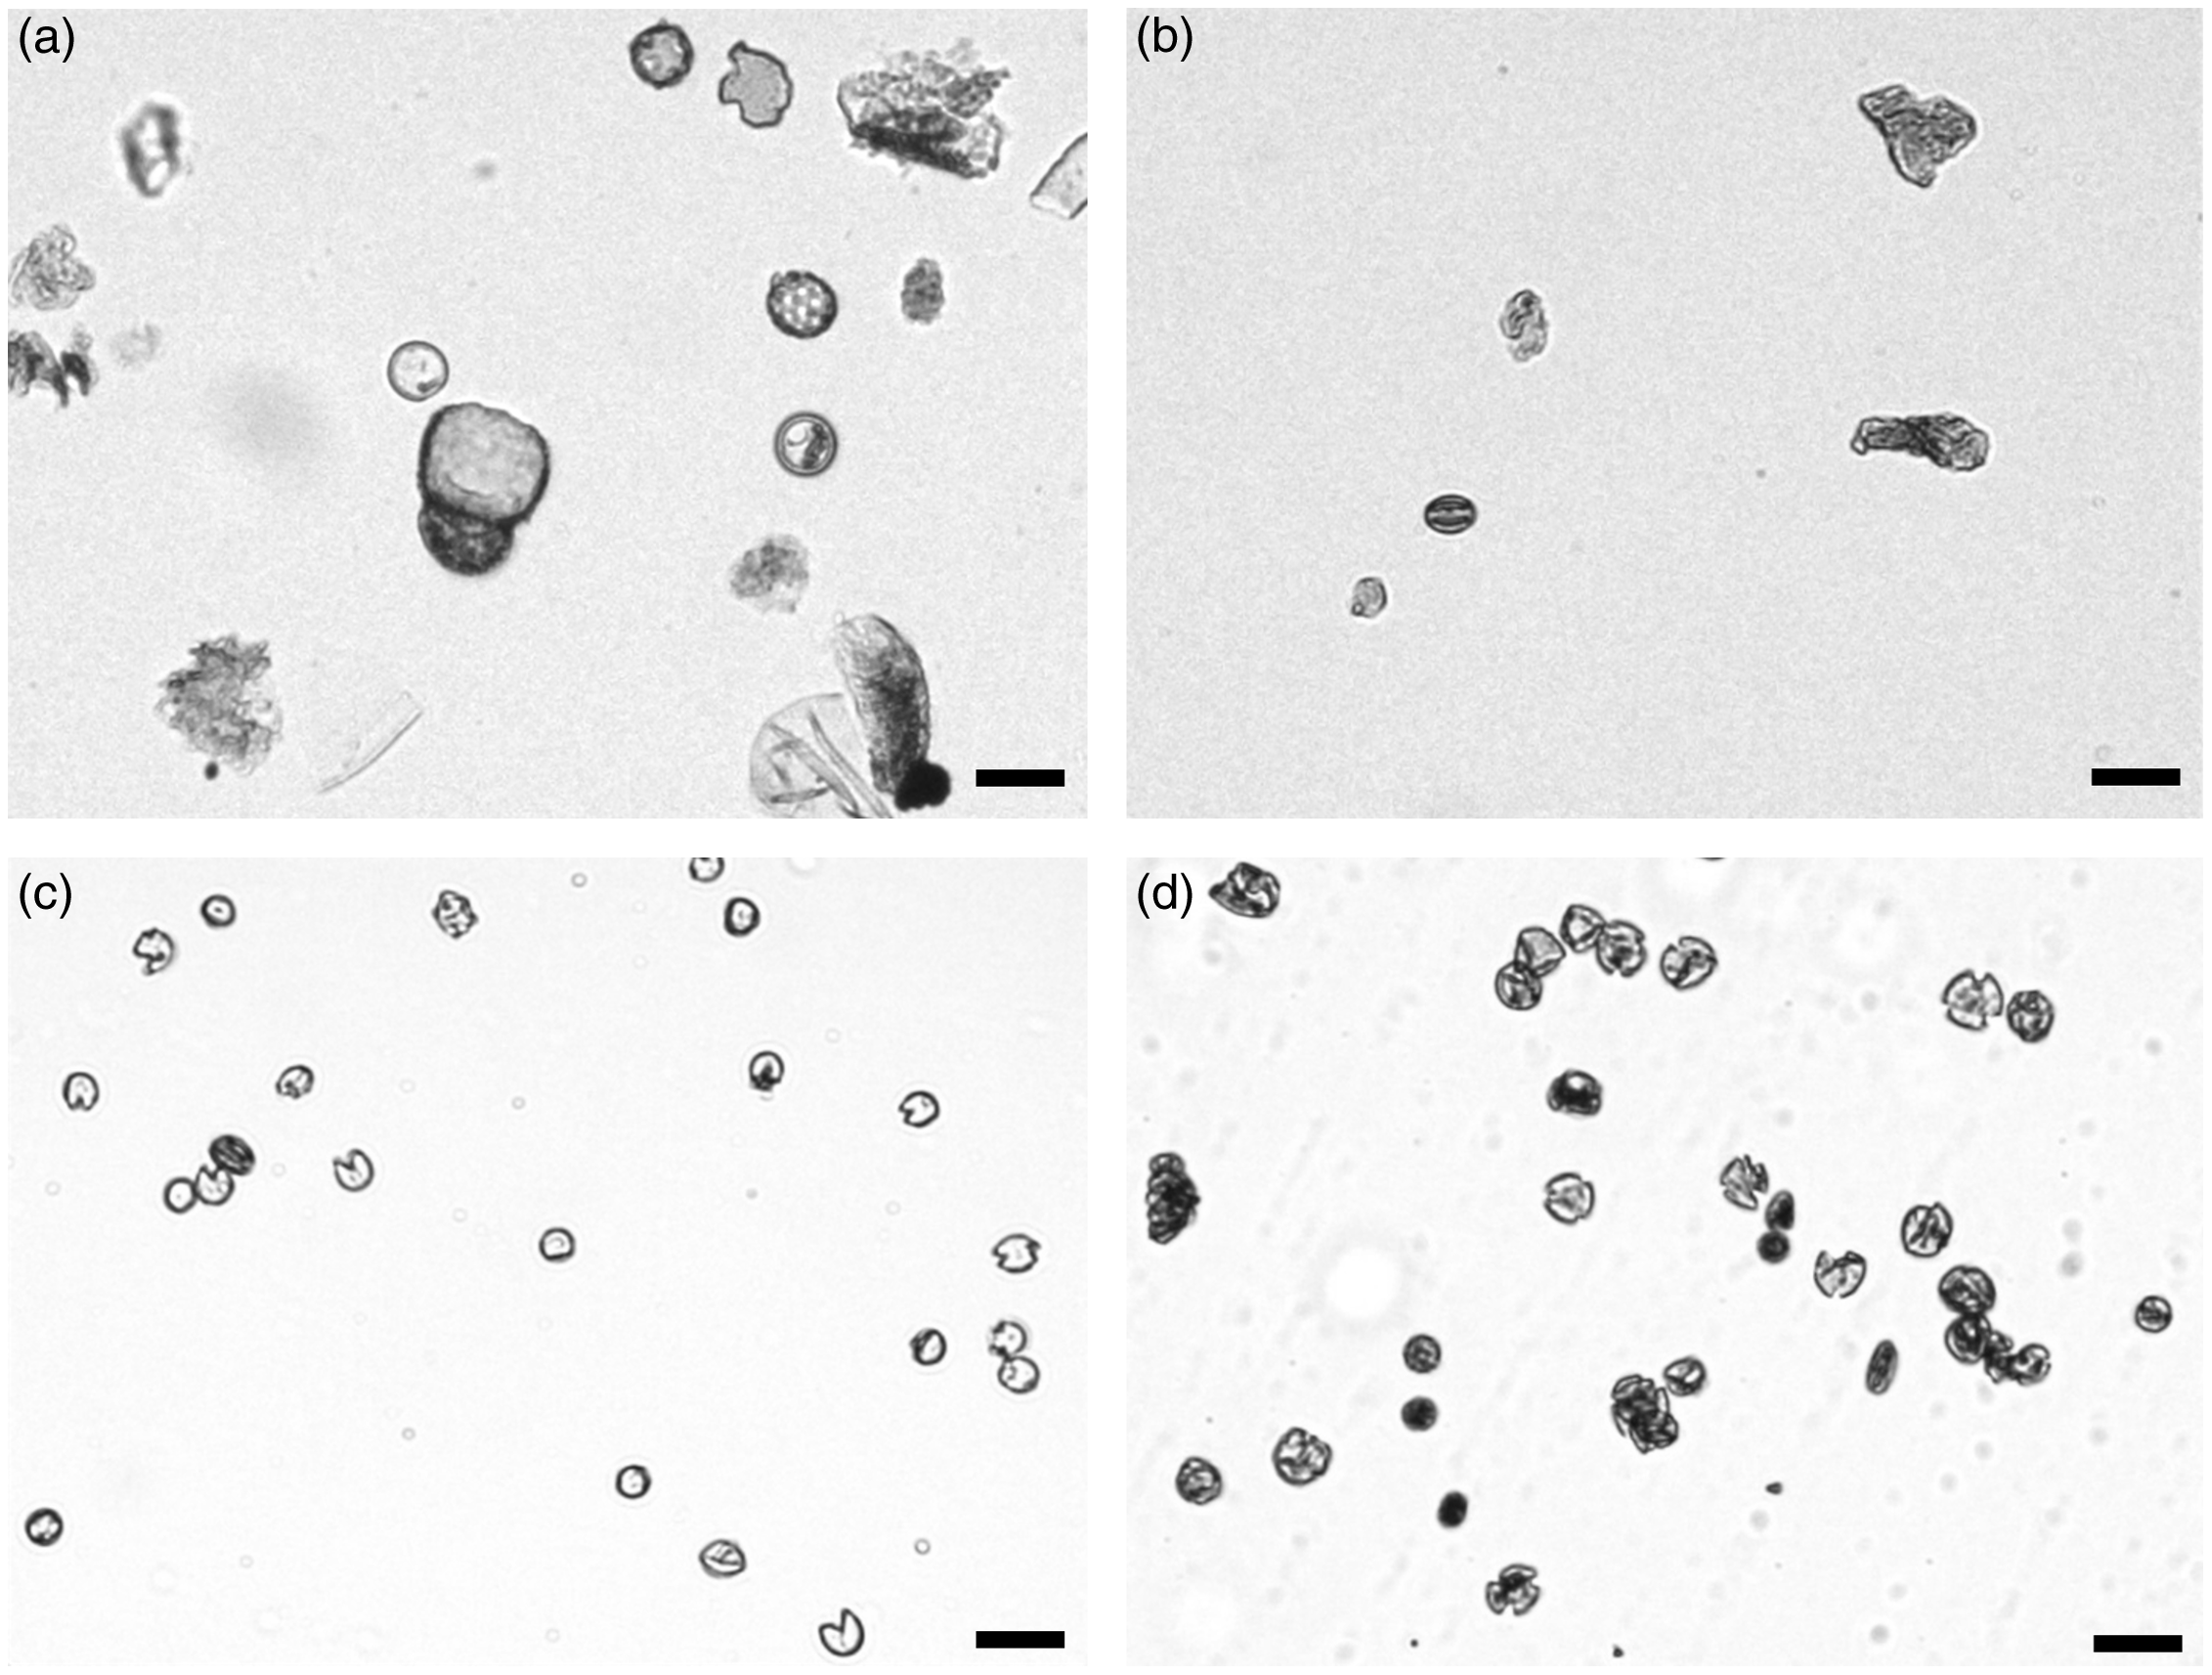
We applied two sorting approaches to the pretreated pollen samples and isolated three distinct populations with sufficient quantities for 14C dating. The first sorting approach assumes that the auto-fluorescence signal of the sporopollenin is the most intense signal detected in the high energy wavelength range (Hunt et al. Reference Hunt, Rushworth and Dykes2007; Tennant et al. Reference Tennant, Jones, Brock, Cook, Turney, Love and Lee2013a). Therefore, the isolated “undifferentiated – high fluorescence” (UHF) population is restricted to particles with a strong fluorescence intensity (wavelength at 450 ± 20 nm and 510 ± 25 nm) (Figure 3a). Six of the total 11 samples were analyzed using this sorting approach (Table 2). After each separation, the pollen concentrates were examined visually under the light microscope, with the result that the concentrates still contained a high proportion of detrital components (Figure 4b).
Pollen separation based on the multiparameter analysis of the flow cytometer. Scatter plot with the fluorescence signal in a wavelength range of 450 ± 20 nm against 510 ± 25 nm. a) “undifferentiated – high fluorescence” (UHF) approach with selected high fluorescence particles (red), b) “differentiated” approach where pollen (orange) and spore (blue) populations are separated from non-pollen particles (black). (Please see online version for color figures.)
Results of the pollen concentration process and the radiocarbon analysis. Indicated are the counted particles during the flow cytometry, the playnomorphs/detritus ratio (P/D) in the sorted concentrate, the total C (µg), F14C, the 14C age (yr BP), the calibrated ages (± 2σ with 95.4% probability range), and the different sorting approaches.

UHF: “undifferentiated – high fluorescence” sorting approach and “differentiated” approach (separation of pollen and spore concentrates). PBS: phosphate buffered saline solution, FF: FACSFlowTM.
Degree of pollen purity after different processing and separation steps: (a) after chemical pretreatment, (b) after sorting using “undifferentiated – high fluorescence” (UHF) sorting approach, (c) spore concentrate after “differentiated” sorting approach, and (d) pollen concentrate after “differentiated” sorting approach (scale: 25 µm).
The second “differentiated” approach enables the separation of particles contained in a sample into pollen and spore populations (Figure 3b). Both populations are located beside the described “UHF” population with a strong fluorescence signal in one of the two wavelength ranges. Small moss spores (Bryophyta, blue dots, Figures 3b, 4c) can be clearly differentiated and separated using the characteristic signal strength in the wavelength range around 450 nm. Terrestrial pollen grains of different taxa can be distinguished by signals at a wavelength of 510 nm (orange dots, Figures 3b, 4d). Unfortunately, a further differentiation of pollen grains is not possible. Four samples were analyzed using this “differentiated” sorting approach (Table 2).
After flow cytometry, the concentrates were rinsed intensively with ultrapure water (0.055 µS, 3–4 times) and were examined visually under the light microscope to ensure high-purity pollen concentrates by counting the ratio of pollen to non-palynomorph detritus (Table 2).
AMS 14C Dating
14C measurements were performed using the MICADAS (Mini CArbon DAting System) AMS system at the Laboratory of Ion Beam Physics, ETH Zurich (Switzerland). This MICADAS is equipped with a gas ion source enabling the analysis of approximately 10 µg of carbon samples (Ruff et al. Reference Ruff, Fahrni, Gäggeler, Hajdas, Suter, Synal, Szidat and Wacker2010; Wacker et al. Reference Wacker, Fahrni, Hajdas, Molnar, Synal, Szidat and Zhang2013; Welte et al. Reference Welte, Hendriks, Wacker, Haghipour, Eglinton, Günther and Synal2018), which corresponds to approximately 20 µg of pure pollen. Depending on the amount of pollen separated from the sediment, the high-purified pollen concentrates can be AMS-analyzed in graphite form, allowing high precisions but require sample sizes in the milligram range. Small samples, i.e., < 300 µg C, can be 14C dated on CO2, by combustion in an elemental analyzer (EA) directly connected to the gas ion source (Ruff et al. Reference Ruff, Wacker, Gäggeler, Suter, Synal and Szidat2007; Wacker et al. Reference Wacker, Bonani, Friedrich, Hajdas, Kromer, Němec, Ruff, Suter, Synal and Vockenhuber2010; Haghipour et al. Reference Haghipour, Ausin, Usman, Ishikawa, Wacker, Welte, Ueda and Eglinton2019).
In this study, 14C analyses are only based on the gas measurements due to the overly small amount of pollen extracted from the sediment samples (minimum 52,300; Table 2) and due to the low corresponding carbon masses (minimum 17 µg; Table 2). Prior to the AMS analysis, the pollen concentrates preserved in water were transferred to pre-cleaned and -weighed Al-capsules and stored in a drying oven (37–40°C) protected from external contamination. The dried capsules are carefully sealed, reweighed, and introduced into the EA. Data evaluation and corrections were done following the procedures described in Welte et al. (Reference Welte, Hendriks, Wacker, Haghipour, Eglinton, Günther and Synal2018). To access constant contamination parameters, two sets were analyzed: (1) modern (Acer platanoides pollen) and (2) 14C-depleted (lignite and core catcher samples from Lake Van) processing standards of different C masses. The results show constant contamination values of mc = 0.8 ± 0.2 µg C and F14CC = 0.5 ± 0.1. For better comparability, chemical preparation and fluorescence activated cell sorting of the standards were performed identically on the fossil pollen samples. The fossil pollen and spore concentrates were corrected according to the results from the standard measurements. All 14C ages were calibrated using OxCal 4.4 (Bronk Ramsey Reference Bronk Ramsey2001, Reference Bronk Ramsey2009) and the IntCAL20 calibration curve (Reimer et al. Reference Reimer, Austin, Bard, Bayliss, Blackwell, Bronk Ramsey, Butzin, Cheng, Edwards and Friedrich2020) (Table 2, Figure 5).
Comparison of the calibrated radiocarbon dates for pollen (orange), spore (blue), and “undifferentiated – high fluorescence” (UHF) populations (grey), as well as for “UHF” concentrates from different FACSAriaTM III devices (PBS, FACSFlowTM in turquoise).

RESULTS
Comparison of the Different Sorting Approaches
The two different sorting approaches were applied to four sediment samples from tephra layer V-1 and V-7 (Table 1). The direct comparison of the different populations (“UHF”, pollen, spores) enables the investigation of purity and carbon content, which can have a significant effect on the 14C data (Table 2).
For V-1, three different samples could be separated: ETH-101404 (UHF), ETH-104625 (spores), and ETH-104626 (pollen) (Table 2). The microscopic examination of each sample documents that the differentiated approach enables high purity and well sorted samples. Through the exact separation of the different populations, spore and pollen concentrates with a purity of 70% and 88% palynomorphs were achieved. The spore population is exclusively composed of pale, spheroidal 15–20 µm large moss spores (Bryophyta). The pollen concentrates indicate a wide spectrum of different terrestrial taxa (<20–50 µm), dominated by oak pollen and herbaceous taxa such as Artemisia, Apiaceae, and Chenopodiaceae. Individual fragments of large coniferous pollen grains (67–96 µm) are also identified in the sorted pollen concentrates.
The general picture of the 14C ages is that the pollen concentrate ETH-104626 is much younger (1560 ± 100 BP) than the bryophyte spores ETH-104625 (2360 ± 70 BP), although they were separated from the same sediment sample. The dated age of the “UHF” sample ETH-101414 ranges exactly between the spore and pollen 14C dates (1900 ± 80 BP).
The same pattern presents itself for the three sorted samples of V-7. A particularly high purity of 89% bryophyte spores and 100% pure pollen could be achieved from the concentrates ETH-104622 (spores) and ETH-104623 (pollen). Similar to V-1, the dated age of the bryophyte spore concentrate (ETH-104622: 11,140 ± 130 BP) is significantly older than the pollen concentrate (ETH-104623: 9380 ± 110 BP) and also of the “UHF” concentrate taken below V-7 (ETH-101414: 9650 ± 120 BP).
Comparison of the Different FACSAriaTM III Devices and Fluids
The two FACSAriaTM III devices of UKB and GFZ were compared by extracting sediment samples adjacent to each tephra layers V-2 and V-3b (Tables 1, 2). After chemical pretreatment, each sample was divided and analyzed separately in the respective different flow cytometers using the “UHF” sorting approach.
Samples ETH-101405 and ETH-104620 (both above V-2) contained a high number of counted events (429,800 and 800,575, respectively, Table 2), but consist of only 37% (UKB) and 30% (GFZ) palynomorphs. However, the achieved carbon weight of the two concentrates showed a remarkable difference of 25 µg (ETH-101405, UKB) and 160 µg of carbon (ETH-104620, GFZ). The resulting age estimates of ETH-101405 (4290 ± 80 BP) using the phosphate buffered saline solution (PBS) was younger than ETH-104620 (5050 ± 70 BP), sorted with the FACSFlowTM fluid.
In contrast, the “UHF” samples ETH-101407 (PBS) and ETH-104621 (FACSFlowTM) taken close to V-3b, provided a significantly higher purity: 77% palynomorphs (PBS, UKB) and 95% palynomorphs (FACSFlowTM, GFZ). Interestingly, in contrast to ETH-101405 (PBS) and ETH-104620 (FACSFlowTM), the 14C age of ETH-101407 (PBS, 6120 ± 80 BP) was older than sample ETH-104621 (FACSFlowTM 5570 ± 100 BP). During the cytometric analysis of the pollen samples, no significant device-specific differences in handling and sorting of the samples could be determined. In addition, the 14C dates indicate no dependence on the flow cytometer or the used fluids. This can be attributed to the extensive cleaning process of the sorted concentrates prior to the AMS dating.
Chemical Pretreatment
Tennant et al. (Reference Tennant, Jones, Brock, Cook, Turney, Love and Lee2013a) and Zimmerman et al. (Reference Zimmerman, Brown, Hassel and Heck2019) already described that the use of HNO3 has an influence on the efficiency of the cellulose removal or the cytometric analysis/sorting. However, in order to replace the standard carbon bearing acetolysis and to test the use of HNO3 on the conservation of fossil pollen and its fluorescence, the fossil sample CT 6-1 was split and one half was treated with HNO3 (Table 1). Caution is required during chemical treatment, as strong acids or bases such as HNO3 or NaOH (as described by Jahren Reference Jahren2004) can not only remove the cellulose contained in the pollen grain, but also alter the exine considerably (Descolas-Gros and Schölzel Reference Descolas-Gros and Schölzel2007). Therefore, it is essential that the reaction time does not exceed five minutes. The results of the population distribution show that the autofluorescence signal of the pollen grains was considerably influenced by the use of HNO3 (Figure 6). The recognized bleaching effect of the pollen grains leads to a weakened signal intensity. As a result, the respective pollen population form an indistinguishable part of the main population (black dots; Figure 6) and the pollen grains can no longer be separated from the detrital particles. As Figure 6 shows, this is particularly important for fluorescence in the wavelength range between 450 nm and 510 nm, where normally a differentiation of bryophyte spores, oak and herbaceous pollen is possible. Furthermore, the use of strong acids and the chemical reaction affects the chemical composition of the exine so that further isotopic analyses on the concentrates become incorrect (Jahren Reference Jahren2004; Descolas-Gros and Schölzel Reference Descolas-Gros and Schölzel2007). In lacustrine sediments with general low organic content, such as Lake Van, it is advisable to avoid HNO3 or acetolysis in order to ensure handling, analysis, and separation of the pollen samples. Sample CT 6-1 was not further considered for AMS dating.
Multiparameter analysis to evaluate the influence of HNO3 on pollen grains of sample CT 6-1. The red dots mark the pollen population. (a) without HNO3-treatment: strong fluorescence signals according to their intensity in the wavelength range of 450 ± 20 nm and 510 ± 25 nm. (b) after chemical treatment with HNO3: weaker fluorescence signal due to bleaching effects of the pollen grains. No differentiation between pollen and non-palynomorphs is possible.

DISCUSSION
Flow Cytometry of the Pollen Samples
Dating pollen has successfully been introduced by Brown et al. (Reference Brown, Nelson, Mathewes, Vogel and Southon1989) using bisaccate (coniferous) pollen grains. In this study, we tested two different approaches, the “UHF” and the “differentiated” sorting approach using flow cytometry to separate small to medium-sized pollen and bryophyte spores from Lake Van sediments.
The “UHF” sorting approach enables the separation of a large number of particles (up to 800,000 particles) in a short period of time (20 min to 125 min; Table 2). However, the qualitative examination using light microscopy documents that this approach does not allow the separation of high-purity pollen concentrates, since a high proportion of undefinable detrital particles contaminate the sorted sample (e.g., ETH-101405 (PBS) and ETH-104620 (FACSFlowTM), Table 2). A high sorting efficiency of the flow cytometer can reduce an error that could be caused by incorrectly sorted particles. It is more likely that the highly fluorescent population underlying the “UHF” sorting approach already contains detrital particles with a strong fluorescent signal.
Since no fluorescent dyes were used, it can be assumed that the detrital particles and non-pollen palynomorphs contained in the “UHF” population were autofluorescent. It is well-known that molecular structures of chlorophyll or DNA emit photons when excited, so it cannot be excluded that algae, for example, which have autofluorescent properties, were separated from the “UHF” population (Hunt et al. Reference Hunt, Rushworth and Dykes2007; O’Connor et al. Reference O’Connor, Iacopino, Healy, O’Sullivan and Sodeau2011). As a result, the highly fluorescent signals from algae can be incorrectly sorted into the pollen concentrate during the separation and contaminate the sorted pollen concentrates.
Nevertheless, it can be emphasized that the use of flow cytometry is particularly suitable for the analysis of organic-poor lacustrine sediments from semi-arid climates, such as those of Lake Van. Our results showed that only very few clastic particles were contained in the sorted pollen concentrates. This is particularly attributed to the chemical treatment of the sediments, which effectively removes the clastic components and preserves the fossil pollen. In addition, fine sieving (10 µm and 53 µm) contributes significantly to easier handling of the sample on the flow cytometer, since the removal of coarse particles and fine clay particles supports sorting. The combination of gentle chemical treatment and the “differentiated” sorting approach presented here allows the production of high-purity pollen and spore concentrates, which can then be dated by the AMS gas ion source.
In order to avoid algae contamination, the “differentiated” sorting approach separates high-purified pollen and bryophyte spore concentrates from a heterogeneous sediment sample. Figure 3b demonstrates that the population of the bryophyte spores (blue dots) can be clearly separated from the main population (black dots) and from the pollen population (orange dots). The bryophyte spores show a strong and clearly differentiable signal at the lower wavelength range between 430 nm and 470 nm. This fluorescence spectrum is comparable to the characteristic spectrum of other types of spores, such as fungal spores with a maximum signal at 415 nm (O’Connor et al. Reference O’Connor, Iacopino, Healy, O’Sullivan and Sodeau2011).
In contrast to the bryophyte spores, the pollen grains do not reflect a clear fluorescence signal and cannot be assigned to a specific wavelength range (O’Connor et al. Reference O’Connor, Iacopino, Healy, O’Sullivan and Sodeau2011). There are two possible reasons: (1) Fluorophores in different structural elements of the pollen grains (e.g., DNA or carotenoids in the sporopollenin) can cause a variation in the fluorescence intensity with several unspecific peaks between 420–650 nm (Hunt et al. Reference Hunt, Rushworth and Dykes2007; O’Connor et al. Reference O’Connor, Iacopino, Healy, O’Sullivan and Sodeau2011) and (2) the different fluorescence signals can be explained by different pollen/plant genera. However, an overlap of the fluorescence spectra prevents a further differentiation of the pollen population and its assignment to a certain wavelength range. Therefore, the fluorescence properties of the pollen grains depend on the pollen composition in the sediment and can show distinct variation from sample to sample.
AMS 14C Ages
The calibrated AMS 14C ages of the pollen, spore, and “UHF” concentrates are illustrated in Figure 5. The ages document that, despite their low concentration, small- and medium-sized non-coniferous pollen and bryophyte spores can be precisely dated.
A direct comparison between the 14C ages of pollen, bryophyte spores and “UHF” concentrates, illustrates an age discrepancy, with the bryophyte spores being significantly older (Figure 5). Since the bryophyte spores were separated from the same sediment sample as pollen, a sedimentological cause (e.g., reworking or bioturbation) can be excluded. These processes would affect all fractions of the sediment equally. Instead, the apparent age discrepancy can be explained by different terrestrial environmental conditions in which pollen and bryophyte spores are formed. Bryophytes are non-vascular land plants (e.g., liverworts, hornworts, and mosses) that tolerate dry environments, but, prefer telmatic or even submers habitats. The assimilation of 14C-depleted ground or surface water from the immediate vicinity of the growth site, contributes to bryophytes and the produced spores being subject to a reservoir effect, providing erroneously older 14C ages (MacDonald et al. Reference MacDonald, Beukens, Kieser and Vitt1987; Turetsky Reference Turetsky2003).
The “UHF” 14C dates must be treated with caution. Figure 4b shows that after the fluorescence-activated cell sorting microscopic aquatic plant remains (e.g., algae fragments) and unidentifiable detritus are still present in the sorted concentrate. Comparable to the influence of the carbon reservoir of the bryophyte spores, the lake water, as a carbon supply for growing phytoplankton, must also be considered. Therefore, the direct comparison of the dating of high-purity pollen concentrates and the “UHF” samples indicate that the “UHF” concentrates are subject to the reservoir effect (Andree et al. Reference Andree, Oeschger, Siegenthaler, Riesen, Moell, Ammann and Tobolski1986; Long et al. Reference Long, Davis and de Lanois1992; Vandergoes and Prior Reference Vandergoes and Prior2003). This is reflected in the ratio between palynomorphs and detritus (P/D ratio; Table 2). There is a clear influence of the purity of the concentrates on the precision of the dating. The time difference between two 14C dates is greater if the P/D ratio differs more considerably. This applies to the age difference between pollen and “UHF” on the one hand and pollen and spores on the other hand. A low proportion of detrital particles in the sorted concentrates enables precise dating and a possible influence of a reservoir effect can be excluded.
Independent age controls become essential to validate the measured 14C ages. The concentrates ETH-104623 (pollen; 10,260–11,070 cal BP), ETH-101414 (UHF; 10,600–11,260 cal BP), ETH-104622 (bryophyte spores; 12,770–13,300) were collected near the expected Holocene-Pleistocene boundary around tephra V-7 (383.21 cm depth). According to Litt et al. (Reference Litt, Krastel, Sturm, Kipfer, Örcen, Heumann, Franz, Ülgen and Niessen2009), the Holocene-Pleistocene transition (11,700 BP) was defined at 388.68 cm depth by significant and abrupt changes in the δ18O signal and pollen composition. From this point of view, all dated ages, except for the spore concentrates, show comparable dates and can be assessed as reliable and robust. Additional independent age control points include two 14C dated macrofossil samples (OS-89765, 530–670 cal BP and OS-89728, 4640–5290 cal BP) collected from lacustrine sediments (northern Basin, Lake Van) drilled in 2010 (Çağatay et al. Reference Çağatay, Öğretmen, Damcı, Stockhecke, Sancar, Eriş and Özeren2014). According to (Stockhecke et al. Reference Stockhecke, Kwiecien, Vigliotti, Anselmetti, Beer, Çağatay, Channell, Kipfer, Lachner and Litt2014) and (Çağatay et al. Reference Çağatay, Öğretmen, Damcı, Stockhecke, Sancar, Eriş and Özeren2014), the Northern basin deposits are characterized by mass flow deposits and by a generally higher sedimentation rate compared to the Ahlat Ridge. Such terrestrial input by mass flow deposits also results in a highly varying sedimentation rate (Çağatay et al. Reference Çağatay, Öğretmen, Damcı, Stockhecke, Sancar, Eriş and Özeren2014), which complicates a reliable correlation of the Northern Basin sediments and thus does not allow a comparison of the 14C dates.
Furthermore, a varve chronology for the Holocene Lake Van sediments established by Landmann et al. (Reference Landmann, Reimer, Lemcke and Kempe1996) can be used to evaluate the reliability of the 14C ages. The existing varve chronology, constructed from sediments of the Tatvan Basin, can be correlated with the Ahlat Ridge sediments over five (corresponding to tephras V-3a, V-3b, V-4–V-6) volcanic ash layers (Stockhecke et al. Reference Stockhecke, Kwiecien, Vigliotti, Anselmetti, Beer, Çağatay, Channell, Kipfer, Lachner and Litt2014). Only the two dated “UHF” concentrates (ETH-101407, ETH-104621) below ash layer V-3b can be compared to tephra B in Landmann et al. (Reference Landmann, Reimer, Lemcke and Kempe1996) (2737 counted years BP). Here, the ages of ETH-101407 (6790–7250 cal BP) and ETH-104621 (6130–6630 cal BP) are significantly older compared to the varve age of tephra B. It is assumed that this is due to the inaccuracy of the provided pollen dates. However, this significant age discrepancy contradicts the dates collected for the Holocene-Pleistocene transition (ETH-104623, ETH-101414). It turns out that a precise correlation between the sediments of the Tatvan Basin and the Ahlat Ridge is very speculative, since only five out of the seven Holocene volcanic ash layers found in the sediments of Ahlat Ridge were identified and described by Landmann et al. (Reference Landmann, Reimer, Lemcke and Kempe1996).
In this respect, further radiometric dates are required covering the entire Holocene sedimentary section, guided by the age control points reported in Landmann et al. (Reference Landmann, Reimer, Lemcke and Kempe1996) and Stockhecke et al. (Reference Stockhecke, Kwiecien, Vigliotti, Anselmetti, Beer, Çağatay, Channell, Kipfer, Lachner and Litt2014). Ongoing research to establish a revised Holocene Lake Van chronology based on new varve counts and high-purity AMS dated pollen concentrates will be essential.
CONCLUSION
14C dating of isolated pollen grains is an increasingly common method for determining the age of lake sediments, which contain few to no plant macro remains. The requirements for high-purity pollen concentrates require a revised chemical methodology of the sample preparation in relation to the sediment composition. Due to the semi-arid climate conditions at Lake Van, the lacustrine samples are characterized by a low proportion of macrofossil remains and a low proportion of large coniferous pollen. We presented a simple extraction method that enables optimal preparation for a straightforward processing of large and organic poor sediment samples using flow cytometry.
Sorting strategies greatly influence the quality of the sorted pollen concentrates. The “UHF” sorting approach enables the isolation of a large number of small- to medium-sized pollen grains, which, however, is associated with a level of contamination that should not be underestimated. The selection and identification of distinct subpopulations instead of broader populations is essential for precise dating results. Based on the “differentiated” sorting approach, the identification and separation of distinct pollen and spore populations is still suitable for AMS 14C dating. Therefore, the focus of fluorescence activated cell sorting must not be on the quantity of sorted particles but on the quality of the concentrates.
The evaluation of the two sorting methods with regard to reliable 14C dates remains imprecise. Therefore, further Holocene Lake Van sediment samples are required in order to be able to classify the pollen dates more precisely.
ACKNOWLEDGMENTS
This research contributes to the International Continental Scientific Drilling Program (ICDP – SPP 1006). Financial support for the development of this method has been provided by the Germen Research Foundation – DFG (PI 1343/1-1). Special thanks go to Karen Schmeling, who performed the chemical pretreatment of the sediment samples, and Jan Axel Kitte for his assistance during cytometric analysis at the GFZ Potsdam. We also would like to thank the Flow Cytometry Core Facility of the Medical Faculty at the University of Bonn for providing support and instrumentation funded by the German Research Foundation (DFG) – Project number: 216372545. Three anonymous reviewers are acknowledged for their recommendations and suggestions, which improved the quality of this paper. We thank Christine Hatté for editorial handling and her constructive comments.


 Open access