INTRODUCTION
Surveillance of the public health impact of influenza has evolved over recent years with the development of novel ways of detecting the community-based impact [Reference Fleming, van der Velden and Paget1, Reference Smith2]. Traditionally, laboratory-based reporting has provided the mainstay of surveillance providing numbers of laboratory-confirmed cases together with antigenic profiling to determine virus subtypes and antiviral susceptibility [3].
More recently syndromic surveillance systems have been increasingly used as a means of providing early warning of increased community-based influenza morbidity to complement laboratory reporting and assist local health providers in the planning and delivery of services [Reference May, Chretien and Pavlin4].
The recent pandemic due to influenza A(H1N1) 2009 virus clearly demonstrated the usefulness of syndromic surveillance systems in monitoring the spread of infection and supporting planning and response activities [5].
It has previously been suggested that school absenteeism data could also be a valid tool for early detection of influenza activity in the community [Reference Zhao, Joseph and Phin6–Reference Mook8]. During influenza outbreaks that predominantly affect school-age children, a surveillance system based on school absenteeism may provide early warning of increasing influenza activity before community-based outbreaks are detected using existing syndromic surveillance systems.
Although a number of studies have tested the feasibility of using school absenteeism data as an early signal for influenza activity, there is no consensus as to its usefulness [Reference Zhao, Joseph and Phin6–Reference Besculides9].
Considering the prominence of school-based outbreaks during the 2009 pandemic, the potential for school absenteeism data to act as a proxy for influenza activity requires further examination.
Using routinely collected school absenteeism data from primary and secondary state schools in Birmingham, UK, before and during the 2009 pandemic, this study retrospectively evaluated the usefulness of these data by comparing them with existing syndromic surveillance systems and laboratory data.
METHODS
The study period covered three consecutive school years, from 2006 to 2009. School years start around weeks 35/36 (last week of August and first week of September) and finish around weeks 30/31 of the following year (last week of July). Three consecutive influenza seasons starting from 2006/2007 to 2008/2009 (and included the ‘containment phase’ of the 2009 pandemic in England), were also included in the study.
Data sources
School absenteeism
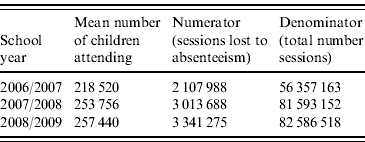
In England, information about absenteeism in schools is collected retrospectively on a weekly basis by local authorities from the schools during term time. Data were obtained from Birmingham Local Authority on absenteeism for 373 state schools (299 primary and 74 secondary) which comprised children aged 4–11 years (primary school) and 11–18 years (secondary school). On average a total of about 243 000 children were enrolled in these schools during each academic year (Table 1). The data contained the name of the school, local authority ward and information about absenteeism for each week of the school year. The numerator comprised the total number of sessions lost to illness for that school in that week; the denominator comprised the total number of sessions the school was open for that week (Table 1). In usual situations children attend two sessions per day.
Table 1. School absenteeism data by academic year including number of children attending schools in Birmingham and the numerator and denominator sessions used to calculate absenteeism rates
Detailed information on reasons for school absence is not collected by schools. Schools are advised by the Department of Children, Schools and Family to use the code ‘due to illness’ when parents phone to inform that the child is ill or send a letter to explain the child's absence [10]. This is a general code for ‘all illness’ and not specific for influenza or influenza-like illness (ILI). This code has been used previously as a proxy for influenza activity when conducting school-based studies [Reference Mook8–Reference Schmidt, Pebody and Mangtani11].
HPA/NHS Direct system ‘cold/flu’ and ‘fever’ calls
NHS Direct is a nurse-led helpline service established in 1997, providing health advice and information to the population of England [12]. Daily call data are analysed by the HPA Real-time Syndromic Surveillance Team who analyse the number of calls received by NHS Direct by the symptoms reported for each call, and record basic demographics including the age, gender and approximate geographical location of the caller (postcode district). Syndromic calls are analysed as a percentage of the total number of calls and significant statistical exceedance in the numbers of calls received are investigated further [Reference Elliot13]. Data from the HPA/NHS Direct system are published on a weekly basis [14]. The HPA/NHS Direct system utilizes a series of early warning thresholds based upon numbers of cold/flu calls recorded in all patients, and fever calls recorded in children aged 5–14 years. These thresholds provide early warning of seasonal outbreaks of influenza activity thus increasing the potential to activate local and national public health response mechanisms [Reference Cooper15].
Data on the number and percentage of calls, by week during the study period, for ‘cold/flu’ and ‘fever’ in those aged between 4 and 18 years, living within postcode districts in Birmingham, were selected for this study [16].
Royal College of General Practitioners Weekly Returns Service
The Royal College of General Practitioners (RCGP) Weekly Returns Service (WRS) is a sentinel surveillance network consisting of 100 general practices covering an average weekly population of approximately 900 000 patients throughout England and Wales [Reference Fleming17]. The WRS has provided continuous reporting of GP-based community morbidity since 1967. The network is socioeconomically and demographically representative of the national population [Reference Fleming and Miles18]. The WRS is renowned for monitoring community-based ILI incidence rates: a series of thresholds defining baseline, normal seasonal, and above seasonal activity have been developed to assist in determining the public health impact of circulating influenza [Reference Goddard, Kyncl and Watson19].
Weekly incidence rates of ILI/100 000 population during the study period were extracted by gender and age group across a subset of WRS practices located within the West Midlands region in the 5–14 years age group.
Regional Public Health Laboratory influenza A(H1N1) laboratory reports
Data were provided by the West Midlands Regional Public Health Laboratory on the number of samples positive for influenza A(H1N1), by reverse transcriptase–polymerase chain reaction (RT–PCR).
Information was obtained from the laboratory for persons living in Birmingham Local Authority and aged 4–18 years for the period between weeks 16 and 27 of 2009. This period covered the ‘containment phase’ of the influenza A(H1N1) 2009 pandemic where all suspected cases were tested microbiologically. After week 27/09 laboratory testing was no longer used for confirmation of all cases [20].
Statistical analysis
From the school absenteeism ‘due to illness’ data we calculated the mean weekly absenteeism rates [with exact binomial 95% confidence intervals (CI)] for all schools for each week of the study period, and examined whether rates differed between the two types of school. Absenteeism data were initially log-transformed in order to normalize the data thus enabling comparison of means between different variables. When peaks of absenteeism were observed, statistical significance for the difference between weeks of interest and corresponding peaks in similar periods in previous years was examined through comparison of their means. This was tested by Student's t test and P values <0·05 were used to indicate statistical significance.
Weekly mean percentages of absenteeism in Birmingham schools were compared with established weekly indicators of influenza activity from HPA/NHS Direct system, RCGP WRS and the public health laboratory, and Spearman's correlation coefficient was used to examine the relationship between them. Parameters included mean weekly absenteeism rate, weekly proportion of NHS Direct cold/flu and fever calls, weekly GP consultation rate/100 000 population for ILI, and weekly number of laboratory reports for influenza A(H1N1)-positive samples. The Stata 10 statistical package was used to undertake the data analysis [21].
RESULTS
Mean weekly absenteeism rates for the 373 Birmingham schools during the study period was 3·74% (95% CI 3·36–4·13). Although primary schools generally experienced higher mean rates of absenteeism than secondary schools, particularly during 2006/2007 and 2007/2008, overall absenteeism rates were similar at 4·00% (95% CI 3·39–4·61) for primary schools and 3·49% (95% CI 2·76–4·21) for secondary schools.
Overall, when different school years were compared the mean absenteeism for the three consecutive school years (2006/2007, 2007/2008, 2008/2009) did not differ markedly and were 3·87% (95% CI 3·63–4·11), 3·63% (95% CI 3·36–3·91) and 4·13% (95% CI 3·68–4·57%), respectively. In general, absenteeism in primary and secondary schools peaked concomitantly with the exception of January 2007 when primary schools presented a peak 1 week earlier than secondary schools (Fig. 1). A statistically significant difference in overall mean absenteeism between primary and secondary schools was found during the school year 2006/2007 at 4·07% (95% CI 3·82–4·33) and 3·37% (95% CI 3·17–3·57), respectively (P<0·0001).
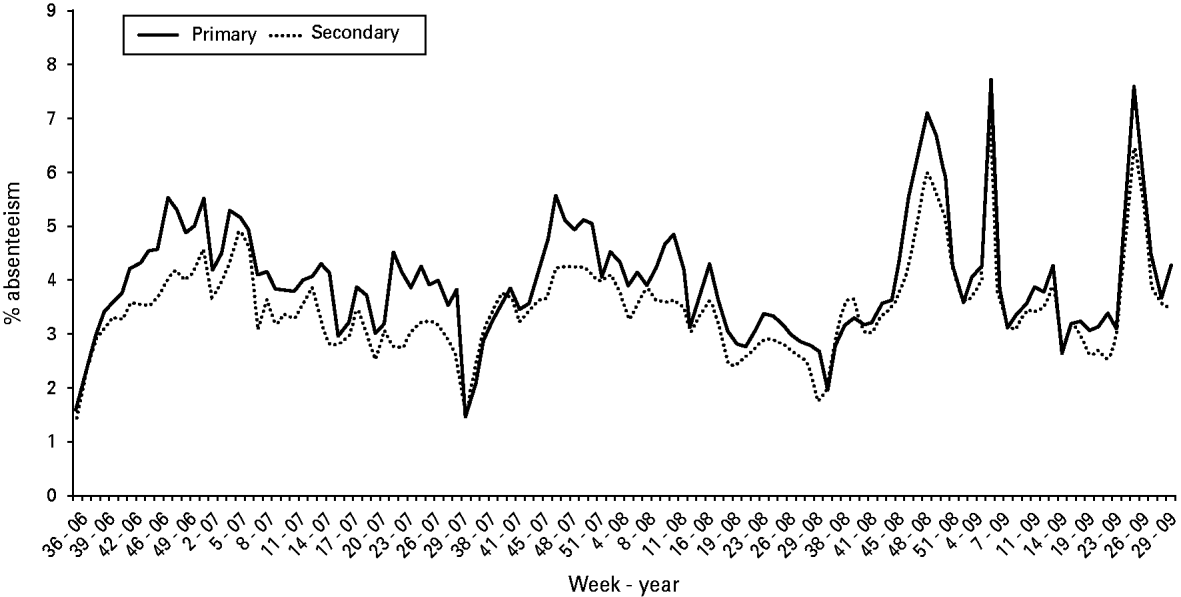
Fig. 1. Mean weekly rate of term-time absenteeism in primary and secondary schools in Birmingham, England, September 2006 to September 2009 (school holiday periods are not included in the figure to allow better visualization of temporal trend).
In June 2009, school absenteeism peaked in week 26/09 at 7·37% (95% CI 6·92–7·82), and no corresponding peak was found in the previous school years. The peak absenteeism rate seen in week 26/09 coincided with peaks in routine surveillance systems and positive laboratory tests for influenza A(H1N1) virus (Figs 2 and 3). School absenteeism increased significantly (P<0·0001) in week 25/09 from 3·31% (95% CI 3·15–3·48) to 5·43% (95% CI 5·09–5·76), peaked at 7·37% (95% CI 6·92–7·82) in week 26/09, and then decreased significantly (P<0·001) to 5·96% (95% CI 5·70–6·22) in week 27/09.
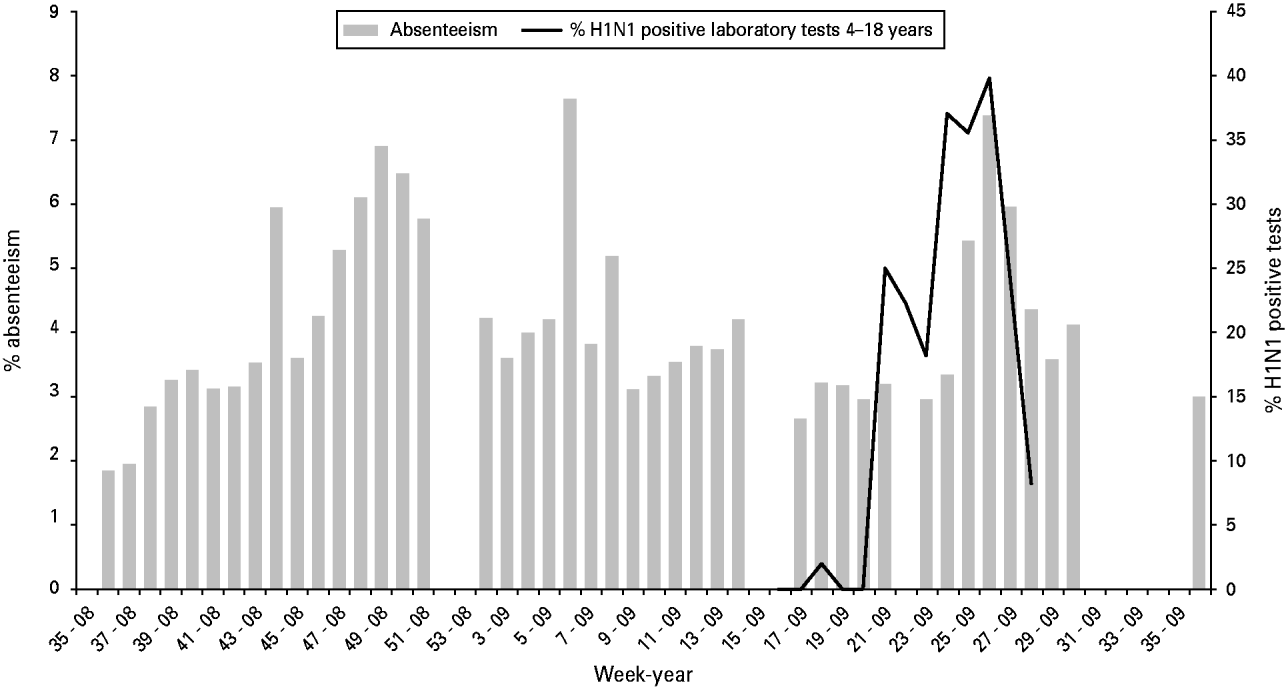
Fig. 2. Mean weekly rate of absenteeism in schools in Birmingham, England during the 2008/2009 school year, by week, and laboratory positive results (%) for influenza A(H1N1) virus in children aged 4–18 years.
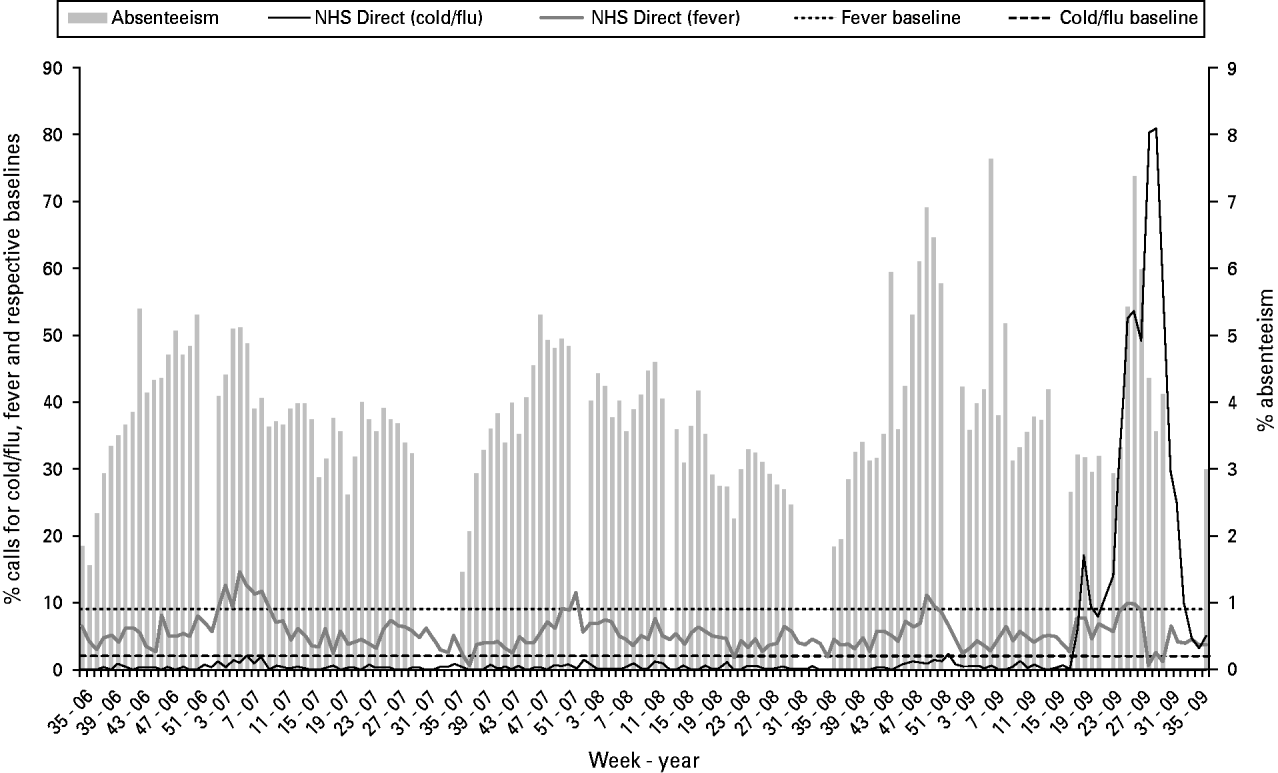
Fig. 3. Mean weekly rate of absenteeism in schools in Birmingham, England, by week, and syndromic calls to NHS Direct for children aged 4–18 years, September 2006 to September 2009.
Comparison of HPA/NHS Direct system and RCGP WRS surveillance data
NHS Direct ‘cold/flu’ calls reported by the HPA/NHS Direct system remained at or below baseline (2% of total number of NHS Direct calls) levels during school years 2006/2007 and 2007/2008, and tended to peak after absenteeism data (Fig. 3). During the 2008/2009 school year they began to rise above the baseline in week 18/09, peaking in week 26/09 at 53·34% of the total calls. This was significantly higher compared to similar weeks in previous years.
When ‘fever’ calls exceeded baseline (9% of total number of NHS Direct calls) over the three school years they generally tended to do so in the same week as peaks for school absence (Fig. 3). In the school year 2008/2009, call activity exceeded baseline levels twice, first, in week 49/08 (11·31% of total calls) and also in week 25/09 (10·06% of total calls).
Consultation rates for ILI (Fig. 4) exceeded the established RCGP baseline threshold [Reference Goddard, Kyncl and Watson19] four times during the 3-year study period, in weeks 3/07, 6/07 and during the 2008/2009 school year when peaks coincided with peaks in school absenteeism. In week 48/08 consultation rates started to increase exceeding the baseline in week 49 (47·35/100 000) and peaking at 50·38/100 000 in week 50/08. Consultation rates peaked again in week 26/09 and remained above the threshold for 5 weeks.
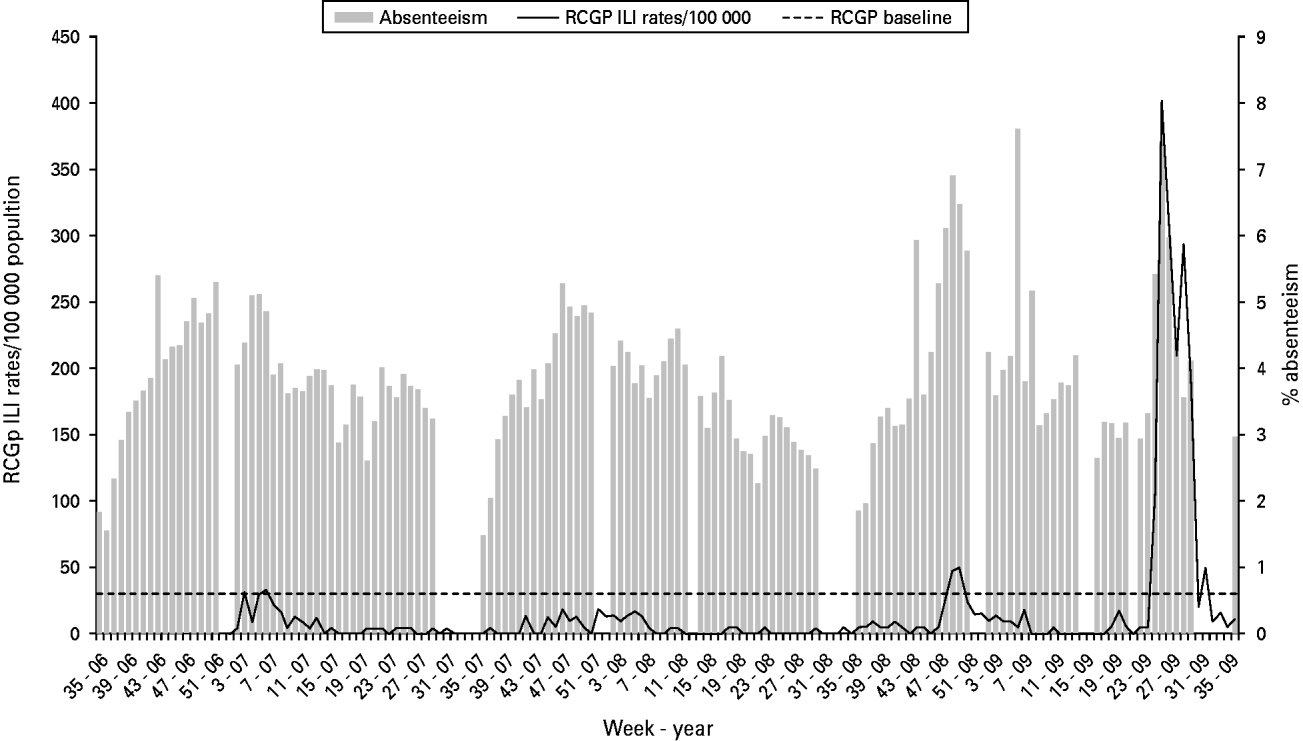
Fig. 4. Mean weekly rate of absenteeism in schools in Birmingham, England, by week, and RCGP ILI consultation rates for children aged 5–14 years, September 2006 to September 2009.
With the exception of NHS Direct calls for fever that peaked in week 25/09, comparison of absenteeism patterns with NHS Direct calls for cold/flu, RCGP WRS diagnoses for ILI, and laboratory data for influenza A(H1N1) virus showed no time lag. Instead they all peaked concomitantly (Figs 2–4) during the 2009 pandemic in week 26/09, although calls for cold/flu showed a second slightly higher peak in week 29/09. Significant correlation was found only between absenteeism and RCGP WRS for ILI (r=0·42, P=0·002).
DISCUSSION
The influenza A(H1N1) 2009 pandemic provided a unique opportunity for the assessment of the usefulness of school absenteeism data as a proxy for early warning of influenza activity in the community.
The results of this study showed that during the 2008/2009 school year, school absenteeism showed a peak pattern not seen in previous years, the most distinctive peak being during the containment period of the 2009 pandemic. The predominance of school outbreaks in the initial phase of the 2009 pandemic makes the use of school absenteeism data for future incidents an attractive proposal [22]. In order to evaluate the usefulness of such data, this study compared school absenteeism with surveillance systems whose thresholds were already known to yield an advanced warning of influenza activity in the community [Reference Cooper15]. In particular, the HPA/NHS Direct system has been shown to provide early warning of increases in communicable diseases in the community compared to more traditional laboratory reporting [Reference Loveridge23]. However, although absenteeism data in this study increased along with other indicators, they did not peak in advance of the mainstream surveillance methods already in place, but did so at about the same time.
Key issues with absenteeism data are the non-specific school-based definition of ‘illness absence’ and the absence of data during holidays and at weekends [Reference Mook8–Reference Schmidt, Pebody and Mangtani11]. These make it difficult to accurately assess the contribution of influenza illness to school absence. Despite these potential drawbacks, absenteeism data from this study are consistent with previous reports, as they closely followed the general rise, peak and fall of pre-existing clinical, laboratory and syndromic surveillance systems [Reference Lenaway and Ambler7, Reference Mook8]. This study demonstrates these relationships for the first time both prior to and during an influenza pandemic.
Fever is a major symptom of influenza illness in children and through the HPA/NHS Direct system fever calls for children aged 5–14 years are recognized as providing early warning of influenza activity in the community [Reference Cooper15]. Absenteeism rates tended to peak at the same time as fever calls to NHS Direct. A similar pattern was seen with RCGP consultation rates. Reasons for these observations are unclear from the datasets available. However, they may be partially explained by health-seeking behaviour of parents, access to healthcare facilities and parental threshold for calling NHS Direct. Another explanation may be the size of the study population as this study was conducted in an urban area which is part of one of nine health regions in England. Although a larger regional or national study would be useful, to our knowledge this is one of the largest community-based studies conducted to date, containing pre-pandemic and pandemic data and examining absenteeism in relation to pre-existing clinical, laboratory, and syndromic surveillance systems. Previous studies lacked representativeness due to either a very small number of schools, short period of observation or lacked virological data, and were conducted pre-pandemic [Reference Mook8–Reference Schmidt, Pebody and Mangtani11]. A potential limitation of the age-specific analyses we undertook was the minor inconsistency of age groups between datasets: NHS Direct and absenteeism data were analysed by ‘school’ age groups 4–18 years; RCGP data were only available as a standard 5–14 years groups. These differences, however, would have been minimal and in respect of trends there would have been little bearing on the outcome of the analyses.
The role of the media should not be ignored as strong media coverage took place during the 2009 influenza A(H1N1) pandemic, and the media are known to influence the behaviour of the public as well as health professionals [Reference Olowokure24]. Media coverage could have been a source of potential bias as it created significant anxiety in the population [Reference Rubin, Potts and Michie25]. Worst-case scenarios, frequent comparison with the 1918 pandemic, together with constant news updates on number of cases and articles encouraging school closures might have led parents to take the decision to keep children at home or call NHS Direct, regardless of whether or not their child was ill. This requires further epidemiological investigation.
Another potential limitation in the use of absenteeism data is the frequency of false-positive signals. This is, however, a limitation that can be associated with many syndromic surveillance systems; processes employed to limit the impact of false alerts may include the development of statistical thresholds based upon historical data which also compensate for known bias, e.g. the impact of public holidays, and the concordant use of multiple syndromic surveillance systems to support alerts. This latter point is most important; alerts from individual systems need to be compared between systems thus providing a more robust measure of genuine positive alert signals thereby reducing the potential frequency of reporting false-positive alerts.
The impact and confounding effect of co-circulating respiratory pathogens also cannot be ignored. Among these other pathogens, respiratory syncytial virus (RSV) can circulate during temperate winter months, predominantly affecting young children. Clinically, the impact of RSV can present as a similar syndrome to ILI, thus confusing and affecting the overall estimation of the burden of influenza [Reference Fleming, Elliot and Cross26]. However, in the current study we analysed children aged ⩾4 years, thereby reducing the potential impact of RSV on our analyses, which has the greatest impact in young infants aged <1 year [Reference Jansen27].
School absenteeism has the potential to enhance detection of influenza activity in the community and therefore this encourages studies to assess the feasibility of using these data. The strongest factor is that school children acquire infections early and at the same time act as vectors for the infection [Reference Cauchemez28]. Additionally, a school-based surveillance system does not require clinical diagnosis or laboratory testing making it relatively less resource consuming than other systems. Using school absenteeism data also has the advantage that children are legally obliged to attend school and that the data are already routinely collected in a pre-determined format. The drawback with this system in England is that data are currently collected weekly rather than daily. Previous attempts by researchers in England to collect school-based absenteeism data directly from schools on a daily basis met with limited success [Reference Mook8–Reference Schmidt, Pebody and Mangtani11].
In Japan, where influenza-related school absenteeism data are collected daily, attempts have been made to establish absenteeism baselines as a method for triggering school closures in order to control influenza outbreaks in schools [Reference Sasaki29].
The development of baselines for school absenteeism and the use of daily instead of weekly data would not only provide the basis for evidence-based alerts and support risk assessments as to whether public health action is necessary, but could also be useful in examining the occurrence of lag between absenteeism and other sources of influenza-related data.
This study tested absenteeism as a potential surveillance system during the 2009 flu pandemic and concluded that if weekly school-based surveillance had been used during the 2009 pandemic it would not have played a major role in its early detection in the community. Nevertheless, school absenteeism could be a useful complementary system to those already available as it may be valuable in validating other surveillance systems, supporting school-based risk assessments and providing data not captured by other systems. The establishment of a school absenteeism syndromic system could also provide valuable data for further estimating the burden of influenza in the community. Currently, surveillance systems are still only able to monitor the proportion of the population who seek healthcare advice for their symptoms. There is increasing use of data sources from non-healthcare-seeking symptomatic patients [Reference Brooks-Pollock30]; however, data from school absenteeism could enhance our overall understanding of the community burden that occurs during a seasonal or pandemic outbreak.
Further work is required to establish the feasibility of developing daily absenteeism reporting systems, develop baselines and thresholds, further understand the relationship between calls to NHS Direct and school absenteeism and ultimately to implement a prospective surveillance system to evaluate whether school absenteeism is a valid marker for influenza activity.
ACKNOWLEDGEMENTS
We thank Birmingham City Council; NHS Direct; Royal College of General Practitioners and HPA Public Health Laboratory, Heart of England Foundation Trust for providing the data for this study. We also thank Douglas Fleming (RCGP), Keith A. Pryce-Jones (Birmingham City Council Young People and Families Directorate), Roger Morbey (HPA) and Obaghe Edeghere (HPA) for their comments, advice and helpful discussion.
DECLARATION OF INTEREST
None.


