


Impact Statement
The acceleration of wake vortex decay during final approach brought about by the plate lines may allow us to improve both the safety and the runway throughput for arrivals. Airline customers may benefit from a further increased level of safety by the avoidance of wake vortex encounters during final approach, while the potential capacity gains for approach and landing may make aviation more efficient by avoiding delays and holding patterns and possibly may postpone the need to build new runways. A number of airports, air navigation service providers and air navigation organisations follow the development of the plate line concept with great interest. This concept bears the potential of providing benefits in the key performance areas of safety, fuel efficiency, airport capacity and resilience.
1. Introduction
As an unavoidable consequence of lift, every flying vehicle generates counter-rotating regions of turbulence known as wake vortices. Many surveys and reviews on wake vortex research have been published over the years from which, here, the more recent ones appearing within the last quarter of a century are cited (Reference BreitsamterBreitsamter, 2011; Reference Elsenaar, van der Geest, Speijker, de Bruin, Wolf, Braun and JacquinElsenaar et al., 2006; Reference Gerz, Holzäpfel and DarracqGerz, Holzäpfel, & Darracq, 2002; Reference Hallock, Greene and BurnhamHallock, Greene, & Burnham, 1998; Reference Hallock and HolzäpfelHallock & Holzäpfel, 2018; Reference HolzäpfelHolzäpfel et al., 2015; Reference RossowRossow, 1999; Reference SpalartSpalart, 1998). Wake vortices constitute a potential threat to following air traffic. Aircraft must therefore keep to a predetermined minimum separation distance. These aircraft separations limit the capacity of congested airports in a basically rapidly growing aeronautical environment. The most likely economic scenario for the future European airport demand established in 2018 indicated that there will be around 1.5 million unaccommodated flights in 2040, constituting approximately 8% of the expected demand (EUROCONTROL, 2018). Such a lack of capacity could mean 160 million passengers would not be able to travel with a potential economic loss of around € 88 billion to the European economy. It is difficult to estimate to what extent this outlook may have to be adjusted in view of the COVID-19 crisis.
The highest risk of encountering wake vortices prevails in ground proximity, where the vortices cannot descend below the glide path but tend to rebound due to the interaction with the ground surface (Reference Doligalski, Smith and WalkerDoligalski, Smith, & Walker, 1994). Weak cross-winds may compensate the self-induced lateral propagation of the upwind vortex, such that it may hover over the runway directly in the flight path of the following aircraft (Reference Dengler, Holzäpfel, Gerz, Wiegele, De Visscher, Winckelmans and KonopkaDengler et al., 2012; Reference Holzäpfel and SteenHolzäpfel & Steen, 2007; Reference SpalartSpalart, 1998). That is why aircraft experience wake vortex encounters time after time, even under adherence to separation standards (Reference Critchley and FootCritchley & Foot, 1991; Reference HolzäpfelHolzäpfel, 2017). During final approach pilots usually initiate go arounds, since their options to counteract the imposed rolling moment are restricted at low heights above ground.
After the decades-long legal force of the International Civil Aviation Organization (ICAO) minimum aircraft separations employing a three times three aircraft weight class matrix based on maximum take-off weights (ICAO, 2006), the aircraft wake turbulence re-categorisation initiative (RECAT) of ICAO comes to fruition. The RECAT Phase 1 (RECAT-1) classifies aircraft types into six categories considering, besides the weight, the approach speed, wing characteristics and in parts also the rolling moment exerted on following aircraft. The RECAT efforts constitute a shift from weight-based categories to vortex-strength-based categories that rely on vortex decay curves. This new reliance on vortex decay curves is key to enabling the potential application of the plate line concept for enhanced vortex decay in ground proximity.
The RECAT-1 was implemented in November 2012 at Memphis airport (FAA 2014), followed by numerous other US airports. The new European separation standard for aircraft wake turbulence, called RECAT-EU (EUROCONTROL, 2015), was first introduced for arrivals and departures at Paris Charles de Gaulle airport in March 2016 followed by the airports London Heathrow, Leipzig/Halle and Toulouse. The introduction of pairwise aircraft separations RECAT-EU-PWS is foreseen at the first European airports in near future.
Decades of research on effective aircraft modifications aiming at the alleviation of the wake vortex hazard were not successful and have not been in operational use until today. Reference SavaşSavaş (Reference Savaş2005) provides an overview on experimental investigations on wake vortex alleviation starting in the 1970s with various concepts investigated by NASA comprising mass injection, oscillating devices, wing tip modifications, vortex interactions and end plates. In total he lists more than 30 references that can be categorised either as passive schemes enhancing inherent instability mechanisms of vortex systems or as active systems that rely on hastening selected instabilities by forcing the vortices individually or as a system. Some methods focus on the flight phases in high-lift configuration using either passive span load modifications (Reference CrouchCrouch, 1997; Reference StumpfStumpf, 2005; Reference Voß, Melber-Wilkending and RudnikVoß, Melber-Wilkending, & Rudnik, 2006) or active control-surface oscillations (Reference Crouch, Miller and SpalartCrouch, Miller, & Spalart, 2001; Reference Voß, Melber-Wilkending and RudnikVoß et al., 2006). The excitation of instabilities in the multiple-vortex pair system leads to the formation of vortex rings which appear to be more benign for encountering aircraft (Reference VechtelVechtel, 2016). Flight tests with oscillating flaps and so-called direct lift control flaps indicate a somewhat accelerated formation of long-wave instabilities at the expense of slightly impaired passenger comfort (Reference Voß, Gerz, Baumann, Stumpf and PressVoß et al., 2009).
Attempts to accelerate wake vortex decay specifically in ground proximity have been comparatively rarer. Reference KohlKohl (Reference Kohl1973) conducted towing tank experiments with a B747 model to evaluate 15 different vortex dissipation devices comprising barriers as well as suction or blowing slots proposed for installation either transversely across or along the runway. The evaluations based on visual observations indicated the highest effectiveness of the devices fencing the runway that contribute to either constraining and/or disrupting the vortex. Reference BaoBao (Reference Bao2005) patented the generation of counterrotating vortices at the runway ends by suction and blowing of air at the ground surface in order to trigger spiral-shaped instabilities of the wake vortices. Reference Schröder and KonrathSchröder and Konrath (Reference Schröder and Konrath2008) proposed a refined more energy-efficient method that generates instead ring vortices approaching the wake vortices again leading to instabilities propagating along the trailing vortices. Reference Zheng and WeiZheng and Wei (Reference Zheng and Wei2013) as well as Reference Kazarin and GolubevKazarin and Golubev (Reference Kazarin and Golubev2017) conducted numerical simulations indicating that modifications of the ground surface brought about by buildings or a forest canopy and also by water waves may modify vortex trajectories and slightly increase wake vortex decay. Reference Wakim, Brion, Dolfi-Bouteyre and JacquinWakim et al. (Reference Wakim, Brion, Dolfi-Bouteyre and Jacquin2020) suggested an optimal control approach to counteract the wake vortex rebound and allow for a larger lateral vortex displacement by dedicated modifications of the secondary vorticity layer at the ground achieved by specific sucking and blowing along the ground surface. Reference Morris and WilliamsonMorris and Williamson (Reference Morris and Williamson2020) investigated the impingement of a vortex pair onto a wavy surface in their vortex generator facility. The resulting modulated secondary vorticity structures pinch off into vortex rings and may significantly reduce the circulation of the primary vortex pair while the primary vortices remain essentially straight. Based on the insights gained from their investigations, they concluded that ‘[t]he use of ground-based obstacles to modify vortex–ground interactions is an effective means of alleviating the wake vortex hazard at low altitudes near the ground plane’ (Reference Morris and WilliamsonMorris & Williamson, 2020, p. 6).
This manuscript assesses the potential of so-called plate lines to facilitate a reduction of minimum aircraft separations for arrivals. One plate line consists of several upright plates that are installed underneath the approach glide path at the ends of runways (Reference Stephan, Schrall and HolzäpfelStephan, Schrall, & Holzäpfel, 2017). Plate lines accelerate the circulation decay of wake vortices that may rebound into the flight path of following aircraft due to their interaction with the ground surface (Reference Holzäpfel, Stephan, Heel and KörnerHolzäpfel et al., 2016; Reference Stephan, Holzäpfel and MisakaStephan, Holzäpfel, & Misaka, 2013, Reference Stephan, Holzäpfel and Misaka2014; Reference Stephan, Holzäpfel, Misaka, Geisler and KonrathStephan et al., 2014). Encounter simulations employing large eddy simulations (LES) flow fields reveal a significant reduction of the maximal vortex impact on the encountering aircraft after the installation of plate lines (Reference Vechtel, Stephan and HolzäpfelVechtel, Stephan, & Holzäpfel, 2020). Plate lines are passive, cost effective, robust and safe.
In the year 2019, the effectiveness of the plate lines was demonstrated in a large-scale measurement campaign at Vienna International Airport (Reference Holzäpfel, Stephan, Rotshteyn, Körner, Wildmann, Oswald and SmalikhoHolzäpfel et al., 2021). Two temporary plate lines were installed underneath the glide path to runway 16. During a six month period, wake vortex circulation decay was measured for 9473 landings using light detection and ranging (lidar). It was found that plate lines reduce the lifetime of the most safety-relevant wake vortices by 22% for Medium category aircraft and by up to 37% for Heavy category aircraft. Vortex circulation is reduced by 50% for a typical pairing (Medium aircraft following a Heavy aircraft).
Section 2 of this manuscript recapitulates previous investigations of plate line effects and introduces the underlying fluid-dynamics principle. Section 3 gives a survey on the Vienna measurement campaign, which provides the data base for the current investigations, including the positioning of the plates and the instrumentation installed at runway 16 as well as a summary of the key findings from the preceding analysis of this campaign (Reference Holzäpfel, Stephan, Rotshteyn, Körner, Wildmann, Oswald and SmalikhoHolzäpfel et al., 2021). Section 4 then introduces the RECAT-EU methodology and how the wake vortex data have been selected and processed accordingly in order to generate the so-called reasonable worst-case circulation decay curves characterising generic wake vortex behaviour in ground proximity with and without the plate lines. Finally, in § 5 these reasonable worst-case decay curves are translated into the potential for revised minimum aircraft separations for approach and landing. Appendix A additionally addresses the question whether wake vortex decay with and without plate lines could be biased by external parameters influencing wake vortex decay. Further, a comparison of the initial circulation values estimated independently from lidar measurements and Mode S data is presented.
2. Physical mechanism
Wake vortices approaching the ground start to diverge following initially hyperbolic trajectories while they induce a counterrotating vorticity layer at the ground surface. Because of an adverse pressure gradient, the vorticity layer separates from the ground, leading to the formation of secondary vortices. The detached secondary vortices orbit around the primary vortices and the newly formed unequal vortex pairs rebound in a spiralling motion (Reference De Visscher, Lonfils and WinckelmansDe Visscher, Lonfils, & Winckelmans, 2013; Reference Doligalski, Smith and WalkerDoligalski et al., 1994; Reference Stephan, Holzäpfel and MisakaStephan et al., 2013).
Ambient cross-wind introduces another boundary layer corresponding to a vorticity layer at the ground, which is making the vortex rebound asymmetrical. As the secondary vorticity of the luff vortex is attenuated by the cross-wind shear, the luff vortex rebound and its decay are reduced and delayed compared with that of the lee vortex (Reference Holzäpfel, Tchipev and StephanHolzäpfel, Tchipev, & Stephan, 2016). A potentially hazardous situation for following aircraft arises from luff vortices lingering along the runway centreline, when the self-induced lateral propagation velocity of the luff vortex is just compensated by the cross-wind. Measurements at Frankfurt airport and numerical simulations reveal that a cross-wind of approximately half the initial vortex descent speed (0.5–1.2 m s−1) roughly compensates the vortex-induced lateral propagation speed (Reference Holzäpfel and SteenHolzäpfel & Steen, 2007; Reference Holzäpfel, Tchipev and StephanHolzäpfel, Tchipev, & Stephan, 2016). To make matters worse, the possibilities of the pilot recovering from a vortex encounter are limited by the low flight altitude.
Plate lines have been designed to mitigate wake vortex risks during this critical phase of flight. The plate line principle has been investigated thoroughly using computational fluid dynamics as well as laboratory and flight experiments. First, a simplified aircraft model was towed through a towing tank, where rod-shaped obstacles triggered disturbance propagation along the wake vortices, visualised by ink released into the vortex cores through outlets at the wing tips (Reference Stephan, Holzäpfel, Misaka, Geisler and KonrathStephan et al., 2014). Quantitative measurements were conducted with particle image velocimetry indicating substantially accelerated vortex decay rates above and close to the obstacles at the ground.
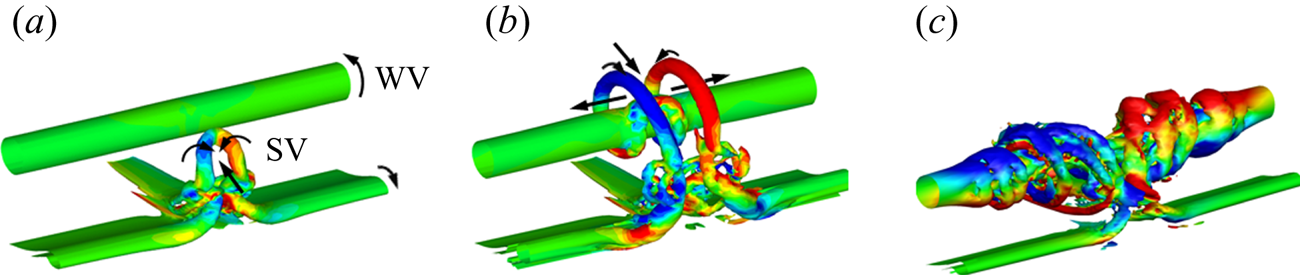
The LES revealed a clearer view on the underlying vortex dynamics (Reference Stephan, Holzäpfel, Misaka, Geisler and KonrathStephan et al., 2014). When a vortex gets close to the obstacle, strong Ω-shaped secondary vortices are induced at the obstacle's surface that actively approach the wake vortices by self-induced motion (see figure 1a). Then, the secondary vortices are wrapped around the wake vortices by the primary wake vortex flow (figure 1b). Finally, the secondary vortices propagate along either side of the wake vortices, again driven by self-induced motion, and accelerate their decay (figure 1c). In figure 1 curved arrows denote the rotational direction of the vortices while straight arrows denote their self-induced directions of propagation.
Plate lines decay mechanism: Ω-shaped secondary vortex (SV) approaches the wake vortex (WV) and wraps around it leading to premature wake vortices decay (Reference Stephan, Holzäpfel and MisakaStephan et al., 2013).
In order to enable an installation at airports, the massive obstacle was replaced by a series of plates, where the individual plates are aligned with the flight direction. The LES indicated that the effects of a plate line are even superior to those of a massive obstacle, which can be attributed to the increased surface roughness of the plates compared with the smooth obstacle (Reference Stephan, Holzäpfel and MisakaStephan et al., 2013). The LES were used to optimise the plate shape and position (Reference Stephan, Schrall and HolzäpfelStephan et al., 2017) and to investigate the impact of the cross-wind and headwind (Reference Stephan, Holzäpfel and MisakaStephan et al., 2013). As a result, a plate line with optimised plate dimensions of 4.5 m height and 9 m length, consisting of eight plates with a plate separation of 20 m was designed. A respective patent has been filed under number DE 10 2011 010 147 followed by international patents in the countries Austria, France, the UK, Japan, Singapore and Switzerland. The patent was refused in the USA.
In April 2013 flight experiments were conducted with the DLR research aircraft HALO (Gulfstream G550) at special airport Oberpfaffenhofen (Reference Holzäpfel, Stephan, Heel and KörnerHolzäpfel et al., 2016). HALO was flying traffic patterns in a high-lift configuration at a constant height of approximately one initial vortex separation b 0 = 22 m over a single plate line. The plate line consisted of six wooden plates that were folded up and down in an alternating manner during the overflights in order to minimise effects of changing environmental conditions on vortex behaviour. Lidar measurement results indicated that the lifetime of the longest-lived and thus potentially most hazardous wake vortices could be reduced by one third.
3. Measurement campaign
The DLR and Austro Control partnered to accomplish a comprehensive plate line demonstration campaign at Vienna International Airport between 6 May and 28 November, 2019, which is described in detail in Reference Holzäpfel, Stephan, Rotshteyn, Körner, Wildmann, Oswald and SmalikhoHolzäpfel et al. (Reference Holzäpfel, Stephan, Rotshteyn, Körner, Wildmann, Oswald and Smalikho2021). A plate line design was developed that is compatible with airport requirements such as obstacle clearance, frangibility, stability against wake vortices and storms, acceptable interference with the localiser and visibility of the approach lighting. The developed plate line design for temporary installation at Vienna airport consists of four wooden frames covered by truck tarpaulin with a height of 4.5 m and a length of 2.25 m. A complete plate consisting of four frames has the dimensions of 4.5 m height and 9 m length (see figure 2). The plates can be folded up and down and secured at the ground when they are not used. After a safety assessment conducted by the EASA (European Union Aviation Safety Agency) Safety- and Compliance Management of Vienna International Airport, the installation of the plate lines was approved by Austrian authorities. Currently, a plate design for permanent installation at an airport is developed.
A380 overflight of experimental plate lines installed at localiser of runway 16 of Vienna International Airport.
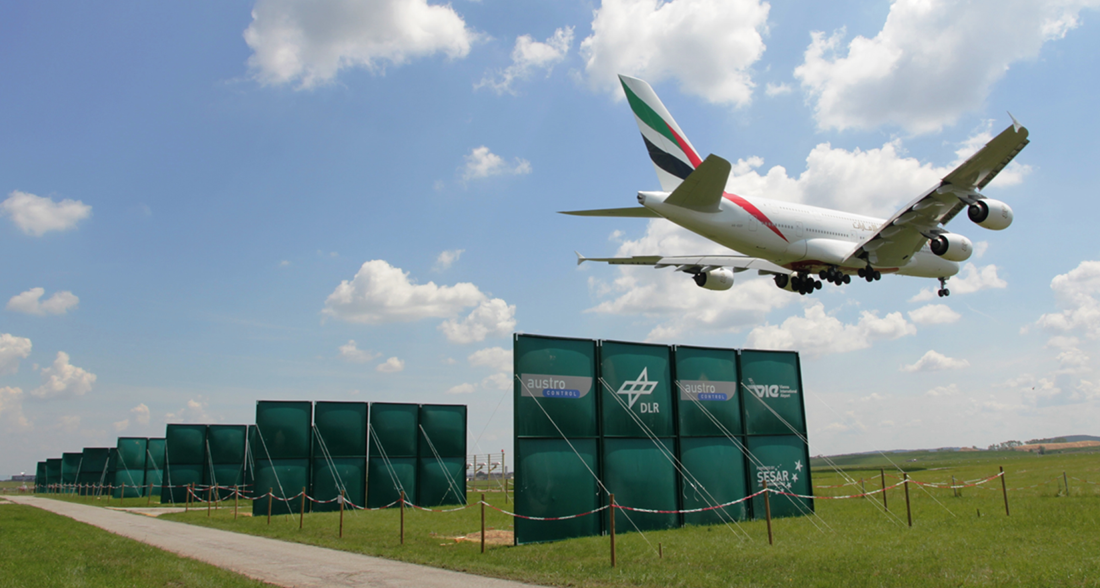
Figure 3 shows the positioning of the two plate lines (red dashes) and the instrumentation. The threshold of runway 16 can be seen in the lower part of the figure. The first plate line, consisting of 8 plates separated by 20 m, is situated at a distance of approximately 400 m to the threshold of runway 16. The second plate line is placed at a distance of 340 m to plate line 1. Three lidars of type Leosphere Windcube 200S alternatingly situated in measurement positions L1–L5, captured the evolution of vortex position and strength (i.e. circulation). The lidars were scanning in vertical planes perpendicular to the flight direction.
Positioning of plate lines (red dashes) and measurement instrumentation on apron of runway 16 at Vienna International Airport (© Google 2017).
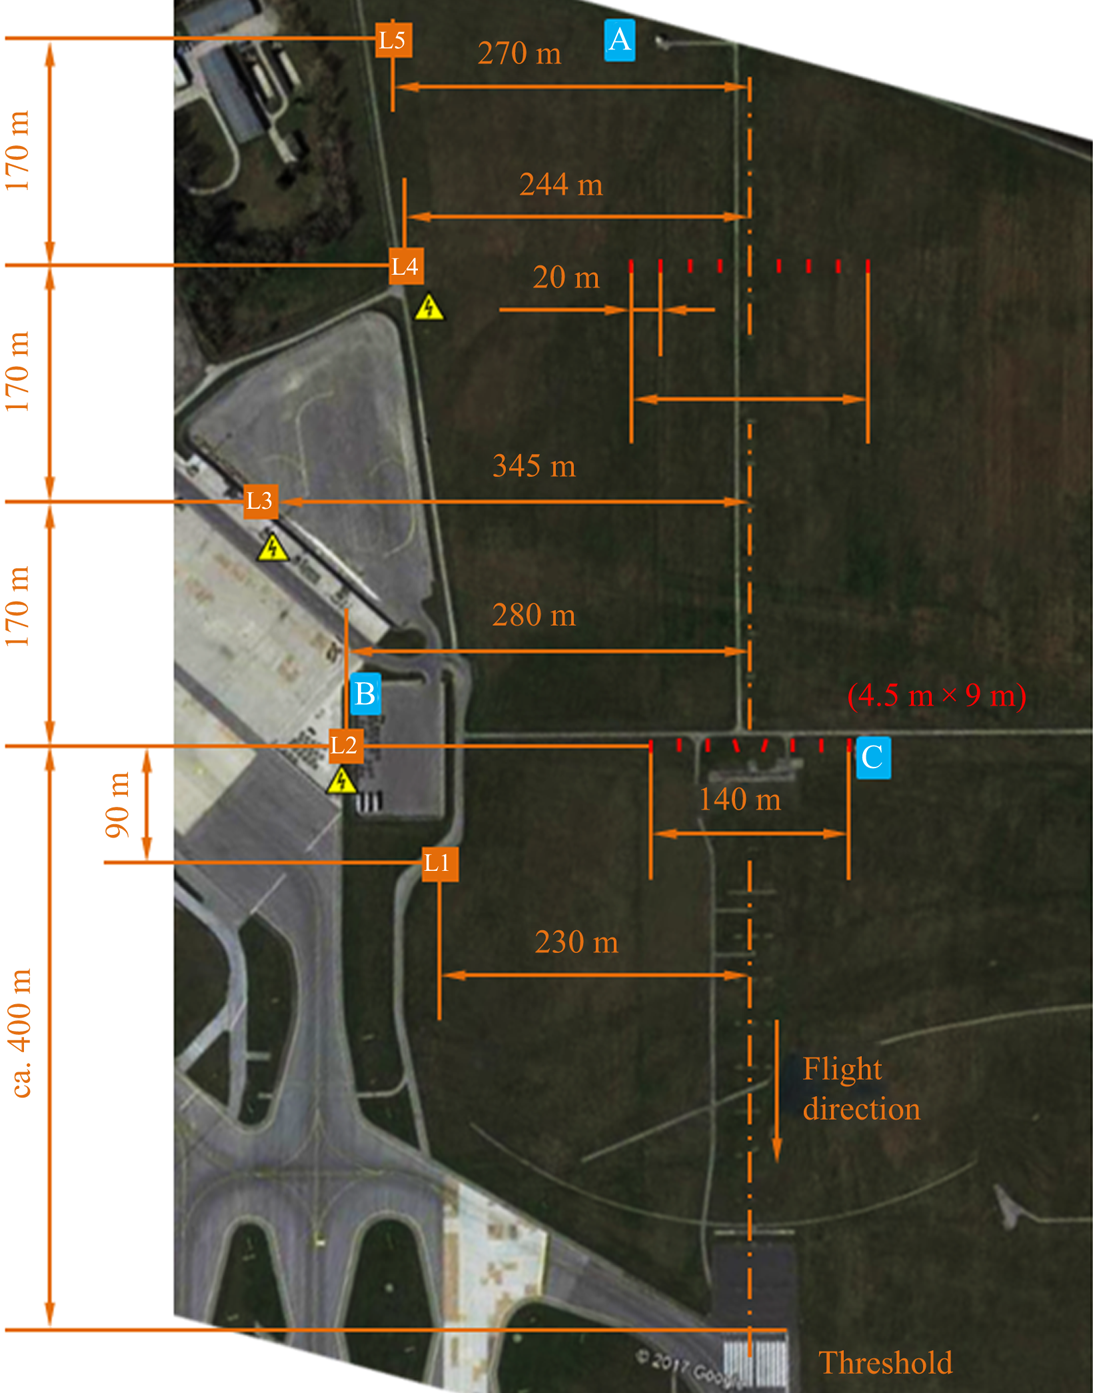
Median flight altitudes above ground at the lidar planes L1–L5 were determined from Mode S data protocols to 39.9, 45.0, 53.6, 64.3 and 74.2 m, respectively, with a standard deviation of 4.2 m. Mode S is a secondary surveillance radar process that allows selective interrogation of aircraft employing ground-based interrogators and airborne transponders (ICAO, 2004). The Mode S data protocols contained aircraft position, attitude and airspeed data as well as atmospheric pressure, wind speed and temperature data at an update rate of four seconds.
Positions A and B in figure 3 were equipped with the transmitters and receivers of the RPG (Radiometer Physics GmbH) microwave scintillometer and the Kipp & Zonen large aperture optical scintillometer. The combination of these instruments enables synchronous measurements of latent and sensible heat fluxes in the atmospheric surface layer. From the scintillometer data also the structure parameter  $C_n^2$ can be computed, which is proportional to turbulence intensity. Wind measurement data consisting of 2 min averages are taken from the anemometer of runway 16 (WMA16) situated approximately 760 m from plate line 1. A number of additional meteorological sensors were installed for this campaign (Reference Holzäpfel, Stephan, Rotshteyn, Körner, Wildmann, Oswald and SmalikhoHolzäpfel et al., 2021), which are not used for the current analyses.
During the validation campaign, the wake vortex behaviour during 9473 landings was captured in the majority of cases with all three lidars. For approximately a quarter of these landings, the plate lines were folded up and functional. Landings, where the plate lines were folded down and secured on the ground were used as reference cases without accelerated decay. For 21 days, measurements with plate lines took place and measurements without plates were taken for 45 days. Due to the quite time-consuming and partly interactive lidar data processing procedure based on the method suggested by Reference Smalikho, Banakh, Holzäpfel and RahmSmalikho et al. (Reference Smalikho, Banakh, Holzäpfel and Rahm2015), only a part of the measurements could be made available for analysis; 235 approaches with plates were processed corresponding to 589 individual vortex pair evolutions. Without plates 266 approaches were processed with 637 individual vortex pair evolutions.
The lidar measurements were selected for processing according to their potential to facilitate wake vortex encounters of the follower aircraft. At London Heathrow airport most encounters were observed for cross-winds below 2 knots and headwinds next to zero (Reference Critchley and FootCritchley & Foot, 1991). With increasing headwind, disturbances caused by the touchdown of the aircraft, so-called end effects, are transported ever faster into the measurement planes, accelerating vortex decay (Reference Stephan, Holzäpfel and MisakaStephan, Holzäpfel, & Misaka, 2014; Reference Holzäpfel, Stephan, Heel and KörnerHolzäpfel et al., 2016). This effect is also visible in the Vienna data set (see section V.C. in Reference Holzäpfel, Stephan, Rotshteyn, Körner, Wildmann, Oswald and SmalikhoHolzäpfel et al., 2021). In order to focus the analysis on wind situations prone to potential encounters, only cases with weak headwinds below 2 m s−1 and weak cross-winds mostly below 2 m s−1 were selected for processing. This includes also cases with tailwinds, where an accumulation of encounters was observed at Vienna airport (Reference HolzäpfelHolzäpfel, 2017).
The key findings of the preceding analysis of the plate line measurement campaign documented in Reference Holzäpfel, Stephan, Rotshteyn, Körner, Wildmann, Oswald and SmalikhoHolzäpfel et al. (Reference Holzäpfel, Stephan, Rotshteyn, Körner, Wildmann, Oswald and Smalikho2021) are
• wake vortex lifetime reductions caused by plate lines and in a high-turbulence regime appear similar;
• a single plate line is almost as effective in promoting wake vortex decay as two plate lines;
• wake vortex lifetime reductions increase with aircraft size from 22% for A320 to 37% for B772 aircraft; and
• plate lines may reduce circulation by 50% for Medium weight class aircraft landing behind Heavys.
4. Adjustment to RECAT-EU methodology
4.1 RECAT-EU methodology
The safety case for the European proposal for revised wake turbulence categorisation and separation minima on approach and departure, termed RECAT-EU, is documented in EUROCONTROL (2017). RECAT-EU constitutes an optimisation of ICAO wake turbulence categories enabled by increasing the number of wake turbulence categories from four to six categories. In contrast to the ICAO aircraft separation matrix, which is based solely on the maximum take-off weights of the leading and the following aircraft types (ICAO, 2007), RECAT-EU considers for its restructuring of the wake turbulence categories the strength of the wake vortices generated by an aircraft and also the resistance of the following aircraft to the wake encounter severity.
The design case employs reasonable worst-case situations for an aircraft to encounter a wake vortex during approach. The definitions of the reasonable worst-case situations relevant for the current study are postulated as follows: (i) ‘weather conditions are such that the wake vortex is not transported by wind out of the flight corridor of the follower aircraft in case of in-trail arrivals to single runways’, (ii) ‘weather conditions affecting decay of wake vortex circulation, i.e. atmospheric turbulence and temperature stratification, are such that there is minimum decay of the wake vortex circulation (low wind, low turbulence, low stratification)’, and (iii) ‘the follower aircraft encounters the wake vortex while flying close to the ground during its approach to landing. It is acknowledged that reportable wake turbulence encounters can also occur on the glide slope and especially at glide slope intercept during approach operations. Due to the missing interaction with the ground boundary layer the vortex strength is typically larger for identical separation distances under these circumstances. Nevertheless, these operational scenarios are regarded as less hazardous compared with encounters close to ground because more height above ground remains for counteracting the adverse effects of an encounter’.
The wake vortex decay data meeting these reasonable worst-case conditions were obtained by selecting the top two per cent of the longest-lived wake vortices generated by Heavy aircraft from a data base containing over 100 000 tracks collected over two years at London Heathrow airport. Reasonable worst-case decay curves established for eight individual aircraft types of the category Heavy were combined to compile a generic normalised reasonable worst-case decay curve. Although, here, the traffic mix used to establish the reasonable worst-case decay curves is composed of 10 different aircraft types of the category Heavy, it mainly relies on two Heavy aircraft types and one in the category Medium (for details on employed traffic mix see Appendix A). Additional data collection may be needed to assure that the derived separation reduction potential can be applied to all aircraft types.
An overview on the RECAT-EU methodology is provided by Reference Rooseleer, Treve, De Visscher and GrahamRooseleer et al. (Reference Rooseleer, Treve, De Visscher and Graham2016). Details with respect to the characterisation of wake vortex circulation decay in reasonable worst-case conditions can be found in Reference Bourgeois, Choroba and WinckelmansBourgeois, Choroba, and Winckelmans (Reference Bourgeois, Choroba and Winckelmans2012) and Reference De Visscher and WinckelmansDe Visscher and Winckelmans (Reference De Visscher and Winckelmans2016), while the encounter severity metric is described in Reference De Visscher, Winckelmans and TreveDe Visscher, Winckelmans, and Treve (Reference De Visscher, Winckelmans and Treve2015).
As the RECAT-EU safety case has been approved by authorities and as it is applied in operations at several airports, the approach of the current assessment of the aircraft separation reduction potential facilitated by plate lines is to adopt the RECAT-EU methodology as closely as possible. This way substantial parts of the RECAT-EU safety case also apply for this assessment without requiring further consideration. Some aspects of the RECAT-EU methodology need to be adjusted and extended in order to comply with the nature of the plate line method. These deviations from the RECAT-EU methodology are clearly marked in the following. Whether or not the rationale (iii), that wake vortex evolution on the glide slope and at the glide slope intercept can be considered as less hazardous, can still be applied with the reduced vortex lifetimes facilitated by plate lines is not within the scope of this investigation and has to be demonstrated elsewhere.
4.2 Data selection
The measurement data are subject to a number of selection criteria in order to qualify for the RECAT-EU methodology. First, one should be aware that, already, the Vienna measurements were preferably scheduled during environmental conditions enabling persistent and safety-relevant wake vortices. Then, the gathered lidar data were pre-sorted for processing in order to yield the most safety-relevant, long-lived and strongest vortices with the potential to lead to hazardous situations that in turn could be alleviated by the plate lines. For this purpose, only wake vortices evolving under low-wind situations with headwinds below 2 m s−1 were selected (see § 3). This preselection means that a substantial part of the processed vortices also matches the RECAT-EU reasonable worst-case conditions.
The plate lines were designed to accelerate wake vortex decay within a safety corridor ranging laterally over a width of ±50 m from the extended runway centreline. For vortices advected beyond that safety corridor the plate line effects diminish substantially. The dimensions of the safety corridor were inspired by the definition of a safety area of a runway of the Frankfurt wake vortex warning system WVWS (Reference Gurke and LaffertonGurke & Lafferton, 1997). The WVWS assumes an ample maximum lateral deviation of the aircraft from the extended centreline of ±15 m plus a critical gap of ±30 m between the vortex core and the aircraft fuselage. The resulting safety corridor of ±45 m has been rounded up to ±50 m.
Including vortices in the analysis that are quickly and irrevocably advected out of the safety corridor would be irrelevant for the encounter risks of following aircraft and would unnecessarily underestimate the plate line benefits. For this reason, all vortices leaving the lateral safety corridor before a certain vortex age, tmin, are disregarded unless they drift back into the corridor at any higher vortex age.
Reference Bourgeois, Choroba and WinckelmansBourgeois et al. (Reference Bourgeois, Choroba and Winckelmans2012) use a lateral safety corridor of ±100 m width and disregard vortices drifting outside this corridor before 58 s. The value of 58 s corresponds to the minimum radar separation (MRS) of 2.5 NM based on the conservative assumption of an approach speed of transport aircraft of 155 knots. As aircraft are not separated by less than the MRS, they cannot encounter wake vortices that have left the safety corridor before. In order to be consistent with that reasonable criterion, we disregard vortices drifting outside the ±50 m corridor before a period of time of tmin = 29 s unless they drift back into the corridor at any higher vortex age. As in the RECAT-EU approach, the measured vortex evolution is not truncated when the vortices leave the safety corridor but is always considered completely. Truncation of vortex evolution would unnecessarily deteriorate the fits of the two-phase circulation decay model to the circulation data (see § 4.3). To our knowledge the RECAT-EU safety case did not employ any such corridor criterion ensuring the compliance with definition (i) of the reasonable worst-case situations listed in § 4.1.
As explained in the Appendix, the measurement planes L4 and L5 with A320 overflight heights above 1.8 wing spans have been excluded, as the vortex measurements following the RECAT-EU approach are intended to start at approximately one wing span above ground. For the remaining wake vortices generated by the Heavy aircraft types, all lidar measurement planes are considered.
Figure 4 shows the vortex evolutions selected for the RECAT-EU analysis. Measurements with plate lines are denoted by green dots for the port vortices and blue dots for the starboard vortices, whereas the reference cases without plates are represented by red dots for the port vortices and magenta dots for the starboard vortices. The individual panels show vortex height z against vortex age t (a), vortex height z against vortex lateral position y (b, y = 0 corresponds to the extended runway centreline), vortex lateral position y against vortex age t (c) and vortex circulation  $\varGamma$ against vortex age t (d).
Lidar measurements of wake vortices position and circulation of 531 vortex evolutions without plates and 485 vortex evolutions with plates entering the RECAT-EU analysis (aircraft weight classes M, H, J). PL, plate lines.
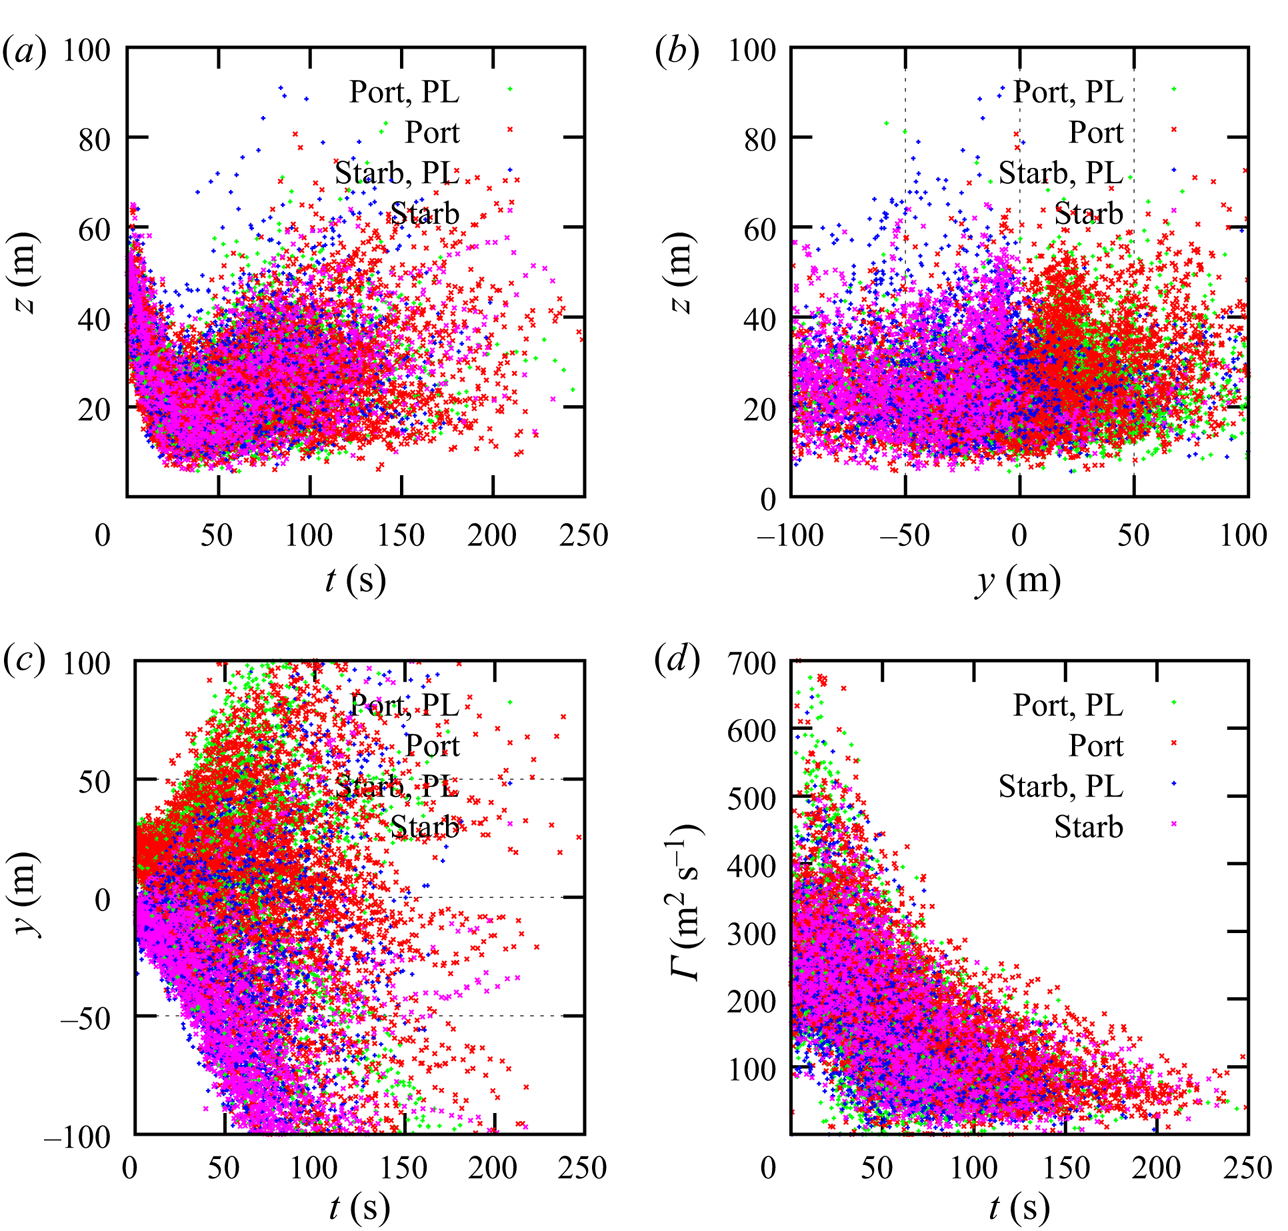
The substantial spread of initial circulations is caused by the different aircraft types spanning three ICAO aircraft weight classes. It is further increased by the substantial scatter of lidar measurements typically observed for young vortices, where the complex vortex system detaching from the aircraft in high-lift configuration is not yet rolled up into a single vortex pair (Reference Holzäpfel, Gerz, Köpp, Stumpf, Harris, Young and Dolfi-BouteyreHolzäpfel et al., 2003).
Figure 4 illustrates that a substantial part of the considered vortex evolutions extends outside the ±50 m safety corridor where it is not affected by the plates anymore. The distinct edges of the lateral vortex transport in panel (c) of figure 4 indicate that the selection criterion suggested by Reference Bourgeois, Choroba and WinckelmansBourgeois et al. (Reference Bourgeois, Choroba and Winckelmans2012) (the vortices must reside within a safety corridor of ±100 m until at least tmin = 58 s) is almost equivalent to the one applied here (|y| < 50 m until tmin = 29 s).
4.3 Reasonable worst-case decay curves
During the Vienna campaign lidar measurements were conducted in five vertical planes in order to characterise vortex decay in front, above, between and behind the two plate lines and to demonstrate that wake vortices encounter risks are alleviated by the installation of plate lines all along that part of the final approach, where wake vortices may endanger follower aircraft by rebounding into the flight corridor (Reference Holzäpfel, Stephan, Rotshteyn, Körner, Wildmann, Oswald and SmalikhoHolzäpfel et al., 2021). In contrast, RECAT-EU considers a flight altitude of one wing span above ground as an integral element of the identified reasonable worst-case conditions (Reference De Visscher and WinckelmansDe Visscher & Winckelmans, 2016). As this aircraft type specific flight altitude cannot be realised for various aircraft types within a single measurement plane, even with dedicated measurement set-ups, the vortex measurements are adjusted in time, such that the considered vortex evolutions always begin at a height of one wing span of the vortex generator aircraft.
For this purpose, each individual circulation decay curve is shifted by Δt such that the height of the vortices at t = 0 corresponds to one generator wing span. The required time shift Δt is calculated using the difference between the actual height of the first measurement, z 0, and the generator's wing span, B, divided by the initial vortex descent speed w 0
 \begin{equation}\Delta t = \frac{{\Delta z}}{{{w_0}}} = \frac{{2\mathrm{\pi }{b_0}({z_0} - B)}}{{{\varGamma _0}}}.\end{equation}
 Herein, the initial vortex descent speed, w 0, is derived from the estimates of initial circulation,  $\varGamma$0, and the initial vortex separation, b 0. Note that Δt assumes a positive value if the flight altitude is above B and a negative value if the flight altitude is below B. While the initial circulation is estimated using the two-phase decay model fits described below, the initial vortex separation is estimated as the median of the measurements with and without plates for all recorded approaches of a specific aircraft type during the first quarter of the characteristic vortex time scale
 \begin{equation}{t_0} = \frac{{{b_0}}}{{{w_0}}} = 2\mathrm{\pi }\frac{{b_0^2}}{{{\varGamma _0}}}.\end{equation}
The vortex time scale t 0 corresponds to the time the vortices need to descend by one vortex separation, b 0. As the determination of b 0 depends on t 0, this calculation needs to be performed iteratively. The thus estimated initial vortex separations, b 0,estimate, are plotted in figure 5 against the theoretical vortex separations assuming elliptical lift distribution
 \begin{equation}{b_{0,elliptic}} = \frac{\mathrm{\pi }}{4}B.\end{equation}
Initial wake vortex separations of the 12 considered aircraft types; estimates from measurement data versus theoretical approximations.

The aircraft types A320, B763 and B772 are labelled as they are used in the following for aircraft type specific evaluations. For many aircraft types the deviations between the estimated and elliptical vortex separations reside below 10%.
In order to smooth the scatter of the lidar data and to enable extrapolation to low circulation values that cannot be evaluated from the lidar data due to the progressive erosion of the vortex structure, the measured circulation evolutions are fitted by a two-phase decay model (Reference Bourgeois, Choroba and WinckelmansBourgeois et al., 2012). In ground proximity, a phase of rapid decay typically is initiated following the initial gradual decay shortly after the vortices have reached the lowest altitude and start to rebound (Reference De Visscher, Lonfils and WinckelmansDe Visscher, Lonfils, & Winckelmans, 2013; Reference Holzäpfel and SteenHolzäpfel & Steen, 2007; Reference Holzäpfel, Tchipev and StephanHolzäpfel, Tchipev, & Stephan, 2016; Reference Proctor, Hamilton and HanProctor, Hamilton, & Han, 2000). Out of ground effect also continuous decay or three-phased decay is observed depending on the prevailing environmental conditions (Reference Holzäpfel, Misaka and HennemannHolzäpfel, Misaka, & Hennemann, 2010; Reference Proctor, Ahmad, Switzer and Limon DuparcmeurProctor et al., 2010).
The two phases of circulation decay
 \begin{equation}\varGamma \textrm{(}t) = \left\{ {\begin{array}{ * {20}{l}} {{\varGamma_0}\,\textrm{exp}( - {\alpha_1}t),}&{t \le {t_d}}\\ {{\varGamma_0}\,\textrm{exp}(({\alpha_2} - {\alpha_1}){t_d} - {\alpha_2}t),}&{t > {t_d}} \end{array}} \right.\end{equation}
are blended at td which can be considered the time at which a catastrophic demise event takes place (Reference SarpkayaSarpkaya, 2000) that in turn initiates the onset of rapid decay (Reference Holzäpfel and SteenHolzäpfel and Steen 2007). In (4.4),  $\varGamma$0 denotes the initial circulation while the decay parameters α1 and α2 describe the rates of decay during its two phases. While during the interaction with a flat ground td corresponds to a time shortly after the vortices have reached the lowest altitude, the rapid decay triggered by the plates sets in almost immediately after the generation of the wake vortices directly above the plate lines and is delayed with increasing distance from the plate lines (Reference Stephan, Holzäpfel and MisakaStephan et al., 2013, Reference Stephan, Holzäpfel, Misaka, Geisler and Konrath2014; Reference Stephan, Holzäpfel and MisakaStephan, Holzäpfel, & Misaka, 2014).
The fitting is performed by minimising the residues between the modelled circulation  $\varGamma$(α 1, α 2, t d, $\varGamma$0, ti) and the circulation values $\varGamma$(ti) measured at vortex ages ti via least-squares fits. As the only constraint, the fitting limits the initial circulation value,
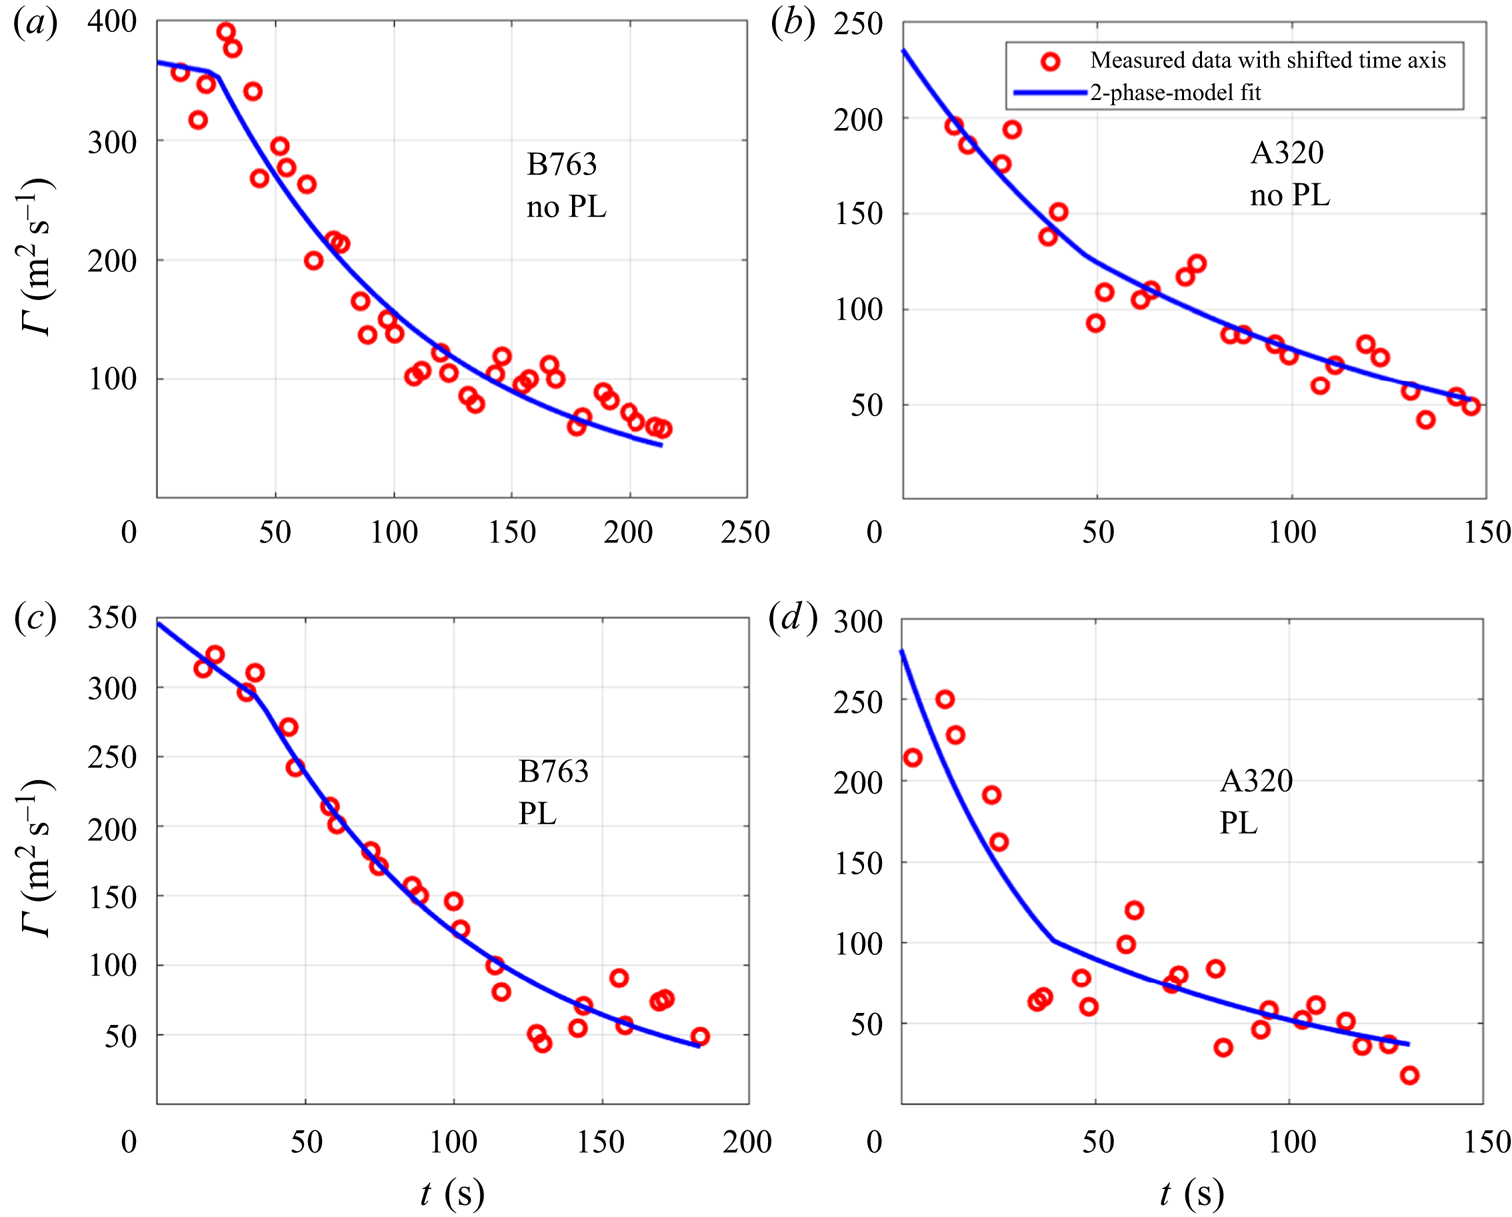
  $\varGamma$0, to a range of ±50 m2 s−1 around the average value of the first three measurements. Figure 6 illustrates exemplarily that this constraint provides for meaningful circulation decay curves and avoids unreasonable overestimates of initial circulation. Depicted are four representative examples of measurements without plate lines in (a,b) and with plates in (c,d). Most fits (90%) feature an initially gradual decay followed by a phase of rapid decay with α 2 > α 1 as shown in figure 6(a,c) and as mostly observed in numerical simulations and also in the statistics of measurement data provided that the data are centred on the onset time of rapid decay (Reference HolzäpfelHolzäpfel, 2006). An example of the immediate rapid decay with α 1 > α 2 expected from laboratory experiments and numerical simulations directly above the plate lines is shown in figure 6(d) (Reference Stephan, Holzäpfel and MisakaStephan et al., 2013, Reference Stephan, Holzäpfel, Misaka, Geisler and Konrath2014; Reference Stephan, Holzäpfel and MisakaStephan, Holzäpfel, & Misaka, 2014). Above flat ground the initial rapid decay is less distinct and less frequent (4.2%) as with erected plate lines where it occurs in 5.8% of the vortex evolutions. Initial circulation estimates achieved by this fitting procedure are compared with estimates employing Mode S data in the Appendix A.
Exemplary fits of two-phase circulation decay model to lidar measurements without/with plates in a,b/c,d, respectively. PL, plate lines.
In order to generate the reasonable worst-case circulation decay curve, RECAT-EU employs the top 2% of the most long-lasting wakes corresponding to those vortices with a measured normalised lifetime beyond t* = 5 for B744 aircraft (Reference De Visscher and WinckelmansDe Visscher & Winckelmans, 2016). Initial circulation is normalised by  $\varGamma$0 estimated via the two-phase decay model fits and the vortex age is normalised with the vortex time scale, t 0, based on the b 0 and $\varGamma$0 estimates following (4.2). Normalised quantities are denoted by an asterisk. It is shown that the normalised top 2% of circulation decay curves of the vortices generated by eight different Heavy aircraft types exhibit quite similar characteristics such that they can be combined. From the resulting bunch of normalised circulation decay curves the median curve is considered the generic reasonable worst-case circulation decay curve. The median of the decay curves is not affected by any outliers and thus provides a robust estimate of the reasonable worst-case circulation decay curve without additional filtering.
Now the median curve of the normalised circulation decay fits of the vortices selected from the Vienna data (as described in § 4.2) is fitted to the RECAT-EU reasonable worst-case curve by adjusting the lifetime threshold to t* > 3.5, corresponding to 72% of the considered measurement data. The reason for this significantly larger percentage is that for the execution of measurements at Vienna airport and the selection of cases for processing preferably reasonable worst-case atmospheric conditions were considered, leading to a much longer average vortex lifetime. Figure 7(a) illustrates the good agreement between the RECAT-EU reference and the representation of the reasonable worst-case decay curve achieved here, where the two-phase decay characteristics are somewhat more pronounced for the current curve. The good agreement of the decay curves made up of the different data sets provides good confidence that the applied methods are actually equivalent.
Normalised reasonable worst-case circulation decay curves from RECAT-EU and the corresponding decay curves established from the Vienna data without and with plate lines (a). Corresponding decay curves for different percentages of top long-lived vortices (b). PL, plate lines.

The reasonable worst-case circulation decay curve for the cases with plate lines is produced in analogy by selecting the top 72% of the longest-lived vortices. As shown in the Appendix A, any other external factors that could speed up circulation decay with the plates in comparison with the reference cases with flat ground cannot be identified, such that the accelerated decay seen in figure 7(a) can be fully attributed to the plate lines.
Figure 7(b) depicts the reasonable worst-case decay curves with and without plate lines for different percentiles of the top long-lived vortices to illustrate the sensitivity of the decay curves to the fraction of the used circulation data. As expected, lower percentages of the top long-lived cases lead to longer lifetimes with and without plates and vice versa for larger percentages. Further, the curves built from fewer data are a little less smooth. Overall, the sensitivity to the particular percentages of the data appears rather weak and all displayed decay curves preserve the typical characteristics.
Figure 8 depicts the worst-case circulation decay curves for the individual aircraft types A320, B763 and B772 together with those derived for the traffic mix plotted in figure 7(a) in comparison with the RECAT-EU reference. The aircraft type specific curves are all established for the same vortex lifetime threshold as the traffic mix of t* > 3.5. However, this lifetime threshold corresponds to different percentages of the selected vortex evolutions amounting to 71% for the A320, 83% for the B763, and 74% for the B772. The curves with flat ground all compare reasonably well to the RECAT-EU reference curve, where the curves for the Heavies are somewhat less smooth due to the smaller amount of available measurement data.
Normalised reasonable worst-case circulation decay curves from RECAT-EU and the corresponding curves without and with plate lines for the traffic mix and for three particular aircraft types representing different RECAT-EU categories built from cases with normalised vortex lifetimes beyond 3.5. PL, plate lines.
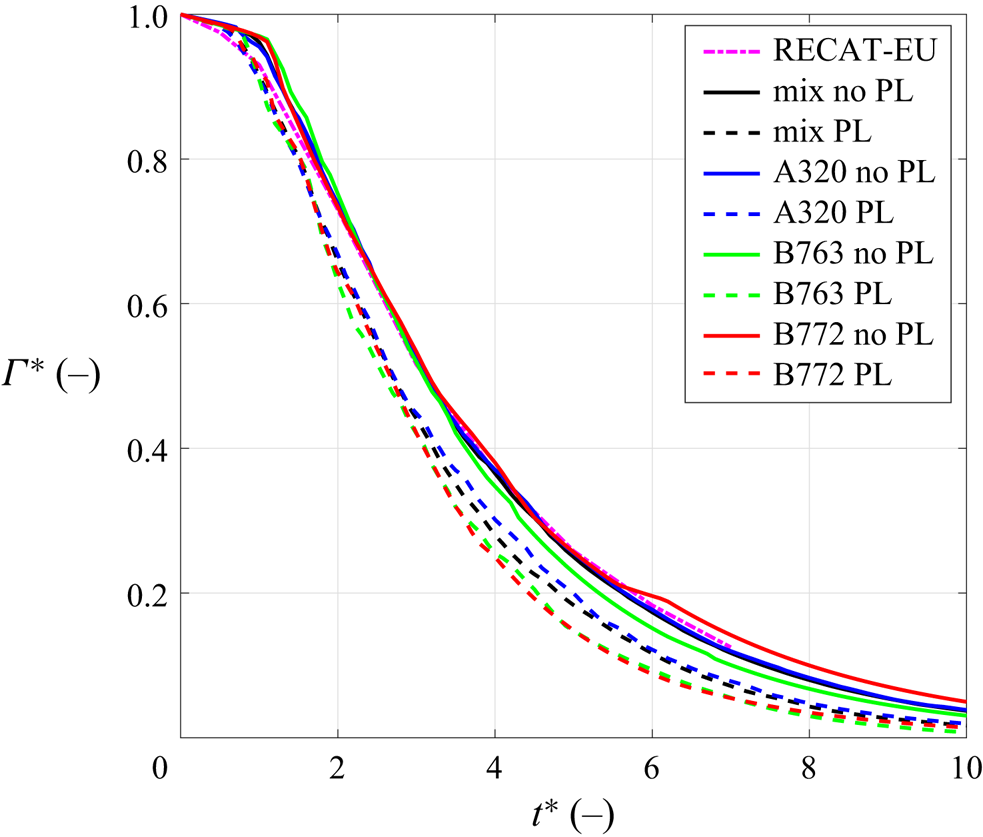
Figure 9(a) now displays the time shifts, Δt*, between the normalised reasonable worst-case decay curves without and with plate lines visualised in figure 8. For all considered aircraft types the time shift establishes almost without ramp-up time and then increases approximately linearly with time. The plate line effects are more pronounced the larger the aircraft after t* = 3. Obviously, the large percentage of A320 cases of 74% lowers the time shifts attributed to the traffic mix.
Potential reduced aircraft separations dependent on vortex age. Dimensionless time shifts between the reasonable worst-case decay curves with and without plate lines for different aircraft types (a). Corresponding time shifts using different percentages of top long-lived vortices of the traffic mix (b).
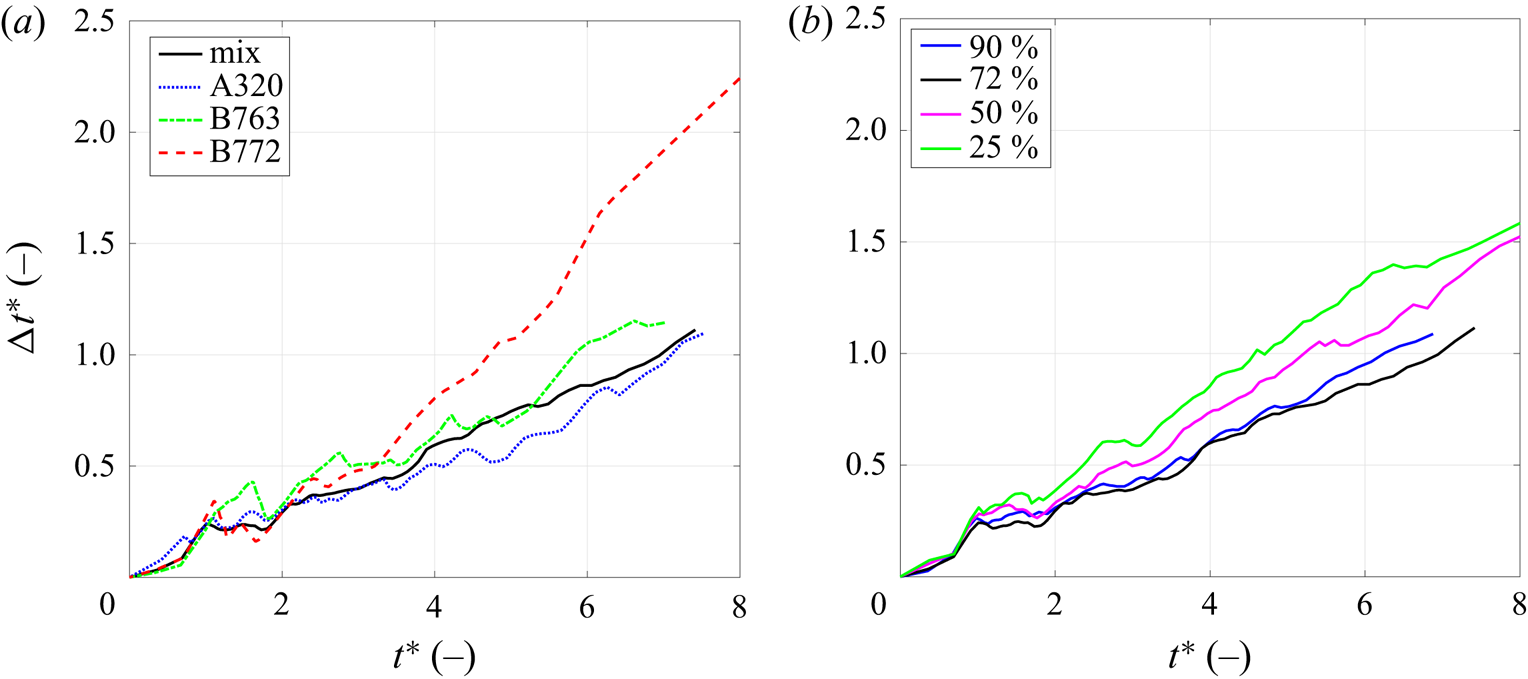
As the A320 as wake generator is only relevant for the minimum separation distance to light follower aircraft, the potential benefits of the plate effect are underestimated by the decay curves of the traffic mix. Focusing on Heavy aircraft, as done within the RECAT-EU safety case, would most likely increase the separation reduction potential of the plate lines. This should be considered for future lidar measurement campaigns.
Figure 9(b) illustrates the time shifts, Δt*, between the normalised reasonable worst-case decay curves without and with plate lines for different fractions of the top long-lived vortices (cf. figure 7b). The more persistent the vortices corresponding to lessened environmental disturbances, the more effective the plate lines and the higher the Δt* values. This confirms that the plate lines are particularly useful in potentially hazardous situations where environmental conditions enable persistent wake vortices lingering in the glide path. In contrast, moving to higher percentiles of the circulation decay data corresponding to less long-lived nominal vortices, the lifetime reductions appear not reduced compared with the 2% top long-lived vortices corresponding to 72% of the data. Both trends, of the increasing benefits in calmer environments and the saturation of the plate effects in more turbulent environments, have been confirmed by a large number of alternatively selected percentiles not shown here.
5. Separation reduction potential
Based on the reasonable worst-case decay curves with and without plate lines introduced in § 4.3, revised minimum aircraft separations can be derived. These revised separations ensure that the maximum circulation that a follower aircraft might be exposed to is not larger than under adherence to the RECAT-EU minimum separations in the most critical part of the final approach, where wake vortices may rebound to the flight path.
As the worst-case decay curve without plates corresponds to the respective decay curve from RECAT-EU, it is considered equivalent to the approved RECAT-EU reference for safe minimum aircraft separations for approach and landing. This means that, under adherence to the RECAT-EU minimum separations, a following aircraft can be exposed to a specific maximum circulation, which has been approved by authorities and thus is accepted to be safe (EUROCONTROL, 2017). Consequently, it can be expected that, if a following aircraft is exposed to the same circulation at an earlier vortex age with plates, this must be safe as well.
Given the approach speed of a following aircraft, the minimum spatial separation distance, as prescribed by RECAT-EU, can be translated into a minimum time-based separation, corresponding to an acceptable circulation value for that aircraft type. The vortex age at which that circulation value is reached with plates, can then be retranslated into a reduced separation distance facilitated by the plate lines.
Figure 10 delineates this procedure exemplarily for a leading B773 aircraft and a following A320 aircraft. First, the normalised decay curves shown in figure 7(a) have to be transferred into dimensional form using typical values of  $\varGamma$0 = 539 m2/s and t 0 = 26.7 s of the leading B773 aircraft. The initial circulation, $\varGamma$0, is computed according to (A2). In (A2) the aircraft mass, m, during approach is approximated by 85% of the maximum landing weight (MLW) as found in measurements conducted at the airports Memphis and Dallas Fort Worth (Reference Delisi, Pruis, Wang and LaiDelisi et al., 2013) and as also assumed in the RECAT-EU safety case if no aircraft type specific data are available (EUROCONTROL, 2017). For the air density the value of the International Standard Atmosphere at sea level of ρ = 1.225 kg m−3 is used. The initial vortex separation, b 0, again is set to the value for elliptical lift distributions following (4.3). The approach speed is estimated from the stall speed given in the BADA database (Reference NuicNuic, 2013) to $V = 1.3 \times {V_{stall}}$. Eventually, the vortex pair time scale, t 0, is estimated from (4.2) using the same input parameters.
Illustration of how aircraft type specific minimum separations with plate lines are evaluated. Example shown for leading B773 and following A320 aircraft.
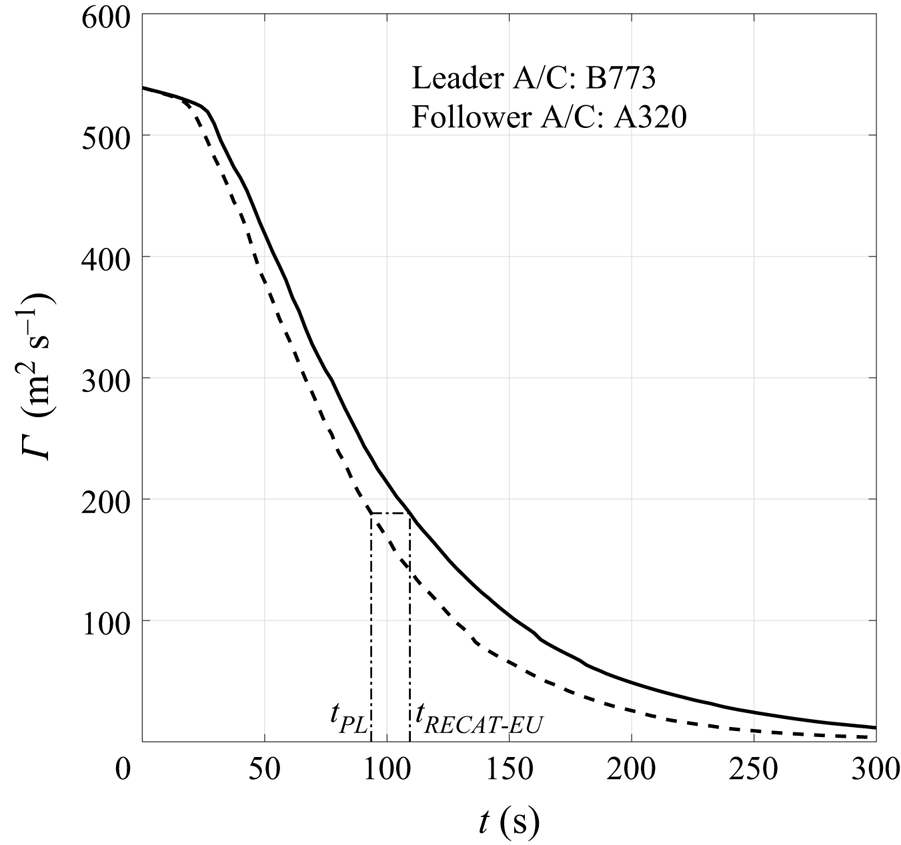
The aircraft combination A320 behind B773 falls into the RECAT-EU category combination Upper Medium behind Upper Heavy to which a 4 NM separation has been assigned. The approach speed of the A320 of 67.8 m s−1 from the BADA database is used to translate the spatial separation of 4 NM into a temporal separation of 109.3 s (see figure 10). At this vortex age the circulation of the B773 amounts to 188.3 m2 s−1, a value which is reached with plate lines already at a vortex age of 93.6 s. This temporal separation can be retranslated into a spatial separation of 3.42 NM.
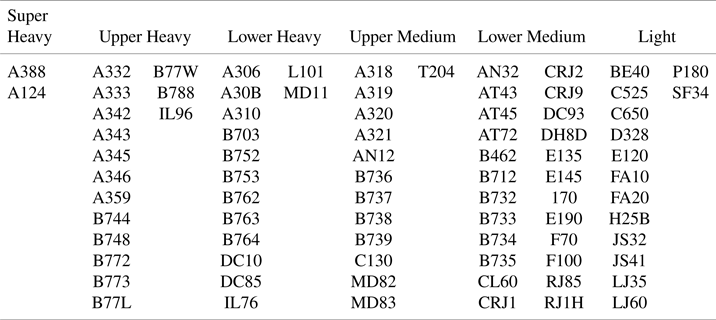
The revision of the RECAT-EU wake turbulence separation minima enabled by the plate lines considers the 82 aircraft types listed in table 1 representing most of the air traffic worldwide. As each of the 82 aircraft types in table 1 can act both as leader and as follower, the mass, wing span and true airspeed are required for all these aircraft types.
Aircraft types used for the evaluation of revised minimum separation distances.
As the choice of the parameters aircraft landing mass, m, air density, ρ, initial vortex separation, b 0, and approach speed, V, may influence the estimated separation reduction potential, this sensitivity is investigated for these parameters. For this purpose, always only one parameter is varied while the others retain their default values. Table 2 lists in the left column the parameter ranges that would lead to no change of aircraft separation minima listed in table 3, given the applied rounding of aircraft separation minima to the first decimal place, and those that would lead to separation changes of ±0.1 NM at the maximum in the right column. Note that the parameters ranges include values that could never occur in reality to illustrate the investigated sensitivity. These figures reveal a low sensitivity of the assessed separation distances to the required aircraft parameters such that the proper selection of these parameters is obviously not critical for the robust assessment of potential aircraft separation reductions as long as a safety margin of 0.1 NM is deemed acceptable.
Sensitivity of estimated separation reduction potential to various parameters.

Distance-based aircraft separation minima with plate lines and differences to RECAT-EU scheme. Empty fields indicate MRS.
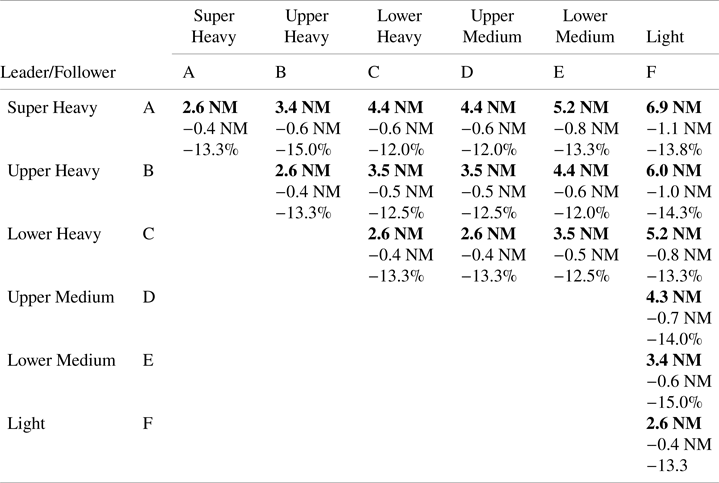
Following the approach described above a minimum separation distance can be assigned to each pair of the 82 aircraft types listed in table 1. The resulting 82 × 82 matrix elements of separation distances are then grouped into the six aircraft category combinations as defined in RECAT-EU. In order to be conservative, the maximum of all pairwise separations within the considered category combination is assigned to the respective minimum separation with plate lines.
Table 3 outlines the resulting distanced-based separation minima with plate lines in nautical miles within the RECAT-EU separation matrix in bold face. Listed below the minimum separations are the differences to the respective RECAT-EU minimum separations as absolute values in NM and as percentages. The aircraft separation reduction potential varies between 12% and 15% depending on the respective aircraft category combination.
As illustrated in figures 8 and 9(a) the efficacy of the plate lines appears to be the higher the larger the leading aircraft. In order to convey the potential separation gains attainable with a data base consisting solely of Heavy aircraft types as in the RECAT-EU safety case, the separation reduction potential is assessed once again employing the reasonable worst-case decay curves of the individual aircraft types. Now the B772 reasonable worst-case decay curves without and with plate lines are used to compute the minimum separations behind the Upper Heavy leader category, while the B763 decay curves represent the Lower Heavy leaders. The A320 representing the Upper Medium leading aircraft is also evaluated. The translation of the time-based separation reductions seen in figure 9(a) into the distance-based separation gains listed in table 4 again employs the aircraft types from table 1.
Distance-based aircraft separation minima with plate lines and differences to RECAT-EU scheme established from the reasonable worst-case decay curves of the leader aircraft types B772, B763 and A320. Empty fields indicate MRS.

Table 4 shows that, with the individual leader aircraft types, the aircraft separation reduction potential varies in a wider range between 10% and 24% depending on the respective aircraft categories. As expected, the separation gains behind the heavier B772 are higher than those of the B763 aircraft compared with table 3. In return, the separation gain of the Light category behind the A320 is decreased.
6. Conclusion
To mitigate the risk of wake vortex encounters during final approach, so-called plate lines have been developed. Wake vortices generated by landing aircraft induce secondary vortices at the plates’ surfaces that approach the primary vortices and trigger premature wake vortex decay during this critical phase of flight. During a six-month campaign at Vienna International Airport, the wake vortex behaviour of approximately 9500 landings with and without plates was measured simultaneously by three lidars complemented by a comprehensive suite of meteorological instrumentation. The measurement campaign as well as the resulting lifetime and circulation reductions attained with the plate lines are described in Reference Holzäpfel, Stephan, Rotshteyn, Körner, Wildmann, Oswald and SmalikhoHolzäpfel et al. (Reference Holzäpfel, Stephan, Rotshteyn, Körner, Wildmann, Oswald and Smalikho2021).
In this manuscript, the Vienna data base is analysed in order to assess the potential for reducing minimum aircraft separations facilitated by plate lines during approach and landing following the RECAT-EU methodology for revised wake turbulence categorisation. For this purpose, the RECAT-EU methodology is adopted as closely as possible in order to estimate the most realistic potential capacity gains that already meet, to a large extent, the requirements for future approval by the authorities and operational implementation. However, the consideration of wake vortex risk along higher parts of the glide path is not within the scope of this publication.
First, wake vortex behaviour in ground proximity with its particular risks and the plate line principle to mitigate these risks are briefly reviewed. Then, the plate line set-up and the measurement equipment established at runway 16 of Vienna airport are introduced together with the key findings of the preceding analysis of the plate line measurement campaign.
In order to ensure that the analysis of the aircraft separation reduction potential is valid, it is verified that other parameters controlling wake vortex decay like wind speed, atmospheric turbulence, thermal stratification and flight altitude above ground reside in similar ranges with and without the plates. It is shown that wind and turbulence conditions both would even support slightly faster decay without the plates such that the environmental conditions for the assessment of the separation reduction potential may be clearly rated conservative.
Prior to the very analysis, the measured single-vortex evolutions were screened by excluding cases with headwinds above 2 m s−1, featuring premature vortex decay caused by so-called end effects triggered during touchdown. Further, those vortices were excluded that are quickly and irrevocably advected out of a safety corridor around the glide path, because these are irrelevant for the encounter risks of following aircraft.
Next, the analysis follows the steps of the RECAT-EU method to generate the so-called reasonable worst-case decay curve. First, the vortex age of the considered vortex evolutions is adjusted such that the vortex evolutions commence at a height of one wing span of the vortex generator aircraft above ground. Then, the measured circulation evolutions are fitted by a two-phase decay model in order to smoothen the scatter of the lidar data and to enable extrapolation to low circulation values. In order to combine the data originating from 12 different aircraft types, the two-phase decay curves are normalised based on the estimated initial values of the circulation and the vortex separation. The resulting median decay curve is fitted to the RECAT-EU reasonable worst-case curve by selecting the cases with measured lifetimes extending beyond 3.5 vortex time scales. As reasonable worst-case atmospheric conditions were given preference already for both execution and processing of the Vienna measurements, the selected vortices correspond to 72% of the Vienna data; a much higher fraction compared with the top 2% of the longest-lived measurements resulting from a lifetime threshold of five vortex time scales applied to the over 100 000 tracks collected at London Heathrow airport for RECAT-EU. While the number of the individual circulation decay curves generated by Heavy category aircraft types is lower here than that considered in the RECAT-EU safety case, the lidar data also allowed us to establish decay curves for a Medium category aircraft type. Nonetheless, the good agreement of the reasonable worst-case decay curves made up of the different data sets provides good confidence that the applied methods are actually equivalent.
The time-based separation reduction potential enabled by the plate lines is established in analogy by selecting the top 72% of the longest-lived vortex evolutions with upright plates. It is translated into spatial minimum separations of the RECAT-EU categories using typical parameters of the leading and following aircraft within the respective categories of the separation matrix. The sensitivity of the resulting minimum separations to the required parameters aircraft gross mass, air density, initial vortex separation and approach speed turns out to be minor and not critical for the robust assessment of the aircraft separation reduction potential.
Depending on the particular RECAT-EU category combination, the aircraft separation reduction potential ranges between 12% and 15%. As the efficacy of the plate lines appears to be higher for larger leading aircraft, the aircraft separation reduction potential based on the reasonable worst-case decay curve established from measurements of the B772, taken as representative of the RECAT-EU leader category Upper Heavy, amounts up to 24%. Focusing in any future lidar measurement campaign on Heavy aircraft, as done within the RECAT-EU safety case, would presumably increase the separation reduction potential of the plate lines.
Aside from the assessment of the separation reduction potential, the Vienna data collection provides the opportunity to compare initial vortex circulation values resulting from fits of a circulation decay model to the lidar data with independent estimates derived from Mode S protocols. Obviously, the lidar-based initial circulation estimates are impaired by the substantial scatter of lidar measurements typically observed for young vortices, where the complex vortex system detaching from the aircraft in high-lift configuration is not yet rolled up into a single vortex pair. Accordingly, the standard deviations of the lidar-based initial circulations appear to be three to seven times higher than those derived from Mode S data, indicating that the Mode S based initial circulations provide significantly higher accuracy. On the other hand, the average values of both methods agree reasonably well, such that the method for deriving the reasonable worst-case circulation curve from the median of the bunch of decay curves appears adequate.
Acknowledgments
The instructive discussions and the feedback received from F. Rooseleer from EUROCONTROL and I. De Visscher from Wake Prediction Technologies are greatly acknowledged. The great commitment of the teams of Austro Control, DLR, LEONARDO Germany, MeteoServe Wetterdienst, and RPG Radiometer Physics only enabled the successful accomplishment of the Vienna plate line measurement campaign. Sincere thanks are given to W. Wurzinger from Austrian Airlines for the provision of landing masses.
Funding Statement
This project has received funding within the framework of the SESAR Joint Undertaking ‘Safely Optimized Runway Throughput’ project (VLD3-W2 SORT) within the European Union's Horizon 2020 research and innovation programme under grant agreement no. 874520 and from the German Aerospace Center (DLR) project ‘Wetter und disruptive Ereignisse’.
Competing Interests
The authors declare no conflicts of interest.
Data Availability Statement
For this publication open access to research data is not applicable due to the protection of commercial and/or industrial exploitation aspects and interests.
Ethical Standards
The research meets all ethical guidelines, including adherence to the legal requirements of the study country.
Author Contributions
Conceptualisation: F.H., D.V., G.R., A.S. Methodology: F.H., D.V., G.R. Data curation: F.H., G.R., A.S. Investigation: F.H., G.R., A.S. Data visualisation: F.H., D.V. Writing original draft: F.H., D.V. All authors approved the final submitted draft.
Supplementary Material
Supplementary material are available at https://doi.org/10.1017/flo.2021.16.
Appendix A
A.1 Equivalence of data with and without plate lines
In order to ensure that the analysis of the potential of plate lines to accelerate wake vortex decay is unbiased, it should be investigated whether other relevant parameters controlling wake vortex decay, such as wind speed, atmospheric turbulence, thermal stratification and flight altitude above ground, reside in similar ranges. If this is ascertained it can be assumed that the differences in the observed wake vortex decay characteristics are predominantly caused by the effects of the plate lines. Obviously, this goal cannot be met perfectly – partly because a perfect balancing of the cases would require excluding a substantial part of the data from the limited amount of available measurements, which in turn would reduce the significance of the statistics, and partly because the vortex evolutions entering the RECAT-EU analysis are to be selected subsequent to the choice of lidar cases for processing (selection criteria see § 4.2).
Table 5 lists the number of single vortex evolutions with and without plate lines in the lidar planes L1–L5 for the three investigated ICAO aircraft weight categories. The median flight altitudes in the lidar planes are denoted in brackets. In total 531 vortex evolutions without plates and 485 vortex evolutions with plates enter the RECAT-EU analysis, each corresponding to 48% of the totally processed single vortex evolutions. Altogether, the numbers of vortex evolutions with and without plates are balanced reasonably well within the individual measurement planes and the different aircraft categories.
Number of single vortex evolutions in the measurement planes L1 to L5 without plates/with plates.

The majority of the data is obtained from the Medium category, which is only populated by A320 aircraft. The measurement planes L4 and L5 with A320 overflight heights above 1.8 wing spans are excluded, as the vortex measurements following the RECAT-EU approach are intended to start at about one wing span above ground. It is also reasonable from a safety point of view to restrict the analysis to those flight altitudes where rebounding luff vortices still have the potential to endanger following aircraft (Reference Holzäpfel and SteenHolzäpfel & Steen, 2007). Still, a majority of 74% of the analysed vortices were generated by A320 aircraft, equivalent to 399 vortex evolutions without plates and 355 with plate lines.
The category Heavy includes the aircraft types A310, A332, A333, B744, B748, B752, B763, B772, B788, and B789 where the biggest part of the data is contributed by B763 (78 cases without plates and 68 cases with plates) and B772 aircraft (38 cases without plates and 37 cases with plates). The median flight altitude in measurement plane L5 of 74 m corresponds to 1.6 wing spans of the B763 and 1.2 spans of the B772. The category Super contains only a few vortices generated by the A388.
Figure 11 shows histograms of the wind conditions prevailing during the vortex evolutions used for the RECAT-EU analysis. The distributions of headwind, cross-wind magnitude and wind speed are quite similar for the cases with and without plate lines. The wind situations that could promote faster vortex decay, in particular stronger headwinds supporting end effects triggered during touchdown (see § 3) but also higher cross-winds and the resulting wind speeds, occur more frequently without plate lines, whereas headwinds and cross-winds around zero are most frequent with plates.
Wind condition distributions against number of vortex evolutions with and without plate lines used for the RECAT-EU analysis.

A couple of related questions are whether the plate lines may have an effect on lateral vortex transport, and whether the resulting dwell times of the wake vortices within the safety corridor are similar with laid-down and upright plates. The mean/median times to leave the safety corridor for the lee vortices amount to 32.0/28.2 s without plate lines, and 33.2/31.6 s with plate lines, respectively. The corresponding dwell times of the luff vortices are 54.1/44.8 s and 51.5/44.4 s, respectively. Obviously, the dwell times with and without plates are quite similar and effects of the plates on lateral transport cannot be identified.
Figure 12 depicts the Brunt-Väisälä frequency distributions which characterise thermal stratification for the selected vortex evolutions with and without plate lines. In stably stratified environments the oval-shaped volume descending with the wake vortices is adiabatically heated and baroclinic vorticity is produced along the interface between the vortex oval and its environment (Reference SpalartSpalart, 1996; Reference Garten, Arendt, Fritts and WerneGarten, Arendt, Fritts, & Werne, 1998). The layers of accumulating baroclinic vorticity will on the one hand reduce the descent speed but also speed up vortex decay (Reference Holzäpfel, Gerz and BaumannHolzäpfel, Gerz, & Baumann, 2001; Reference De Visscher, Bricteux and WinckelmansDe Visscher, Bricteux, & Winckelmans, 2013). As in ground proximity vortex descent is limited, the heating of the vortex oval is equally limited – such that the effects of stable stratification are of lessened relevance.
Thermal stratification characterized by Brunt-Väisälä frequency distribution against number of vortex evolutions with and without plate lines used for the RECAT-EU analysis.

The Brunt-Väisälä frequency
 \begin{equation}N = {\left( {\frac{g}{{{\mathrm{\theta }_0}}}\frac{{\mathrm{d\theta }}}{{\textrm{d}z}}} \right)^{1/2}}\end{equation}
is computed employing the vertical potential temperature gradient, dθ/dz, derived from Mode S data over the planes L5 to L1. Negative temperature gradients corresponding to unstable conditions are allocated to the range of neutral stratification around NBV = 0. Some of the Mode S protocols did not contain valid temperature data, such that figure 12 is based on 498 vortex evolutions without plates and 441 cases with plates. The stratification distributions in figure 12 appear quite similar for flat ground and upright plates. The average Brunt-Väisälä frequency without plates amounts to NBV = 0.0134 s $^{-1}$ and to NBV = 0.0139 s $^{-1}$ with plates, which corresponds to a by 3% increased NBV value with active plate lines. In view of these minor differences the two distributions of thermal stratification with and without erected plates may be rated as equivalent.
As a substantial part of the atmospheric turbulence may not merely be produced mechanically by wind shear but also by solar radiation inducing convective turbulence, we also compare the turbulence conditions during the measurements with and without plate lines. For this purpose, signal variances captured by a microwave scintillometer (MWS) and by a large aperture scintillometer (LAS) are translated into the respective structure parameters  $C_n^2$ displayed in figure 13. The structure parameter of the refractive index of air $C_n^2$ is a quantitative measure of optical turbulence, which characterises the intensity of air density fluctuations in the inertial subrange that are in turn mainly caused by temperature and humidity fluctuations. The $C_n^2$ distributions of the MWS in figure 13(b) are larger by more than one order of magnitude than those of the LAS in panel (a) due to atmospheric humidity fluctuations (Reference Lüdi, Beyrich and MätzlerLüdi, Beyrich, & Mätzler, 2005).
Turbulence intensity distributions during vortex evolutions with and without plate lines used for the RECAT-EU analysis. Turbulence characterized by the structure parameter of the refractive index of air  $C_n^2$ measured by the LAS (a) and the MWS (b).

Scintillometer data is only available for a part of the lidar measurements such that the number of the employed single vortex evolutions is reduced to 154 cases with plate lines and 305 cases without plates. The  $C_n^2$ distributions with plate lines are slightly shifted towards lower turbulence levels, which becomes more obvious by the comparison of average $C_n^2$ values listed in table 6. All in all, one may conclude that the external factors affecting wake vortex decay are quite similar for the cases measured with and without plate lines. In fact, both wind and turbulence conditions would rather support a slightly faster decay without the plates, such that the external conditions for the assessment of the arrival separation reduction facilitated by plate lines may clearly be rated conservative.
Average  $C_n^2$ values corresponding to figure 13.

A.2. Estimates of initial vortex circulation
Estimates of the initial vortex circulation are, on one hand, required for diverse wake vortex research activities like the development and validation of fast-time wake vortex prediction models, but also for the development and implementation of new procedures and separation standards like the wake turbulence recategorization schemes (Reference Hallock and HolzäpfelHallock & Holzäpfel, 2018). On the other hand, estimates of the circulation from lidar data are subject to inherent substantial uncertainties, in particular as long as the complex vortex system detaching from the aircraft in high-lift configuration is not yet fully rolled up into a single vortex pair (Reference Holzäpfel, Gerz, Köpp, Stumpf, Harris, Young and Dolfi-BouteyreHolzäpfel et al., 2003).
In this appendix the initial circulation values estimated from the two-phase decay model fits to the lidar data, as described in § 4.3, are compared to values of initial circulation derived from Mode S data collected during the Vienna measurement campaign, which is computed according to
 \begin{equation}{\varGamma_0} = \frac{{mg}}{{\rho {b_0}V}}\end{equation}
Herein, the aircraft gross mass, m, has been provided by Austrian Airlines for the landings of their fleet, while the masses of the aircraft of the other airlines are estimated from Mode S data as described in Reference Holzäpfel, Stephan, Rotshteyn, Körner, Wildmann, Oswald and SmalikhoHolzäpfel et al. (Reference Holzäpfel, Stephan, Rotshteyn, Körner, Wildmann, Oswald and Smalikho2021), and Reference Holzäpfel and RotshteynHolzäpfel and Rotshteyn (Reference Holzäpfel and Rotshteyn2022). Air density, ρ, is retrieved from pressure, p, and temperature, T, which are both part of the Mode S protocol just as the true airspeed V. The initial vortex separation b0 is computed according to (4.3) assuming elliptical lift distribution.
Figure 14 compares the initial circulation values estimated with the two different methods. Obviously, the scatter of the Mode S-based circulations, Γ0,Mode-S, is substantially smaller than that of the fits to the lidar data with the time shift, Γ0,lidar. According to table 7 the ratios of the standard deviations between the initial circulations of the three most common aircraft types vary between 3.3 and 7.2. This indicates that the Mode S-based circulations provide significantly higher accuracy. On the other hand, the average values of both methods agree reasonably well (see table 7), such that the method for deriving the reasonable worst-case circulation curve from the median of the bunch of decay curves (as described in § 4.3) appears adequate. Furthermore, figure 14 and table 7 indicate that the Γ0,Mode-S values based on aircraft masses provided by Austrian Airlines (AUA) are smaller, which in turn signifies that the method for deriving aircraft gross mass from Mode S data overestimates the aircraft masses on average – as was also found in Reference Holzäpfel and RotshteynHolzäpfel and Rotshteyn (Reference Holzäpfel and Rotshteyn2022).
Initial circulation estimates based on two-phase decay model fits of lidar measurements and on Mode S data of the 12 considered aircraft types.

Average values and standard deviations of different methods to estimate initial vortex circulation, Γ 0.

The comparison of the circulation statistics of the decay model fits to the lidar data, with and without the time shift Δt, in table 7 reveals that the impact of the time shift on the estimates of initial circulations resides below 1% of the average values and below 3% for the standard deviations. So, one may infer that the reasonable worst-case decay curves would hardly look different, if all lidar measurements could have been collected in optimally located measurement planes.


 Open access