


1. Introduction
Immigrants play an important role in the US economy and many businesses are highly dependent on immigrant workers. A report from the Migration Policy Institute (MPI) estimated the population of undocumented immigrants to be 11,047,000 in 2019 (MPI, 2019). Over the past two decades, several stronger immigration laws such as E-Verify, 287(g) agreements, and Secure Communities have been passed at the state and/or county level. These new stricter immigration laws have major consequences for small businesses in the United States. There are numerous studies citing the importance of the immigrant labor supply for US businesses. For example, according to the National Agricultural Workers Survey from the US Department of Labor, about half of the workers in the US agricultural sector are undocumented (Hernandez & Gabbard, Reference Hernandez and Gabbard2018). Bohn, Lofstrom, and Raphael (Reference Bohn, Lofstrom and Raphael2014) examined the introduction of recent stricter immigration laws such as Arizona’s 2007 Legal Arizona Workers ACT (LAWA) and found a notable and statistically significant decrease in the population of undocumented immigrants in Arizona.
The new immigration regulations were implemented aiming at sanctioning undocumented workers at the state or even sub-state level since 2003 which used to be regulated by the Federal government before (Pham & Van, Reference Pham and Van2010). One of the important pieces of legislation is Section 287(g) of the Immigration and Nationality Act (INA) which was first introduced in 1996. Section 287(g) allows the US Immigration and Customs Enforcement (ICE) deputy director to enter into agreements with state and local authorities, permitting local officers to check the legal status of people who are stopped by authorities (Kostandini, Mykerezi, and Escalante, Reference Kostandini, Mykerezi and Escalante2014). The 287(g) program is restrictive in practice (Kuhn, Reference Kuhn2022). The Department of Homeland Security (DHS) Office of Inspector General reported the program had 33,381 removals in FY2008 which is approximately 9.5 percent of the national total in that year (Kuhn, Reference Kuhn2022). Similarly, Wong (Reference Wong2012) mentions that the 287(g) program helped identify over 70,000 individuals residing in the United States without authorization between 2006 and 2012. Research indicates that the state laws in question were generally successful in reducing the number of unauthorized immigrants in states that adopted them, although they may have merely caused a shift of unauthorized immigrants to other states (e.g., Bohn, Lofstrom, and Raphael, Reference Bohn, Lofstrom and Raphael2014; Hoekstra and Orozco-Aleman, Reference Hoekstra and Orozco-Aleman2017; Orrenius and Zavodny, Reference Orrenius and Zavodny2016). As of September 2022, ICE has 64 law enforcement agencies in 19 states under the 287(g) Jail Enforcement model (JEM) as well as 76 law enforcement agencies in 11 states under 287(g) Warrant Service Officer agreements (US ICE, 2023).
Even though there is large body of literature that focuses on economic outcomes of recent immigration enforcement in the United States, there are no studies that examine whether the number of businesses is affected, and if so, which types of businesses. The purpose of this study is to use the county-level variation in the implementation of programs under section 287(g) of the INA to examine their impact on the number of businsses and types of businesses by size in the United States. This study focuses on the county level 287(g) agreements as they were responsible for reducing the local labor supply for the jurisdictions with substantial shares of unauthorized workers, and they allow us to focus on local economic impacts (Kostandini et al., Reference Kostandini, Mykerezi and Escalante2014). We contribute to the literature by focusing explicitly on how the number of business is affected by immigration laws by examining both the total number of businesses and also which business sizes (categorized by the number of employees) are affected.
The rest of the paper is organized as follows. Section 2 provides a background and literature review. Section 3 desribes the methods and data used. Results and discussions are provided in Section 4 and Section 5 concludes.
2. Background and literature review
2.1. A brief history of the immigration laws in the United States
Immigration enforcement began to be a more important topic in US policy in the mid-1990s when the undocumented immigration population was growing rapidly, about 500,000 people per year (Passel, 2002). In response, in 1996, the Clinton administration passed several laws that significantly limited the rights of immigrants and established partnerships between local and federal governments. The same year, Congress enacted section 287(g) of the INA as part of the Illegal Immigration Reform and Immigration Responsibility Act (IIRIRA) which was supposed to aid the federal government in providing enforcement by permitting specially trained state and local law enforcement to assist in immigration enforcement. Starting in 2002, states and localities started to enter into agreements under 287(g). Section 287(g) allows the US ICE deputy director to enter into agreements with state and local authorities permitting designated local officers to perform immigration law enforcement functions, provided they receive appropriate training and function under the supervision of ICE officials (Capps et al., Reference Capps, Rosenblum, Rodriguez and Chishti2011). Between 2007 and 2012, the 287(g) program allowed certain jurisdictions, such as Sheriff’s Offices and Police Departments in 13 cities and 49 counties across 20 states, to operate as agents of the United States ICE (Ifft and Jodlowski, Reference Ifft and Jodlowski2022).Footnote 1 This enabled them to identify and apprehend undocumented immigrants within their jurisdiction as a regular part of their duties. Between 2006 and 2013, more than 175,000 immigrants were deported because of the 287(g) program (Flagg, Reference Flagg2017).
In 2008, Secure Communities was introduced which targeted undocumented immigrants. The Secure Communities program involves police officers checking the fingerprints of detainees against the Federal Bureau of Investigation database and the DHS Database for immigration status and past crimes. But, as this program affects only the arrested and jailed immigrants who are directly involved in criminal activities, its potential impacts on labor supply are very limited. By the end of January 2013, all jurisdictions in the United States had enrolled in the Secure Communities Program (Miles et al., Reference Miles and Cox2014).
We focus our analysis on years before 2013 as Secure Communities was implemented by 2013 and have likely reduced future passage of 287(g) policies (Charlton and Kostandini, Reference Charlton and Kostandini2021). During the timeframe of our study period (until 2012), the 287(g) program operated through three models namely, namely, JEM, the task force model, and the hybrid model (Svajlenka, 2018). The JEM, first implemented in 2005, allows certain trained and authorized state and law enforcement officers to perform immigration enforcement duties such as identifying noncitizens, issuing detainers, serving warrants, and preparing documents for removal proceedings for those who are arrested by state or local law enforcement agencies (American Immigration Council (AIC), 2022; US ICE, 2023). Under the task force model, officers who were given the authority could question and arrest individuals they suspected of violating federal immigration laws during their normal duties while the hybrid model blended the features of the task force model and the JEM (American Immigration Council (AIC), 2022). Task force officers could initiate immigration procedures and transfer individuals believed to be eligible for removal to 287(g) jail officers who would finish the immigration screening and complete the necessary paperwork for ICE (American Immigration Council (AIC), 2022). The latter two models were discontinued following an ICE policy memo in 2012, which stated that other enforcement programs were a more effective way of allocating resources toward prioritized cases (American Immigration Council (AIC), 2022). This is the reason we stop our analysis in 2012.
A total of 70 county and city local law enforcement agencies implemented 287(g) programs between 2002 to 2012; another 142 local law enforcement agencies submitted applications or inquiries to the DHS but did not implement the 287(g) mandates (Pedroza, Reference Pedroza2019). The main purpose of the partnership with local law enforcement agencies is to target noncitizen criminals (Rosenblum et al., Reference Rosenblum and Kandel2011). However, particularly in the early years of 287(g) programs, this was not the case. Police reports in North Carolina counties, for example, suggest that law enforcement in some counties with jail models questioned individuals about immigration status before arrest (Nguyen et al., Reference Nguyen and Gill2010, Reference Nguyen and Gill2016). 287(g) mandates reduced the immigrant population both directly via deportation and indirectly by instilling fear among immigrant communities of being targeted for racial abuses or fear of being deported (Amuedo-Dorantes et al., Reference Amuedo-Dorantes and Bansak2012).
Besides 287(g), other important immigration enforcement measures at the state level target undocumented immigrants. E-Verify is another important immigration enforcement measure, which requires employers to check the immigration status of all new employees in a national data system (Orrenius and Zavodny, Reference Orrenius and Zavodny2015). It is an internet-based system that is operated by US Citizenship and Immigration Services in partnership with the Social Security Administration (Feere, Reference Feere2012). It was first introduced as a voluntary pilot program by the IIRIRA in 1996 and was voluntarily used by businesses in all 50 states in 2003.
The primary reason for 287(g) agreements is to reduce the undocumented immigrant population, with deportation, whereas the E-Verify measure intends to reduce undocumented immigrants in the workforce (Cruz et al., Reference Cruz, Kostandini, Mykerezi, Jordan and Tanellari2022). The mandates intend to curb the hiring of undocumented immigrants who are estimated to make up over 5 percent of the US labor force (Passel and Cohn, 2009). Arizona was the first state to introduce the E-Verify program as a mandatory requirement for all employers in 2007 with the enactment of the 2007 LAWA. Other states followed and there are more than 20 states that require E-verify require the use of E-Verify for at least some public and/or private employers.
One additional immigration enforcement program is the Secure Communities program. Even though DHS began the rollout of Secure Communities in 2008, this program was fully implemented in all 3,181 jurisdictions within 50 states, the District of Columbia, and five US Territories by ICE on January 22, 2013 (US ICE, 2023). Secure Communities is a universal and automated screening system that utilizes existing criminal background checks for immigrants, who have been arrested for a crime and are in jail, to immediately identify for deportation using all available data systems and Criminal Alien Program resources against criminal and other priority aliens while they are in the custody of another law enforcement or correctional agency (US ICE, 2023). From its inception in 2008 through FY 2014 and since its reactivation on January 25, 2017, through the end of FY 2017, Secure Communities interoperability led to the removal of over 363,400 criminal aliens from the US (US ICE, 2023).
2.2. Literature review on the effects of US immigration laws
There is a large body of literature on the effects of immigration laws on labor market outcomes for likely undocumented immigrants, documented immigrants, and citizens as well as their effects on certain aspects of the economy in adopting jurisdictions (e.g., Kostandini et al., Reference Kostandini, Mykerezi and Escalante2014; Pham and Van, Reference Pham and Van2010; Charlton and Kostandini, Reference Charlton and Kostandini2021). However, to the best of our knowledge, there is no study regarding the impact of stricter immigration laws on business creation.
Several studies focus on the impacts of immigration laws in various sectors of the US. For example, Pham and Van (Reference Pham and Van2010) conducted a study on the county-level 287(g) program’s effects on local labor markets. The authors used a difference-in-differences (DID) model to investigate the impact of the 287(g) program on labor supply from 2005 to 2008. They found that employment, payroll, and the number of business establishments experience an overall negative effect from the restrictive immigration laws (Pham and Van, Reference Pham and Van2010). Furthermore, they also discovered that industries that historically relied significantly on labor suffer somewhat because of immigration rules (Pham and Van, Reference Pham and Van2010).Footnote 2 Bohn and Santillano (Reference Bohn and Santillano2017) focused on industry sectors with high immigrant concentrations as they further investigated the effects of 287(g) enforcement on private employment. They found that employment in administrative services was predominantly affected by 287(g) labor supply shocks. Moreover, some studies found that stricter immigration laws targeting undocumented immigrants in local areas have affected the locational preferences of immigrants and have pushed undocumented immigrants to jurisdictions that are not subject to such laws (e.g. Bohn et al., Reference Bohn, Lofstrom and Raphael2014; Hoekstra et al., Reference Hoekstra and Orozco-Aleman2017; Leerkes et al., Reference Leerkes, Leach and Bachmeier2012; Lofstrom et al., Reference Lofstrom, Bohn and Raphael2011; Orrenius et al., Reference Orrenius and Zavodny2016; Parrado, Reference Parrado2012; Watson, Reference Watson2013).
The majority of the studies on immigration enforcement focus on agriculture since it is one of the sectors that relies heavily on undocumented workers. Studies (e.g. Devadoss and Luckstead, Reference Devadoss and Luckstead2018; Zahniser et al., Reference Zahniser, Hertz, Dixon and Rimmer2012) that used simulation models to examine the effects of stricter border and domestic immigration enforcement and an expansion of the H-2A visa program found that stricter immigration controls resulted in a decrease in labor-intensive agricultural production and an expansion of the H-2A visa program benefits the employers and helps to ease the reliance of agriculture on undocumented workers without a wage penatly for domestic workers. On a recent examination of H-2A employment that has more than quadrupled since 2001, Castillo and Charlton (Reference Castillo and Charlton2023) found that an increase in housing demand positively affects H-2A employment.
County-level examinations of 287(g) agreeemnts’ effects on the agricultural sector (e.g. Ifft and Jodlowski, Reference Ifft and Jodlowski2022; Kostandini et al., Reference Kostandini, Mykerezi and Escalante2014) and specific industries whithin agriculture (e..g Charlton and Kostandini, Reference Charlton and Kostandini2021) have found decreased production and planted area and a substitution away from labor-intensive products to capital-intensive products. They have also provided evidence of increased technology but not enough to offset the negative impacts of the labor supply shock. Similar studies on the effects of E-Verify which targets employers found declines on the share of farm workers that are likely undocumented (Luo et al., Reference Luo, Kostandini and Jordan2018) and in the production of labor-intensive crops and an increased production of capital-intensive crops in the states that have enforced strict E-Verify (Cruz et al., Reference Cruz, Kostandini, Mykerezi, Jordan and Tanellari2022).
Another study by East and Velásquez (Reference East and Velásquez2022) provides insights into the impact of the Secure Communities program on the labor market and found that it reduced the employment of likely undocumented immigrants and US-born individuals. It also showed a decrease in both groups’ employment and hourly wages, with factors such as increased labor costs and reduced local consumption suggested as possible explanations.
While the literature so far has examined the impact of several recent immigration laws (e.g. 287(g) agreements, E-Verify, Secure Communities) on several sectors that are highly dependent on undocumented labor, little is known on their effects on new business creation which is an important measure of entrepreneurial activity.
3. Data and methodology
3.1. Methodology
The main goal of this study is to analyze the impact of 287(g) law enforcement on the number of businesses in the United States and also on the what types of business by size (measured by the number of employees). The number of businesses in counties may vary due to a number of possibly unknown factors. To analyze the impact of the immigration law on the number of businesses, this study uses the DID model and controls for several factors that may influence the dependent variables such as per capita income, and population. More specifically, the DID model is used to analyze changes in the number of businesses before and after the implementation of county-level 287(g) laws and determine if any observed changes are statistically significant between the counties that enacted these agreements (treatment group) and counties that did not (control group).
We identify the effects of county-level immigration policies on businesses using the following empirical model:
 $$Y_{ct}=\beta _{0}+\beta _{1} {postc}_{ct}+\beta _{2} {posts}_{ct}+\beta _{3} {poste}_{ct}+\beta _{4}pcpi_{ct}+\beta _{5}B_{st}+\gamma _{c}+\lambda _{t}+\varepsilon _{ct}$$
where, Y ct denotes the number of businesses per 1,000 population in county c and year t. We converted the number of businesses in a county to the number of businesses per 1,000 population. This conversion provides a way to compare the density of businesses across different areas regardless of their size.
The main variable of interest, postc ct , is a dummy variable which is equal to one for every year t and county c that did not have a 287(g) agreement that year and zero otherwise. Similarly, counties with E-Verify are represented by the poste ct dummy variable for each year t and county c while posts ct is a dummy variable for each county and year in states with 287(g) agreements. pcpi ct represents the per capita personal income for county c and year t. Since our period of analysis contains the period of the Great Recession we also include state level Bartik instruments (B st ) to control for the effects of the Great Reccesion (Goldsmith-Pinkham et al., Reference Goldsmith-Pinkham, Sorkin and Swift2020; Scherpf and Cerf, Reference Scherpf and Cerf2019).Footnote 3 In the model, γ c denotes the county fixed effects, λt denotes the year fixed effects and ε ct the error term. As participation in the 287(g) program is not randomly assigned, there may be systematic unobserved differences between counties that impact both the adoption of the program and its outcomes. This could lead to biased estimates of the program’s effect. Thus, county and year fixed effects are used. County fixed effects control the time-invariant characteristics of the county that may be correlated with the number of businesses and views on immigration policy. Year fixed effects control for any time-invariant differences across years that may be affecting the outcome of interest.
Our identification strategy could be threatened if businesses in 287(g) counties could anticipate the exact time when a county would sign a 287(g) agreement and take measures to adjust their hiring before implementation. However, as Charlton and Kostandini (Reference Charlton and Kostandini2021) describe in more detail, it was difficult for counties to predict the exact timing of the agreements mainly because there were counties that applied to have 287(g) agreements but were not approved by ICE. If counties were able to anticipate 287(g) agreements, that would bias our estimates downwards.
One of the important assumptions in the DID model is the “parallel trend assumption,” which states that in the absence of the treatment, the outcome variable would have followed the same trend in both the treatment and control groups (Pardos-Prado, Reference Pardos-Prado2020). In other words, the differences in the outcome variables between the treatment and control groups are solely due to the treatment which is 287(g) implementation in our study. After the passage of the 287(g), the changes in the number of businesses can be attributed to the impacts of this law while controlling for county and year fixed effects, and other control variables. In our study, we use pre-trend analysis to test the parallel trend analysis.
To validate the parallel trends assumption for the DID analysis, we conducted a pre-trend analysis using event study plots. We examined the trends in the outcome variable for the treatment and control groups over five years before and five years after the adoption of the 287(g) program in 2005. More specifically, the event study model used is specificed as:
 $$\eqalign{ & {Y_{ct}} = {\beta _0} + \sum\limits_{t = - 5}^{ - 1} {{\psi _t}} post{c_{ct}} + \sum\limits_{t = 0}^5 {{\psi _t}} pos{t_{ct}} + {\beta _1}post{s_{ct}} + {\beta _2}post{e_{ct}} + {\beta _3}pcp{i_{ct}} + {\beta _4}{B_{st}} + {\gamma _c} + {\lambda _t} \cr & \quad \quad \; + {\varepsilon _{ct}} \cr} $$
The model has 5 leads and 5 lags and they represent the number of lead and lag years, respectively. The vector ψ t includes the year-by-year estimates of 287(g) adoption (post ct ) for each year before and after the adoption. Equation (2) examines the presence of any significant difference in outcomes between 287(g) adoption in adopting and non-adopting counties before the adoption. The rest of the variables are the same as those defined in equation (1). If there are no significant differences, the coefficients ψ t from year − 5 to − 1 in the pretreatment period should not be statistically different from zero. The coefficients ψ t from year 0 to 5 that are statistically different from zero during the post-treatment period provide evidence on whether there is any significant impact from 287(g) and how long such an impact lasts. The coefficient of the first year before 287(g) adoption are set to zero.
If the event study plot shows parallel trends and there are no statistically significant differences between the treatment and control groups in the pre-period, we can conclude that parallel trends assumption is satisfied for the DID analysis.
3.2. Data
Our main source of data is the US Census Bureau. We used countywide per capita income data from the Bureau of Economic Analysis for the income data. County-wise business data were retrieved from the County Business Patterns and population projections from 2000 to 2012 data were also retrieved from the Census Bureau. We used the same classification method as Census Bureau for the number of businesses. The main variable of interest in our analysis is the number of businesses, which is further classified into 8 categories according to the number of employees. For this study, we considered businesses with less than 500 employees as small businesses and 500 or more employees as large businesses (U.S. Small Business Administration (SBA), 2016; Turner et al., Reference Turner and Endres2017).
Information about 287(g) and Secure Communities were collected from the official website of the US Department of ICE and information on E-Verify was collected from the official website of the US DHS. The information for each state was then added to the data set with the creation of a dummy variable for each program, more specifically, “postc” represents the counties adopting 287(g), “poste” represents the counties adopting E-Verify, and “posts” represents the counties which are in 287(g) state. Similarly, “pcpi” represents the control variable for per capita personal income. The variables used in this study with their description are listed below in Table 1.
Description of the variables (2000–2012)

The summary statistics of all the variables listed in Table 1 are presented in Table 2. Based on Table 2, the businesses with 1-4 employees per 1000 county population account for most of the businesses in the United States while the businesses with more than 500 employees make up the least share.
Summary statistics of the variables (2000–2012)
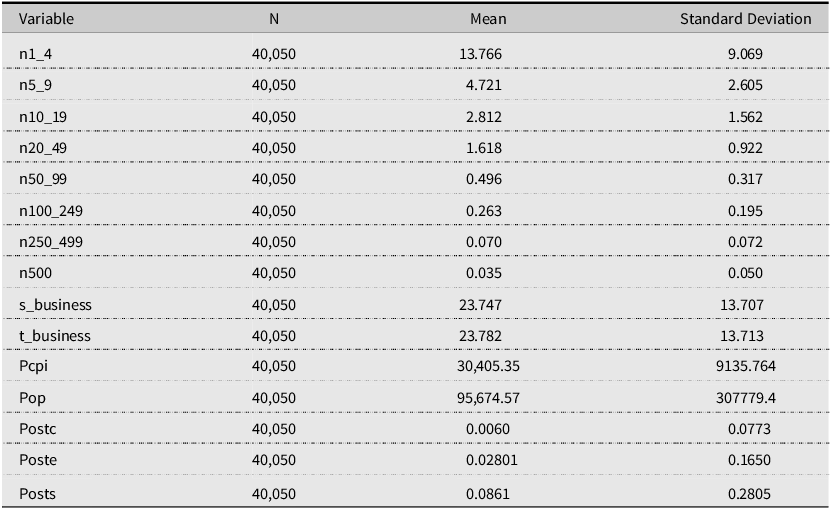
As expected, the number of business per 1000 county population decreases, as the business size (measure by the number of employees) increases.
4. Results and Discussion
4.1. Results
First, we present and discuss our results from the DID model with for various categories of the number of businesses per 1000 county population based on the total number of employees and then we present and analyze the event study plots to determine if the DID results are valid.
Table 3 presents the results of the DID regression analysis for counties that adopted the 287(g) program where the dependent variable is the total number of businesses per 1000 county population for small businesses with fewer than 500 employees (second column), large businesses with 500 or more employees (third column) and total number of businesses (last column) from 2000 to 2012. The regression results indicate that all parameters for “postc,” “posts,” and “poste” are highly significant and negative, while the parameter for income is highly significant and positively associated with the number of businesses per 1000 county population. The results from the DID regression indicate that counties that implemented the 287(g) law have, on average, 1.37 fewer total businesses of fewer than 500 employees per 1000 county population which is about a 6 percent decrease compared to counties that did not implement the law. Large businesses with 500 or more employees experienced a decrease of 0.008 per 1000 county population which is a 22 percent decrease and the total number of business experienced a decrease of 1.379 businesses per 1000 county population which amounts to a 6 percent decrease compared to counties that did not have a 287(g) agreement. Thes findings support our research hypothesis that 287(g) agreements negatively affected the number of business.
Difference-in-differences regression results of 287(g) adopting counties including the total number of businesses per 1000 county population for different business sizes from 2000 to 2012
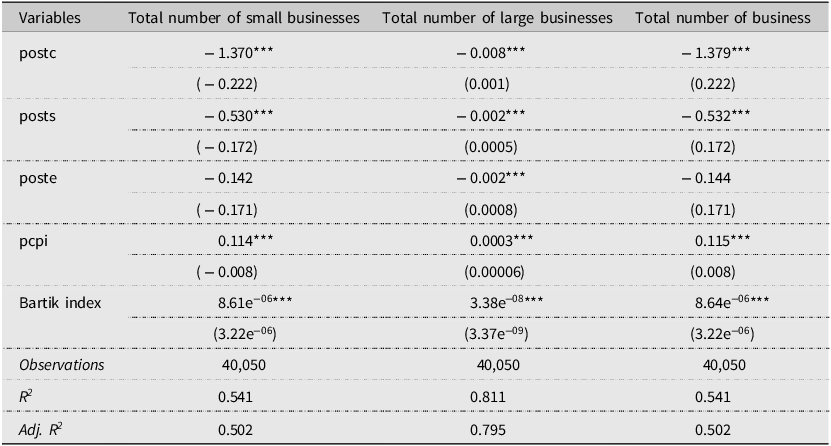
Note: *** p < 0.01, ** p < 0.05, * p < 0.1; Robust standard errors in parentheses; All regressions control for county and year fixed effects.
Similarly, Table 4 displays the results of the DID regression for 287(g) counties, analyzing businesses with different employee sizes per 1000 county population from 2000 to 2012 starting with businesses with up to four employees (n1_4) in second column and going to businesses with 500 or more than 500 employees (n500) in the last column. The DID regression results from Table 4 indicate that county level 287(g) agreements had a negative impact on the number of businesses per 1000 county population across all business sizes.
Difference-in-differences regression results of 287(g) adopting counties including the businesses per 1000 county population from 2000 to 2012
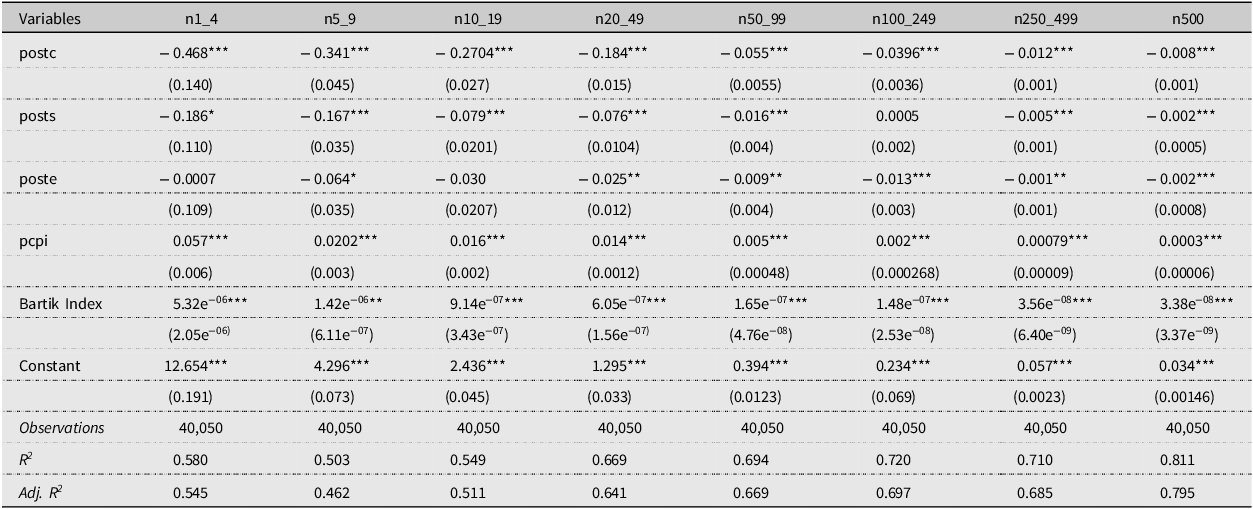
***p < 0.01, ** p < 0.05, * p < 0.1; Robust standard errors in parentheses; All regressions control for county and year fixed effects.
Based on the results from Table 4, businesses with 1 to 4 employees, those with 5 to 9 employees and those with 10 to 19 employees decreased by 0.468 (or about 3.4 percent), 0.341 (or about 7.2 percent) and 0.27 (or about 9.6 percent) businesses per 1000 county population, respectively, compared to the counties where the law was not implemented, while the large businesses with employees of more than 500 seem to decrease by 0.008 businesses per 1000 county population which is a decrease of about 22 percent compared to the counties where the law was not implemented. Thus, it appears that 287(g) agreements are associated with fewer number of businesses per 1000 county population across all business sizes and the effect is more negative as the size of the number of business per 1000 county population increases.
Next, we provide the findings of our pre-trend analysis on the impact of 287(g) mandates on the number of businesses per 1000 county population using the event study plots. This analysis examines if the parallel trend assumption holds and if the DID results are reliable.
Figure 1 presents the event study plots for different business categories, including panel a for total small businesses per 1000 county population, panel b for total large businesses per 1000 county population, and panel c for total businesses per 1000 county population. All the plots from panels a to c show a significant deviation between the treatment and control group after the implementation of the 287(g) mandates on the total number of businesses per 1000 county population while we could not see any significant deviation between the treatment and control group before the implementation of the county level 287(g). The coefficient on year 5 prior to implementation in panel b is the only exception which indicates a pre-trend at above the 95 percent statistical significance level and the coefficients of the 3-year pre-trend in panels a and c are close to being statistically significant at the 95 percent significance level. However, the rest of the pre-trends, and more importantly these closer to the policy implementation do not show any differences prior to policy implementation.
Event study plot showing the effects of 287(g) on the total number of businesses. The graph presents the estimated coefficients and 95% confidence intervals for the 5 years pre- and 5 years post-adoption periods, with the base marked by the vertical line.

Similarly, the event study plot from Figure 2 shows the significant negative post effect of the 287(g) mandates on the number of businesses per 1000 county population starting from panel a representing the event study plots for the number of businesses with 1 to 4 employees all the way to panel h which represents the number of businesses with 500 or more than 500 employees. The event study plots for six out of the eight the panels show a statistically significant deviation between the treatment and control group after the law enforcement and no pre-trends at above the 95 percent significance level during all years leading to the policy implementation. Only 2 panels (panel b and c) show pre-trends which are significant at above the 95 percent significance level.
Event study plot showing the effects of 287(g) on the number of businesses per 1000 county population categorized based on the number of employees (panels a to h). The graph presents the estimated coefficients and 95% confidence intervals for the 5 years pre- and 5 years post-adoption periods, with the base year marked by the vertical line.
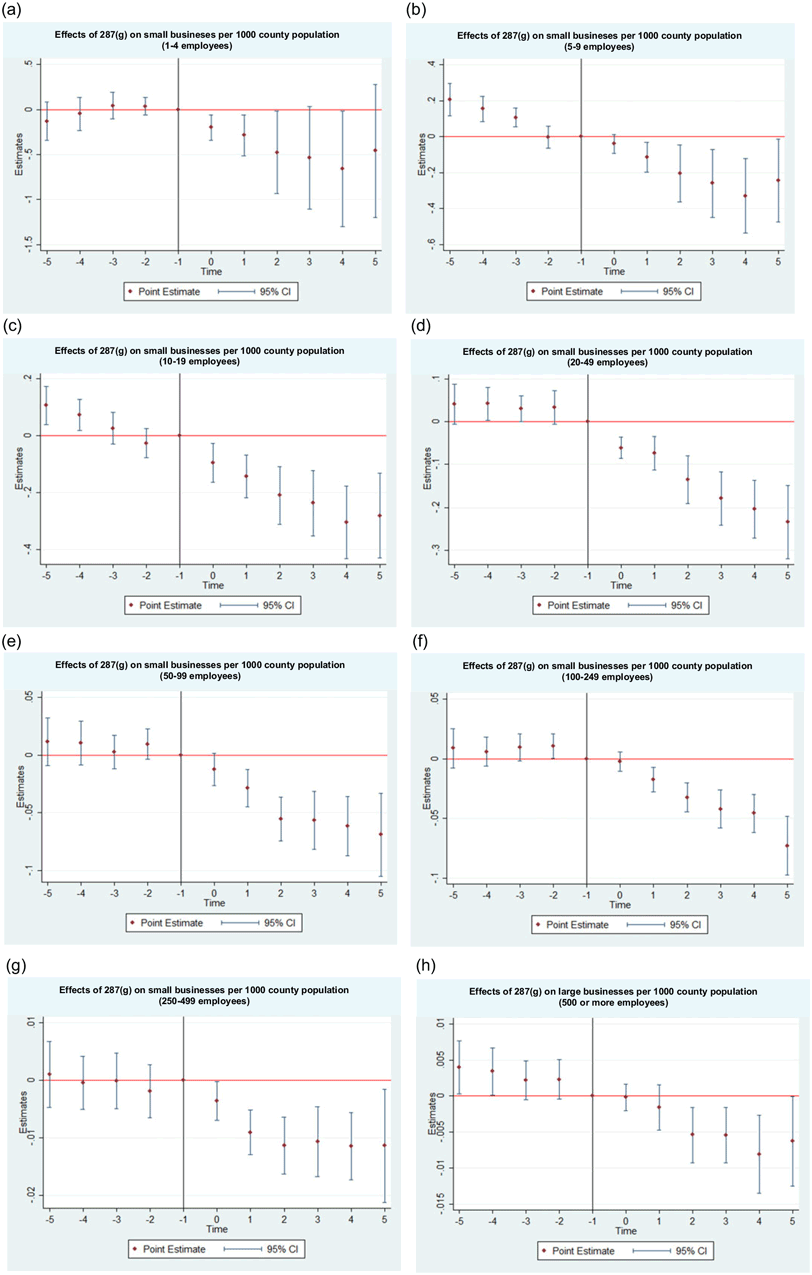
More specifically, we find that except for panels b (businesses with 5-9 employees) and c (businesses with 10-19 employees), the pre-trend analysis for the parallel trends suggests that there are no pre-trends providing support for our main finding that the adoption of E-Verify resulted in a decrease in the number of businesses per 1000 county population.
Finally, we also use the DID estimation suggested by Callaway and Sant’Anna (Reference Callaway and Sant’Anna2021) that addresses potential issues that may come with the standard two-way fixed effects DID approach which imposes strong assumptions about the relationship between control and treatment group. The DID model may result in negative weights for some treated units and measures a weighted linear treatment effect across. In addition, even when the weights are not negative the treatment effects are sensitive to the timing of the treatment, the number of periods and the size of the treatment and control group (Callaway and Sant’Anna, Reference Callaway and Sant’Anna2021). The estimator developed by Callway and Sant’Anna addresses these issues. The results are presented in figures 3 and 4 below and they indicate no pre-trends providing additional support to our main findings.Footnote 4
Number of businesses with fewer than 500 employees per 1000 county population using Callaway and Sant’Anna’s (Reference Callaway and Sant’Anna2021) method.

Number of businesses with more than 500 employees per 1000 county population using Callaway and Sant’Anna’s (Reference Callaway and Sant’Anna2021) method.

Discussion
There could be several possible causes behind this negative impact of 287(g) on the number businesses. First, it could be due to the higher compliance costs of businesses. With the increase in strict immigration enforcement, there may have been higher compliance costs for hiring immigrant workers.
Second, the law may have caused a decline in the number of immigrants, resulting in a labor shortage for businesses. This is perhaps not surprising given the dramatic increase in immigration control at the federal level, resulting in far more deportations and lower in-migration flows. In fact, some papers (Gill et al., Reference Gill, Nguyen, Parker and Weissman2009; Lacayo, Reference Lacayo2010) have documented such discrepancies.
Third, the legal status of the worker might be another cause of this impact. Businesses with workers who are not authorized to work in the country have increased difficulties to continue operating after immigration laws are passed, leading to a decrease in the number of businesses. This is also supported by various studies (Arriaga, Reference Arriaga2017; Kostandini et al., Reference Kostandini, Mykerezi and Escalante2014; Michaud, Reference Michaud2010; Charlton and Kostandini, Reference Charlton and Kostandini2021).
Finally, the 287(g) program has been criticized for its potential to institutionalize racial profiling and questionable police practices. The law might have resulted in racial profiling and discrimination, which may have negatively impacted small businesses that rely on a diverse workforce (Amuedo-Dorantes et al., Reference Amuedo-Dorantes and Bansak2012; Arriaga, Reference Arriaga2017; Becerra et al., Reference Becerra, Wagaman, Androff, Messing and Castillo2017; Kocher, Reference Kocher2011).
Conclusions
Given the increasing enforcement of US immigration policies over the last two decades, this study examined whether county-level immigration enforcement of section 287(g) mandates has affected the number of businesses in the United States. We used the DID model to explore the impact of 287(g) programs on the number of businesses. County-level 287(g) immigration enforcement mandates between 2005 and 2012 are used to measure the effects of a negative shock to the immigrant labor supply on the number of businesses per 1000 county population as well as the number of business by size (measured by the number of employees).
The major finding of this study is that the implementation of the 287(g) hurt the total number of businesses per 1000 county popluation and the number of businesses with a larger number of employees were affected to a higher degree. The results from two event study plots supported the parallel trend assumption and the findings that there was a significant decrease in the number of businesses after the implementation of county-level 287(g) mandates and generally counties in control and treatment followed similar trends before law enforcement.
Our research results may benefit businesses, policymakers, government officials, and stakeholders involved in immigration policy and labor market regulations. This study also provides insights into the potential economic impacts of immigration policies and unintended effects of such policies on businesses and labor markets. Additionally, this study may be of interest to academics and researchers studying the intersection of immigration policy and labor markets.
The impact of 287(g) on small businesses is complex and can vary depending on the specific circumstances of each business. On one hand, small businesses may benefit from increased law enforcement in their local communities while on the other hand, the program may also lead to a reduction in the available labor pool, particularly in industries that rely heavily on immigrant labor, such as agriculture and construction.
It is important to note that these results are based on the number of businesses, and further research is needed to assess the effects of the 287(g) law on other aspects of small businesses, such as their profitability, growth, and competitiveness. Future studies could also consider the potential variation in the effects of 287(g) enforcement across different industries or sectors, particularly those that rely heavily on immigrant labor.
Supplementary material
The supplementary material for this article can be found at https://doi.org/10.1017/aae.2024.23.


 Open access