


Introduction
Political theorists and political scientists agree that political tolerance is an essential and everyday condition of democratic politics, especially in polarized societies in which citizens are divided by affect, as well as ideology (Bejan Reference Bejan2017; Iyengar et al. Reference Iyengar, Lelkes, Levendusky, Malhotra and Westwood2019; Kingzette et al. Reference Kingzette, Druckman, Klar, Krupnikov, Levendusky and Ryan2021; Murphy Reference Murphy2025; Spinner-Halev and Theiss-Morse Reference Spinner-Halev and Theiss-Morse2024). Without the willingness to put up with political activity by people, or on behalf of positions, they dislike, how can citizens engage constructively across political divides? Many scholars suspect that affective polarization, meaning the tendency for partisans to feel positively about their own party and negatively about the other side (Iyengar and Westwood Reference Iyengar and Westwood2015), is particularly corrosive to tolerance of others’ civil liberties. Yet recent empirical efforts to study the relationship have found the predicted negative association between affective polarization and political tolerance to be either weak or absent (Berntzen et al. Reference Berntzen, Kelsall and Harteveld2024; Kingzette et al. Reference Kingzette, Druckman, Klar, Krupnikov, Levendusky and Ryan2021), leading some scholars to conclude that the threat is overblown (Broockman et al. Reference Broockman, Kalla and Westwood2023; Druckman et al. Reference Druckman, Green and Iyengar2023).
This paper combines insights from political theory and political behaviour to investigate the relationship between political tolerance and affective polarization. We begin by demonstrating that existing measures of political tolerance are often inadequate to determine levels of (in)tolerance among partisans in polarized societies due to their focus either (1) on unpopular minorities and/or extremists or (2) on abstract support for civil liberties. While the former ignores more symmetrical cases (for instance, between comparable groups supporting different mainstream political parties), the latter tells us little about how partisans would themselves respond when confronted with particular examples of out-partisan political activity. Finally, existing measures generally (3) treat political tolerance and intolerance as binary and mutually exclusive attitudes, and thus infer the existence of one from the absence of the other. But our intradisciplinary approach suggests that (in)tolerance is better understood as a spectrum of possible responses to political activity by a disliked other, ranging from outright interference or occasional disruption to respectful engagement. Accordingly, political tolerance and intolerance not only can, but often will, overlap.
To meet these difficulties, we propose ‘partisan intolerance’ as an alternative concept, which we define as the gap between a person’s willingness to interfere with an in-partisan activity versus the same out-partisan activity. We then explore this concept empirically through a series of pre-registered survey experiments in Britain. We hypothesize that (1) partisan intolerance not only exists, but also (in keeping with existing empirical assumptions) that it is greater (2) among those with lower levels of abstract political tolerance and (3) among those who are more affectively polarized. Moreover, we anticipate that (4) participants’ tolerance of out-partisan free speech and association will be more ‘minimal’ in form (for example, disrupting versus engaging), especially among those who are more affectively polarized. Ultimately, we find a high degree of partisan intolerance, but no evidence of a relationship between abstract measures of political tolerance and partisan intolerance as we define it. We do, however, find a strong correlation between partisan intolerance and affective polarization, one seemingly driven entirely by dislike of the other side rather than approval of one’s own. Without the concept of partisan intolerance, this relationship, and thus an important negative aspect of affective polarization, would be invisible.
We thus make several contributions to the study of (in)tolerance and affective polarization. First, we use insights from political theory to develop the concept of partisan intolerance as an alternative to traditional concepts and measures of political tolerance. Second, this concept allows us to examine empirically the existence, and correlates, of partisan intolerance using original survey and experimental data. Third, and despite the high levels of abstract political tolerance we record, we find widespread partisan intolerance. Finally, we also show that there is a close association between partisan intolerance and affective polarization. If tolerance of one’s political opponents is, indeed, essential for the everyday functioning of increasingly polarized liberal democracies, our results suggest ample cause for concern.
Understanding (In)Tolerance
Political tolerance, understood as the willingness of citizens to put up with political viewpoints and activities they find disagreeable, is ‘among the most investigated phenomena in modern political science’ (Gibson Reference Gibson2006, 21). So, too, in political theory (Brown Reference Brown2006; Forst Reference Forst2013; Murphy Reference Murphy1997; Murphy Reference Murphy2025; Walzer Reference Walzer1997). While these empirical and theoretical literatures have developed largely in isolation, there have been important moments of cross-fertilization. For instance, Sullivan et al. (Reference Sullivan, Piereson and Marcus1982) drew on Crick (Reference Crick1972) to distinguish tolerance – with its constitutive element of ‘objection’ or disapproval – from mere indifference or the absence of prejudice. More recently, Jones and Bejan (Reference Jones and Bejan2021, 605) argued for the usefulness of theoretical insights to comparative research, specifically in conceiving of tolerance as a spectrum of more ‘minimal’ or ‘maximal’ responses to political difference, depending on the degree of engagement involved. We suspect that intradisciplinary dialogue may bear similar fruit in the study of partisanship and political behaviour (see also Mutz Reference Mutz2002; Scudder Reference Scudder2020; Spinner-Halev and Theiss-Morse Reference Spinner-Halev and Theiss-Morse2024).
Among political scientists, Stouffer (Reference Stouffer1955) sparked the development of several competing strategies for measuring political tolerance (see Gibson Reference Gibson2006; Gibson Reference Gibson2013; Mondak and Sanders Reference Mondak and Sanders2003). The first, Stouffer’s own ‘fixed-group’ method, presents survey respondents with a pre-selected list of groups and asks whether representatives of each should be allowed to exercise certain civil liberties. For example, the General Social Survey (GSS) asks respondents about four groups (atheists, racists, communists, and radical Muslims) and whether members should be allowed to speak publicly, teach in colleges or universities, or have their books made available in public libraries (for a recent paper using this method, see Garneau and Schwadel (Reference Garneau and Schwadel2022)). A second strategy, the ‘least-liked’ measure developed by Sullivan et al. (Reference Sullivan, Piereson and Marcus1982), asks respondents to select the group(s) they dislike most from a list then tailors questions about civil liberties to focus on that disliked group (Gibson and Gouws Reference Gibson and Gouws2003; Marcus et al. Reference Marcus, Sullivan, Theiss-Morse and Wood1995; Petersen et al. Reference Petersen, Slothuus, Stubager and Togeby2011). Finally, a third approach dispenses with asking about particular groups in favour of assessing respondents’ general support for policies that restrict or support civil liberties for all (Davis Reference Davis2007; Gibson and Bingham Reference Gibson and Bingham1985; Hetherington and Suhay Reference Hetherington and Suhay2011; McClosky and Brill Reference McClosky and Brill1983). Despite pushback (Gibson Reference Gibson2013), such general measures of support for civil liberties remain popular in studies of political tolerance, while the ‘least-liked’ instrument has also largely superseded Stouffer’s ‘fixed-group’ approach. But just as insights from political theory informed Sullivan et al. (Reference Sullivan, Piereson and Marcus1982)’s critique of Stouffer (Reference Stouffer1955), we believe political theory can shed similar light on the unsuitability of these existing measures for studying tolerance under conditions of partisan polarization due to their (1) asymmetry, (2) abstraction, and (3) binariness.
Asymmetry
Despite their differences, both the fixed-group and least-liked approaches tend to focus on groups at the margins of society (for example, religious minorities or ideological extremists) as indicative of levels of political tolerance overall (see, for example, Duch and Gibson (Reference Duch and Gibson1992); Garneau and Schwadel (Reference Garneau and Schwadel2022); McCutcheon (Reference McCutcheon1985); Sniderman et al. (Reference Sniderman, Tetlock, Glaser, Green and Hout1989)). This focus reflects what political theorists recognize as the characteristic asymmetry of tolerance relations (Brown Reference Brown2006), in which the tolerator is assumed to be in a position of power relative to the tolerated, and thus able to suppress or otherwise interfere with their political activity.
Yet this asymmetrical relationship represents only one (albeit historically prevalent) form of tolerance, which Forst (Reference Forst2013, 28) dubs the ‘permission conception’. Moreover, this form of tolerance seems inherently unstable: should the tolerated group increase in numbers or power relative to the tolerating party, we should expect permission for their activities to be withdrawn. Accordingly, Forst contrasts permission-tolerance with a more stable ‘respect conception’, according to which the tolerator respects the rights of the tolerated regardless of their relative social or political power (Forst Reference Forst2013, 30).
Forst’s analysis highlights an important empirical tension: while political scientists often define political tolerance generically as ‘respect for civil liberties’, the asymmetries embedded in the fixed-group and least-liked measures focus exclusively on ‘permission’ tolerance. This causes problems, however, when considering opposing partisans in a two-party system who enjoy roughly equal political power. This more symmetrical and comparatively common case would seem to require Forst’s ‘respect–tolerance’; yet existing measures obscure the distinction because the typical comparison is not of equals. For example, Bjånesøy et al. (Reference Bjånesøy, Ivarsflaten and Berntzen2023) compare tolerance (in terms of permission to rent a community centre) of neo-Nazi organizations, anti-Islamic organizations, and far-right parties with mainstream centre-right parties.Footnote 1
We must be careful, then, when inferring anything about partisans’ respect for their opponents’ civil liberties from measures focusing exclusively on their willingness to permit comparatively weak or infrequent political activity by unpopular minorities and/or extremists.
Abstraction
If respect for the rights of others is the right way to think about tolerance among partisans, one might conclude that a more abstract measurement approach is preferable. For example, Kingzette et al. (Reference Kingzette, Druckman, Klar, Krupnikov, Levendusky and Ryan2021, 664–5) define political tolerance as a commitment ‘to norms requiring the fair treatment of all points of view’ and ‘the belief that all citizens, including adversaries, deserve equal rights’. They then propose to measure it by asking partisans in the United States whether they agree with general statements such as ‘People who hate my way of life should still have a chance to talk in a public forum’ or ‘Some protests need to be prevented or stopped, even if they are completely peaceful’.
Yet empirical measures requiring people to abstract and/or generalize in this way may tell us little about their levels of tolerance in practice. For theorists, ‘tolerance’ usually requires that someone dislike or disapprove of some particular thing while nonetheless remaining willing to ‘put up with’ or ‘suffer’ the unpleasantness of its concrete presence (see Bejan Reference Bejan2017, 16–17; Tønder Reference Tønder2013). Empirical researchers should be careful, then, not to infer the existence of political tolerance from survey instruments without some element of particularity and/or concreteness.
Secondly, theorists often distinguish normatively between the ‘vertical’ and ‘horizontal’ dimensions of tolerance (Forst Reference Forst2013, 151–2; Williams and Waldron Reference Williams and Waldron2008). While the former reflects the particular policies or institutional arrangements by which public or private authorities might regulate a disliked other’s civil liberties, the latter describes the first-person practices or strategies that individuals might adopt with respect to the same. But survey instruments asking subjects simply whether a certain activity, such as speaking in a public forum or holding a protest, ‘should be prevented’ or ‘should be allowed’ elide this distinction. They may also conceal important information about levels of (in)tolerance among partisans, whose ‘vertical’ and ‘horizontal’ intuitions will likely differ depending on whether their co-partisans are in power within a particular institution.
Binariness: Attitudes v. Actions
These critical observations alert us to a final, relevant distinction derived from political theory: that between tolerance understood as a binary attitude (that is, one is either ‘tolerant’ or ‘intolerant’) and toleration as a range of more or less interfering actions one might take in response to difference. Theorists argue that the relationship between them is complex. As Murphy (Reference Murphy1997) observes, attitudinal tolerance may lead someone to tolerate a disliked other in practice, but then again it may not. The disconnect might result from personal bias or hypocrisy, but it might also reflect the relative priority one assigns to other values or contextual factors. Many on the political Left today warn against ‘tolerating intolerance’ due to its dignitary harms: for example, in cases where hate speech may be present at a protest one believes a disliked group otherwise has a right to hold (Chong et al. Reference Chong, Citrin and Levy2024). While existing empirical measures necessarily target attitudes, not actions, political scientists acknowledge that ‘tolerance judgements’ are, in practice, highly contextual (Gibson Reference Gibson1987; Marcus et al. Reference Marcus, Sullivan, Theiss-Morse and Wood1995). For example, ‘it seems quite legitimate not to close freeways so that groups can demonstrate’ due to public safety or convenience concerns (Gibson Reference Gibson2006, 23).Footnote 2 This suggests that it is not enough to ask participants simply whether they would tolerate ‘a protest’, but rather whether they would allow similar protests by both liked and disliked groups.
But here theorists might also remind us that intolerance can take different forms: for instance, banning a disliked other’s exercise of civil liberties beforehand, shouting down speakers during the event, or signing a petition calling for sanctions afterwards. Moreover, as Jones and Bejan (Reference Jones and Bejan2021) point out, even practical toleration can take more ‘minimal’ and ‘maximal’ forms depending on the degree of engagement involved. For instance, one might ‘tolerate’ the presence of hateful speech at a protest by letting it proceed but (1) stage a counter-protest, (2) avoid it and encourage others to steer clear, or even (3) attend and engage respectfully in order to persuade others of their ‘errors’.
Finally, and most problematically: political scientists’ insistence on treating political tolerance and intolerance as mutually exclusive often leads them to infer the existence of one from the absence of the other (Garneau and Schwadel Reference Garneau and Schwadel2022; Kingzette et al. Reference Kingzette, Druckman, Klar, Krupnikov, Levendusky and Ryan2021). But this risks underreporting the extent to which subjects might express tolerant attitudes (for example, telling researchers that disliked groups have a right to protest) while also endorsing intolerant actions intended to interfere with their opponents’ civil liberties. Consider the reported asymmetry in political tolerance between liberals and conservatives (Garneau and Schwadel Reference Garneau and Schwadel2022; Jost et al. Reference Jost, Baldassarri and Druckman2022). While political liberals may, indeed, be more likely to support minority rights, this does not mean that they will also be more tolerant with respect to their opponents’ civil liberties (Spinner-Halev and Theiss-Morse Reference Spinner-Halev and Theiss-Morse2024).
Theorists’ tolerance/ toleration distinction, by contrast, recognizes that attitudinal tolerance can co-exist with or even inform intolerant actions. But neither the ‘least-liked’ nor abstract measures commonly deployed by empirical researchers pick this up.
A New Concept: Partisan Intolerance
Taken together, these criticisms suggest that existing measures of political tolerance are ill-suited to identify intolerance across partisan lines. To meet these difficulties, we propose a novel concept and corresponding measure of ‘partisan intolerance’. We define this as: the relative willingness of partisans to ban, or otherwise interfere with, a particular exercise of civil liberties by members of the opposing party as opposed to their own party. Unlike political tolerance, partisan intolerance so defined allows for (1) comparative symmetry between tolerator and tolerated, (2) particularity and concreteness, as always addressed to a specific disliked other and/or activity, and (3) an examination of actions as well as attitudes.Footnote 3
All three factors are important. First, by directly comparing support for activities by in-partisans and out-partisans, we avoid the typical asymmetry of tolerance measures in which only extremist or minority groups are considered. Second, by making the political activity particular to a specific group we are forcing people to make a decision to ‘put up with’ that activity by a disliked other rather than allowing them to express nebulous support for civil liberties in the abstract. Similarly, by making concrete the activity in question, we give a particular context for tolerance judgements with respect to implied trade-offs like inconvenience and other harms. Third, by allowing not only for banning, but also other forms of interference with another’s civil liberties, we can also recognize cases where intolerant actions (for example, disrupting an out-group’s protest) and tolerant attitudes (for example, thinking the protest should proceed) overlap.
Isolating partisan intolerance in this way allows us to move beyond the binary assumptions governing previous research and relate this new concept to two others: (1) political tolerance, measured as abstract support for civil liberties, and (2) affective partisan polarization.
Partisan Intolerance and Affective Polarization
In an era of increased polarization, understanding how partisan intolerance relates to affective polarization is particularly important. Affective polarization is driven not by ideological differences but by affective attachments to opposing political identities (Iyengar et al. Reference Iyengar, Sood and Lelkes2012; Mason Reference Mason2018). Societal divisions arise when people strongly like their own party and, especially, strongly dislike the other party.
The concept of affective polarization has spawned an immense literature focused initially on the United States (for a good overview, see Iyengar et al. Reference Iyengar, Lelkes, Levendusky, Malhotra and Westwood2019) but increasingly examining other countries (Gidron et al. Reference Gidron, Adams and Horne2020; Gidron et al. Reference Gidron, Adams and Horne2023; Harteveld Reference Harteveld2021; Hobolt et al. Reference Hobolt, Leeper and Tilley2021; Huddy et al. Reference Huddy, Bankert and Davies2018; Reiljan Reference Reiljan2020; Wagner Reference Wagner2021; Wagner Reference Wagner2024). Some of this work equates out-group hostility with intolerance, but, of course, intolerance does not require that one simply dislike the other side, but also that one seeks to interfere with their civil liberties. Nonetheless, there is a connection between the two ideas. For the affectively polarized, tolerance of out-group partisan activity might allow the other side to ‘seize the reins of power, and with that, potentially implement their dangerous agenda’ (Kingzette et al. Reference Kingzette, Druckman, Klar, Krupnikov, Levendusky and Ryan2021, 666). Equally, we know that people who sympathize less with an extremist group are also less likely to tolerate it; accordingly, we would expect that the more someone dislikes any group, even a mainstream political party, the less they will be willing to tolerate its members. This assumption is implicit in much of the affective polarization literature (Finkel et al. Reference Finkel, Bail, Cikara, Ditto, Iyengar, Klar, Mason, McGrath, Nyhan, Rand and Skitka2020; Iyengar et al. Reference Iyengar, Lelkes, Levendusky, Malhotra and Westwood2019; McCoy and Somer Reference McCoy and Somer2019), including work that uses cross-national data to link it with democratic backsliding (Orhan Reference Orhan2022). For example, McCoy et al., (Reference McCoy, Rahman and Somer2018, 25) argue that ‘perceptions of the out-party as a threat to the nation or way of life’ mean that ‘government supporters grow increasingly tolerant of illiberal actions to tamp down dissent’.
Yet few studies directly address affective polarization’s relationship with political tolerance, let alone with partisan intolerance as we define it. While some focus on affective polarization’s broader political implications, such as democratic rule-breaking or political violence (Bankert Reference Bankert2023; Kingzette et al. Reference Kingzette, Druckman, Klar, Krupnikov, Levendusky and Ryan2021),Footnote 4 these phenomena do not equate to political tolerance or partisan intolerance. Violence, in particular, is too extreme a form of interference to tell us much about someone’s everyday approach to a mainstream political opponent’s exercise of civil liberties. Other studies have looked at the relationship between affective polarization and support for restrictions aimed at specific parties, finding ‘scant evidence that affectively polarized partisans support undemocratic practices’ (Druckman et al. Reference Druckman, Green and Iyengar2023, 151).Footnote 5 But again, this literature focuses on outcomes other than political or partisan intolerance, such as support for undemocratic behaviour by politicians (Broockman et al. Reference Broockman, Kalla and Westwood2023; Graham and Svolik Reference Graham and Svolik2020; Holliday et al. Reference Holliday, Iyengar, Lelkes and Westwood2024; Simonovits et al. Reference Simonovits, McCoy and Littvay2022; Voelkel et al. Reference Voelkel, Chu, Stagnaro, Mernyk, Redekopp, Pink, Druckman, Rand and Willer2023), partisan-directed violence (Berntzen et al. Reference Berntzen, Kelsall and Harteveld2024; Holliday et al. Reference Holliday, Iyengar, Lelkes and Westwood2024; Kalmoe and Mason Reference Kalmoe and Mason2022; Voelkel et al. Reference Voelkel, Chu, Stagnaro, Mernyk, Redekopp, Pink, Druckman, Rand and Willer2023), or banning protests by ideological extremists (Graham and Svolik Reference Graham and Svolik2020; Simonovits et al. Reference Simonovits, McCoy and Littvay2022).
Some authors do edge closer to partisan intolerance. Broockman et al. (Reference Broockman, Kalla and Westwood2023) assess the effect of affective polarization on people’s support for the use of tear gas on in-party protestors. This is not quite partisan intolerance, however, since they look only at in-party protestors. Conversely, while Berntzen et al. (Reference Berntzen, Kelsall and Harteveld2024) look at tolerance for ‘renting a meeting venue’ or campaigning by out-parties, they do not ask about the in-party. And finally, while Lelkes and Westwood (Reference Lelkes and Westwood2017; see also Westwood et al. Reference Westwood, Peterson and Lelkes2019) do look at both in-party and out-party responses to Broockman et al. (Reference Broockman, Kalla and Westwood2023)’s vignette about tear-gassing of demonstrators, participants’ opposition to extraordinary examples of police violence against their opponents do not necessarily tell us much about their everyday levels of political or partisan tolerance.
Overall, existing evidence about the relationship between partisan (in)tolerance and affective polarization is partial, at best, and often weakened by familiar assumptions of asymmetry, false binaries, and elided distinctions. We thus continue to know surprisingly little about how affective polarization might affect people’s willingness to interfere with their political opponents’ civil liberties. But it is this ‘mundane tolerance’, if you will, that constitutes a basic condition of politics in liberal democracies most threatened by affective polarization.
Hypotheses
Our hypotheses flow directly from our concept of partisan intolerance. First, we hypothesize that partisan intolerance, as we define it above, exists. That is, we expect to find more willingness among partisans to interfere with specific exercises of civil liberties by members of their partisan out-group than their in-group. Our pre-registered hypothesis 1 is thus:
Hypothesis 1: Intolerance of free speech and free association is higher for partisan out-groups than partisan in-groups.
Second, we are interested in whether and how partisan intolerance is related to both (1) abstract political tolerance and (2) affective polarization. If intolerance is simply the absence of political tolerance, as existing studies assume, we would expect a close but negative association between abstract support for civil liberties like free speech and free association and our measure of partisan intolerance (as set out in Hypothesis 2). However, we might also expect that partisan intolerance is more closely related to affective polarization than to abstract notions of political tolerance. In that case, we would find greater partisan intolerance among those who are more affectively polarized (as set out in our pre-registered Hypothesis 3).
Hypothesis 2: The gap in intolerance of free speech and free association between partisan in-groups and partisan out-groups is greater among those with lower levels of abstract tolerance.
Hypothesis 3: The gap in intolerance of free speech and free association between partisan in-groups and partisan out-groups is greater among the more affectively polarized.
Finally, we turn to our pre-registered hypotheses 4a and 4b, which suggest that the type of tolerant actions we expect to find favour among partisans will be more ‘minimal’ – that is, prioritizing avoidant over engaged forms of non-interference – especially among the more affectively polarized. Minimally tolerant actions might include staging a counter-protest or else simply avoiding a public speech or protest that one dislikes, whereas more maximal forms might involve going along to an event to respectfully engage the other side. We would expect that partisan tolerance (as opposed to intolerance), to the extent it is present, is mostly minimal. That is, we expect that partisans who tolerate an activity by the out-group to be less likely to favour outcomes that involve respectful engagement. Moreover, we expect more affectively polarized partisans to be even less likely to favour maximal forms of tolerance.
Hypothesis 4a: Tolerance of free speech and free association for partisan out-groups, compared to partisan in-groups, is more ‘minimal’.
Hypothesis 4b: Among more affectively polarized partisans, tolerance of free speech and free association for partisan out-groups, compared to partisan in-groups, is more ‘minimal’.
Data and Measurement
To test our hypotheses, we conducted two pre-registered survey-embedded experiments.Footnote 6 Our data come from a nationally representative survey of Britain, fielded online by YouGov in July 2023 with 4,127 respondents. Britain is a good arena in which to measure partisan intolerance, because the party system is long established and there are neither unusually high nor low levels of affective polarization (Gidron et al. Reference Gidron, Adams and Horne2020; Wagner Reference Wagner2021). In that sense, this provides a broadly representative case for both measuring partisan intolerance and testing the relationship between partisan intolerance and affective polarization. The design of the two experiments allows us to compare people asked about an in-group partisan action with people asked about an out-group partisan action. Importantly, in both cases, we avoid abstraction and the confusion of attitudes and actions by using specific exercises of civil liberties described with appropriate trade-offs.
Measuring Partisan Intolerance
We measure partisan intolerance using two main methods. For both methods, we first capture in-group and out-group status by measuring partisanship. 55 per cent of our sample gave a party identification with one of the two main parties, split evenly between the Conservatives (27 per cent) and Labour (28 per cent), and 26 per cent had no party identification.Footnote 7
Our first method presents each respondent with a series of realistic scenarios about one partisan side engaging in an action related to freedom of association or freedom of speech. One half of the sample, treatment A, received three civil liberties scenarios (described below) that referred to actions by Labour supporters and politicians; the other half, treatment B, received three otherwise identical scenarios that referred to Conservative supporters and politicians. We are primarily interested in comparing the effects of in-group assessments with out-group assessments, which we define as partisan intolerance. This effectively gives us six treatment groups: T1, Labour partisans who receive the Labour scenarios; T2, Conservative partisans who receive the Labour scenarios; T3, non-partisans who receive the Labour scenarios; T4, Labour partisans who receive the Conservative scenarios; T5, Conservative partisans who receive the Conservative scenarios; T6, non-partisans who receive the Conservative scenarios. Partisan tolerance is thus the difference between T1 and T4 for Labour partisans and the difference between T2 and T5 for Conservative partisans. Table 1 shows the six groups.
Overview of treatment groups in method 1

The three scenarios are supporting a ban on a disruptive street protest, supporting the ban of a politician on a social media site, and supporting a ban on a controversial politician speaking in a school. These are designed to resemble real world decisions that different authorities might make about allowing the exercise of free speech or freedom of association. In all cases, we do not give any specifics of the ideological position of the different actors. The exact scenarios are explained in more detail in Appendix 1, but below is an example of Treatment A for the street protest scenario:
Imagine that a demonstration is planned by some Labour politicians near where you live. These Labour politicians are protesting against a policy which most voters support. The protest is likely to draw hundreds of people and be fairly noisy. It will also close some roads and mean police officers will be taken away from their normal duties. The police are considering whether to give permission to the Labour protest.
After each scenario, there are three outcome measures. The first simply asks whether people think the protest/politician should be banned. The authority banning each activity differs across the three scenarios (the police for the protest; the company for the social media ban; the head teacher for the school talk), but the permission question is phrased similarly. For example, for treatment A of the protest scenario:
Do you think the Labour politicians should or should not be given permission for this protest?
<1> The Labour protest should be given permission to go ahead.
<2> The Labour protest should not be given permission to go ahead.
The next measure (which we ask only for the protest scenario) measures behavioural intentions. Here, people are asked whether they would sign a petition in favour of their own position on a four-point scale from ‘definitely would not’ to ‘definitely would’. People who say that they would sign a petition in favour of an intolerant position are thus more intolerant, and people who would sign a petition in favour of a tolerant position are more tolerant.
Finally, to test hypotheses 4a and 4b, we measure the degree, or type, of tolerance in all three scenarios by asking people in each scenario what ‘they would like to happen’ if the protest/speech went ahead by ranking three outcomes that describe (1) minimal disruptive tolerance (the opposition engaging in disruptive behaviour); (2) minimal avoidant tolerance (the opposition ignoring the protestors/politician); and (3) maximal tolerance (the opposition engaging respectfully with the protestors/politicians). For example, and again, for Treatment A of the protest scenario, the question reads:
If the protest was given permission, what would you prefer to happen? Please rank the below outcomes from best to worst.
<1> The Labour protest is given permission, but Conservative counter-protestors disrupt and ‘drown out’ the original Labour protest.
<2> The Labour protest is given permission, but Conservative supporters stage a respectful counter-protest to draw attention to the other side of the issue.
<3> The Labour protest is given permission, and Conservative supporters largely ignore it.
Our second method of measuring partisan intolerance uses a conjoint experiment. This was fielded to the same respondents after the scenario experiment. Conjoints allow researchers to uncover the relative influence of different factors in how people make decisions over bundled outcomes (Hainmueller et al. Reference Hainmueller, Hopkins and Yamamoto2014; Leeper et al. Reference Leeper, Hobolt and Tilley2020). Participants are shown pairs of vignettes that vary according to a set of features, with combinations of features randomly varied, and respondents then select which vignette they prefer. In our experiments, this enables us to capture the degree to which the in-group or out-group status of the people engaging in contentious activity matters for partisan intolerance, relative to other factors.
In our design, all respondents receive three conjoint experiments (with each repeated three times) that match the scenarios. The first thus focuses on whether a protest should happen, the second on whether a politician should be banned from social media, and the third on whether a politician should be allowed to speak in a school. All three conjoints contain an attribute which measures the party of the politician(s) involved in order to capture the partisan gap in tolerance, as well as several other attributes (all presented in randomized order) specific to the contentious activity, which all have three or four levels. Appendix 2 has the full details, but, for example, in the protest conjoint we include the estimated number of people at the protest, the police presence, the number of roads closed, the proportion of people who agree with the protest aim, the duration of the protest, the noise level, and the likely type of protest in terms of its potential for violence. After being given two randomly varying protests labelled A and B, respondents were asked:
Which of the two protests do you think should be given permission to go ahead?
<1> Only protest A should go ahead
<2> Only protest B should go ahead
<3> Both protests should go ahead
<4> Neither protest should go ahead
We code 2 and 4 as indicating intolerance of protest A, and 1 and 4 as indicating intolerance for protest B.
Measuring Political Tolerance
As well as partisan intolerance, we also measure support for abstract democratic principles, or abstract political tolerance. This is straightforwardly measured using a battery of five items based on previous work (Marcus et al. Reference Marcus, Sullivan, Theiss-Morse and Wood1995) as below:
Society shouldn’t have to put up with those who have political ideas that are extremely different from the views of the majority
Free speech ought to be allowed for all political groups even if some of the things these groups believe are highly offensive or viewed as threatening to particular segments of society
No matter what a person’s political beliefs are, they are entitled to the same legal rights and protections as anyone else
I believe in free speech for all no matter what their views might be
It is better to live in an orderly society than to allow people so much freedom that they can become disruptive
Respondents were asked whether they strongly disagreed, disagreed, neither agreed nor disagreed, agreed, or strongly agreed. After reversing the first and fifth items, we took the average and divided by five to create a 1–5 scale that runs from most intolerant to most tolerant.Footnote 8
Measuring Affective Polarization
We use three measures of affective polarization, all of which were asked before the experimental treatments. First, to measure feelings towards in-partisans and out-partisans, we use a standard measure of affective polarization: the difference between two questions that ask people how they feel about the two main partisan groups on a 0–100 thermometer scale. In principle, the difference between the two thus runs from −100 to +100, although in practice extremely few people rate the other partisan group as more likeable than their own partisan group,Footnote 9 and it therefore runs from 0–100 with 100 as the maximum level of affective polarization. The thermometer measure is introduced using parties,Footnote 10 and we find very similar results if we measure affective polarization between parties rather than between partisans (see Appendix 10).
To separately measure people’s positive partisanship, we use a battery of five questions similar to those originally designed by Stephen Greene (Reference Greene1999, Reference Greene2002) and widely used in this shorter format in the United States (Huddy et al. Reference Huddy, Mason and Aarøe2015) and the United Kingdom (Hobolt et al. Reference Hobolt, Lawall and Tilley2024). We therefore ask people whether they agree or disagree with the following with regard to their own party and fellow partisans. The response options were ‘strongly disagree’ to ‘strongly agree’, which are scored 1–5 and then averaged.
When I speak about the [in-group party], I usually say ‘we’ instead of ‘they’
When people criticize the [in-group party], it feels like a personal insult
I have a lot in common with other supporters of the [in-group party]
When I meet someone who supports the [in-group party], I feel connected with this person
When people praise the [in-group party], it makes me feel good
To measure negative partisanship, we use a five-item battery based on Bankert (Reference Bankert2021,Reference Bankert2023). These questions are similar to the measure of positive partisanship, but refer to out-group animosity towards the rival party and rival partisans.Footnote 11 Again, the response options were ‘strongly disagree’ to ‘strongly agree’, which are scored 1–5 and then averaged. The list of items is below.
When [out-group party] does well in opinion polls, my day is ruined
When people criticize the [out-group party], it makes me feel good
I do not have much in common with [out-group party] supporters
When I meet someone who supports [out-group party], I feel disconnected
I get angry when people praise [out-group party]
Controls
We include two sets of controls. The first set are demographic characteristics known to affect abstract political tolerance: age, education, and gender (Boch Reference Boch2022; Evans Reference Evans2002; Marcus et al. Reference Marcus, Sullivan, Theiss-Morse and Wood1995; Rasmussen and Ludeke Reference Rasmussen and Ludeke2022; Sullivan and Hendriks Reference Sullivan and Hendriks2009).Footnote 12 The second set are ideological positions asked before the experiments. We measure these using two scales based on a battery of fourteen items with 1–5 response categories from ‘strongly disagree’ to ‘strongly agree’ (see Appendix 3). The two scales largely replicate previously validated measures (Evans et al. Reference Evans, Heath and Lalljee1996; Heath et al. Reference Heath, Evans and Martin1994) of the two main dimensions of political ideology in Britain: economic left–right and social conservatism–liberalism. Ideological position is included in models as an effect itself, but, more importantly, we also include ideological extremity. This is calculated as the absolute difference between the mean ideological position in our sample and the respondent’s ideological position. There are more details of the effects of ideological extremity on intolerance in Appendix 5.
Analysis
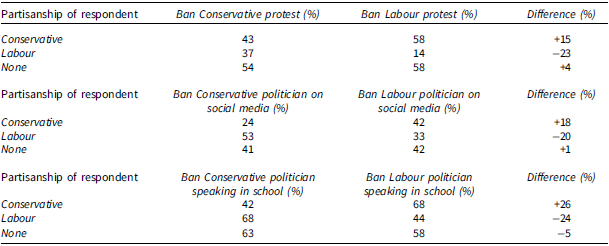
The first step in our analysis is simply to show levels of support for restricting or interfering with the exercise of civil liberties by the partisanship of the group engaged in the activity and the partisanship of the respondent. Table 2 therefore shows the percentage of people who wanted to ban a protest, ban a politician from social media, and ban a politician from speaking in a school. The difference shown in the third column is partisan intolerance: the difference between wanting to restrict Labour versus the Conservatives. Positive numbers for Conservative partisans, and negative numbers for Labour partisans, thus show the magnitude of intolerance.
Partisan intolerance

Table 2 reveals a fair degree of partisan intolerance. Labour partisans are 23 per cent more likely to ban a Conservative protest than a Labour protest, and Conservative partisans are 15 per cent more likely to ban a Labour protest than a Conservative protest. In fact, these intolerance gaps are around 20 percentage points for every scenario for both Labour and Conservative partisans. The importance of measuring partisan intolerance as a difference is clear: in general, Labour partisans are less supportive of banning protests and, conversely, Conservative partisans are less supportive of banning politicians from social media.
As Hypothesis 1 postulated, partisan intolerance exists. Moreover, and in contrast with previous studies that find asymmetries between Left and Right with respect to political tolerance (Jost et al. Reference Jost, Baldassarri and Druckman2022; Spinner-Halev and Theiss-Morse Reference Spinner-Halev and Theiss-Morse2024), we find partisan intolerance to be comparatively symmetrical across the political spectrum. Regardless of party, partisans are willing to restrict the civil liberties of people on the other side substantially more than of their own side in the same situations. However, while Conservative and Labour partisans have very different views of activities by the two groups, non-partisans regard both sides similarly. About half of non-partisans would ban both the Conservative and Labour protest, about 40 per cent would ban both the Conservative and Labour politician from social media, and about 60 per cent would ban both the Conservative and Labour politician from speaking in a school.Footnote 13
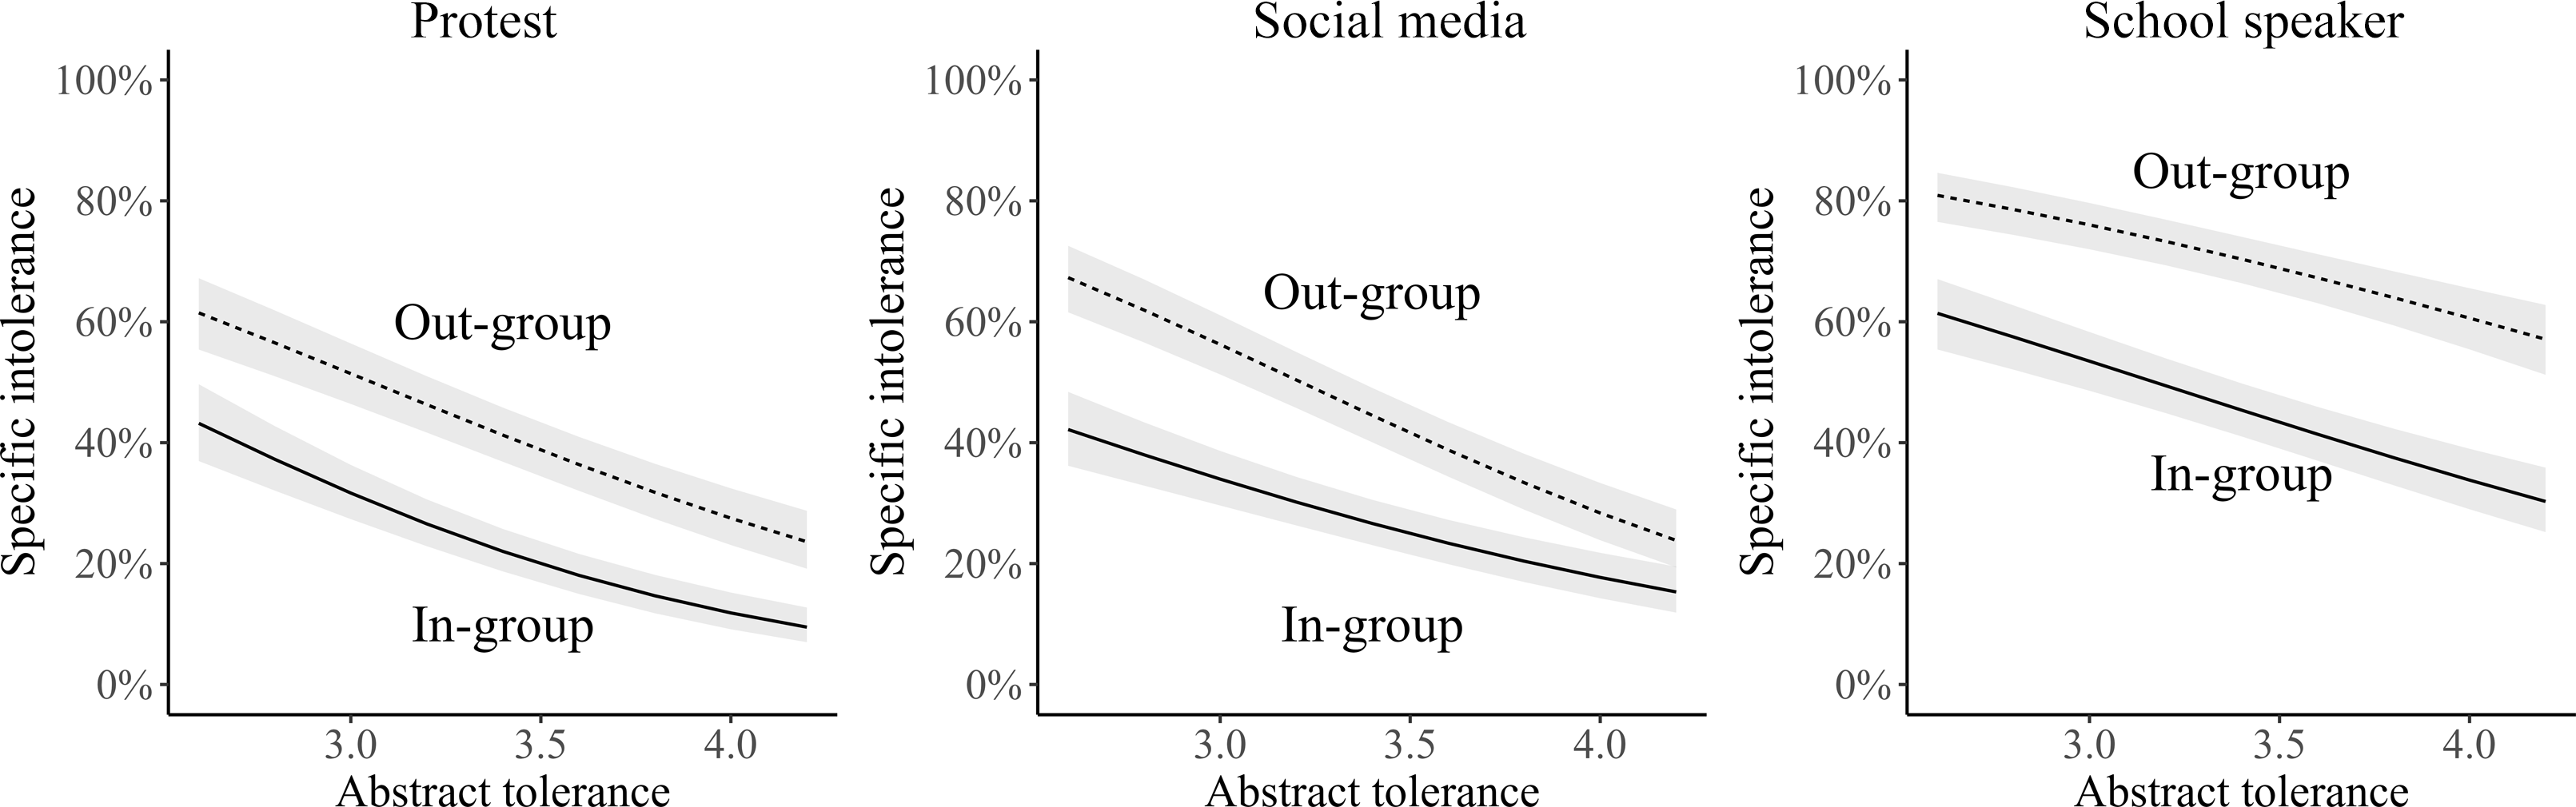
Moving on, hypothesis 2 suggests – in keeping with the binary assumptions informing previous research – that abstract political tolerance should be negatively correlated with partisan intolerance. Figure 1 shows the predicted probability of partisan intolerance, given levels of abstract tolerance, from logit models that include only Conservative and Labour partisans. The dependent variable in these models is thus banning the protest/politician. The key independent variables are whether the political actor is part of the in-group or out-group of the respondent, the level of abstract tolerance, and the interaction between affective polarization and whether the political actor is part of the in-group or out-group. Controls for age, gender, and education are also included.
Partisan intolerance and abstract tolerance.
Note: figures are predicted probabilities from logit regression models that predict specific intolerance. Abstract intolerance is a 1–5 scale (shown here from bottom 5 per cent to top 95 per cent of scale distribution). Controls for age, gender, and education are included. All controls are held at their mean. Full models are in Appendix 4.

As Figure 1 shows, people who endorse abstract principles of political tolerance are considerably less likely to want to ban any protests or any public speech. But partisan intolerance persists. Indeed, contrary to received wisdom, we find little connection between abstract political tolerance and the gap between in-group and out-group intolerance. The difference between tolerating the in-group and the out-group is as present for those who sign up to all the abstract principles of tolerance as it is for those who do not. None of the interactions between abstract tolerance and in-group/out-group are statistically significant (see Appendix 4).
We thus find little support for hypothesis 2. Rather, partisan intolerance appears different in type from support for abstract ideas of civil liberties. Although someone might endorse the protection of civil liberties in principle, this does not appear to predict their reaction when faced with a specific partisan out-group. In fact, going back a stage, the predictors of abstract tolerance and partisan tolerance seem to be quite different. The standard factors that predict abstract tolerance, such as education, age, gender, and social liberalism, have small and inconsistent effects on partisan tolerance.Footnote 14
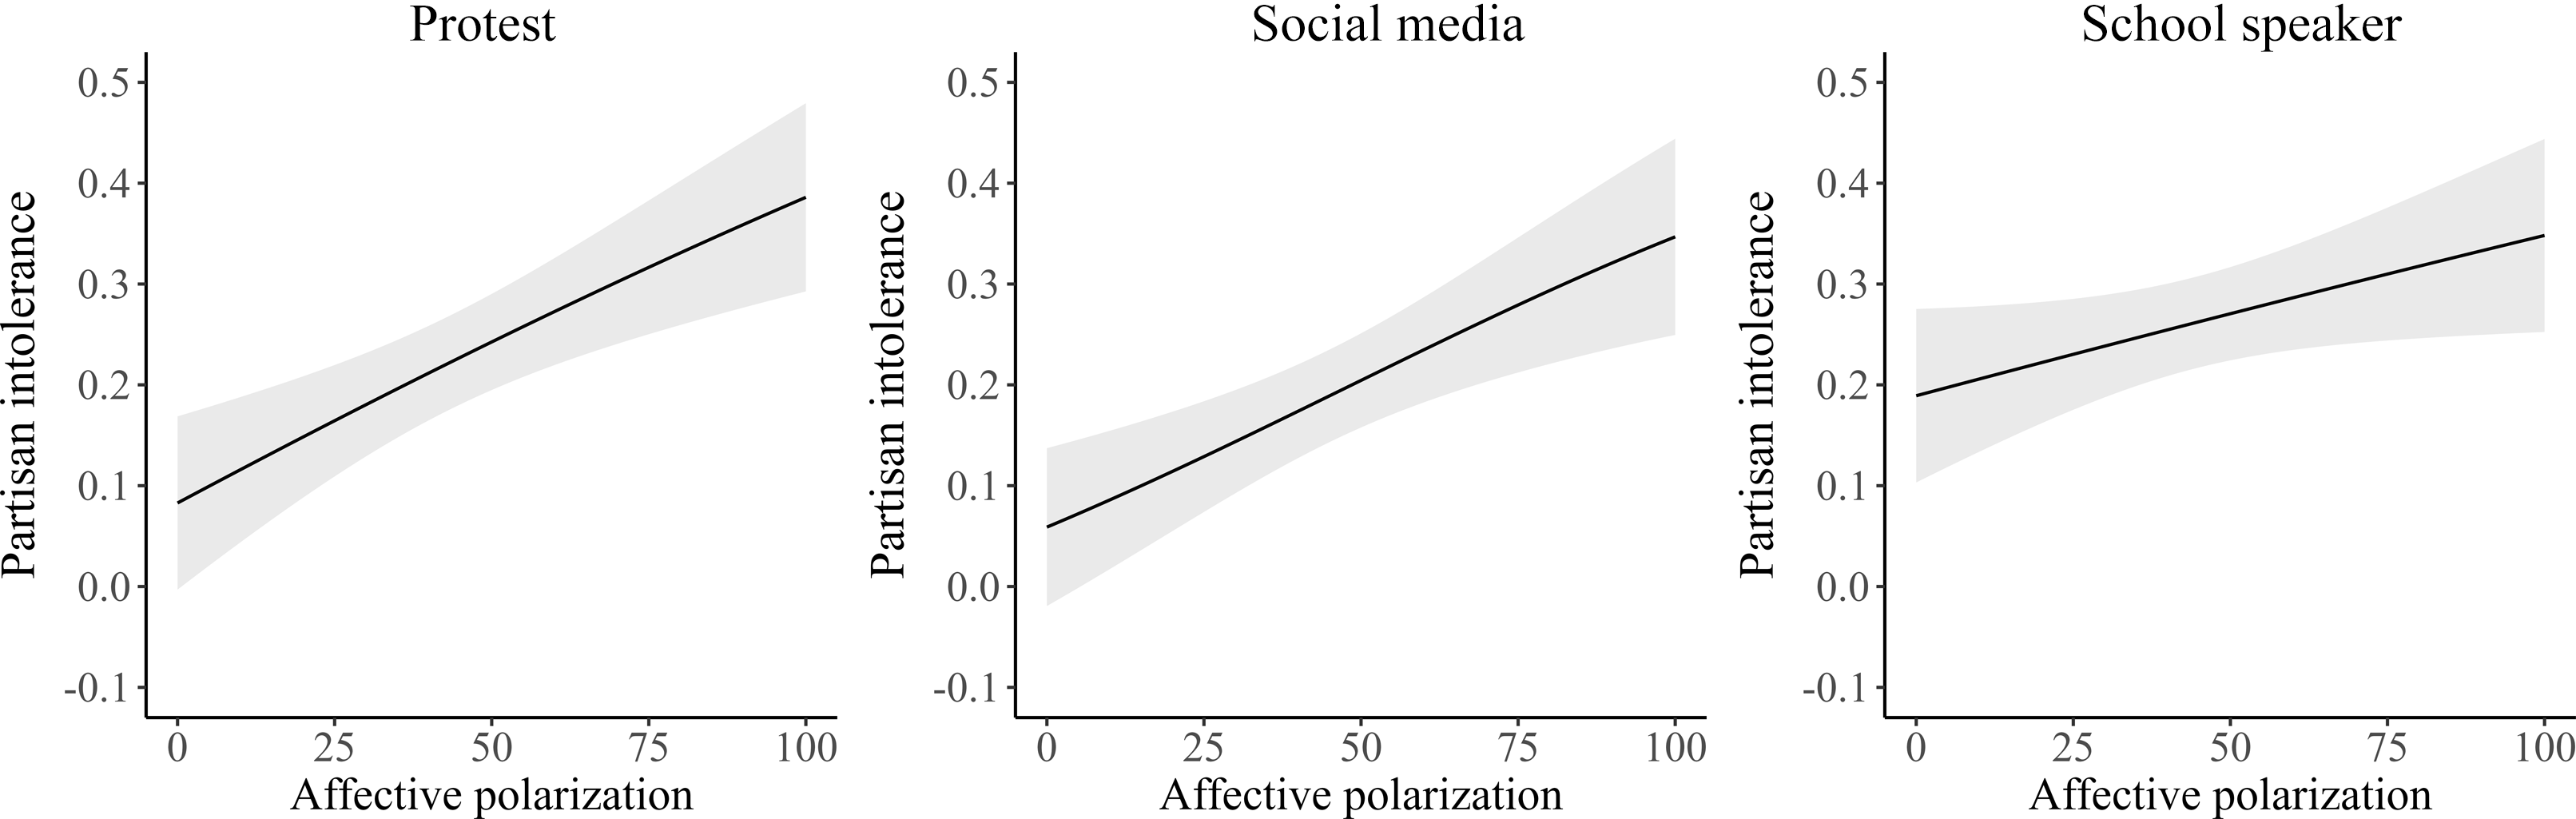
What does predict partisan intolerance? Figures 2–4 test Hypothesis 3 that affective polarization is correlated with partisan intolerance. Figure 2 shows the predicted probability of partisan intolerance from logit models that just include Conservative and Labour partisans. Here, the key independent variables are whether the political actor is part of the respondent’s in-group or out-group, the level of affective polarization (measured by the difference between the thermometer scales), and the interaction between affective polarization and whether the political actor is part of the in-group or out-group. As well as demographic controls (age, gender, and education), we also include important controls for ideological extremity, ideological position, and an interaction between ideological extremity and whether the actor is an out-partisan. Appendices 4 and 5 show that, in general, ideological extremity increases intolerance a little, but this is only statistically significant in the schools scenario.
Partisan intolerance and affective polarization.
Note: figures are predicted probabilities from logit regression models predicting specific intolerance and show the difference between tolerance of out-group and in-group activities. Affective polarization is a 0–100 scale based on feeling thermometers towards partisans. Controls are included for age, gender, education, ideological position, ideological extremity, and the interaction between ideological extremity and partisan in-group/out-group. All controls are held at their mean. Confidence intervals obtained using the Delta method. Full models are in Appendix 4.

Partisan intolerance and tolerance in terms of behavioural intention.
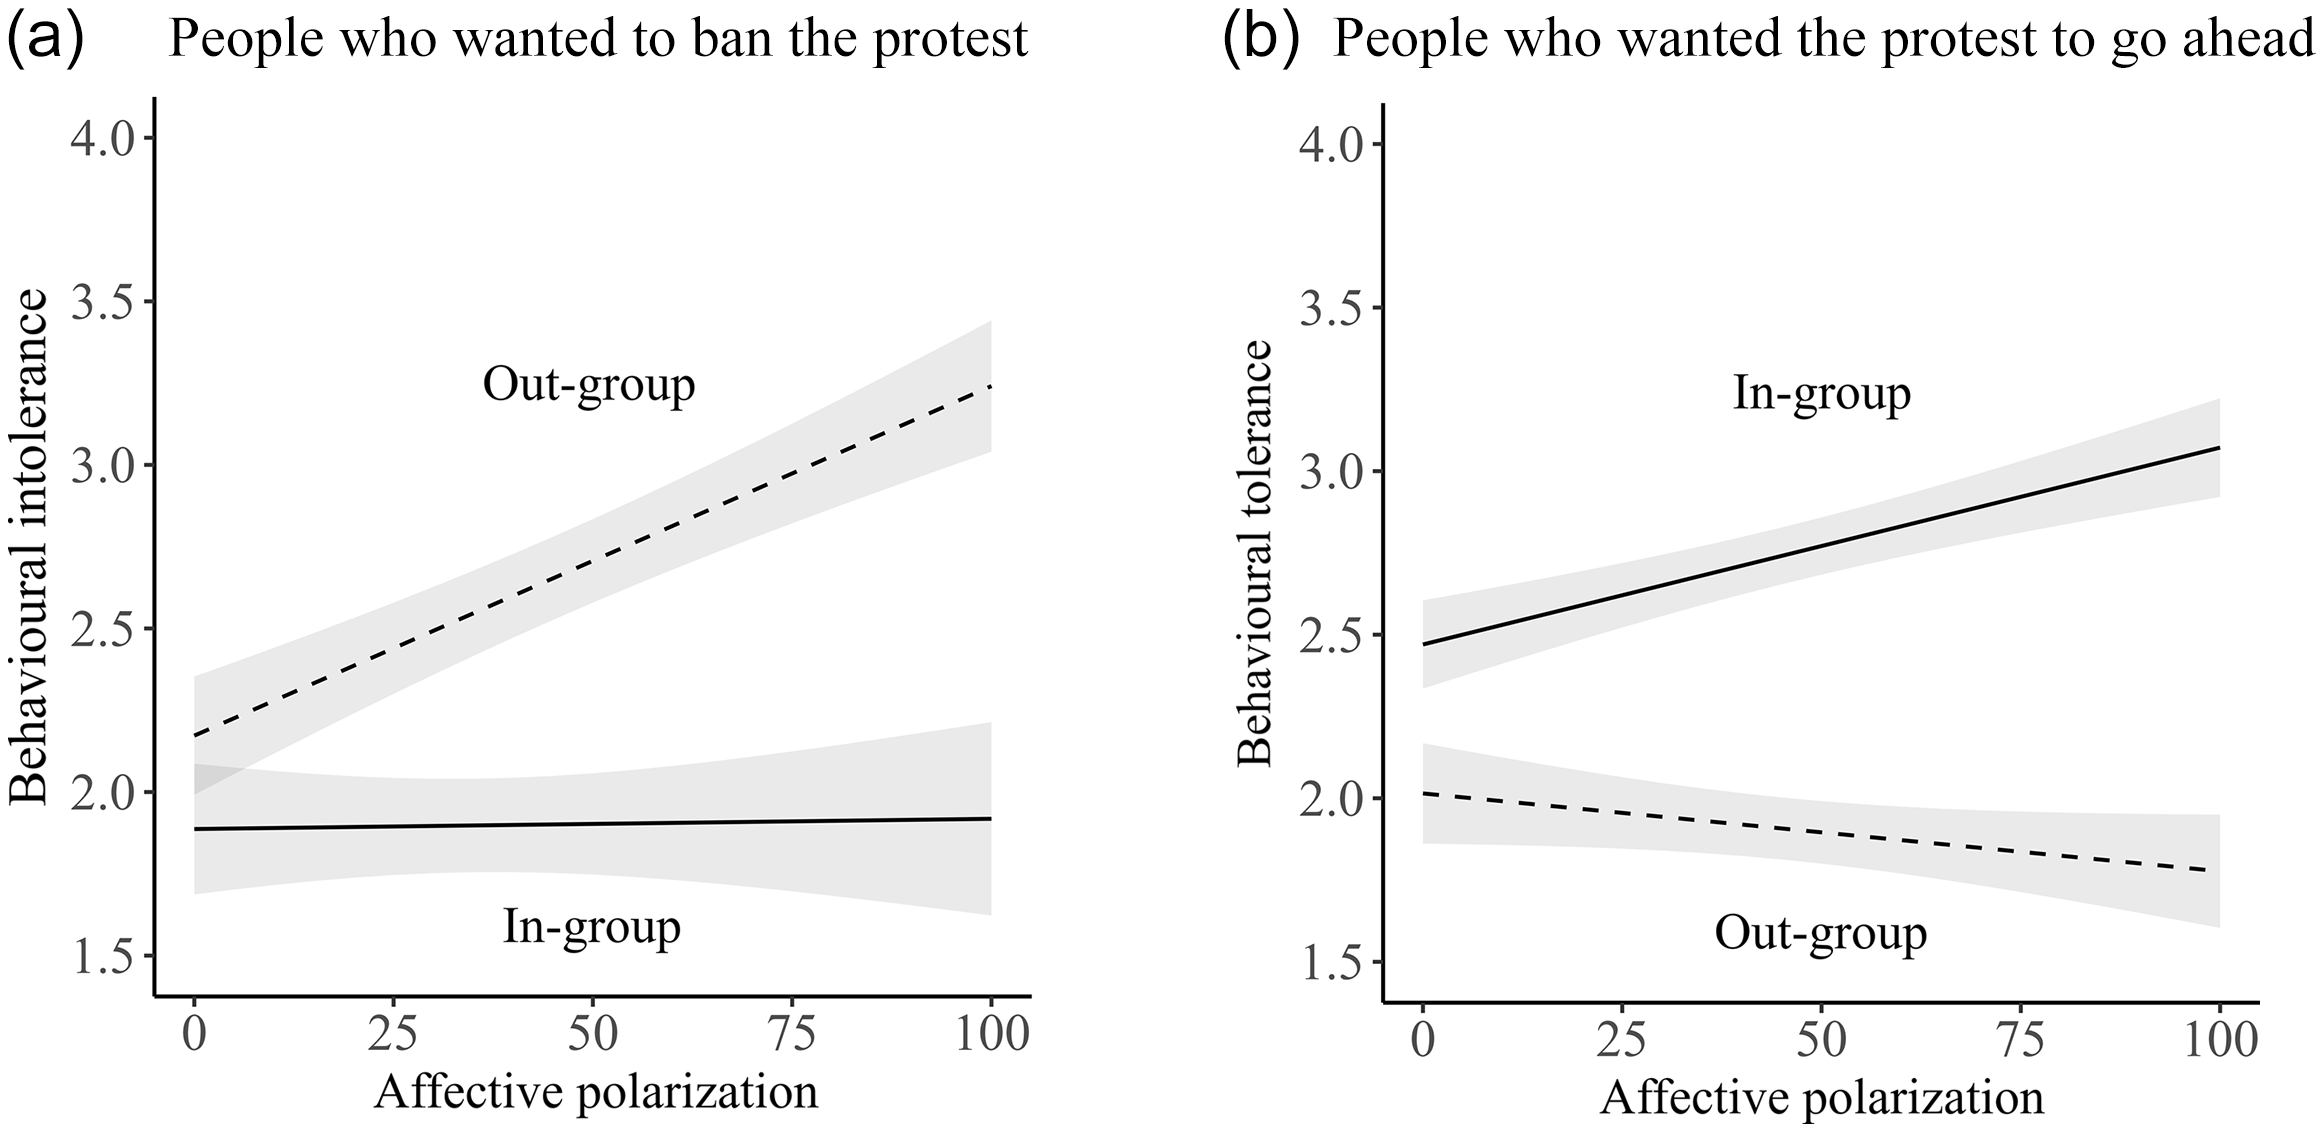
Note: figures are from linear regression models predicting willingness to sign a petition in favour of the respondent’s position on a 1–4 scale. Controls are included for age, gender, education, ideological position, ideological extremity, and the interaction between ideological extremity and partisan in-group/out-group. All controls are held at their mean. Full models are in Appendix 6.

Conjoint experiments showing partisan intolerance by affective polarization.
Note: marginal means from a series of conjoint experiments including numerous attributes of the event being described. Respondents are divided into four sub-groups (low = below 25, lower = between 25 and 49, higher = between 50 and 74, high = 75 and above) based on their level of affective polarization as measured by feeling thermometers towards partisans. The full results are in Appendix 7.

Figure 2 shows the predicted level of partisan intolerance (the gap between banning the out-group and the in-group) by affective polarization. In each of the three scenarios, people with low levels of affective polarization exhibit little in the way of partisan intolerance and their scores are often close to zero. People with high levels of affective polarization, on the other hand, are consistently intolerant. All the interactions between partisan group and affective polarization are statistically significant (see Appendix 4). It is clear that the affectively polarized do not just dislike the other side, but are much more willing to curtail their civil liberties compared to people on their own side.
We find a similar pattern in Figure 3 when we turn to (in)tolerance measured as a behavioural intention. Here, we predict how likely people are to sign a petition to support their original position on a 1–4 scale with an ordinary least squares (OLS) regression model. This is just for the protest scenario and, as previously, we include variables measuring whether the protest is by the in-group or out-group, the level of affective polarization, and an interaction between the two. As in Figure 2, we also control for age, sex, education, ideological position, ideological extremity, and the interaction between ideological extremity and the protest type. The y-axis in Figure 3 is thus willingness to support one’s original position by behaviour and the x-axis is the level of affective polarization.
Panel (a) shows people who wanted to ban the protest. Here, partisans are generally more likely to want to sign a petition in favour of banning an out-group than an in-group. However, this is enormously magnified for those who are affectively polarized. For people at the highest levels of affective polarization, there is over a one-point gap on the four-point scale between attitudes towards the in-group and out-group protest. It is not just that affectively polarized partisans are more willing to ban a protest by the other side; they also claim to be much more willing to follow up with action to support that ban. The reverse is true for people who do not want to ban the protest. Here, the affectively polarized are very unwilling to sign a petition in favour of the other side protesting, but very willing to sign a petition in favour of their own side protesting.
Our final piece of evidence in terms of partisan intolerance and affective polarization comes from the conjoint experiment. Figure 4 shows the marginal means from this experiment for the proportion of people who want to ban the protest/politician (Appendix 7 shows the full results for every attribute).
We divide people into four sub-groups by their level of affective polarization. In each case, people in the highest affective polarization grouping show considerable partisan intolerance. For example, while 51 per cent of the most affectively polarized people would ban an out-group protest, only 39 per cent would ban an in-group protest. There are similar patterns for the social media ban and politicians speaking in schools.Footnote 15
Overall, our results provide clear support for hypothesis 3: there is a strong association between affective polarization and partisan intolerance. But is this driven by animosity towards the other side or affinity with one’s own side? Figure 5 shows the results of regression models that replicate model 2 from Figure 2, but simultaneously include measures of positive and negative partisanship using the question batteries, rather than the thermometer measure. The models include demographic and ideological controls (see Appendix 8).
Partisan intolerance and positive/negative partisanship.
Note: figures are predicted probabilities from logit regression models predicting specific intolerance and show the difference between tolerance of out-group and in-group activities. The effect of positive partisanship holds constant negative partisanship at its mean and vice versa. Controls are included for age, gender, education, ideological position, ideological extremity, and the interaction between ideological extremity and partisan in-group/out-group. All controls are held at their mean. Confidence intervals obtained using the Delta method. Full models are in Appendix 8.

As Figure 5 reveals, the effect of positive partisanship, when holding constant negative partisanship, is essentially zero, while the effect of negative partisanship on intolerance is consistently very large. It is dislike of the other side that matters. When ideological opponents are disliked, we see partisan intolerance.
Finally, what of degrees of tolerance and hypotheses 4a and 4b? When people are tolerant of others’ civil liberties, are there differences in the types of tolerance that they show to their own side and the opposing side? And how is this related to affective polarization? Figure 6 shows the gap between the mean rank score of activity by the out-group and the in-group for three types of tolerance: disruptive engagement, avoidance, and respectful engagement. Positive numbers thus indicate that the option is more highly ranked and more desired for an out-group activity than an in-group activity.
Types of partisan tolerance and affective polarization.
Note: figures are from linear regression models predicting mean rank of the option of disruptive engagement, respectful engagement, and avoidance. The partisan gap is the difference in mean rank for the in-group and out-group activity: positive scores indicate that the mean rank is higher for the out-group activity. Controls are included for age, gender, education, ideological position, ideological extremity, and the interaction between ideological extremity and partisan in-group/out-group. All controls are held at their mean. Confidence intervals obtained using the Delta method. Full models are in Appendix 9.

There is mixed support for hypotheses 4a and 4b. In all three scenarios, there is generally greater support for disruption of an out-group activity than an in-group activity, and this is particularly marked at very high levels of affective polarization. This fits with hypotheses 4a and 4b that more minimal forms of tolerance will be preferred for out-group activities than in-group activities and this will be greater for the affectively polarized. But this is only a trade-off with respectful engagement in the school scenario. In the protest and social media scenarios, respectful engagement follows a similar, but weaker, pattern to disruptive engagement. In those two scenarios, people rank avoidance as lower for out-group activities and again this is heightened at high levels of affective polarization. In that sense, our findings thus run counter to hypotheses 4a and 4b, which suggest that minimal tolerance, such as avoidance, will be ranked higher for partisan out-groups.
Conclusion
Concerns about the consequences of affective polarization for the health of democracy are on the rise around the world. A key worry is that polarization will lead partisan citizens to become increasingly intolerant of their opponents’ civil liberties (Finkel et al. Reference Finkel, Bail, Cikara, Ditto, Iyengar, Klar, Mason, McGrath, Nyhan, Rand and Skitka2020; Iyengar et al. Reference Iyengar, Lelkes, Levendusky, Malhotra and Westwood2019; Kingzette et al. Reference Kingzette, Druckman, Klar, Krupnikov, Levendusky and Ryan2021; McCoy and Somer Reference McCoy and Somer2019). Underlying these fears is the belief that political tolerance is an essential democratic norm. This belief is so widely shared that even the King recently extolled Britain’s ‘deep well of civility and tolerance, on which our political life and wider national conversation depend’ (Charles III 2023). This suggests that without the willingness to put up with political activity on behalf of people or causes we dislike, democratic debate and constructive engagement across deepening political divides must become increasingly difficult (Scudder Reference Scudder2020; Spinner-Halev and Theiss-Morse Reference Spinner-Halev and Theiss-Morse2024). Yet today, this consensus is coming under increasing challenge by those who doubt the democratic benefits of tolerating people and parties they themselves regard as ‘intolerant’ (Chong et al. Reference Chong, Citrin and Levy2024). What is more, it raises questions about what, exactly, tolerance requires from citizens practically, and whether there is, in fact, a ‘deep well’ of it in modern Britain or any other liberal democracy.
This paper has addressed these questions by combining insights from political theory and behaviour to introduce the concept of partisan intolerance, then test it through a set of original experiments. Unlike traditional measures of political tolerance that focus on unpopular minorities or abstract support for civil liberties, our concept captures the kind of everyday (in)tolerance that matters most under conditions of partisan polarization: namely, citizens’ willingness to interfere (or not) with commonplace exercises of freedom of speech and association by their mainstream political opponents.
Worryingly, and pace Charles, our results suggest that the well of tolerance in modern Britain is shallower than one might wish. Specifically, we find a substantial degree of partisan intolerance among British citizens, with partisans across the political spectrum less likely to support their opponents’ rights to free speech and protest. Moreover, while we find no relationship between partisan intolerance and political tolerance in the abstract, we do find a strong and direct correlation between partisan intolerance and affective polarization, driven primarily by out-partisan hostility.
There are two important caveats to our findings. The first is that, despite our aspirations to greater particularity and concreteness with respect to the scenarios presented to participants, we omitted the nature of the specific issue or controversy involved. This was a deliberate attempt to isolate partisan intolerance, but the lack of issue information may have led people to project a particular issue position onto a protest or politician depending on their party affiliation. That we find only very weak relationships between ideological extremity and partisan intolerance suggests that this effect is probably not large; nevertheless, we cannot rule out the possibility that our measurements include a degree of assumed issue-based disagreement. While testing this possibility represents an important avenue for future research, it requires solutions to two problems. First, certain causes are more plausible for certain parties, and second, the types of issues that are equally plausible for all parties tend to be of low salience.
A second, and perhaps more important, caveat is that we look at only Britain in 2023, hence a political context with long-standing attachments to two major parties. While Britain does not have especially high levels of affective partisan polarization (Gidron et al. Reference Gidron, Adams and Horne2020; Wagner Reference Wagner2021), our choice of case nonetheless raises the question of whether our findings are generalizable to more fragmented, multiparty systems. One possible answer to that question lies in the nature of political identities. We focus in this article on partisanship as the key political identity, but in other contexts at other times, this may not be the case. Indeed, even in Britain in 2023, there were rival political identities based on vote choices at the 2016 EU referendum (Hobolt and Tilley Reference Hobolt and Tilley2026). More generally, we know that in some countries there are political in-groups and out-groups based on established ideological bloc identities of ‘Left’ and ‘Right’. There are typically levels of affective polarization between these blocs that are comparable to partisan identities in the United States (Bantel Reference Bantel2023). Thus, while we talk of partisan tolerance here, not least to map it on to the affective partisan polarization literature, political intolerance in the way we conceptualize it could apply to other political identities. And, indeed, we would hope that future research would take this intolerance between other political identity groups more seriously. In that sense, it is not just that the partisan intolerance we find is likely to generalize to other countries that are similarly affectively polarized by partisanship, but that in contexts in which ideology trumps party identity, ideological bloc intolerance should also be common. If so, and if their ‘political life and national conversation’ also depend on these types of tolerance, our results are more than a little concerning.
In response to these rather pessimistic thoughts, some readers might raise a further objection: namely, that partisan intolerance is less dangerous for democracy than we suggest because it is an appropriate response when a mainstream political party becomes increasingly intolerant of its opponents. In other words, intolerance may be justified when dealing with a radical party whose members are, themselves, politically intolerant. But if our results are correct, that is, if significant and comparatively symmetrical levels of partisan intolerance exist on both the mainstream Left and Right, this objection may prove self-defeating. Recent events in the United States, for instance, suggest that the Left surrenders liberal principles of tolerance, or indeed free speech, at its own peril. To paraphrase Bejan (Reference Bejan2017, 153): ‘A tolerant society that seeks to suppress the intolerant won’t remain tolerant for very long’.
Supplementary material
Supplementary material for this article can be found at https://doi.org/10.1017/S0007123426101550
Data availability statement
Replication data for this article can be found at: https://doi.org/10.7910/DVN/S0J0BZ
Acknowledgements
We would like to thank the anonymous reviewers and the editors of the British Journal of Political Science for their very constructive and helpful comments. We would also like to thank Ruth Dassonneville, Melanie Dietz, Ed Kelly, Logan Strother, Markus Wagner, and Anthony Wells for comments on, or help with, earlier versions of the paper.
Financial support
This work was supported by the Economic and Social Research Council (SH and JT, grant number: ES/V004360/1); the European Research Council (SH, grant number: ERC-CoG-2014 647835-EUDEMOS); the Institute for Humane Studies (JT, grant number: IHS016901); and the Leverhulme Trust (TB).
Competing interests
The authors declare none.
Ethical standards
Ethics approval was obtained from the Research Ethics Committee of the London School of Economics and Political Science.



 Open access

