

1. Introduction
Weathering and disaggregation of steep rock faces in cold regions is often driven by freeze–thaw cycles, during which water contained within rock pore spaces and cavities, including fractures, is subjected to repeated subzero periods of freezing followed by thawing (Hall, Reference Hall1999). This occurs at a variety of spatial scales, producing granular disintegration, spalling and microfractures (‘microgelivation’), or macrofracture propagation and larger debris (‘macrogelivation’) (Matsuoka, Reference Matsuoka2001). Weathering by volumetric expansion occurs when pore water expands upon freezing and creates an internal pressure build-up producing tensional stress capable of fracturing saturated rock (Matsuoka, Reference Matsuoka2008). In rock with existing fractures, stress builds at crack tips and preferentially degrades these regions (Eppes & Keanini, Reference Eppes and Keanini2017). Freeze–thaw processes also cause rock weathering by segregation ice growth, in which liquid water migrates toward freezing centres in porous rock. This produces an ice lens within the rock that may cause cracking (Walder & Hallet, Reference Walder and Hallet1985; Matsuoka, Reference Matsuoka2008).
However, weathering in cold regions is often attributed to freeze–thaw when there is little beyond atmospheric temperature data to suggest that these processes predominate in exposed rock faces (Hall, Reference Hall1999, Reference Hall2007). Since true freeze–thaw cycles require particular moisture and atmospheric conditions to be met, it is now recognized that these cycles are likely to occur in tandem with additional thermomechanical weathering processes (Gischig et al. Reference Gischig, Moore, Evans, Amann and Loew2011; Grämiger et al. Reference Grämiger, Moore, Gischig and Loew2018).
Freeze–thaw and thermal weathering processes have been extensively studied in arctic and alpine environments (Hall, Reference Hall2007; Matsuoka, Reference Matsuoka2008; Girard et al. Reference Girard, Gruber, Weber and Beutel2013; Draebing & Krautblatter, Reference Draebing and Krautblatter2019; Matsuoka, Reference Matsuoka2019). Yet, few studies have examined weathering of this nature in temperate regions. The Niagara Escarpment lies within temperate climatic region of southern Ontario, Canada and exposes Palaeozoic sedimentary strata. These rocks are subject to weathering processes and experience frequent failure events (Mellies et al. Reference Mellies, Telesnicki and Sandoval2016; Formenti et al. Reference Formenti, Peace, Eyles, Lee and Waldron2022). Despite the infrastructural and safety hazards posed by the instability of the escarpment face, little is known about the actual mechanisms responsible for weathering of the escarpment and their resultant implications for fracture formation and rock failure. Given the paucity of evidence, authors have assumed that freeze–thaw processes predominate during the winter months and are a major contributor to weathering (Moss & Milne, Reference Moss and Milne1998; McCann, Reference McCann2017). To investigate the influence of temperature on these weathering processes, Fahey and Lefebure (Reference Fahey and Lefebure1988) recorded temperatures on the escarpment face in hourly increments and paired temperature data with moisture conditions to determine the likelihood of hydration and ice wedging. Unfortunately, although valuable, the data they collected are insufficient to evaluate the potential for thermal weathering processes, which require minute-scale temperature observations.
The purpose of this study is therefore to provide appropriate quantitative data on the potential mechanisms and factors responsible for weathering of steep rock faces along the Niagara Escarpment in Hamilton, Ontario, during the cold winter months. In particular, the study aims to document temperature fluctuations on exposed rock surfaces and in adjacent fractures to better understand the mechanisms that promote weathering under cold conditions in a temperate climate. A novel field-based experimental study was designed to monitor in situ rock surface and internal fracture temperatures at several sites along the Niagara Escarpment between December 2020 and March 2021. As the escarpment in Hamilton exposes a range of stratigraphic units with varying lithological characteristics, an additional control experiment was conducted to ascertain the potential influence of lithological variability on temperature changes in the exposed rocks.
2. Mechanisms of weathering
The dominant mechanisms of weathering ascribed to cold climate conditions are those associated with freeze–thaw processes that cause rock weathering by volumetric expansion and segregation ice growth (Walder & Hallet, Reference Walder and Hallet1985; Matsuoka, Reference Matsuoka2008). Rock weathering through volumetric expansion typically occurs over short timescales in the uppermost layer of surface rocks where rapid freezing and pore saturation is likely (Draebing & Krautblatter, Reference Draebing and Krautblatter2019). However, ice segregation is commonly associated with longer freeze–thaw cycles which penetrate deep into the bedrock and allow ice lenses to accumulate (Matsuoka, Reference Matsuoka2008). Given that the above processes occur on different temporal scales, it is useful to distinguish diurnal-scale freeze–thaw cycles from longer-term cycles. Diurnal cycles involving temperature fluctuations above and below the freezing point implicate only the top few centimetres of the rock surface, whereas longer-term, sustained cycles involve a prolonged period of subzero temperatures which achieve a high depth of penetration into the rock and play a primary role in macrogelivation (Matsuoka, Reference Matsuoka2001; Vespremeanu-Stroe & Vasile, Reference Vespremeanu-Stroe and Vasile2010). The occurrence and effects of diurnal versus prolonged freeze–thaw cycles are influenced by a variety of rockwall characteristics, such as aspect and lithology, which moderate the transmission of temperature through the rock and dictate resistance to weathering (Walder & Hallet, Reference Walder and Hallet1985; Matsuoka, Reference Matsuoka2008; Draebing & Mayer, Reference Draebing and Mayer2021). This is especially relevant along the Niagara Escarpment where there are significant differences in aspect and lithology within individual outcrops and across the length of the cuesta.
In this paper we use the term ‘thermal weathering’ to denote a variety of deformational processes resulting from rapid to prolonged temperature changes in rock, including thermal stress, thermal fatigue and thermal shock. Thermal stress weathering describes the thermomechanical failure of rock from thermal loading (Giannopoulos & Anifantis, Reference Giannopoulos and Anifantis2007; Collins & Stock, Reference Collins and Stock2016; Eppes et al. Reference Eppes, Magi, Hallet, Delmelle, Mackenzie-Helnwein, Warren and Swami2016). This commonly occurs as thermal fatigue, during which the rock is subjected to a repeated series of thermal events which individually are not stressful enough to induce failure but can collectively cause fracturing over time (Hall, Reference Hall1999). Conversely, thermal shock is a single event of sudden and large temperature change which produces an immediate stress on the rock sufficient to cause failure. For the purpose of this study, we consider a criterion of 1 °C min−1 to be the threshold for thermal shock to potentially occur based on previous work (Hall & Thorn, Reference Hall and Thorn2014). Since thermal shock is dependent on rapid rates of temperature change at the minute scale, a temperature sampling interval of 1 min or shorter is necessary to detect these changes in the field (Hall, Reference Hall1997, Reference Hall1998).
3. Study site
The Niagara Escarpment extends across southern Ontario and the NE United States exposing Palaeozoic sedimentary rocks along its length (Figs 1, 2; Armstrong & Dodge, Reference Armstrong and Dodge2007; Brunton, 2021). Exposed dolostones, shales and sandstones were deposited during the late Ordovician to early Silurian periods and subsequently subjected to Quaternary glacial and fluvial erosion, producing the steep face of the cuesta (Armstrong & Dodge, Reference Armstrong and Dodge2007; Brunton, Reference Brunton, Turner and Armstrong2009). The present study focuses on a subset of formations in the upper part of the escarpment stratigraphy, specifically those of the Lockport Group (the Gasport and Goat Island formations) and the Rochester and Irondequoit formations (Fig. 2). The Lockport Group forms the regional caprock of the escarpment and is subdivided into the Gasport Formation and Ancaster Member of the Goat Island Formation in the study area (Brunton, 2021). The Gasport Formation is a thickly bedded, vuggy and fossiliferous dolostone with uniform thickness of 5 m; the overlying Ancaster Member is very highly fractured and consists of thinly bedded, cherty dolostone with variable fossil content (Fig. 2; Hewitt, Reference Hewitt1971). In the Hamilton area, the Lockport Group is underlain by the Rochester Shale consisting of interbedded laminated shale and fossiliferous dolostones of various thickness (Hewitt, Reference Hewitt1971; Armstrong & Dodge, Reference Armstrong and Dodge2007). The Irondequoit Formation underlies the Rochester Shale and is a massive, vuggy, fossiliferous dolostone bed consistently 1–1.75 m thick in the Hamilton region (Fig. 2).
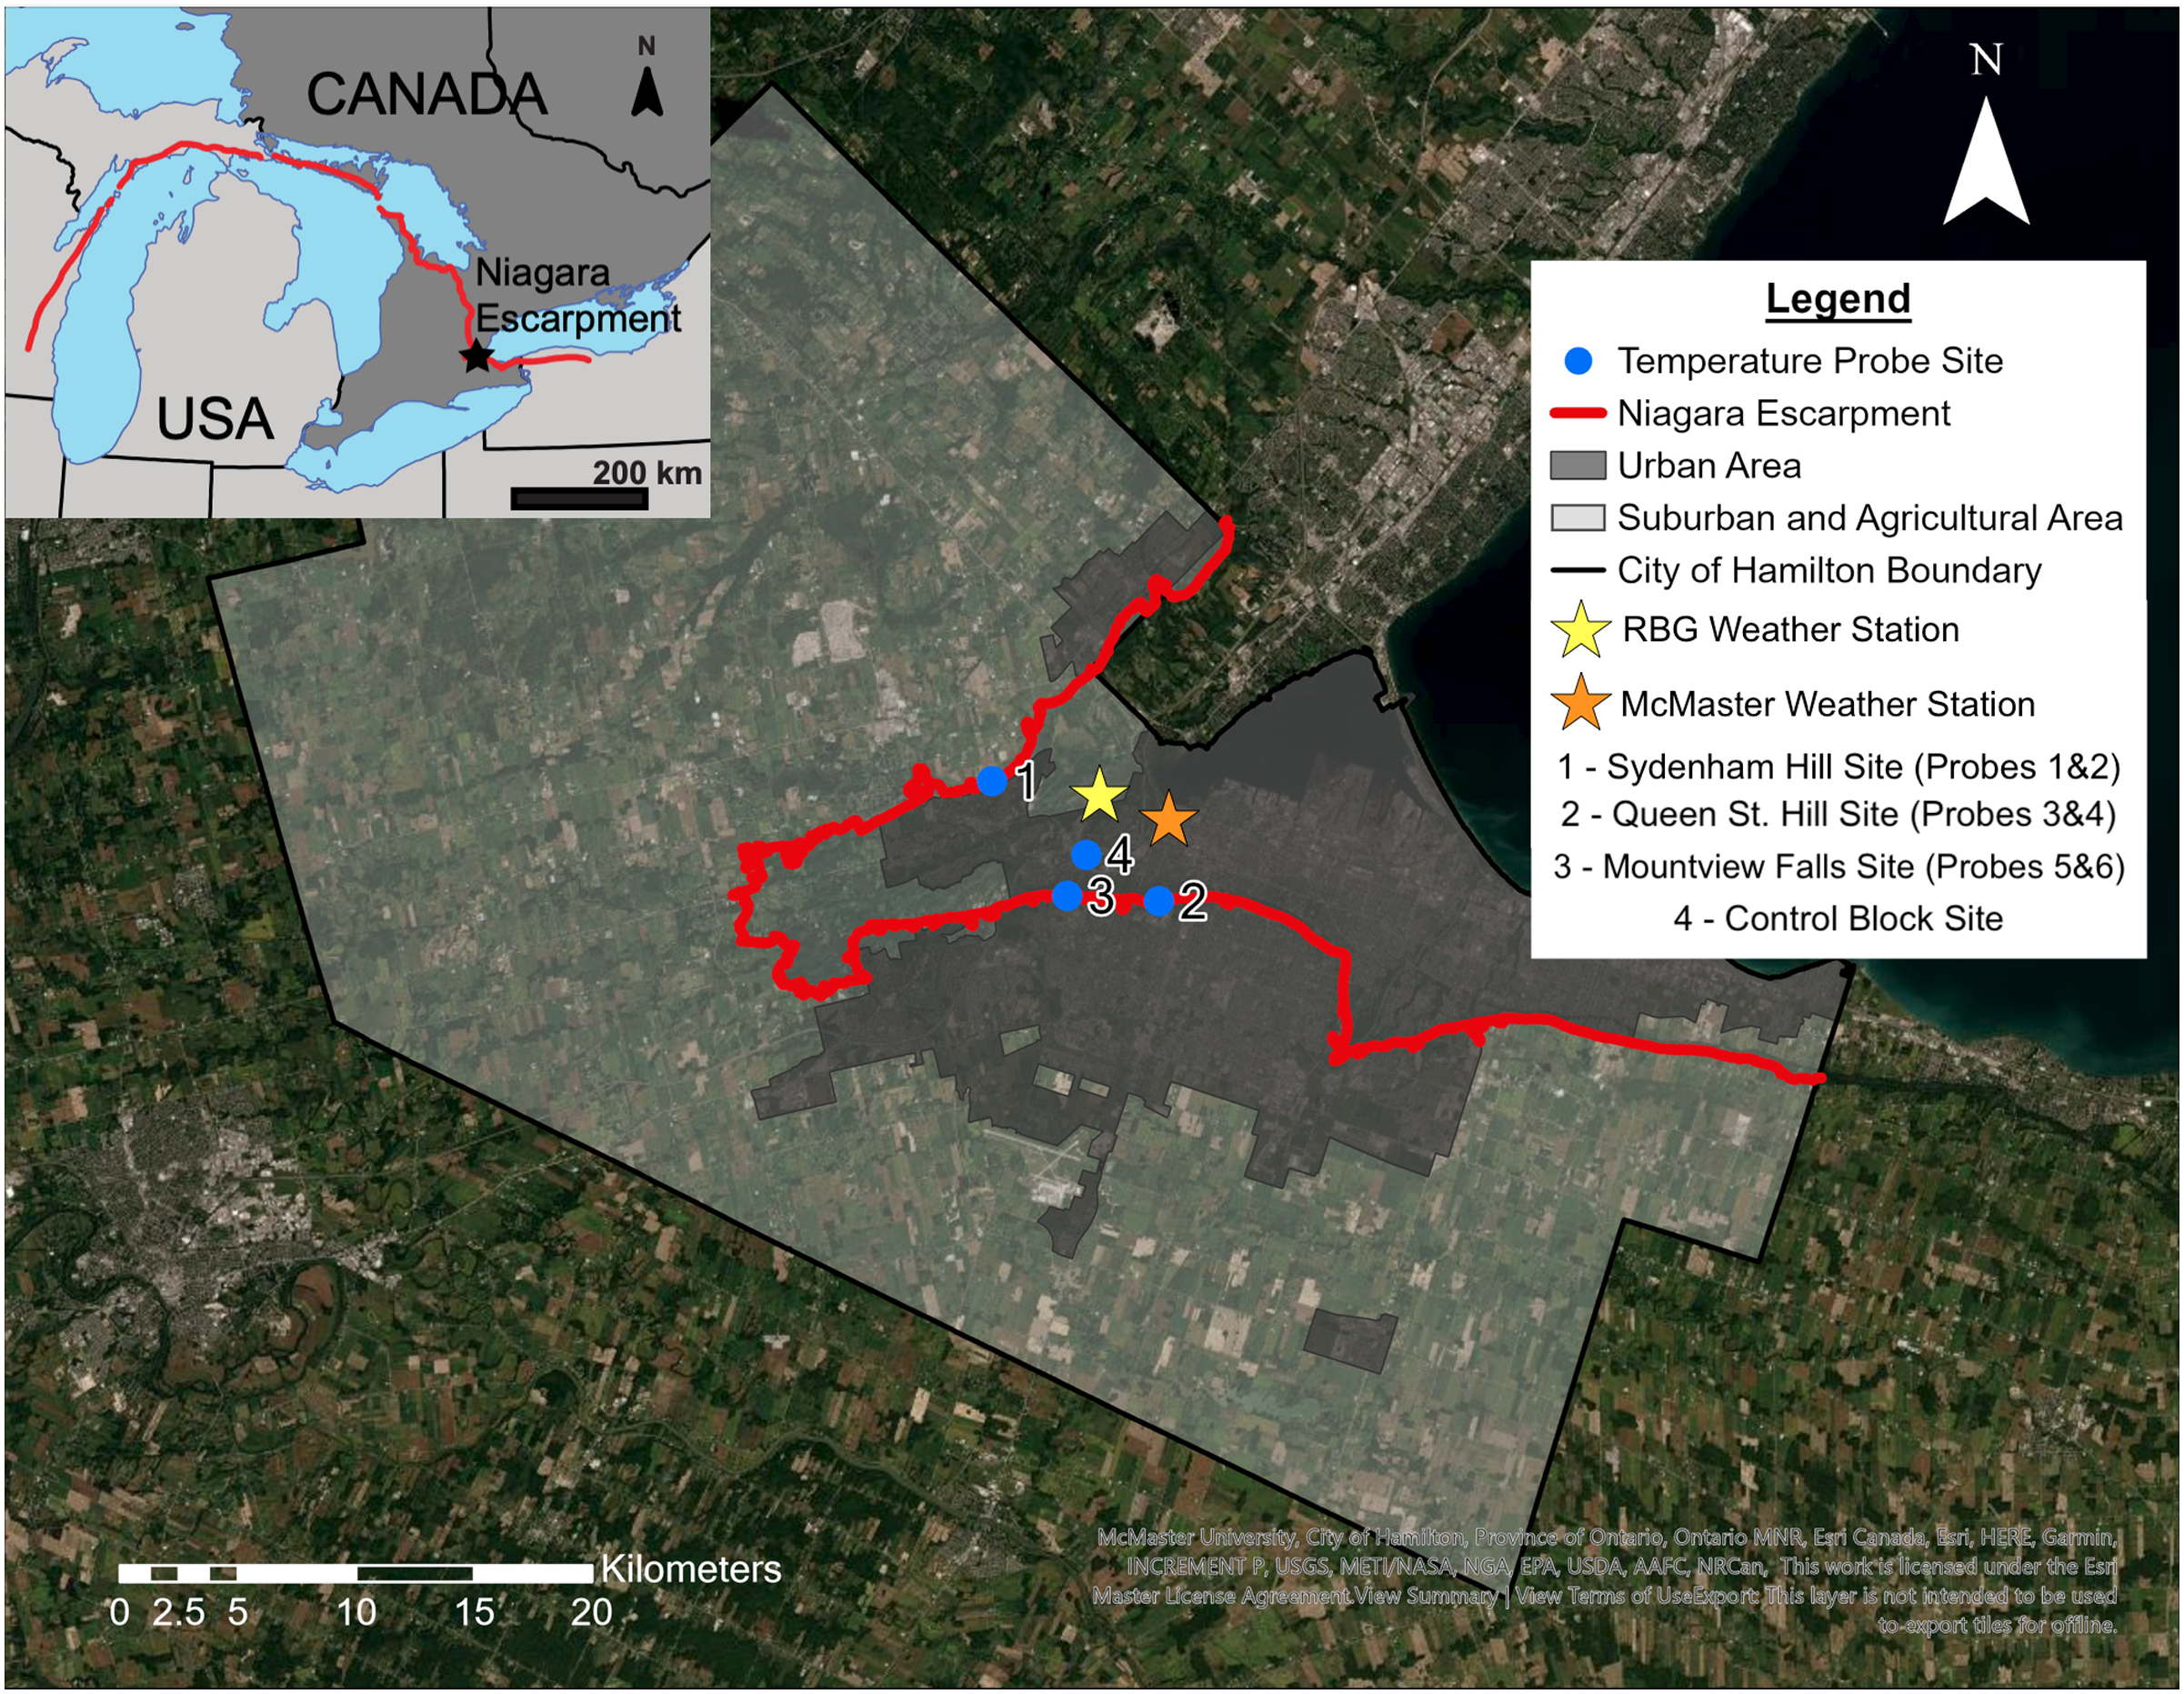
Locational context (a) and regional map (b) of study sites along the Niagara Escarpment (ESRI, 2022). Study sites indicated by numbered blue dots; location of the Niagara Escarpment in Hamilton shown by red line.
Left: Palaeozoic stratigraphy exposed along the Niagara Escarpment in the Hamilton region. Differential erosion of the scarp face results in undercutting of dolostone (blue) units by underlying shale (grey) units, the release of debris, and progressive retreat of the scarp face. Right: schematic depiction of the upper portion of the escarpment stratigraphy showing location of thermistor probes (numbered white dots) placed on surface rocks and in fractures. Red dashed lines indicate formation/unit boundaries.

The Niagara Escarpment traverses the city of Hamilton, a densely populated region of southern Ontario, with urban infrastructure abutting the escarpment edge and numerous roads traversing the rock face. Weathering of outcrops in this urban region has caused numerous rockfalls, resulting in major road closures and infrastructure damage (Mellies et al. Reference Mellies, Telesnicki and Sandoval2016; Formenti et al. Reference Formenti, Peace, Eyles, Lee and Waldron2022). The dolostones of the escarpment face are highly fractured and interbedded with shale units, producing steep overhangs due to differential erosion and undercutting (Hewitt, Reference Hewitt1971). This creates a high potential for failure events. The location of the escarpment in a temperate climatic zone characterized by cold winters and warm summers likely plays a significant role in weathering processes, fracture propagation and the frequency of rockfall.
Hamilton lies in a temperate climate zone (considered a hot-summer humid continental climate under the Köppen–Geiger classification system), with mean winter temperatures near −5 °C and above 20 °C in the summer (1981–2010; Government of Canada, 2013; Beck et al. Reference Beck, Zimmermann, McVicar, Vergopolan, Berg and Wood2018). On a diurnal scale, mean temperature oscillates between −9 °C and 0 °C in January and February, and −5 °C and 1–4 °C during December and March (1981–2010; Government of Canada, 2013). Precipitation is distributed evenly year-round, with mean monthly precipitation between 58 and 73 mm during the winter months. There are on average c. 46 days with snowfall between December and March (1981–2010; Government of Canada, 2013).
The experiments described here were conducted between December 2020 and March 2021. Air-temperature, precipitation and relative humidity measurements for this period were obtained from the McMaster Weather Station, operated by McMaster University (43° 15′ 42.9″ N, 79° 55′ 11.9″ W), and the Royal Botanical Gardens (RBG) Weather Station, operated by the Meteorological Service of Canada (43° 17′ 11.1″ N, 79° 54′ 18.78″ W; 144 m above sea level; Fig. 1). Relative humidity and precipitation recorded at the weather stations over the study period were high, with many days experiencing values above 80 % relative humidity; frequent precipitation events also contributed significantly to moisture availability.
4. Methodology
4.a. In situ measurements at study sites
Rock surface and fracture temperatures were recorded from 7 December 2020 to 7 March 2021, at three in situ outcrops along the Niagara Escarpment in Hamilton, Ontario. The study area lies within a populous urban section of the escarpment (Fig. 1). In situ measurements of rock surface and fracture temperatures were recorded in exposures of the Ancaster Member of the Goat Island Formation and the Gasport Formation at Sydenham Hill (probes 1 and 2) and Queen Street Hill (probes 3 and 4) respectively, and in the Rochester and Irondequoit formations at Mountview Falls (probes 5 and 6; Figs 1–3; Table 1). These sites were selected for study to provide quantitative data on temperature variability in lithological units with different physical properties (e.g. massive, and bedded dolostone, shale), vegetation cover, aspect and proximity to flowing water (Table 1).
Images of monitored in situ sites. (a) Looking NW at the SE-facing Sydenham Hill outcrop (site 1). (b) Looking W along the SE-facing Sydenham Hill outcrop (site 2). (c) Looking W at the E-facing Queen Street Hill outcrop (site 3). (d) Looking SW at the E-facing Queen Street Hill outcrop (site 4). (e) Looking SW (from below) along the E-facing Mountview Falls outcrop (site 5). (f) Looking along the W-facing rock face of Mountview Falls (site 6). Measuring-stick and extended tape measure (yellow) are 1 m long.

Description of in situ sites

* Strike and dip quoted using the right-hand rule.
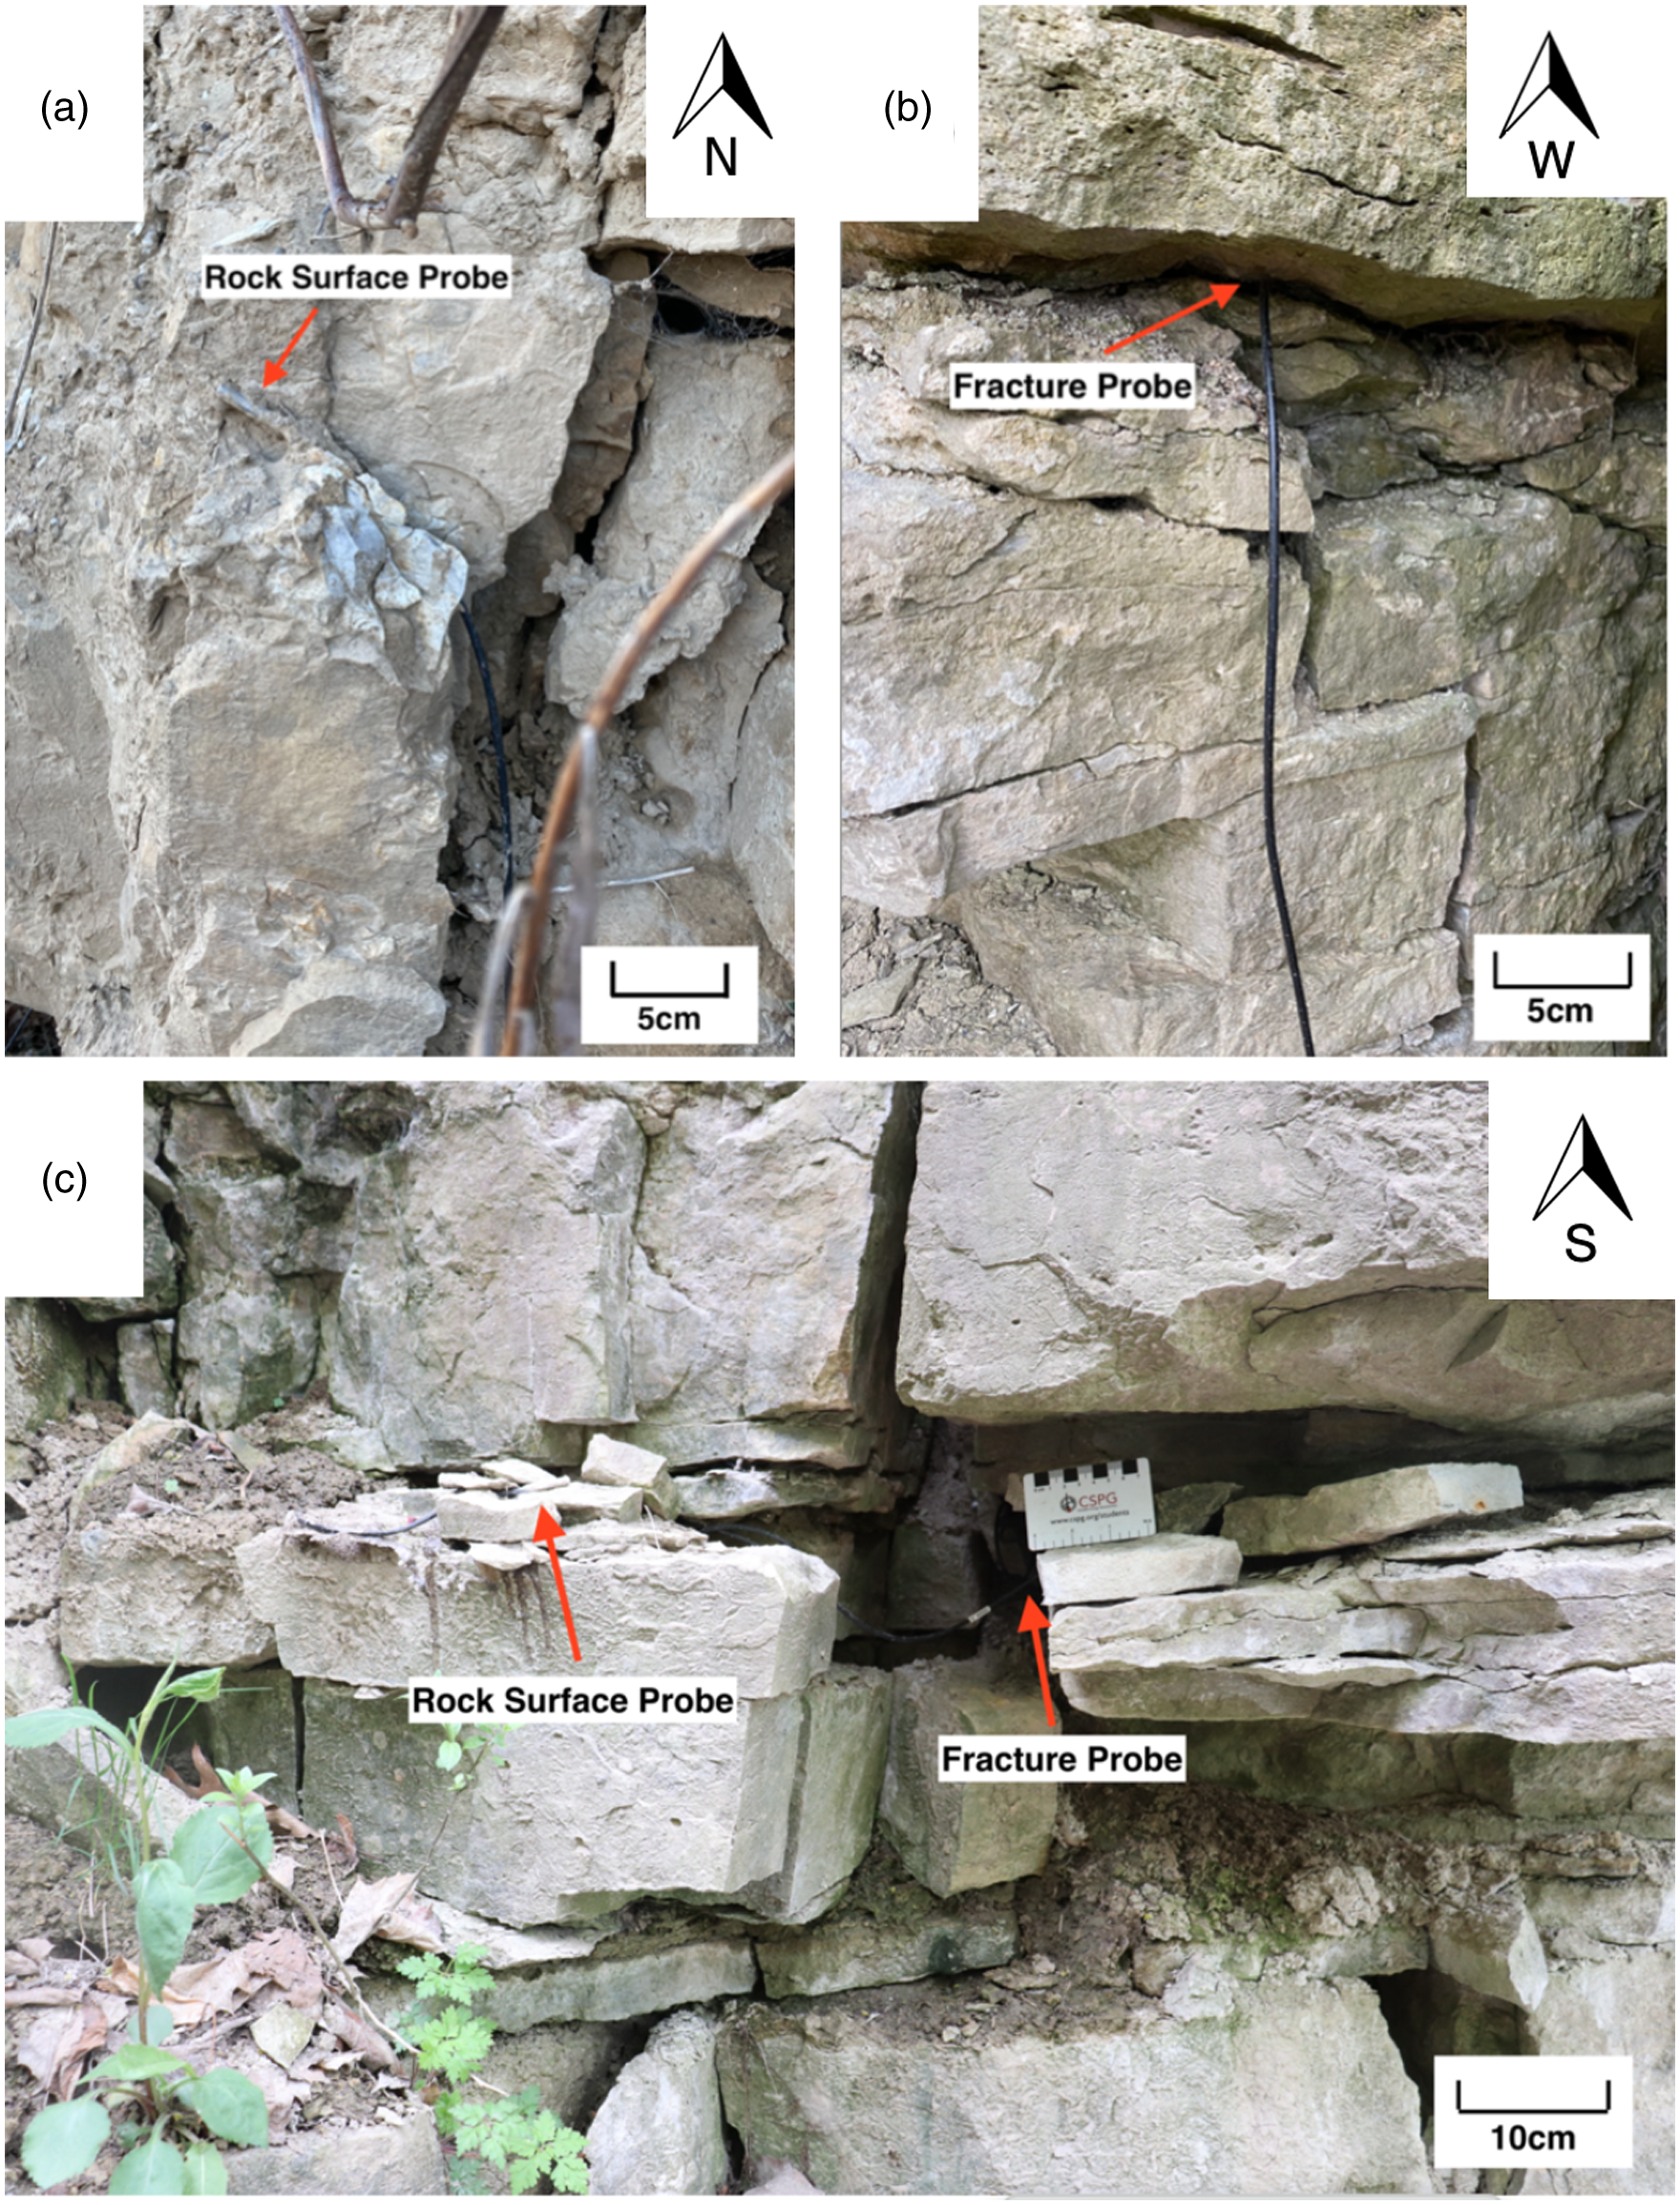
Temperatures were recorded using HOBO MX2303 Dual Thermistor Data Loggers (accuracy ±0.2 °C). Two sampling locations were instrumented at each study site; at each sampling location, one temperature probe was inserted into a pre-existing fracture at maximum depth (c. 20 cm at most sites) and one was affixed to the adjacent rock surface using a small amount of clear silicone gel applied away from the thermistor tip (Fig. 4; Table 1). Prior to installation, a thin layer of clear silicone gel was applied to the metal tip of each thermistor followed by a coating of rock dust obtained from samples of the Gasport dolostone. This served to minimize differences in radiative properties between the thermistor and rock surface. The sampling locations selected included fractures with a minimum aperture of 4 mm to ensure a thermistor could be inserted. Temperature was measured in 1 min increments from 7 December 2020, to 7 March 2021. This provides sufficient resolution to assess whether temperature changes are sufficient to generate thermal fatigue or shock in rocks exposed on the escarpment face. T-tests were used to compare the mean temperature ranges recorded by rock surface and fracture thermistors.
(a) Rock surface probe affixed to escarpment face in the Ancaster Member at the Sydenham Hill site. (b) Fracture probe inserted into a horizontal bedding fracture in the Gasport Formation at the Queen Street Hill site. (c) Experimental set-up at Mountview Falls site in the Irondequoit Formation.
4.b. Experimental measurement of temperature in dolostone blocks
To test the responses of different dolostone lithologies to temperature changes recorded on the rock surface and at predetermined depths in the rock interior, two dolostone blocks of the Ancaster Member of the Goat Island Formation and two of the Gasport Formation were obtained from recent rock spoil at the study sites (blocks 1–3; Table 2; Fig. 5). Blocks were c. 20 cm × 8 cm × 12 cm in size. The objective of this experiment was to evaluate the influence of lithological variability on conductive heat transfer and to provide a basis for comparison with thermal data obtained from the in situ sites.
Characteristics of dolostone blocks used for experimental study

Note:The blocks will hereby be referred to with their block number and formation name (e.g. ‘Gasport 1’).
Experimental set-up for dolostone control blocks maintained in outdoor conditions between December 2020 and March 2021. Thermistors were placed on the block surface and inserted into a borehole 8 cm deep within each block. Dolostones of the Gasport Formation are coarse-grained, fossiliferous and vuggy (block 1), whereas dolostones of the Ancaster Member of the Goat Island Formation (blocks 2 and 3) are relatively fine-grained and contain chert nodules.

A borehole was drilled to 8 cm depth at the centre of each sample block, and a thermistor was inserted into the borehole. The space between the thermistor wire and borehole was filled with a spray foam insulation to avoid convection of air into the rock interior. The second thermistor was affixed to the rock surface using a clear silicone gel far away from the probe tip. The same procedure as described above for the in situ measurement sites was used to coat the metal tips of each thermistor with dolostone rock dust. Temperature at the surface and interior of these blocks was measured concurrently with the in situ sites using HOBO MX2303 Dual Thermistor Data Loggers over the same time period, also in 1 min increments (e.g. Hall & André, Reference Hall and André2001; Hall, Reference Hall2004; Hœrlé, Reference Hœrlé2006; Eppes et al. Reference Eppes, Magi, Hallet, Delmelle, Mackenzie-Helnwein, Warren and Swami2016).
The blocks were maintained in an open outdoor environment with minimal shading (Fig. 5). One data logger failed during the study period and, as such, the data for the second Gasport dolostone block were omitted from the study. To compare the data collected from the in situ sites and control blocks to ambient weather conditions, air temperature, precipitation and relative humidity measurements were obtained from the nearby McMaster Weather Station, operated by McMaster University (43° 15′ 42.9″ N, 79° 55′ 11.9″ W), and the Royal Botanical Gardens Weather Station, operated by the Meteorological Service of Canada (43° 17′ 11.1″ N, 79° 54′ 18.78″ W; 144 m above sea level; Fig. 1).
4.c. Assessment of freeze–thaw cycles
We employed the freezing index (F i in units hours degrees, °C h) to delineate potentially effective freeze–thaw cycles. The freezing index combines frost duration and magnitude:
 $${F_i} = \Delta T \cdot t$$
where ΔT represents the mean frost amplitude in Celsius (i.e. the number of degrees below 0 °C) and t represents frost duration in hours. Here we use the term ‘potentially effective’ to reflect the fact that the freeze–thaw cycles identified by the index also require sufficient moisture once time–temperature conditions are met (F i > 12 °C h). A variety of other field studies have employed the index to identify freeze–thaw cycles in this regard (Matsuoka, Reference Matsuoka1994; Matsuoka & Sakai, Reference Matsuoka and Sakai1999; Binal, Reference Binal2009; Seto, Reference Seto2010).
The longest period of continuous temperatures meeting the freezing-index criterion is considered to be the longest sustained freeze–thaw cycle for a given site. The terms ‘prolonged’ and ‘sustained’ are used here to describe long periods of freezing followed by thawing; these freeze–thaw cycles are much longer than diurnal freeze–thaw cycles, but are not long enough to be considered ‘seasonal’ freeze–thaw cycles because they do not last the entire winter (Matsuoka, Reference Matsuoka2001).
5. Results
The temperature data gathered over the study period between 7 December 2020 and 7 March 2021 indicate that rock surface and fracture temperatures are related to diurnal and longer-term variations in air temperature (Figs 6–8) and are sufficient to generate both freeze–thaw and thermal weathering processes. All sampling locations recorded diurnal variations in temperature which follow ambient air temperature and downward radiation values recorded at nearby meteorological stations (Fig. 9).
Winter rock surface and fracture temperatures recorded at the Sydenham Hill site (probes 1 and 2). Sustained freeze–thaw period (solid black box) represents the longest period of continuous temperatures meeting the freezing-index criterion. Diurnal freeze–thaw period (area within dashed black lines) is determined by the first and last potentially effective freeze–thaw cycle observed within the study period.

Winter rock surface and fracture temperatures recorded at the Queen Street Hill site (probes 3 and 4). Sustained freeze–thaw period (solid black box) represents the longest period of continuous temperatures meeting the freezing-index criterion. Diurnal freeze–thaw period (area within dashed black lines) is determined by the first and last potentially effective freeze–thaw cycle observed within the study period.

Winter rock surface and fracture temperatures recorded at the Mountview Falls site (probes 5 and 6). Sustained freeze–thaw period (solid black box) represents the longest period of continuous temperatures meeting the freezing-index criterion. Diurnal freeze–thaw period (area within dashed black lines) is determined by the first and last potentially effective freeze–thaw cycle observed within the study period.

Moisture regime (precipitation – blue; relative humidity – red) and occurrence of potential freeze–thaw cycles recorded on the rock surface and in fractures at the Sydenham Hill site (probe 2). Relative humidity data were obtained from the McMaster Weather Station; precipitation data were obtained from the Royal Botanical Gardens Weather Station operated by the Meteorological Service of Canada.

5.a. Freeze–thaw
In situ sites: The thermistors placed in fractures and on rock surfaces at all three in situ sites (Sydenham Hill probes 1 and 2, Queen Street Hill probes 3 & 4 and Mountview Falls probes 5 and 6) recorded changing temperature regimes suitable for the operation of freeze–thaw processes during the months December 2020 through March 2021 (Figs 6–8). Rock surface and fracture temperatures showed both diurnal and prolonged oscillations about the zero-degree threshold throughout the winter (Figs 6–8). All thermistors recorded a period of sustained freeze–thaw, delineated by continuous subzero temperatures in the fracture and at the rock face, although each site recorded periods of different duration and timing (Table 3). The Sydenham Hill sites experienced short, sustained freeze–thaw cycles at the surface (2 days for both probes) and in the fracture (7 and 4 days for probes 1 and 2, respectively; Table 3). In contrast, probe 6 at Mountview Falls recorded 39 days of continuous below-zero temperatures at the surface and 30 days in the fracture (Table 3). A diurnal freeze–thaw period of c. 10 weeks, demarcated by the first and last potentially effective diurnal freeze–thaw cycle, was recorded between mid-December and early March (Figs 6–8; Table 3).
Length of seasonal freeze–thaw period and number of potentially effective freeze–thaw cycles in control blocks and at in situ sites

Note: Control blocks (grey): Gasport 1, Ancaster 2, Ancaster 3. In situ sites (white): Sydenham Hill, Queen Street Hill, Mountview Falls.
The number of potentially effective diurnal freeze–thaw cycles recorded by the rock surface and fracture thermistors was similar across sampling locations at the same study site (Figs 6–8; Table 3). At the Sydenham Hill sites, there was a significantly larger number of diurnal cycles recorded at the rock surface (43 and 44) than those at Queen Street Hill (16) and Mountview Falls (18 and 11; Table 3), which experienced a more sustained period of freezing lasting days to weeks. This difference in the number of freeze–thaw cycles recorded was much smaller for those recorded in the fractures (Table 3). The in situ site that experienced the greatest number of diurnal freeze–thaw cycles (Sydenham Hill) had the shortest sustained freeze–thaw period (Fig. 6; Table 3). The opposite is true for sites such as Mountview Falls that experienced few diurnal cycles (Fig. 8). The length of the sustained freeze–thaw cycle recorded in the fracture and at the rock surface was similar at sampling locations across all in situ sites (Table 3).
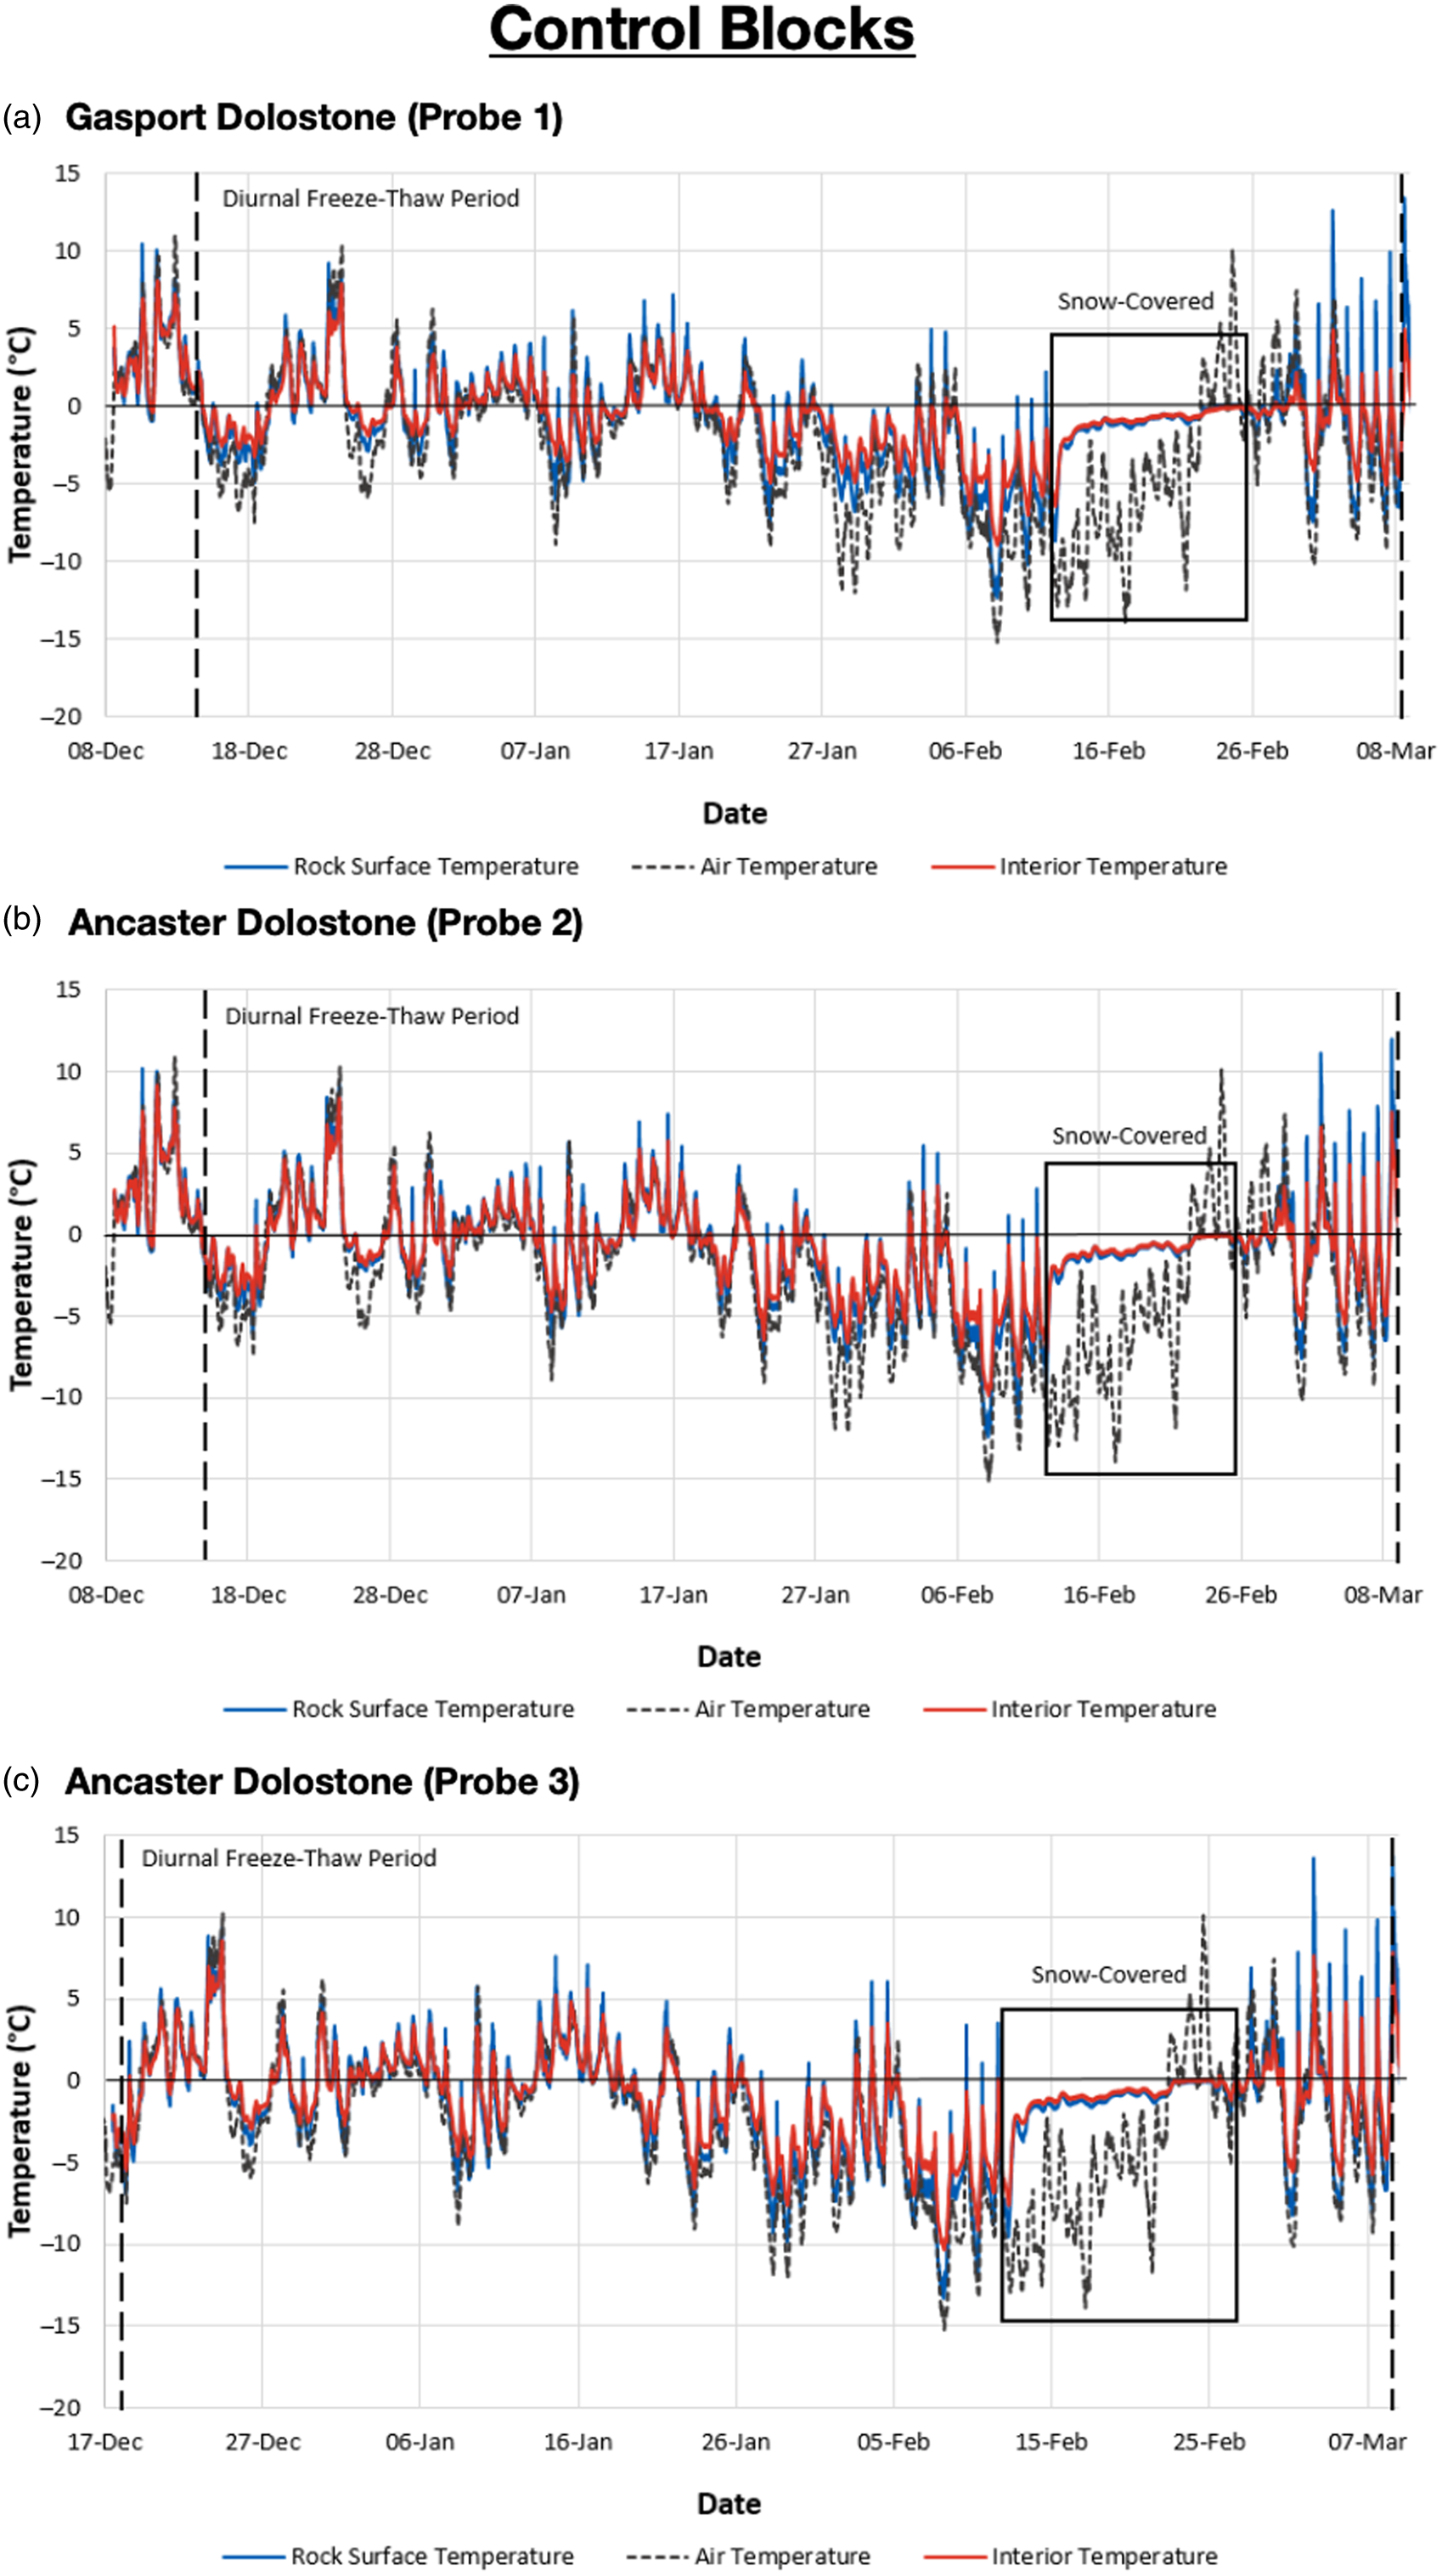
Control blocks: The number of diurnal freeze–thaw cycles recorded at the surface and interior of the control blocks was similar for both the Gasport block (32 cycles at surface and 20 interior cycles) and the Ancaster blocks (24 cycles at the surface for both blocks; 20 and 23 interior cycles for blocks 2 and 3, respectively; Fig. 10; Table 3). The period during which freeze–thaw cycles were recorded at the surface and interior of the blocks occurred between 20 January and 27 February 2021. Between 12 and 24 February 2021 the blocks were insulated by continuous snow cover which may have decoupled rock temperatures from atmospheric conditions, resulting in a period of sustained freezing (Fig. 10). Nevertheless, both blocks of the Ancaster Member recorded a longer sustained freeze–thaw period than the block of Gasport dolostone (Table 3). It is important to note that the sustained freeze–thaw cycle recorded between late January and mid-February at the Queen Street Hill and Mountview Falls sites was synchronous with a period of regular precipitation events and moderately high relative humidity recorded at nearby weather stations. Small precipitation events of 1 mm or less occurred on a near-diurnal basis, with infrequent large events exceeding 3 mm (Fig. 9).
Winter rock surface and interior temperatures recorded in the control blocks. Diurnal freeze–thaw period (area within dashed black lines) is determined by the first and last potentially effective freeze–thaw cycle observed within the study period. Solid black box illustrates period of continuous snow cover.
5.b. Thermal weathering
In situ sites: The number of events meeting the 1 °C min−1 temperature change criterion for thermal shock was relatively few across the Queen Street Hill and Mountview Falls sites (Fig. 11a). Periods of prolonged, rapid temperature change were only observed at the Sydenham Hill site. For instance, over a 30 min period on the morning of 11 February 2021, temperature changes at the rock face repeatedly exceeded 1 °C min−1. Temperatures recorded in fractures over the same period were relatively stable in comparison, with a maximum rate of change of 0.2 °C min−1 (Fig. 11b). In total, the thermal shock criterion was met in over 400 min on the rock face at the two monitored sites at Sydenham Hill. However, there were no instances of temperature change as rapid as 1 °C min−1 recorded in the fractures. All other in situ sites experienced one or fewer episodes in which temperature gradients met this threshold, both at the rock surface and in the fracture (Fig. 11a).
(a) Number of recorded minutes with sufficient temperature change to potentially induce thermal shock at the rock surface (blue) and in the fracture/interior (red). This study considers 1 °C min−1 to be the minimum rate of temperature change for thermal shock to potentially occur (Hall & Thorn, Reference Hall and Thorn2014). Aspect of escarpment face is provided in brackets for in situ sites. Areas annotated with a zero indicate that zero minutes meeting the criterion were observed. (b) Temperature changes at the Sydenham Hill site (probe 2) recorded over a 30 min period on 11 February 2021 between 10:09 AM and 10:39 AM EST, showing rapid temperature changes at the rock surface, with more stable temperatures recorded in the fracture. Note the numerous instances where ΔT/t at the rock surface exceeds 1 °C min−1.

Control blocks: The thermistors in the Gasport dolostone block recorded one instance of temperature change meeting the 1 °C min−1 criterion for thermal shock in the interior and none at the surface. In contrast, surface temperatures recorded on blocks of the Ancaster dolostone (blocks 2 and 3) experienced a total of 48 and 57 min that met the thermal shock criterion, respectively (Fig. 11a).
5.c. Surface-fracture and surface-interior dynamics
5.c.1. Diurnal oscillations in surface-fracture temperature gradient
The rock surface-fracture temperature gradient (and, in the sample blocks, the surface-interior temperature gradient) play an important role in controlling and mediating thermal stresses (Rempel et al. Reference Rempel, Marshall and Roering2016). The gradients reported here are negative when the fracture or interior temperatures are warmer than the rock surface and positive where the rock surface temperature is warmer than temperatures recorded in the fracture or block interior (Fig. 12).
(a) Mean difference in temperature between rock surface and interior in control blocks on an hourly scale throughout the study period (7 December 2020 to 7 March 2021). Positive values indicate that the rock surface is warmer than the interior; negative values indicate that the interior is warmer than the surface. Black line shows mean daily downward shortwave radiation values (from McMaster University Weather Station). (b) Mean difference in temperature between rock surface and fracture at in situ sites on an hourly scale throughout the study period (7 December 2020 to 7 March 2021). The aspect of the escarpment face is shown in brackets for each site. Positive values indicate that the rock surface is warmer than the fracture; negative values indicate that the fracture is warmer than the surface. Black line shows mean daily downward shortwave radiation values (from McMaster University Weather Station).

In situ sites: The surface-fracture temperature gradients recorded at in situ sites and in control blocks show similar diurnal trends (Fig. 12). At in situ sites, the fracture interior records warmer temperatures than the rock surface in the evening and early morning, whereas the rock surface warms significantly relative to the fracture interior during the day. This gradient reverses for a brief portion of the day near 2:00 PM when the fracture interior is about 0.5 °C warmer than the surface rock on average. The exception to this trend was at Mountview Falls (probe 6), which exhibited an inverse relationship and recorded rock surface temperatures on average 1 °C warmer than the temperatures within the fracture in the evening (Fig. 12b). The timing of these temperature gradient trends follows fluctuations in air temperature and insolation, with peak temperature gradients aligning with peak downward radiation values in the early afternoon. However, the maximum temperature gradients recorded at the Sydenham Hill site (probes 1 and 2; Fig. 12b) occur about 2 hours prior to the radiation peak.
Control blocks: In all control blocks, the temperature gradient between surface and the rock interior follows a similar diurnal trend (Fig. 12a). During the evening and early morning, the interior is warmer than the surface. The gradient is reversed during the day, reaching a peak near midday when the surface rock is significantly warmer than the interior. These trends follow increases in downward shortwave radiation that occur during the morning. However, the peak gradient between surface and fracture is reached prior to the radiation peak in the early afternoon (Fig. 12a).
The Gasport dolostone sample block exhibited much larger surface-interior temperature gradients over the study period, nearing 2 °C in either direction at midday and in the evening (probe 1; Fig. 12a). By contrast, the Ancaster dolostone blocks experienced surface-interior temperature gradients of less than 0.5 °C throughout the day, and peak gradients closely coincided with times of peak radiation (probes 2 and 3; Fig. 12a).
5.c.2. Temperature variability
In situ sites: Rock surface temperature recorded at in situ sites exhibits greater variability across seasonal and diurnal timescales than fracture temperature, with more frequent oscillations of higher magnitude (Figs 6–8). The mean temperature range recorded at the rock surface (M (mean) = 34.95 °C, SD (standard deviation) = 12.36 °C) and that recorded within fractures (M = 20.51 °C, SD = 6.88 °C) at the in situ sites over the study period are significantly different (t(5) = −2.4, p = 0.031; Fig. 13b). At Sydenham Hill (probe 1), the temperature range at the surface exceeded 50 °C, whereas it was c. 20 °C within the fracture (Fig. 13b). Both sampling locations at Sydenham Hill record a much greater range of surface-fracture temperature gradients than those at other in situ sites (Fig. 13c).
Temperature range and mean temperature observed at the rock surface (blue) and in the fracture/interior (red) of the control blocks (a) and at in situ sites (b). Range and mean difference in temperature observed between rock surface and fracture/interior in control blocks (red) and at in situ sites (blue) shown in (c). Positive values indicate that the surface was warmer than the fracture/interior; negative values indicate that the surface was cooler than the fracture/interior. Lines represent range between maximum and minimum observed temperature; points represent mean temperature over the study period.

There is also a difference in the incidence of rapid temperature changes recorded at the rock surface and within fractures. Rapid temperature changes of 1 °C min−1 or greater were only observed at the rock surface at the in situ sites (Fig. 11a). On one occasion (11 February 2021) over a 30 min period when rapid temperature changes were recorded at the rock surface, temperatures within the fracture remained comparatively stable (Fig. 11b).
Control blocks: The relationship between the surface and interior temperatures recorded varies according to the lithology of the control blocks. There is a very strong positive correlation between surface and interior temperatures in blocks of the Ancaster dolostone (r = 0.991). This relationship is also positive but weaker in blocks of the Gasport dolostone (r = 0.786). The Gasport dolostone experienced a greater range of surface temperatures, with a more restricted range of interior temperatures, whereas surface temperatures and interior temperatures exhibit a similar range in the Ancaster blocks (Fig. 13a).
The range in temperature gradients between the surface of the block and the interior also varied considerably among lithologies. The Gasport control block experienced a wide range of gradients (−11.0 °C to 19.1 °C) compared to the Ancaster samples (block 2, −2.83 °C to 6.10 °C; block 3, −3.43 °C to 8.07 °C (Fig. 13c).
5.c.3. Control blocks versus in situ sites
Only at the SE-facing Sydenham Hill sites, which receive high insolation, did the magnitude of the temperature gradient between the surface and fracture during the day exceed the gradient between the rock surface and interior in the control blocks (Fig. 12). In the evening, an inverse gradient occurs during which the fracture is warmer than the rock surface; this gradient is stronger than the gradient observed in the control blocks across all in situ sites (Fig. 12).
There are more significant extremes in the frequency of freeze–thaw cycles among the in situ sites. The control blocks experience a moderate-length (∼20 days) sustained freeze–thaw period, and a moderate number (20–32) of potentially effective diurnal freeze–thaw cycles (Table 3). Conversely, the in situ sites are dominated either by diurnal-scale or sustained freeze–thaw. The Sydenham Hill sites experienced many diurnal freeze–thaw cycles, yet a short sustained cycle, whereas the Queen Street Hill and Mountview Falls sites had few diurnal cycles but a long sustained freeze–thaw period. This is likely dependent on site-specific factors. A similar trend is observed in factors affecting the thermal weathering regime (Fig. 11a); the control blocks experienced a moderate frequency of temperature changes exceeding 1 °C min−1, whereas the in situ sites either displayed many (Sydenham Hill) or no (Queen Street Hill and Mountview Falls) instances of rapid temperature change.
5.d. Site-specific factors affecting temperature
5.d.1. Site aspect
The aspect of the escarpment face at each in situ site is expected to influence surface and fracture temperatures given that they are, in part, determined by insolation. We observed hysteresis in the mean daily surface and fracture temperatures recorded at in situ sites and in the control blocks (Fig. 14). Trends are similar across all four months of study but cannot be clearly resolved when the mean is taken over the entire study period. The temperature loops cluster based on aspect, even though there is great variance in other factors, such as lithology, vegetation cover and fracture orientation, among sites with the same aspect. The temperature gradient and range of surface temperatures are highest at the SE-facing in situ sites (Sydenham Hill) and low at the E- and W-facing sites (Mountview Falls and Queen Street Hill: Fig. 2; Table 1). The control blocks experience a moderate temperature range and gradient between surface and interior throughout the study period.
Mean hourly diurnal surface and fracture temperature in January 2021 across control blocks and in situ sites. Icon size represents the time of day; the smallest icon represents 12 AM EST while the largest icon represents 11 PM EST.

5.d.2. Fracture aperture
Probes were inserted into fractures with very different apertures at the Queen Street Hill site (Table 1). The Queen Street Hill probes were located in positions with similar aspect, but the two instrumented fractures have apertures of 70.0 mm and 4.1 mm, respectively (Table 1). These fractures were specifically selected for monitoring to identify any effect that fracture aperture may have on temperature. Despite the significant difference in fracture aperture, the relationship between fracture temperature and air temperature is very similar between the two sets of probes. Fracture temperature at both sites is strongly correlated with air temperature (probe 2, r = 0.847; probe 3, r = 0.802).
6. Discussion
6.a. Site-specific factors affecting weathering
The in situ sampling locations we examined were selected to identify the influences of lithology, aspect and fracture aperture on temperatures recorded on the rock surface and in adjacent fractures on the Niagara Escarpment in Hamilton (Table 1; Figs 2, 3). These factors are likely to influence the effect of temperature fluctuations on weathering processes, as well as the temporal and spatial scales at which they occur. It is important to note that there are a multitude of factors not considered in this study, including vegetation coverage, water seepage and biological and chemical processes, which may contribute to weathering on the escarpment (Fahey & Lefebure, Reference Fahey and Lefebure1988; Chen et al. Reference Chen, Blume and Beyer2000; Etienne, Reference Etienne2002; Dixon & Thorn, Reference Dixon and Thorn2005; Hasenmueller et al. Reference Hasenmueller, Gu, Weitzman, Adams, Stinchcomb, Eissenstat, Drohan, Brantley and Kaye2017). Further work should examine a wider array of aspects, apertures and lithologies, along a more continuous spectrum, in addition to those factors not examined here. We elucidate the potential effects of a subset of these factors by comparing sites which are similar across all characteristics except for the factor of interest.
6.a.1. Lithology
Lithology plays an important role in weathering because it dictates rock strength (Walder & Hallet, Reference Walder and Hallet1985; Eppes & Keanini, Reference Eppes and Keanini2017) as well as the presence of moisture and distribution of temperature in the rock, both prerequisites for weathering (Hales & Roering, Reference Hales and Roering2007). Thermomechanical properties of rock are of importance to freeze–thaw, thermal shock and thermal fatigue processes as they control the transmission of heat through the rock and the potential for failure or fracture propagation once stress has been produced (Hall, Reference Hall1999; Hall et al. Reference Hall, Thorn, Matsuoka and Prick2002). These properties vary between lithological units and are not equally distributed within an exposed rockwall or individual clast. Abrupt changes in lithological properties enhance gradients of temperature and stress, and fractures may act as loci for ice segregation and can provide planes of weakness along which failure occurs (Hales & Roering, Reference Hales and Roering2007).
The data collected in this study from in situ and control block thermistor probes indicate that lithological characteristics do affect the distribution of temperatures within a rock body. The probes inserted into control blocks of the Ancaster Member and Gasport Formation show different responses to changing temperatures (e.g. Fig. 12a); probes on the Gasport block recorded a greater range of surface temperatures than those on the Ancaster blocks. The Ancaster and Gasport are both dolostones but the Gasport dolostone is coarse-grained, fossiliferous and vuggy, whereas the finer-grained Ancaster dolostone often contains chert inclusions (Carter et al. Reference Carter, Brunton, Clark, Fortner, Freckelton, Logan, Russell, Somers, Sutherland and Yeung2019). These features may alter the transmission of temperature and/or moisture through the blocks we examined.
Differences in lithology play an important role in the evolution of the escarpment face as erosion-resistant dolostone units (e.g. Gasport Formation) are undercut by more easily eroded shales (e.g. Rochester Formation). Our results suggest that even lithological differences between dolostone units can enhance or reduce freeze–thaw and thermal weathering rates and may therefore contribute to escarpment evolution. Differences in the magnitude of the surface-interior temperature gradient and the range of surface and interior temperatures recorded here in experimental blocks of Gasport and Ancaster dolostones are likely to affect the development of stress in the rock. Our observations that the Gasport dolostone experienced a greater range of surface temperatures than the Ancaster dolostone over the study period will likely result in the promotion of enhanced subcritical cracking in the Gasport (Meredith & Atkinson, Reference Meredith and Atkinson1983).
6.a.2. Site aspect
Site aspect has significant implications for weathering processes (Hall & André, Reference Hall and André2001; McFadden et al. Reference McFadden, Eppes, Gillespie and Hallet2005; Eppes et al. Reference Eppes, Magi, Hallet, Delmelle, Mackenzie-Helnwein, Warren and Swami2016). The SE-facing Sydenham Hill sites were the only in situ sites to experience a significant number of rapid temperature changes (>400 over the study period) meeting the 1 °C thermal shock criterion (Fig. 11). In comparison, the E- and W-facing sites experienced few to no instances of rapid temperature change at the rock surface or in the fracture (Fig. 11a). This suggests that the strong influence of insolation on SE-facing sites may drive rapid warming and produce the conditions necessary for thermal shock and fatigue to occur.
Our data also suggest that aspect may influence the nature of freeze–thaw cycles. The SE-facing Sydenham Hill sites experienced about three times the number of potentially effective diurnal freeze–thaw cycles, and a sustained freeze–thaw cycle near ten times shorter than the E- and W-facing Mountview Falls and Queen Street Hill locations (Table 3). Strong insolation and rapid warming at SE-facing sites may inhibit the maintenance of subzero temperatures responsible for a sustained freeze–thaw cycle. This difference in periodicity may influence the spatial scale of weathering (‘macrogelivation’ versus ‘microgelivation’; Matsuoka, Reference Matsuoka2001). Matsuoka (Reference Matsuoka2008) found that short-term freeze–thaw cycles occur in the uppermost portion of exposed rockwalls and are too short to facilitate the accumulation of ice into lenses but result in the production of small-scale fractures and surficial shattering. Sustained freezing feeds ice segregation lenses over time, producing macrofractures and dislocating larger blocks (Matsuoka, Reference Matsuoka2008). Ultimately, this implies that fracture width and debris size may be smaller at the Sydenham Hill sites, where there are short freeze–thaw cycles, and larger at the Queen Street Hill and Mountview Falls locations which experience prolonged periods of freezing.
Differences in aspect further impact weathering processes by modifying the amount of moisture at a site. South-facing sites which receive more insolation dry more quickly and tend to have lower moisture than north-facing sites (Sass, Reference Sass2005; Rode et al. Reference Rode, Schnepfleitner and Sass2016). This has implications for weathering processes and intensity as lower moisture favours the ice segregation mechanism of freeze–thaw weathering (Matsuoka, Reference Matsuoka2001; Rode et al. Reference Rode, Schnepfleitner and Sass2016). Unfortunately, we cannot validate this finding here as we were unable to collect data on the moisture content of rocks at the in situ sites over the study period and were limited to precipitation and relative humidity data obtained from a nearby meteorological station (Fig. 9). Future research should explore the role of moisture content at in situ sites with different aspects to improve our understanding of moisture dynamics and its role in the weathering process.
6.a.3. Fracture aperture
The temperatures recorded by Queen Street Hill probes, which are inserted into two fractures with very different apertures (70.0 mm and 4.10 mm; Table 1), are similar and correlate significantly with changing air temperature. The a priori explanation for this relationship would be that heat is transferred from warm air into the fracture via convection. It would therefore follow that a larger fracture aperture would facilitate greater convection and result in a stronger difference between rock temperature and fracture temperature as conduction and convection differ.
However, our data do not show a particularly strong variation in temperature with aperture. We found similar gradients (on both a cyclical diurnal basis and in mean values over the study period) for sampling locations with different fracture apertures at the same site. The Queen Street Hill probes experienced similar-length sustained freeze–thaw periods (34 and 30 days at the surface, 31 and 27 days in the fracture), number of diurnal freeze–thaw cycles (e.g. 16 in rock surface for both sampling locations) and the same number of minutes meeting the thermal shock criterion (zero), despite the significant difference in aperture (Table 3). This may indicate that the relationship is more complex, for example that a wider aperture possesses a shorter lag time between changes in air and fracture temperature. The result could also imply that the strength of the correlation may only shift slightly among apertures beyond a critical threshold.
Overall, our data suggest that in situ temperature gradients are impacted by a variety of site-specific factors beyond fracture aperture. The impact of this finding on the mechanism and extent of weathering experienced by fractured rocks may be most apparent between lithologies with different fracture densities (e.g. the highly fractured, cherty Ancaster Member versus the massively bedded Irondequoit Fm. which has few fractures) or between locations with differences in fracture characteristics caused by aspect or vegetation growth (Ellis, Reference Ellis2022). These possibilities could be elucidated by examining a more continuous range of fracture apertures under similar site-specific factors.
6.b. Temperature cyclicity
Diurnal cyclicity was observed in temperatures recorded in both surface rocks and fractures across all in situ sites, and at the surface and interior of the control blocks (Fig. 14). At the S-facing Sydenham Hill sites, the size of diurnal thermal cycles is large, with an amplitude near 7 °C at the surface and 4 °C in the fracture. The E- and W-facing Queen Street Hill and Mountview Falls sites experience smaller temperature oscillations of c. 2 °C at the surface and 1 °C in the fracture (Fig. 14). This reinforces the assertion that aspect has a large influence on temperature regime and surface-fracture dynamics (Hall, Reference Hall1997, Reference Hall1998).
Moreover, there is strong reversal of the surface-fracture temperature gradient between day and night (Figs 12, 14). These gradients are ostensibly created by the radiative and conductive heat transfer that occurs from the exposed rock face. During the day, the rock surface is heated by incident radiation and ambient temperature relative to the fracture interior. The fact that the fracture is warmer than the surface at night may be due to a temporal lag as heat is conducted from the surface to the fracture, or because the interior of the fracture is insulated from changes in air temperature and wind in the evening which cool the rock surface. This suggests that weathering may be enhanced in rock with pre-existing fractures because there is a change in the direction of thermal gradients at such discontinuities.
The diurnal thermal cycles recorded in this study at the rock surface and within fractures play a significant role in weathering by shifting the direction and magnitude of thermal stress over time. Our findings align with those of Draebing (2021) who observed diurnal and monthly temperature cycles in rockwalls of the Alps and documented thermally induced deformation related to crack propagation as rock contracts during cooling and expands during warming. Similarly, Collins and Stock (Reference Collins and Stock2016) observed diurnal temperature cycles in fractured rock near 20 °C which were associated with oscillations in daily deformation. These studies suggest that the diurnal temperature cycles recorded at our in situ sites may be responsible for increasing and decreasing fracture aperture on a daily basis, producing thermal stress which can facilitate subcritical crack growth and enhance weathering of the escarpment face.
6.c. The role of fractures in weathering
It is well established that pre-existing fractures can exacerbate weathering because they participate in freeze–thaw processes (e.g. ice segregation) and act as planes of weakness along which stress can be propagated and failure can occur (Nicholson & Nicholson, Reference Nicholson and Nicholson2000; Hales & Roering, Reference Hales and Roering2007). Our evidence suggests that the variation in conditions between the surface and fracture may also control freeze–thaw and thermal weathering processes.
We observed that fractures experience significantly less temperature variability than the rock surface, even when the surface is experiencing rapid temperature changes greater than 1 °C min−1 (Fig. 11b). This may increase the amount of stress experienced through the entire body of rock because the temperature gradient (and consequently the gradient of thermal stress) from surface to fracture shifts in strength and orientation on a minute-by-minute basis (Hall & André, Reference Hall and André2001; Hœrlé, Reference Hœrlé2006). Moreover, we found that a reversal of the temperature gradient between surface and fracture occurs between night and day (Figs 12, 14). This would superimpose a diurnal oscillation in the stress gradients that originate from thermal processes on the minute-scale changes we observed during instances of rapid temperature change. Ultimately the rock undergoes expansion and contraction during heating–cooling cycles which vary spatially at different temporal scales (Eppes et al. Reference Eppes, Magi, Hallet, Delmelle, Mackenzie-Helnwein, Warren and Swami2016). These volumetric changes are the operative mechanism for thermal fatigue and thermal shock (Hall, Reference Hall1999).
Variations in temperature between surface rocks and fractures also have implications for the freeze–thaw regime. Warming of the surface establishes a temperature gradient through the rock which, at a given time, might initiate thawing of water in pore spaces near the surface and freezing near the fracture where the temperature remains cool (Deprez et al. Reference Deprez, De Kock, De Schutter and Cnudde2020). As the day progresses and the gradient begins to reverse, the spatial distribution of freezing and thawing may shift, driving changes in the magnitude and orientation of stress produced by the volumetric expansion of pore water (Hœrlé, Reference Hœrlé2006). Rempel et al. (Reference Rempel, Marshall and Roering2016) emphasized that temperature controls ice segregation by determining the strength of liquid pressure gradients; the direction of the temperature gradient drives water redistribution in pores toward or away from growing ice lenses. This implies that diurnal changes in the direction of the surface-fracture temperature gradient would be integral to the growth or depletion of ice lenses. Ultimately, these observations suggest that cycles of heating and cooling at the rock face alter surface-fracture gradients in temperature, pressure and stress which determine the likelihood of weathering by thermal or freeze–thaw processes.
Comparing the temperature records from control blocks and the in situ rockwalls indicates that site-specific factors play a significant role in moderating surface-fracture dynamics. For instance, differences in aspect and lithology between in situ sites can shift the surface-fracture dynamics to favour larger temperature gradients over short-term scales (e.g. Sydenham Hill sites), or toward smaller temperature gradients over longer-term scales (e.g. Queen Street Hill sites). This may influence the role of pre-existing fractures in weathering processes by changing the frequency and duration of ice segregation (higher variability means less consistent ice lens growth), and by altering gradients of stress between the surface and fracture whose magnitude and orientation may facilitate fracture propagation or failure.
6.d. Implications for weathering processes
We found that the Sydenham Hill in situ monitoring sites were characterized by frequent temperature oscillations, with many potentially effective diurnal freeze–thaw cycles and a short sustained freezing period. This favours shallow and rapid microgelivation, with repeated thermal cycles that promote subcritical crack growth. Conversely, the Queen Street Hill and Mountview Falls sites were characterized by sustained freeze–thaw cycles with relatively few diurnal oscillations. This may facilitate deeper penetration of freeze–thaw processes, allowing large ice lenses to accumulate throughout the winter (Matsuoka, Reference Matsuoka2008). These findings are ostensibly linked to differences in aspect and lithology between in situ sites (Fig. 15; Table 1).
Conceptual diagram illustrating the diurnal reversal of temperature gradients between the rock surface and fracture (a) and the relationship between in situ site characteristics and the potential for weathering processes to occur (b). (a) During the day, insolation warms the rock surface to higher temperatures than those in the fracture/interior in both the in situ sites and control blocks. This temperature gradient is reversed in the evening, when surface cooling reduces the surface temperature relative to the more insulated fracture (in situ sites) or interior (control blocks). (b) At the Sydenham Hill sites, the S-facing aspect results in strong insolation, increasing the magnitude of the thermal gradient between rock surface and fracture. The Ancaster dolostone at these sites experiences high thermal variability suitable for thermal weathering and diurnal-scale freeze–thaw. The Queen Street Hill and Mountview Falls sites likely receive less insolation due to their aspect; this reduces temperature fluctuations and prolongs the sustained freeze–thaw cycle.
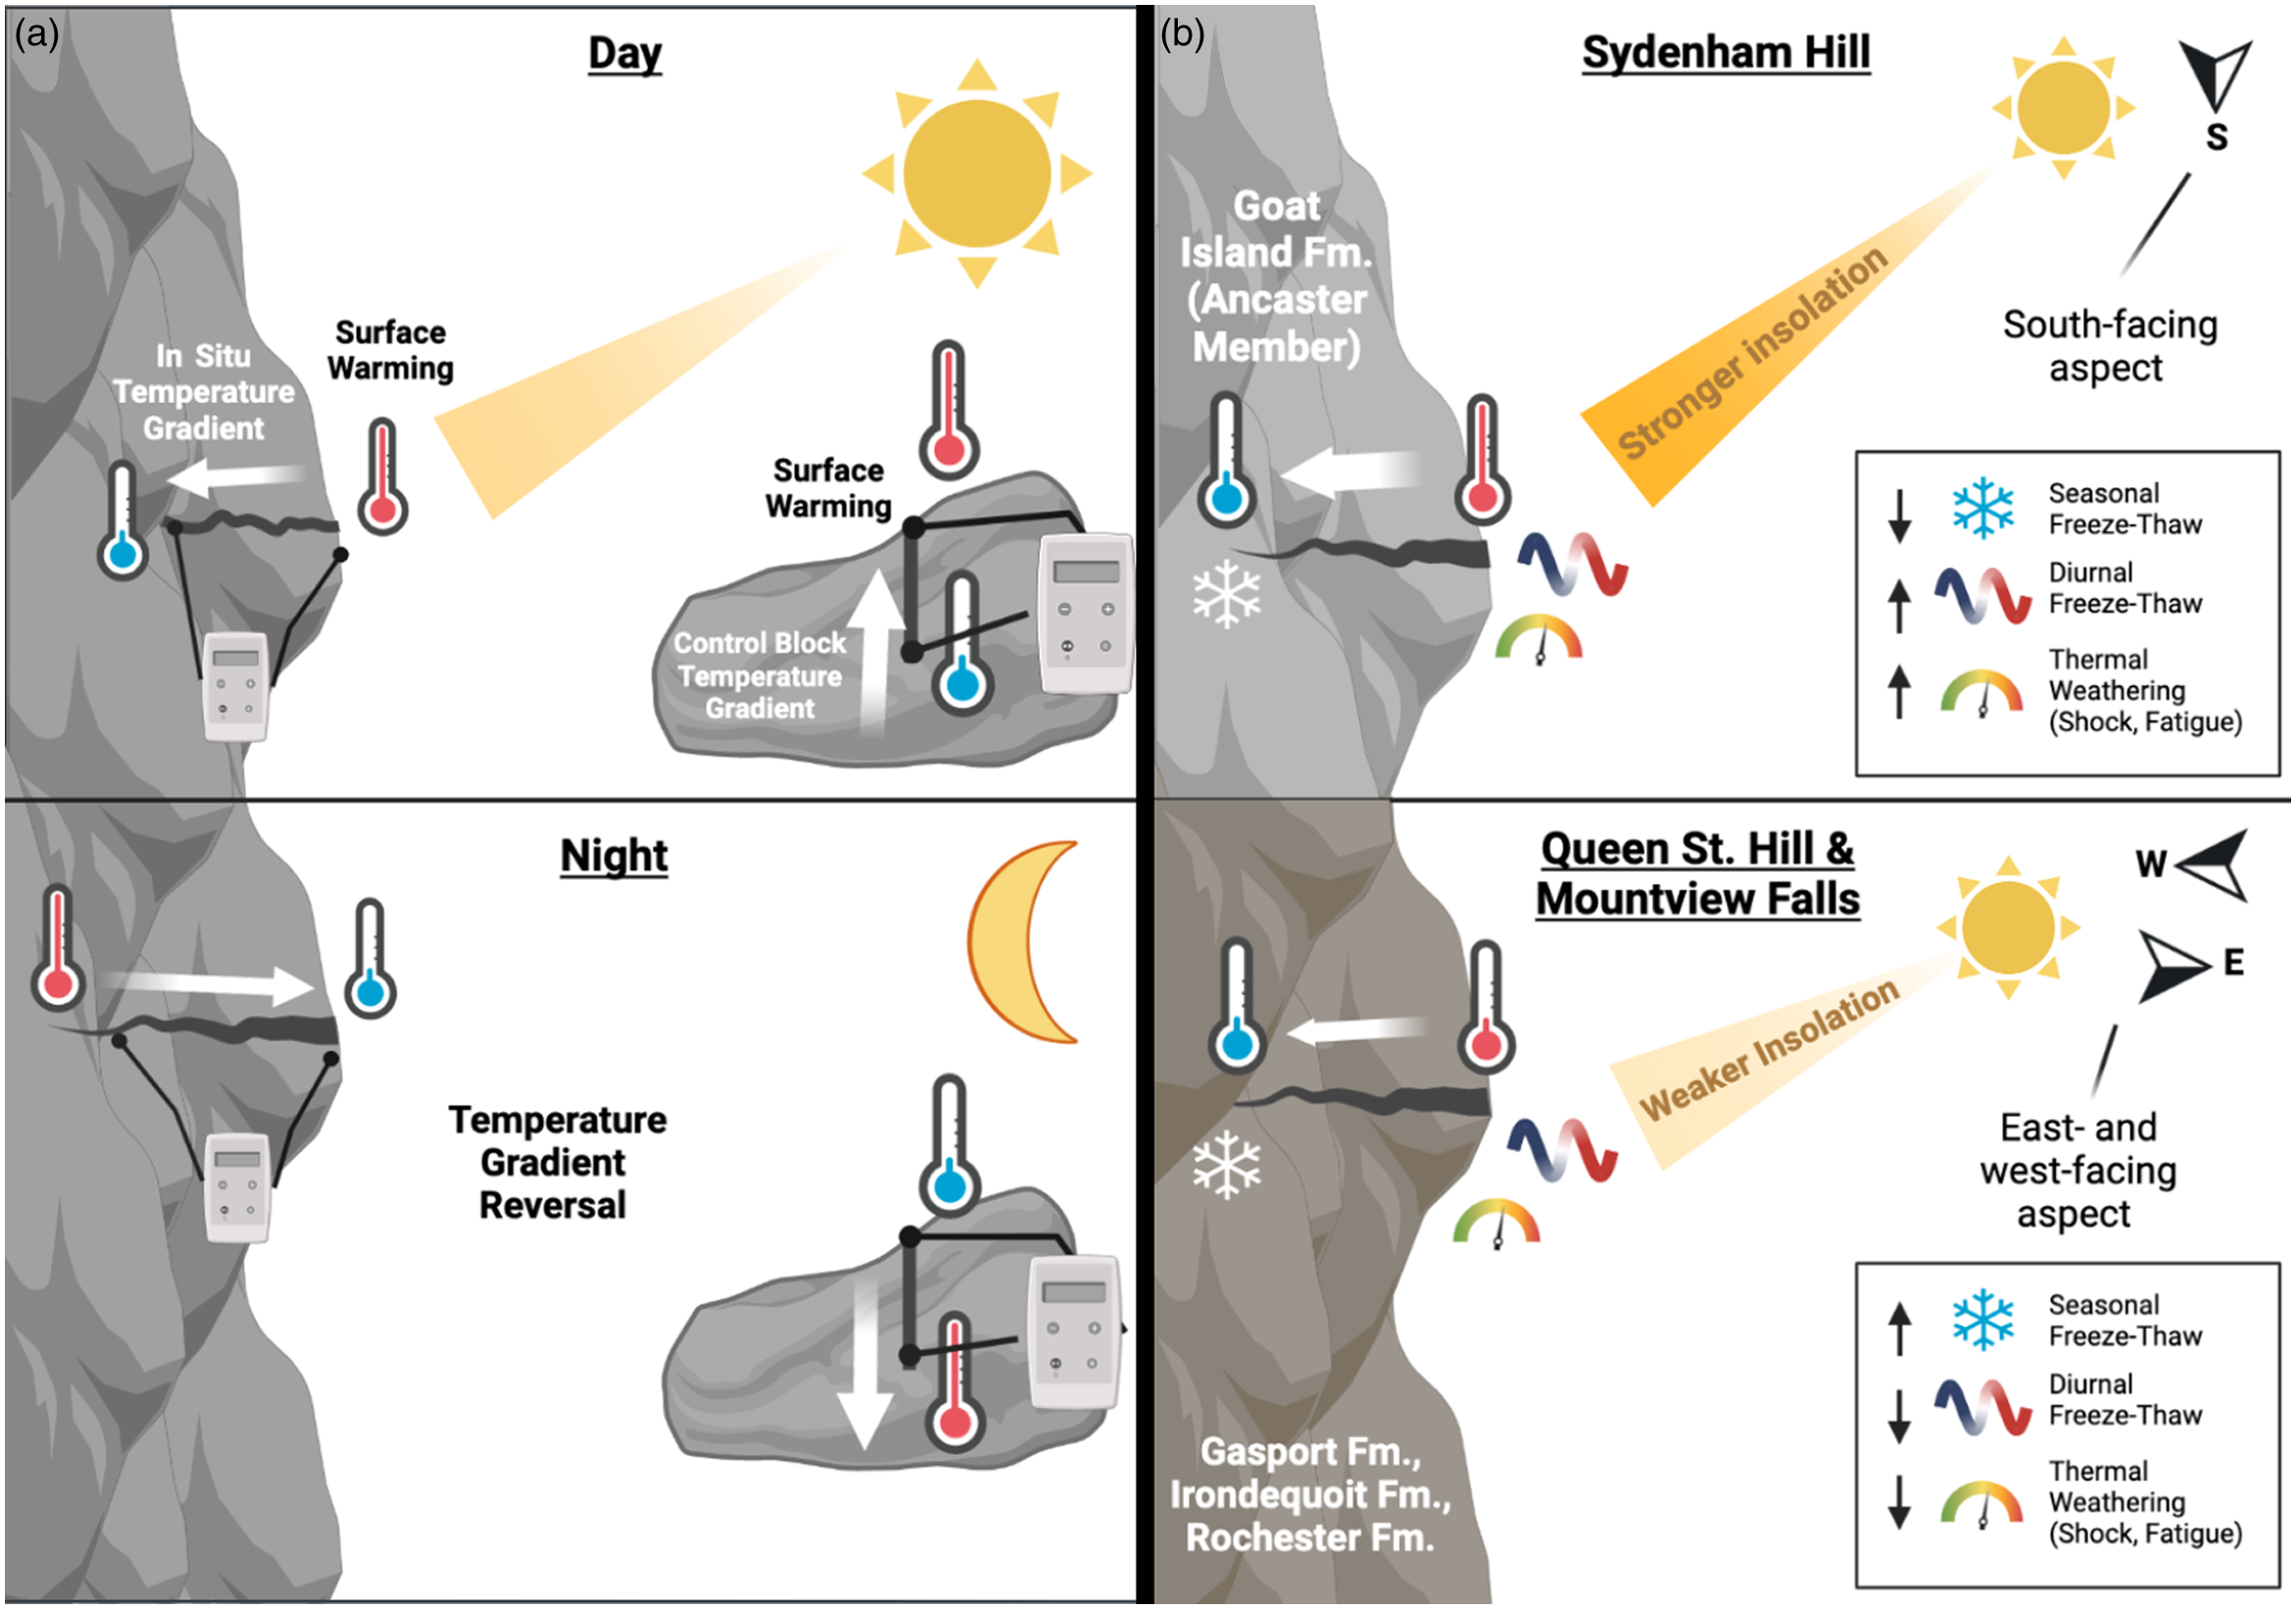
The Sydenham Hill sampling locations experienced significant temperature changes capable of inducing thermal shock throughout the study period, while few meeting the thermal shock criterion were observed at the Queen Street Hill and Mountview Falls sites. We attribute these trends to differences in insolation driven by the aspect of each site: the SE-facing Sydenham Hill sites experience more intense insolation than the E- and W-facing rockwalls at Queen Street Hill and Mountview Falls. This illustrates the plausibility of thermal weathering mechanisms operating, particularly at sites with S-facing aspects, in exposed outcrops of the escarpment. Our findings align with many authors who have observed higher weathering intensities on rockwalls that receive strong insolation (Hall & André, Reference Hall and André2001; McFadden et al. Reference McFadden, Eppes, Gillespie and Hallet2005; Eppes et al., Reference Eppes, McFadden, Wegmann and Scuderi2010; Draebing & Mayer, Reference Draebing and Mayer2021). Recognizing the potential for thermal weathering on the Niagara Escarpment in Hamilton advances our understanding beyond the work of Fahey and Lefebure (Reference Fahey and Lefebure1988), which solely examined freeze–thaw processes and concluded that shallow frost wedging is the primary mechanism of weathering.
It is important to note that the criterion of 1 °C min−1 temperature change used in this study to identify conditions conducive to thermal shock is less conservative than some experimental and field-based estimates (Hall & Thorn, Reference Hall and Thorn2014). There is little consensus as to the temperature conditions required for in situ thermal shock; authors have suggested values ranging from 1 °C min−1 (MacBeth & Schuett, Reference MacBeth and Schuett2007) to 2 °C min−1 (Richter & Simmons, Reference Richter and Simmons1974; Ferrero & Marini, Reference Ferrero and Marini2001), to greater than 10 °C min−1 (Peng et al. Reference Peng, Bian, Guo, Zhao, Peng and Jiang2008). Hall and Thorn (Reference Hall and Thorn2014) reviewed the thermal shock literature and determined 1 °C min−1 to be the lowest boundary for thermal shock to occur, with >2 °C min−1 as a reasonable estimate. For this reason, our data may overestimate the frequency of potential thermal shock events. Nevertheless, the results are useful because they confirm the presence of rapid temperature changes in rockwalls of the escarpment and provide a basis on which to make comparisons between study locations with different site characteristics.
Research on weathering in cold regions is often conducted in arctic and alpine environments. To the authors’ knowledge, this study is one of few to examine in situ freeze–thaw and thermal weathering processes in an urban temperate environment. While our data demonstrate that the interplay between weathering processes is context-dependent, the findings are more broadly applicable given that the underlying mechanisms are present across cold regions.
7. Conclusions
This study is the first in situ documentation of rock surface and fracture temperatures along an urban portion of the Niagara Escarpment and provides quantitative data on the potential mechanism and factors responsible for weathering of the steep rock face under cold conditions. The data presented here indicate that the thermal regime is conducive for both freeze–thaw and thermal weathering processes in this temperate climatic setting; moisture also appears to be an important factor as the timing of potentially effective freeze–thaw cycles is synchronous with periods of high moisture availability. Temperature gradients recorded at in situ sites over the December–March study period, between the rock surface and pre-existing fractures, closely follow diurnal trends in atmospheric temperature and insolation. These diurnal trends are dependent on site-specific characteristics which vary within exposures and across the landscape. The aspect of the escarpment face appears to have a strong control on insolation, which may ultimately influence the mechanism and strength of weathering. South-facing sites receive high insolation and are prone to rapid, large temperature changes causing short-term freeze–thaw cycles and potentially thermal shock; north-facing sites are characterized by prolonged freeze–thaw cycles likely to generate macrogelivation processes. Lithology exerts a control on heat conduction through the rock and, similarly, impacts the temporal and spatial scale at which weathering occurs. Contrary to our expectation we found that fracture aperture does not strongly influence the relationship between fracture and air temperature, and that heat convection into fractures may be complex in nature. However, our work suggests that there is significant variation in surface-fracture temperature gradients which may arise from differential warming and cooling, a temporal lag as heat is conducted from surface to fracture, and rapid temperature changes associated with insolation. This may act as a driver of thermal and freeze–thaw weathering by altering the strength and orientation of stress and pressure gradients through the body of rock. Further work is necessary to elucidate the influence of site-specific factors by monitoring temperatures over a greater range of sites with different characteristics while supplementing temperature data with rock moisture and weathering rates.
This research investigates the controlling parameters for freeze–thaw and thermal weathering processes but does not include a direct observation of weathering rates or mechanisms. The interplay between thermal and freeze–thaw processes could be more clearly understood by implementing field studies to assess weathering directly, such as photogrammetric change detection or debris collection. Nevertheless, our findings provide valuable insight into the nature of the weathering regime and narrow the focus toward site-specific factors of particular importance. We emphasize that the thermal regime and surface-fracture dynamics are important determinants of weathering in the winter months. Continuation of this study into the summer months will supplement our observations and provide a complete understanding of physical weathering processes active along the Niagara Escarpment.
Acknowledgements
This work was supported by the National Science and Engineering Research Council of Canada (A.P., NSERC Discovery Grant: RGPIN-2021-04011; C.E., NSERC Discovery Grant: RGPIN-2019-06568; H.G., NSERC USRA), Mitacs (H.G., Mitacs Research Training Award) and the Geological Society of America (H.G., Northeastern Section Undergraduate Research Grant).
Conflict of interest
None.


 Open access

