




Introduction
Halloysite is the only natural hydrated member of the kaolin sub-group of clay minerals displaying an X-ray diffraction (XRD) reflection at ~10 Å owing to H2O intercalated between the layers and ascribed to a 2H2O. Al2Si2O5(OH)4 nominal composition. When exposed to ambient temperature and relative humidity (RH), the interlayer H2O of halloysite‑(10 Å) begins to de-intercalate and the layer spacing collapses to give a peak that may be situated anywhere between 7.9 and 7.2 Å depending on how the dehydration is accomplished. The as-produced halloysite‑(7 Å) does not recover the ~10 Å reflection by exposure to H2O. Natural halloysite particles are usually in the form of nanotubes, although spheroidal and platy morphologies are also known. The unique structural and morphological properties of halloysite nanotubes (HNTs) (Joussein et al., Reference Joussein, Petit, Churchman, Theng, Righi and Delvaux2005; Gray-Wannell et al., Reference Gray-Wannell, Cubillas, Aslam, Holliman, Greenwell, Brydson, Delbos, Strachan, Fuller and Hillier2023) are relevant to a growing gamut of applications (Yuan et al., Reference Yuan, Tan and Annabi-Bergaya2015; Churchman et al., Reference Churchman, Pasbakhsh and Hillier2016) and justify the recent revival of fundamental research on halloysite (Santagata and Johnston, Reference Santagata and Johnston2022; Gray-Wannell et al., Reference Gray-Wannell, Cubillas, Aslam, Holliman, Greenwell, Brydson, Delbos, Strachan, Fuller and Hillier2023).
The relationship between the hydrated and dehydrated forms of halloysite has been the subject of several early investigations, mostly by XRD. Based on the XRD patterns of halloysite equilibrated in situ to variable relative humidity at ambient temperature and reviewing earlier work, Churchman et al. (Reference Churchman, Aldridge and Carr1972) concluded that the (10 Å) to (7 Å) transition of halloysite occurs through the interstratification and partial segregation of fully hydrated and fully dehydrated ‘end-member’ layers, yielding materials with xH2O per Al2Si2O5(OH)4 changing continuously in the 0≤x≤2 range. The x=0, x=2 halloysite ‘end-members’ are somehow idealized and may not be readily accessible experimentally in pure form.
Experimentally, the dehydration sequence of halloysite was mostly inferred by analogy to synthetic hydrated kaolinite. A notable body of work by Costanzo and colleagues, culminating in Costanzo and Giese (Reference Costanzo and Giese1985), suggested that the dehydration of kaolinite-(10 Å) involved an intermediate state with a ~8.5 Å spacing that remained partially hydrated up to 200°C by the so-called ‘hole’ H2O species. Subsequent studies by Jemai et al. (Reference Jemai, Ben Haj Amara, Ben Brahim and Plancon1999, Reference Jemai, Ben Haj Amara, Ben Brahim and Plancon2000) obtained and analyzed successfully coherent 10 Å and 8.5 Å kaolinite hydrates by XRD that were stable at ambient temperature. More recently, this work was extended by Naamen et al. (Reference Naamen, Jemai, Ben Rhaiem and Ben Haj Amara2003) who demonstrated that, besides 10 Å and 7 Å layers, a layer of 8.4 Å spacing was necessary to model the XRD patterns observed during the dehydration of artificially hydrated kaolinites in terms of interstratification. To the knowledge of the present authors, a well-defined and stable ~8.5 Å state has never been observed directly in halloysite by XRD, perhaps owing to the constraints imposed by the nano-roll morphology (Costanzo and Giese, Reference Costanzo and Giese1985). Based on peak decomposition analysis, domains or random interstratifications of similar spacing were, nevertheless, suggested to form during the dehydration of some halloysites-(10 Å) studied by Joussein et al. (Reference Joussein, Petit, Fialips, Vieillard and Righi2006).
The use of vibrational spectroscopy for the characterization of natural halloysite nanotubes in comparison with kaolinite has been widespread (e.g. Farmer, Reference Farmer and Farmer1974; Frost et al., Reference Frost, Fredericks and Bartlett1995) but was focused mostly on the 7 Å phase for practical reasons (Joussein et al., Reference Joussein, Petit, Churchman, Theng, Righi and Delvaux2005). Halloysite‑(7 Å) has broader inner-surface and inner-νΟΗ bands than kaolinite, at ~3690 and 3625 cm–1, respectively, as well as an unusually well-defined pair of bands at ~3550 and 1650 cm–1 assigned to residual H2O. The latter spectrum is invariably observed in both de-intercalated kaolinite and halloysite‑(7 Å) and has been assigned to H2O interacting with the ditrigonal cavities of the siloxane sheet, hence the term ‘hole water’ (Costanzo et al., Reference Costanzo, Giese and Lipsicas1984; Costanzo and Giese, Reference Costanzo and Giese1985; Lipsicas et al., Reference Lipsicas, Straley, Costanzo and Giese1985; Jemai et al., Reference Jemai, Ben Haj Amara, Ben Brahim and Plancon1999; Joussein et al., Reference Joussein, Petit, Fialips, Vieillard and Righi2006). Incidentally, the presence of any type of interlayer H2O in the halloysite-(7 Å) state constitutes a deviation from the ideal x=0 end-member of the aforementioned Churchman et al. (Reference Churchman, Aldridge and Carr1972) structural model, and might be explained by the presence of ~8.5 Å spacings, as in Costanzo and Giese (Reference Costanzo and Giese1985).
Among the few publications reporting on the infrared (IR) spectra of the 10 Å phase (Cruz et al., Reference Cruz, Letellier and Fripiat1978; Costanzo et al., Reference Costanzo, Giese, Lipsicas and Straley1982; Costanzo et al., Reference Costanzo, Giese and Lipsicas1984; Jemai et al., Reference Jemai, Ben Haj Amara, Ben Brahim and Plancon1999; Cheng et al., Reference Cheng, Frost, Yang, Liu and He2010; Johnston, Reference Johnston, Gates, Kloprogge, Madejova and Bergaya2017), most include spectra that are biased by the bands of bulk H2O which is present and required to maintain the interlayers in hydrated form, whereas others are from samples converted substantially to the 7 Å phase. The infrared emission along the dehydration path of a sample containing halloysite-(10 Å) has been recorded (Cheng et al., Reference Cheng, Frost, Yang, Liu and He2010) but the technique is not efficient at near-ambient temperatures. More recently, Santagata and Johnston (Reference Santagata and Johnston2022) studied the 10 Å to 7 Å transition of natural HNTs by XRD, thermogravimetric analysis (TGA) and infrared. They reported intermediate states maintaining the 10 Å XRD reflection despite their reduced interlayer H2O content, but the corresponding infrared spectra were not available.
The present work was undertaken to establish the missing infrared spectroscopic signature of the tubular halloysite-(10 Å) which is important per se and, also, essential for deciphering the structural traits of the 10 Å to 7 Å transition. The elusive infrared spectrum as well as the XRD pattern of natural halloysite-(10 Å) nanotubes were recorded and their changes during the transition to halloysite-(7 Å) were monitored. Infrared data acquisition was done in situ by combining controlled hydration with hydrogen/deuterium (H/D) exchange, as in previous investigations of palygorskite/sepiolite and dioctahedral smectite minerals (Bukas et al., Reference Bukas, Tsampodimou, Gionis and Chryssikos2013; Kuligiewicz et al., Reference Kuligiewicz, Derkowski, Szczebra, Gionis V and Chryssikos2015a). Halloysite nanotube morphology, both external and internal (Gray-Wannell et al., Reference Gray-Wannell, Cubillas, Aslam, Holliman, Greenwell, Brydson, Delbos, Strachan, Fuller and Hillier2023), was also considered for its possible effect on the IR spectra. This study was based on five natural (10 Å) samples of known dominant morphology, both cylindrical and polygonal-prismatic, previously reported by Hillier et al. (Reference Hillier, Brydson, Delbos, Fraser, Gray, Pendlowski, Phillips, Robertson and Wilson2016), Drits et al. (Reference Drits, Sakharov and Hillier2018), Gray-Wannell et al. (Reference Gray-Wannell, Cubillas, Aslam, Holliman, Greenwell, Brydson, Delbos, Strachan, Fuller and Hillier2023), and Santagata and Johnston (Reference Santagata and Johnston2022).
Materials and methods
Materials
Five halloysite samples, three cylindrical (5CH, 6CH, and 25US) and two polygonal (23US and 24US) in form were considered in this study. Both types of nanotubes co-exist in many halloysites, therefore their morphological characterization is based on the predominant morphology (Gray-Wannell et al., Reference Gray-Wannell, Cubillas, Aslam, Holliman, Greenwell, Brydson, Delbos, Strachan, Fuller and Hillier2023). The samples were obtained from halloysite occurrences in China and the USA (Hillier et al., Reference Hillier, Brydson, Delbos, Fraser, Gray, Pendlowski, Phillips, Robertson and Wilson2016; Gray-Wannell et al., Reference Gray-Wannell, Cubillas, Aslam, Holliman, Greenwell, Brydson, Delbos, Strachan, Fuller and Hillier2023). 25US was a sample recently studied by Santagata and Johnston (Reference Santagata and Johnston2022) and kindly provided by C.T. Johnston. All samples were water-saturated and kept refrigerated when not undergoing measurement.
X-ray diffraction
For collection of the XRD patterns, the hydrated halloysite (10 Å) samples were loaded as quickly as possible (<60 s) into 2-mm deep, 25-mm diameter holders. All were in variously pliable states, often visibly damp or wet and were simply pressed into the holders using a spatula to form as flat and even a surface of the specimen as possible. XRD patterns were collected without delay for each individual specimen using a Bruker D8 Advance instrument and counting for an equivalent of 67.2 s per 0.0194°2θ step with a Lynxeye-XE position sensitive detector using Ni-filtered Cu radiation. The scans, made over an angular range from 4–70°2θ, took ~20 min to complete. With the specimen still loaded into the instrument, a second pattern was recorded immediately following the first to establish if there had been any change in the diffraction pattern due to dehydration over the course of the scan. All second scans of the hydrated specimens were identical to the first scans, confirming no dehydration of the halloysite (10 Å) during the scan. A third set of scans was recorded following drying of the samples for 3 days at 70% RH in a desiccator (saturated NaCl/NaBr solution). A final set of scans was then made following planned dehydration of the halloysites to the 7 Å form by drying in a desiccator over silica gel at 60°C for 1 week. Scanning conditions were identical for all scans except that all the specimens dried at 60°C had to be disaggregated gently to powder form, due to the drying, before loading into the XRD holders.
Additionally, to monitor dehydration, the samples were also scanned continuously in ambient laboratory conditions for a period of 50 h. Scans were run from 3 to 70°2θ, collecting one scan every 15 min. Specimens were mounted as above, but in 15-mm circular holders. Data were collected using a Panalytical Xpert Pro instrument, with an Xcelerator detector, counting for 27.3 s per 0.017°2θ step using Ni-filtered Cu radiation.
Infrared spectroscopy
Infrared spectra (4000–550 cm–1, 100 scans, 2 cm–1 resolution, Δν=1 cm–1) were measured on a Fourier-transform instrument (Tensor II by Bruker, Ettlingen, Germany) equipped with a single reflection diamond attenuated total reflectance (ATR) accessory (Miracle by Pike Technologies, Fitchburg, WI, USA) fitted with a home-made environmental chamber (Bukas et al., Reference Bukas, Tsampodimou, Gionis and Chryssikos2013; Chryssikos, Reference Chryssikos, Gates, Kloprogge, Madejova and Bergaya2017). The gas inlet of the chamber was connected to a home-made relative humidity N2 generator ( 5-90% RH at 30°C) equipped with a RH-temperature probe (HC2-S by Rotronic, Bassendorf, Switzerland). The generator splits and then recombines a constant flow (~250 mL min–1) of high purity N2 (<5 ppm H2O) in two branches, one of which is saturated by H2O or D2O vapors passing through a temperature-controlled glass frit bubbler.
To record the spectrum of halloysite-(10 Å), a few drops of an aqueous dispersion of the mineral were deposited on the diamond ATR element and covered by the environmental chamber. The sample was exposed to N2 purging over 3–5 h with humidity fixed in the 70±5% RH range and the spectra were recorded periodically as the sample dried very slowly. When most of the bulk water had evaporated, the spectra became stable over time and showed no signs of further dehydration. The initial conditions of the ATR experiment were, therefore, similar to that of the 70% RH XRD measurement, except for a much shorter equilibration time period (3–5 h instead of 3 days). Subsequently, the RH was decreased in steps of ~5–10% and the sample was remeasured after a 30 min equilibration at the new conditions. The measurement of the 7 Å phase took place when the spectra became time independent at the lowest achievable RH% (typically 5–10%). Similarly, the corresponding D2O-saturated 10 Å phase (D-form) and its transition to 7 Å could be measured by removing the excess H2O of the original H2O-saturated 10 Å sample (H-form) with a tissue, dispersing excess D2O and repeating the experiment with D2O in the bubbler of the humidity generator, instead of H2O.
The whole series of measurements that was necessary to capture the 10 Å phase and record its transition to 7 Å lasted typically 7–10 h and was repeated several times to test sample uniformity and measurement consistency. During the experiments, the spectrometer was well stabilized, purged and fitted with fresh desiccants. Small changes in the composition of atmospheric gases in the optical pathway were compensated for by collecting a second background spectrum at the end of the experiment and interpolating between the two backgrounds, if necessary.
Lastly, the rehydration of halloysite-(7 Å) by H2O or D2O was examined by drying the initial dispersion of the 10 Å phase under N2 (~5% RH(D)) and then equilibrating this sample to progressively increasing humidity in steps of ~10% RH(D) up to 70±5% RH(D).
It should be emphasized that, besides an approximately common starting point, the XRD and IR experiments monitoring the transition from halloysite-(10 Å) to -(7 Å) were by no means synchronized because the humidity controls in the two types of experiment were different. The two sets of data include, nevertheless, snapshots along the same reaction pathway and call for a common interpretation.
Results
X-ray diffraction of halloysite-(10 Å) and halloysite-(7 Å)
All XRD patterns of the hydrated specimens showed a strong peak at 10 Å, confirming their hydrated state (Fig. 1). In the three samples with dominant cylindrical form (5CH, 6CH, 25US), the 10 Å peak was the only basal peak observed, whereas in the two predominantly polygonal samples (23US, 24US), small peaks near 7 Å were also present. In one of these samples (23US) this peak was located at ~7.15 Å and had previously been assigned to the presence of some kaolinite in this sample, estimated at ~12 wt.%. In sample 24US, a much smaller 7 Å peak was located at ~7.25 Å and this larger spacing (see below) is believed to indicate that this represents a small amount of dehydrated halloysite 7 Å, rather than an admixture of kaolinite in this sample. It is also pertinent to note that the microscopic examination reported by Gray-Wannell et al. (Reference Gray-Wannell, Cubillas, Aslam, Holliman, Greenwell, Brydson, Delbos, Strachan, Fuller and Hillier2023) found no obvious signs of kaolinite ‘plates’ in sample 24US.
XRD of predominantly cylindrical (left) and polygonal-prismatic (right) samples in 10 Å and 7 Å forms (blue and red, respectively); the 7 Å form was obtained after storage in a desiccator at 60°C for 1 week. Note the 10 Å peak asymmetry towards higher angles, i.e. towards 7 Å, most clearly shown in the ×10 insets, evident in all samples. Conversely, note the asymmetry towards 10 Å shown by the 7 Å halloysites. In all 7 Å forms, the peak position is located near 7.4 Å, and peak widths (FWHM) are typically twice as wide in the 7 Å compared with 10 Å forms.
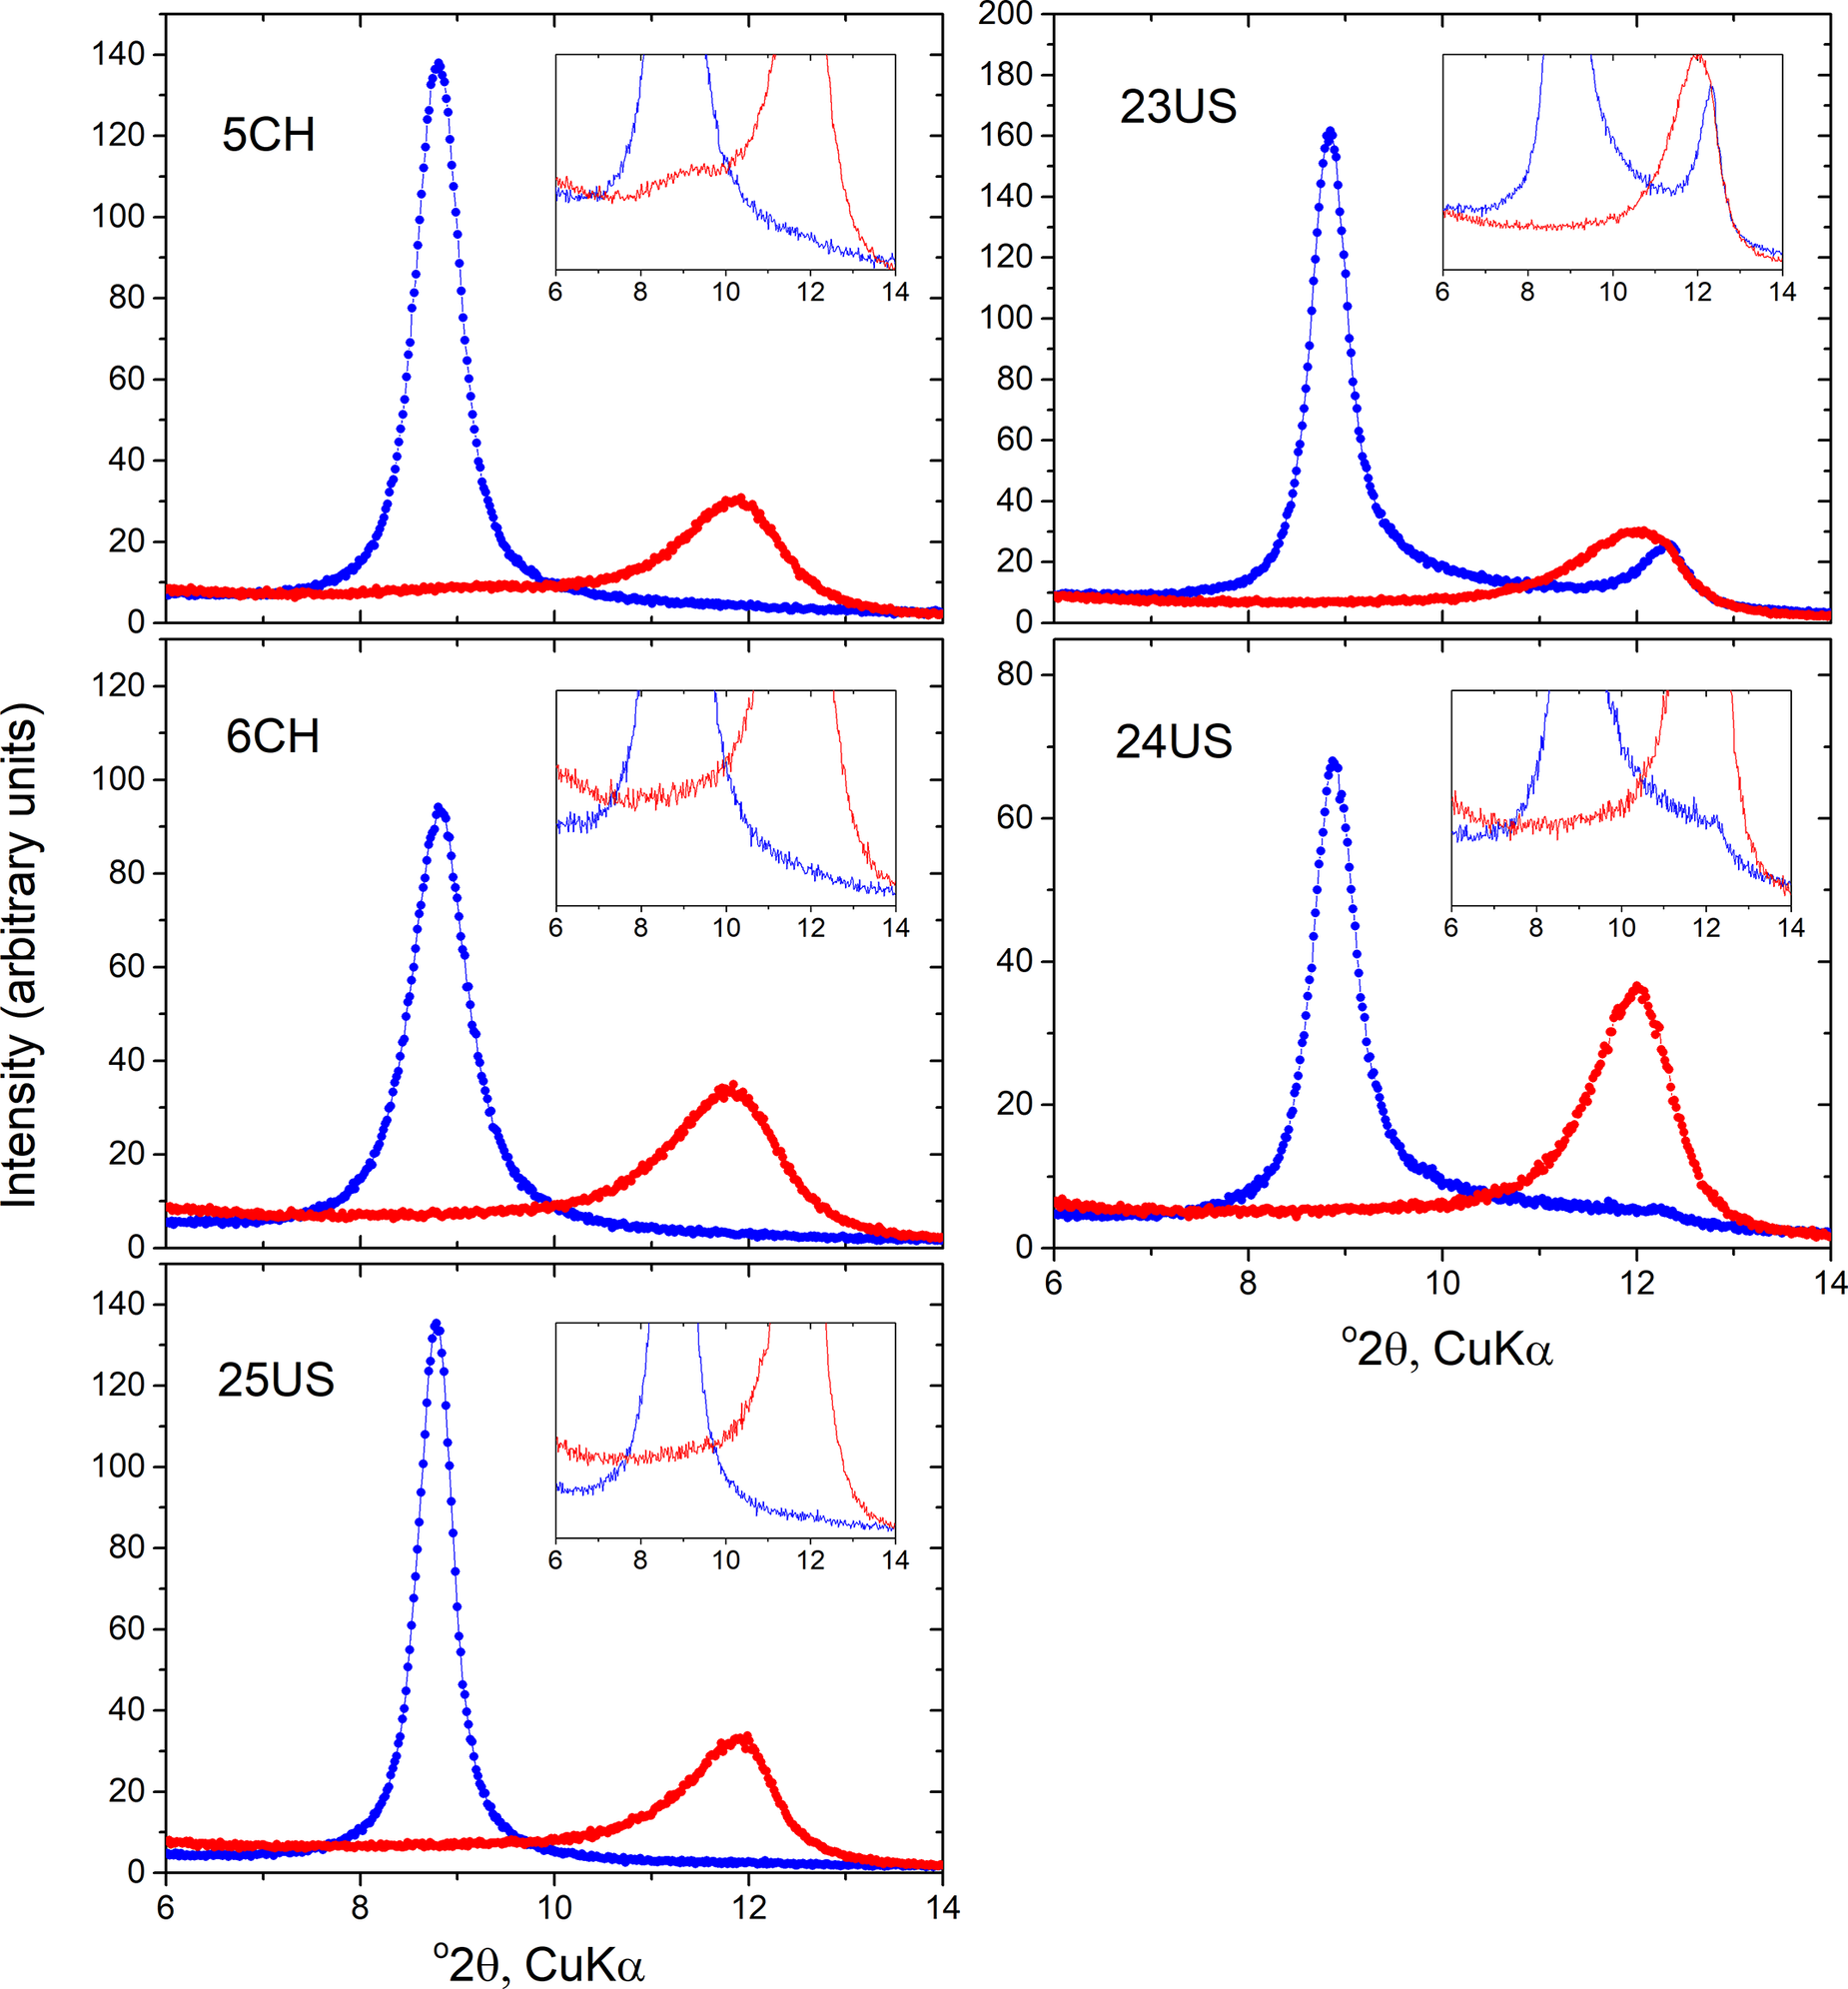
In all five samples, a notable, but typically subtle, feature of the 10 Å peaks was a degree of asymmetry toward higher angles, i.e. from 10 Å towards 7 Å. By normalizing the maximum intensity of the scans (not shown), the samples could be placed in relative order in relation to the extent of development of this asymmetry. Thus, the two polygonal samples 23US and 24US showed the most evidence for asymmetry, while among the cylindrical samples 6CH had the most asymmetry, 25US the least and 5CH was intermediate (Fig. 1). Small differences in peak widths (full width at half maximum, FWHM) were also apparent, with values ranging from 0.45–0.53 and 0.55–0.67 Δ°2θ for polygonal and cylindrical samples, respectively. Note that small differences in peak positions are believed to be due to differences in minor sample displacement errors and attempts to correct for these using an external standard indicates that all peak positions (observed maxima) were very close to 10 Å (±0.05). Sample equilibration to 70% RH at room temperature for 3 days prior to measurement yielded essentially the same 10 Å patterns as the wet materials, albeit with a barely observable hint of increase of their high-angle asymmetry (see Fig. S1 in the Supplementary material). In all cases, dehydration of the samples in the desiccator at 60°C resulted in a shift of the basal peak to ~7.4 Å, all peaks having rather broad widths averaging 1.12°2θ, i.e. approximately twice the width of the prior peak near 10 Å. One sample (5CH) also showed a low-intensity very broad peak at larger d spacing partly merged into the 7 Å peak, probably centered at ~9.4 Å, although its broad width and low intensity make estimation of its position rather imprecise. All the main 7 Å peaks of the other four samples also showed gradual ‘tails’ extending all the way back towards 10 Å (Fig. 1).
Dehydration sequences of the samples as a function of time, recorded over a 50 h period at ambient laboratory conditions revealed how the XRD patterns change between the above states. The dehydration of sample 6CH is shown in Fig. 2, for example. The main features to note were the rapid decrease in intensity of the 10 Å peak in the earliest stages, the common presence of two peak maxima in the 10 to 7 Å region at the intermediate stages of dehydration, and the extremely broad widths of the peaks that formed and evolved both between 10 to 7 Å and ~3.35 to 3.60 Å at higher angles. In all samples the peak maxima observed in the 10 to 7 Å region seemed to be initially ‘fixed’ in position near 10 Å and decreasing in intensity. This peak later moved to ~9.7–9.6 Å and was accompanied by the development of a second broad peak that appeared to migrate from ~8.4 to ~7.9 Å. The latter spacings were common to all samples and represented the final smallest spacing observed in these 50 h sequences at room temperature. As a typical example concerning peak widths, sample 6CH showed after 10 h dehydration a complex ‘area’ of scattering between 10 and 7 Å that had a FWHM of >2.8°2θ. Similarly, the peak that migrated between 3.35 and 3.60 Å was estimated to be ~1.0Δ°2θ wide, although precise measurement was difficult due to its much lower intensity.
Dehydration of sample 6CH over time at ambient laboratory conditions as observed by XRD; samples are displaced vertically for clarity. Note the rapid decrease in intensity of the peak at 10 Å, the persistence of maxima near 10 Å, and the presence of two maxima in some intermediate scans as the broad band of scattering migrates towards 7 Å. Final maxima in this sequence, after 50 h, are centered on 7.9 Å. Note also the very broad peak that results from the migration of the peak at ~3.35 Å (003 based on 10 Å spacing) towards about 3.6 Å. All other samples (5CH, 23US, 24US, and 25US) show an essentially identical sequence with the same features.

Infrared spectra of halloysite-(10 Å) and halloysite-(7 Å)
The slow drying of the wet halloysite at >70% RH in situ and its step-wise equilibration to <10% RH (see Materials and methods section) allowed for the measurement and comparison of the ATR spectra of the 10 Å and 7 Å forms (Fig. 3; see also Fig. S2 in the Supplementary material). The spectra of the halloysite‑(7 Å) form were essentially identical to those reported in the literature (cf. Ηillier et al., Reference Hillier, Brydson, Delbos, Fraser, Gray, Pendlowski, Phillips, Robertson and Wilson2016; Santagata and Johnston, Reference Santagata and Johnston2022 and references therein), whereas some of the features of the halloysite‑(10 Å) form could be recognized in a spectrum published by Cheng et al. (Reference Cheng, Frost, Yang, Liu and He2010). Cylindrical and polygonal halloysite could be distinguished by their ATR spectra, especially when dehydrated. In comparison with the inner OH band at 3625 cm–1, polygonal halloysite exhibited more intense, better defined and slightly shifted inner-surface OH-stretching modes than their cylindrical counterparts at ~3700 cm–1, with additional weak components at 3670 and 3655 cm–1. The inner-surface OH bending mode at 935 cm–1 was also better resolved in polygonal halloysite (cf. Hillier et al., Reference Hillier, Brydson, Delbos, Fraser, Gray, Pendlowski, Phillips, Robertson and Wilson2016). All samples in the 7 Å hydration state exhibited an O-H stretching mode at ~3550 cm–1, accompanied by a weak but sharp bending at ~1650 cm–1. The latter bands have been considered as the IR fingerprint of halloysite (although they are also typical of artificially hydrated and subsequently de-intercalated kaolinite) and were previously assigned to a so-called ‘hole’ H2O species interacting with the ditrigonal cavity (Costanzo and Giese, Reference Costanzo and Giese1985).
ATR spectra of all halloysite-(7 Å) and halloyosite-(10 Å) investigated (red and blue, respectively) illustrating the comparison between cylindrical (5CH, 6CH, 25US) and polygonal types (23US, 24US). The spectra in the 1800–1550 cm–1 range are amplified by a factor of 2 for clarity.
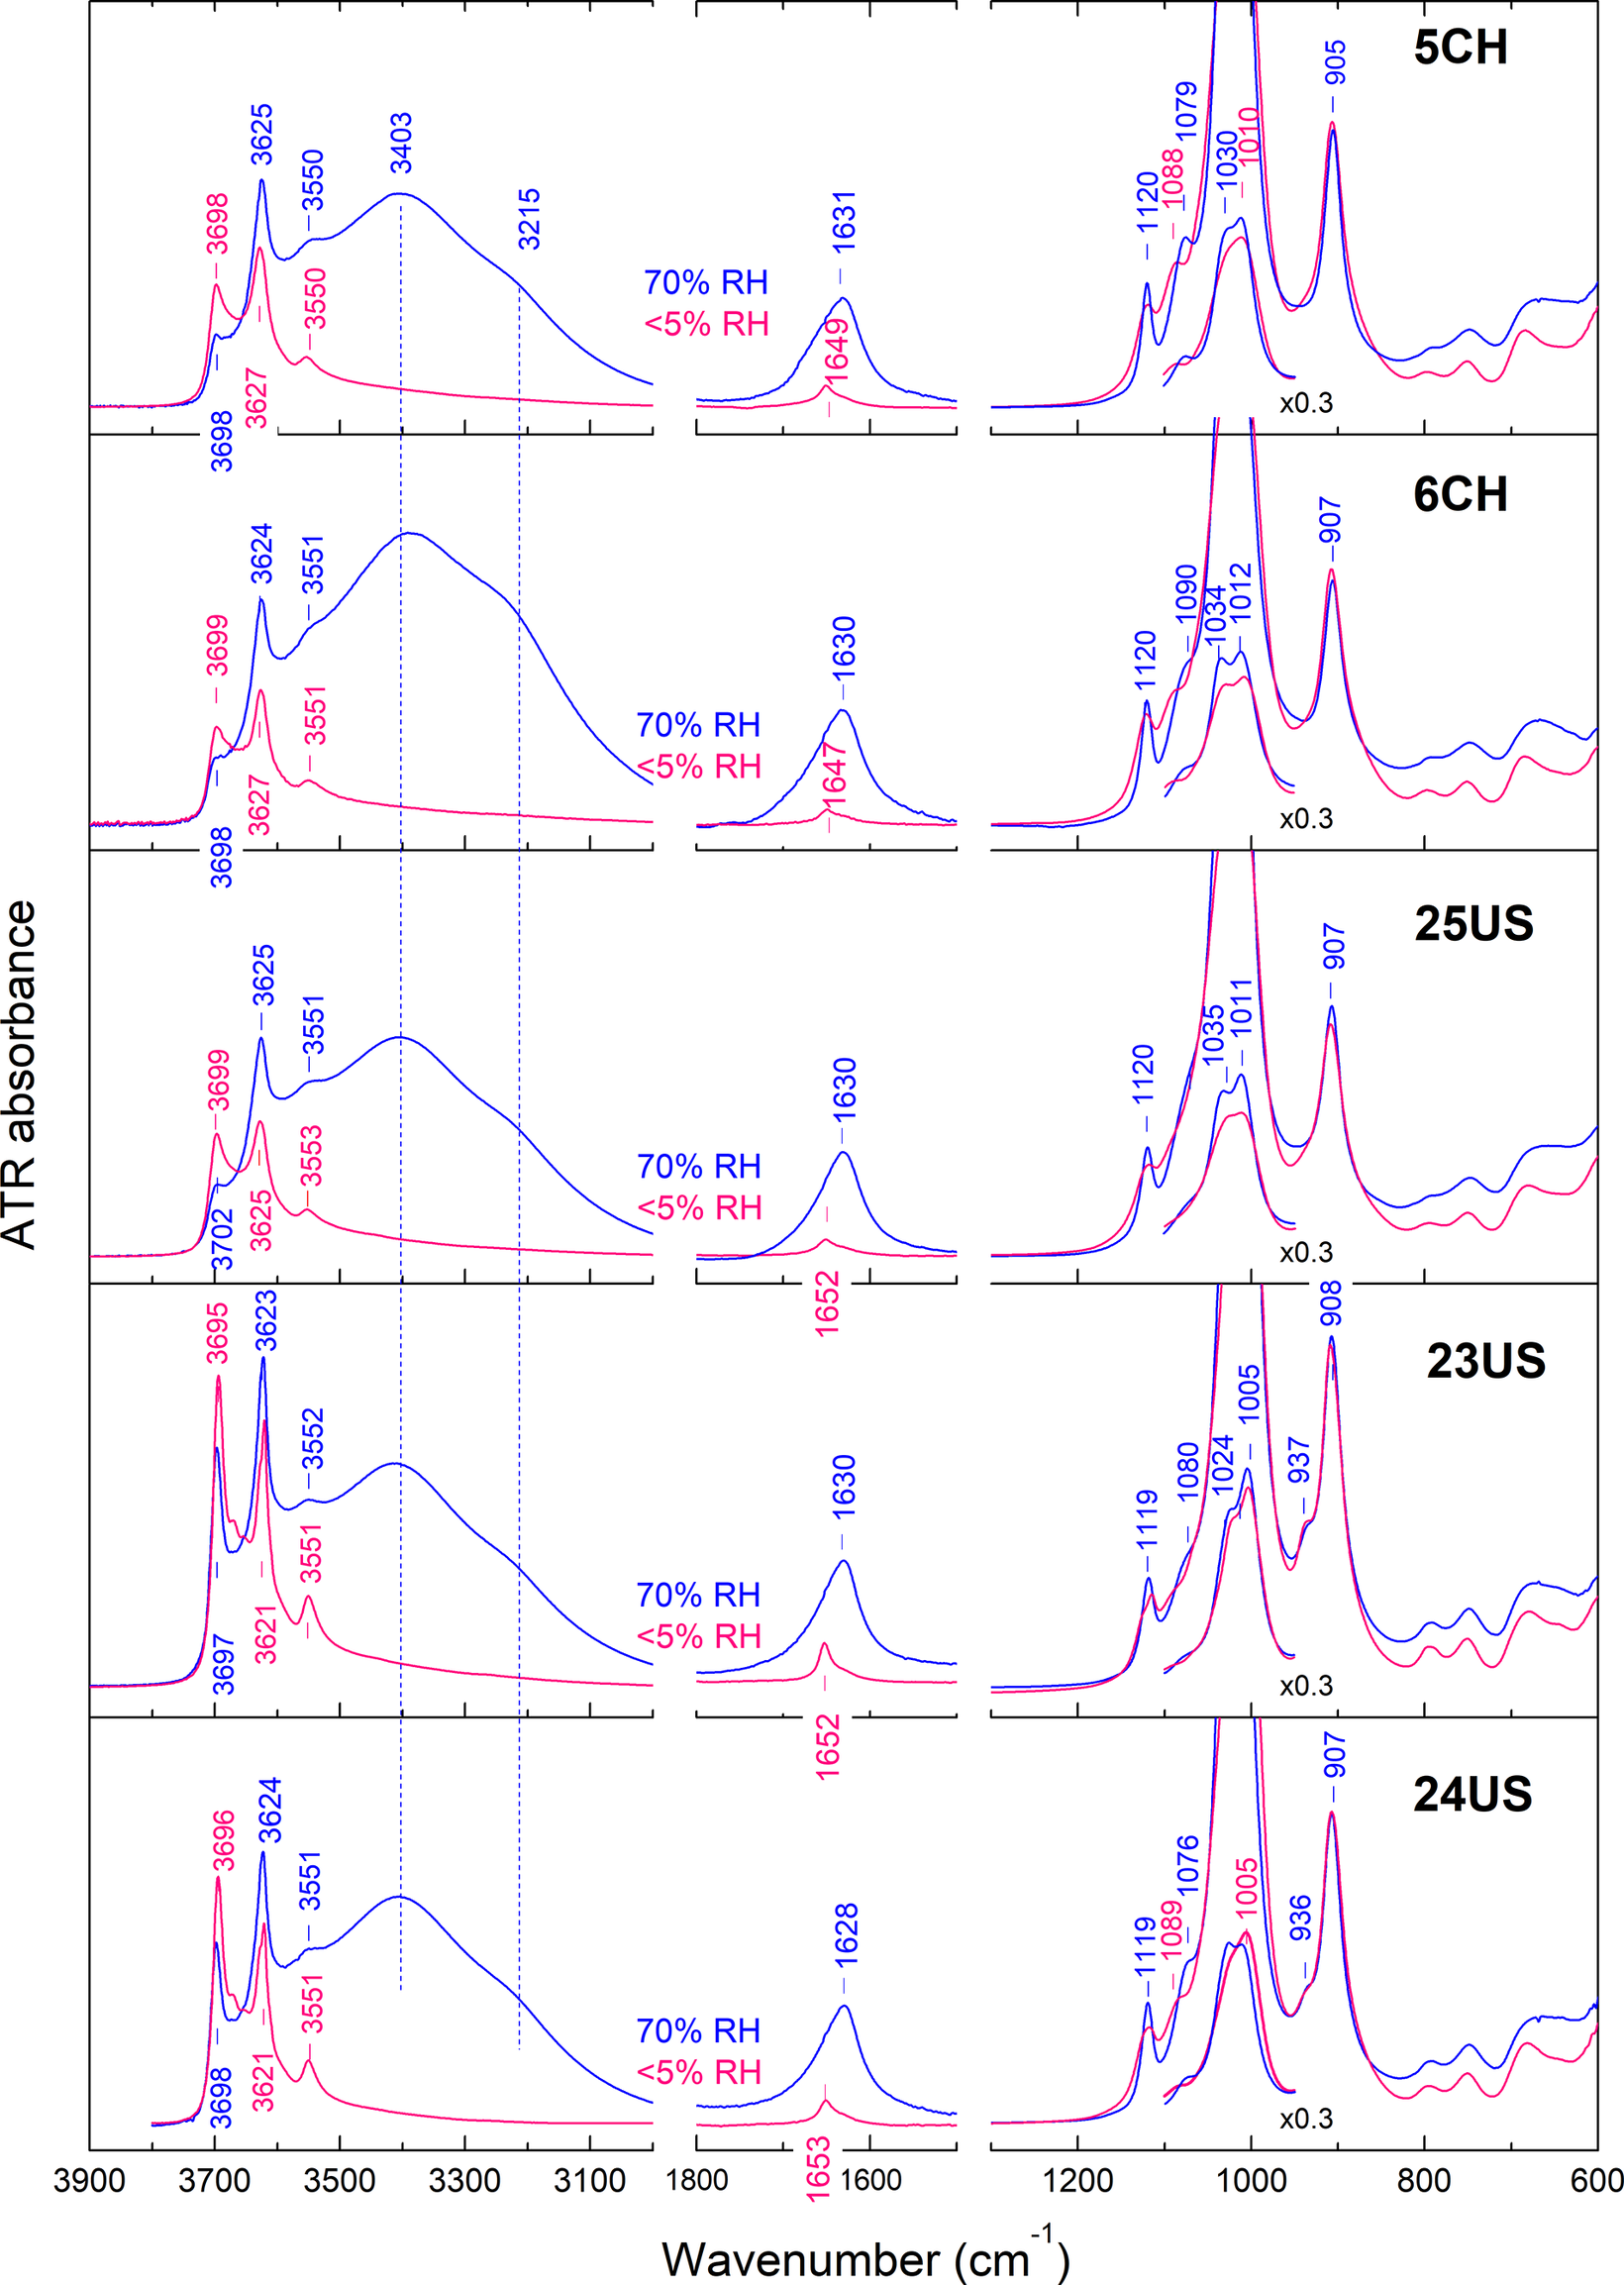
In comparison with the 7 Å phase, the spectra of all 10 Å samples exhibited, in addition, a broad doublet of H2O stretching modes at ~3400 and 3215 cm–1 accompanied by a bending mode at ~1630 cm–1, which was skewed on the high-frequency side (Fig. 3). The shape and relative intensity of these features was independent of the cylindrical or polygonal morphology of the sample. Furthermore, all 10 Å samples exhibited a broad band at 3550 cm–1 which, together with the high-frequency asymmetry of the ~1630 cm–1 bending, suggested that the species responsible for the ‘hole’ H2O spectrum is detectable also in the 10 Å halloysite.
Several additional spectral characteristics were common to all 10 Å halloysites investigated, regardless of cylindrical or polygonal character: the AlOH stretching and deformation envelopes (for a recent review on the assignments of the layer modes, see Kloprogge, Reference Kloprogge and Kloprogge2018) had similar profiles in all 10 Å samples with maxima at 3625±1 and 907±1 cm–1, respectively (Figs 3 and 4; see also Fig. S2 in the Supplementary material). The strongest Si–O stretching modes (1050–1000 cm–1) were distorted by anomalous optical dispersion and the low refractive index of diamond, but the weaker band at ~1120 cm–1 was also independent of cylindrical or polygonal character in halloysite-(10 Å); see Fig. 4. This band, active also in the spectrum of kaolinite at ~1115 cm–1, has been assigned to an in-plane symmetric Si–O stretching mode (Balan et al., Reference Balan, Marco Saita, Mauri and Calas2001) with a transition moment aligned with the a-axis (Johnston et al., Reference Johnston, Agnew and Bish1990). When converting to the 7 Å state, the inner AlOH deformation and the in-plane Si–O stretching bands appeared broader in cylindrical, or split in polygonal halloysite (Fig. 4), thereby leading to a better distinction between the two types.
Detail of the representative second derivative ATR spectra of cylindrical (25US) and polygonal (24US) halloysite in their 10 Å (blue) and 7 Å (red) forms. The spectra are shown over the Si–O stretching and Al-OH deformation range.

Monitoring the halloysite-(10 Å) to halloysite-(7 Å) transition
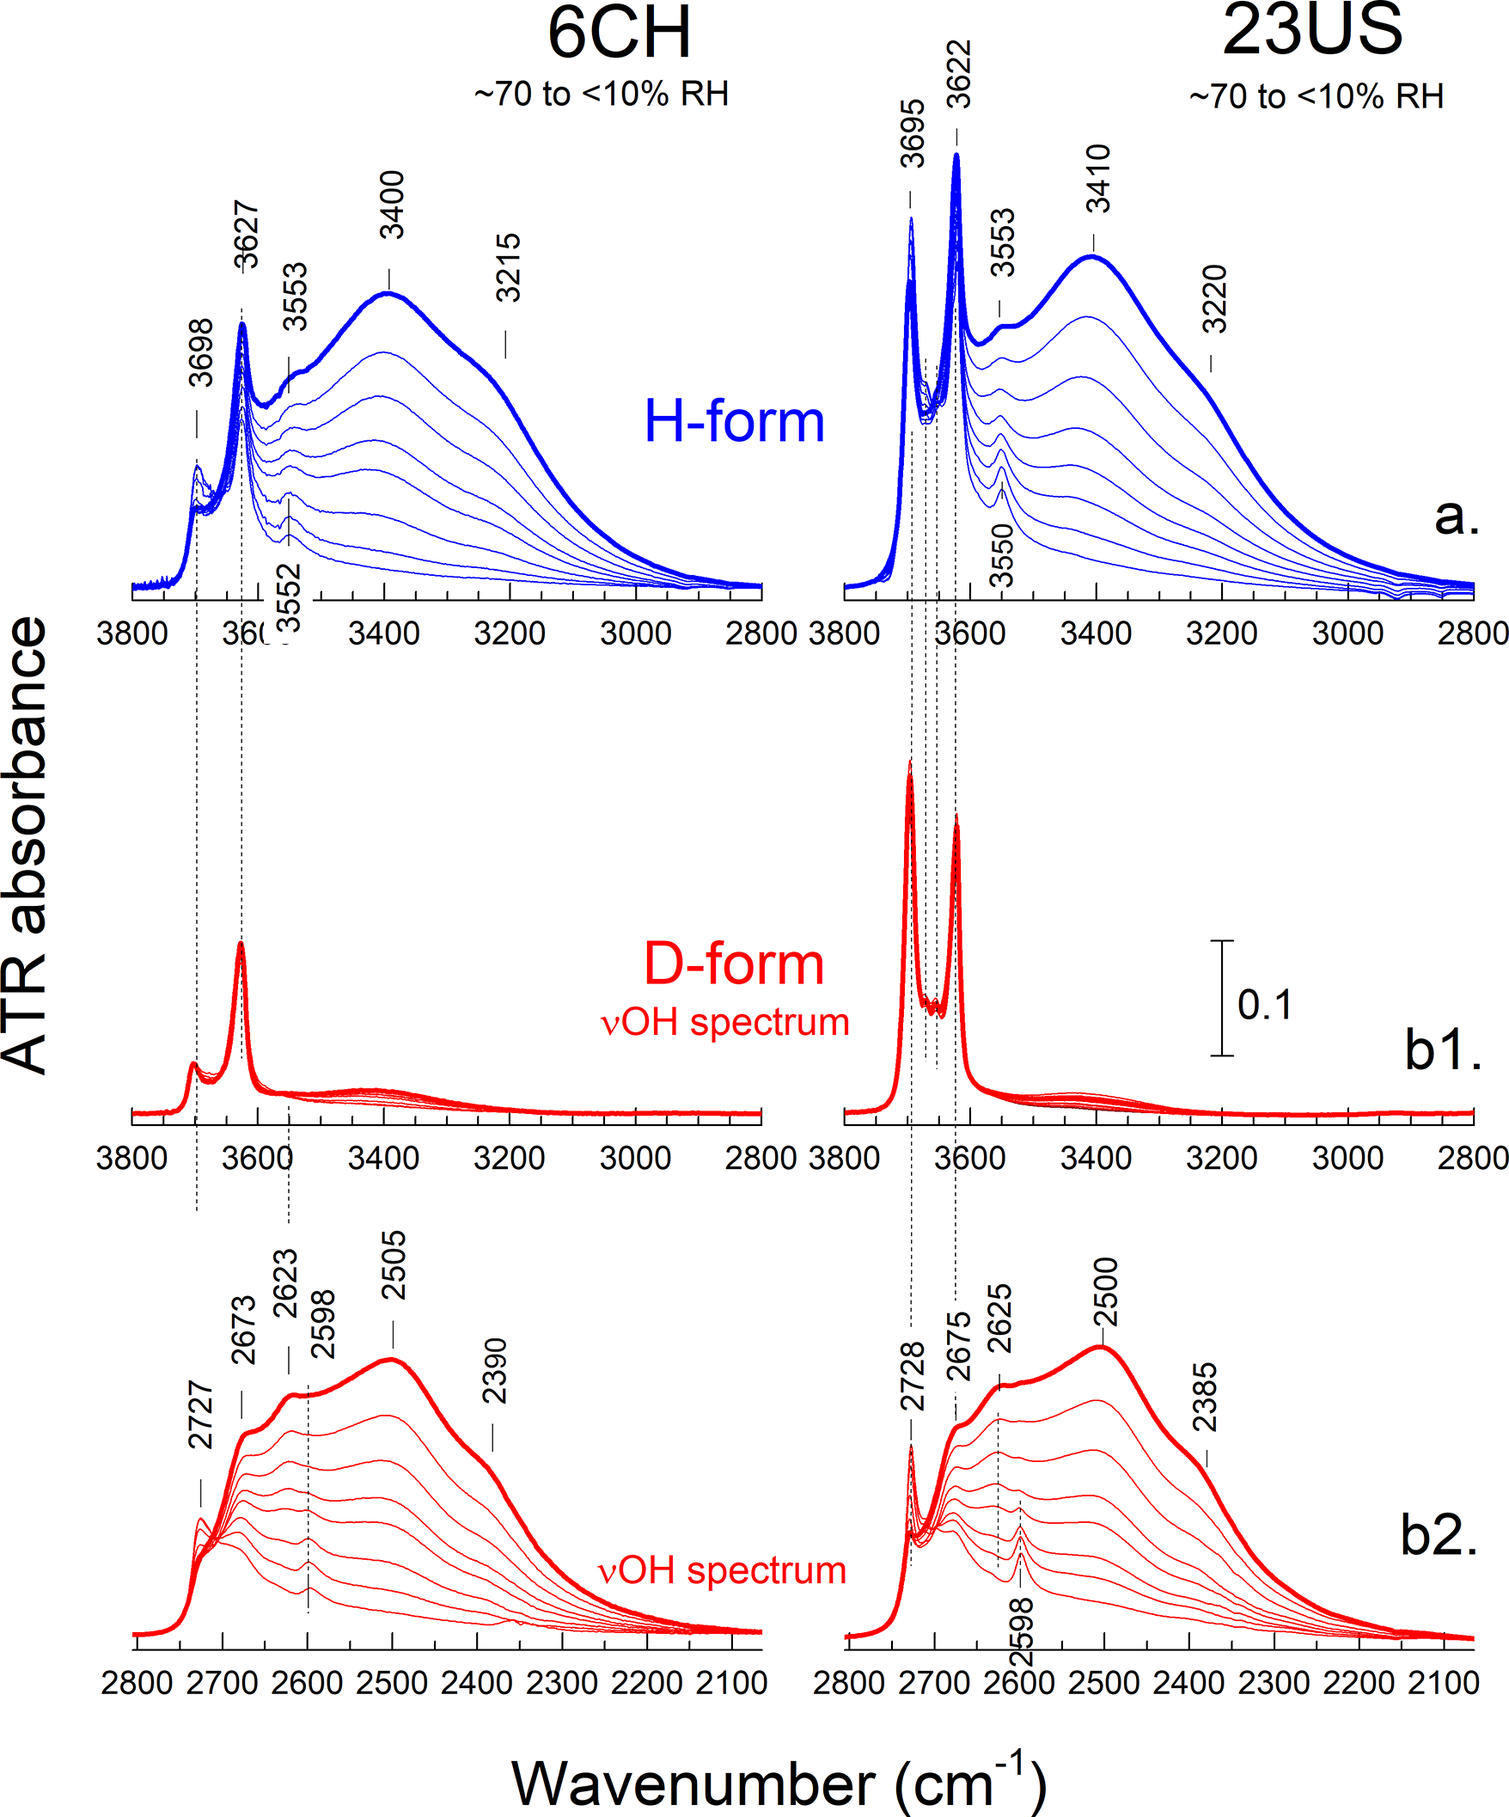
Following the examination of the end-member spectra (previous section), the full transition from halloysite-(10 Å) to halloysite-(7 Å) was studied over the νOH(D) and δH2O(D2O) ranges (Figs 5 and 6, respectively; see also Figs S3–S7 in the Supplementary material), as well as over the νSi-O and δΑl-ΟΗ ranges (Fig. S8 in the Supplementary material) for representative cylindrical and polygonal halloysite. In the νOH range (Fig. 5; upper, in blue), the progressive equilibration of the samples from ~70% RH to <10% RH led to the progressive intensity decrease of the main νH2O bands at ~3400 and 3220 cm–1. At the driest conditions (~5% RH), these bands were reduced to a broad tail below 3500 cm–1, indicating the presence of residual H2O. Opposite to the main νΗ2Ο bands, the weak feature at ~3550 cm–1 persisted during drying and became narrower, hence better resolved, at <40–50% RH.
Detail of the ATR spectra monitoring the νΟ-Η range during the 10 Å to 7 Å transition in cylindrical halloysite 6CH (left) and polygonal halloysite 23US (right). The as-received halloysite‑(10 Å) samples were dispersed in H2O or D2O (panels a and b, blue and red, respectively). The as-produced H- and D-forms were measured following equilibration to progressively decreasing RH% (RD%). For experimental details, see text. The spectrum of the halloysite‑(10 Å) end-member of each series is shown with a thick line. The νΟD range of the D-form (lower panel) is shown with the x-axis expanded by a factor of 1.355 to facilitate comparison with the νΟH spectra of both the H- (upper) and the D-forms (middle). Each set of panels has the same y-axis. Large versions of these graphs for all five halloysites investigated can be found in the Supplementary material (Figs S3–S7).
Detail of the ATR spectra monitoring the δΗ2Ο range during the 10 Å to 7 Å transition in halloysite 6CH (cylindrical) and 23US (polygonal). The transition is shown for both the H- (left, blue) and the D-form (right, red) of halloysite-(10 Å). Vertical bars indicate the y-axis scale of the spectra.

The envelope of the δH2O bending modes (Fig. 6, left, in blue) displayed a two-mode behavior: upon decreasing RH%, the intensity of the broad asymmetric component peaking at ~1630 cm–1 decreased progressively, leaving behind the weak, sharp component at ~1650 cm–1. The presence of the latter band, hence the formation of the 7 Å phase according to the literature, became detectable at ~50% RH. Both the ~3550 cm–1 and ~1650 cm–1 bands of the halloysite-(7 Å) phase appeared sharper in the spectra of polygonal than cylindrical halloysite (Figs 3, 5 and 6).
Further insight on the transition could be obtained by H/D exchange experiments. By analogy to similar experiments on pristine and intercalated kaolinite (Romo, Reference Romo1956; Ledoux and White, Reference Ledoux and White1964; Anton and Rouxhet, Reference Anton and Rouxhet1977; Johansson et al., Reference Johansson, Holmgren, Forsling and Frost1998; Fafard et al., Reference Fafard, Terkish and Detellier2017), it was anticipated that both H2O and the inner-surface OH groups residing in 10 Å interlayers would be exchangeable. On the contrary, the inner OH groups of halloysite-(10 Å) would be unaffected at ambient temperature. For this reason, the monitoring of the transition to the 7 Å form was repeated, starting from the deuterated halloysite-(10 Å), which was prepared as described in the Materials and methods section. The as-obtained ATR spectra (red in Figs 5 and 6) were compared with their H-form analogs. Successful H/D exchange would be manifested by the shift of the corresponding O-H vibrations to lower frequency (νOH/νOD≈1.36). For this reason, the x-axis over the νOD stretching range in Fig. 5 (2800–2100 cm–1, lower panel) was expanded by ×1.355 to facilitate comparison with the νOH spectrum.
The spectral series collected during the halloysite-(10 Å) to -(7 Å) transition of the D-form displayed IR bands in both the O-H and O-D ranges (Figs 5 and 6). As expected, the inner νOH at 3620–3630 cm–1 did not respond to the H/D exchange (Fig. 5, central panels). Contrary to expectations, a significant fraction of the inner-surface νOH was also found to be resistant to H/D exchange. In all D-halloysite systems investigated, the OH spectrum that resisted H/D exchange did not respond to changes in overall hydration either and was lacking a δH2O mode (data not shown). It should, therefore, correspond to an anhydrous form that would be unaffected by further drying.
All hydration-dependent vibrational features originally observed in the νO-H and δH2O ranges of the H-form (Fig. 5, upper panel; Fig. 6, left) were transferred to the corresponding νO-D and δD2O ranges as a result of H/D exchange (Fig. 5, lower panel; Fig. 6, right). In the spectra of the 10 Å form, the broad H2O stretching bands at ~3400, 3220 cm–1 (H-form) were moved to ~2500, 2390 cm–1 (D-form), whereas δD2O appeared at ~1200 cm–1 (δHDO produced a single peak at 1450 cm–1, data not shown). Similarly, the broad ~3550 cm–1 band of the H-form was also shifted to ~2625 cm–1. All these features displayed an H/D frequency ratio of 1.35–1.36, which explains why the νΟΗ spectra appear aligned with their νOD counterparts when the x-axis of the latter is expanded by a factor of ×1.355 (Figs 3, 5 and 6). Slightly different H/D frequency ratios were observed in the 7 Å phase. The stretching and bending modes of the ‘hole’ H2O (νΟΗ and δH2O at ~3550 and 1650 cm–1, respectively) shifted to ~2600, 1215 cm–1 (H/D=1.367, 1.360; Figs 5 and 6). In addition to the aforementioned bands, the νO-D range also displayed the inner surface νO-D band at ~2730 cm–1 which gained in intensity and sharpened upon dehydration, thereby preserving the pattern of hydration-induced changes observed in the corresponding H-form (νΟΗ at ~3700 cm–1, H/D=1.356) of both cylindrical 6CH and polygonal 23US halloysite (Fig. 5). Lastly, a broad band at ~2675 cm–1 was observed in the spectra of D-halloysite (Fig. 5, lower panels). The H-counterpart of this band was masked by the inner νOH mode at 3620–3630 cm–1 (Fig. 5, upper panels). Both the ~2675 and 2625 cm–1 bands of D-halloysite-(10 Å) appeared to decrease in intensity upon drying, the former merging with the inner-surface OD envelope and the latter giving place to the ‘hole’ D2O band at ~2600 cm–1.
Rehydration of halloysite-(7 Å) by H2O or D2O
There is ample evidence from XRD that the 10 Å to 7 Å transition of halloysite is irreversible upon rehydration. It could be supposed, therefore, that any H2O or D2O uptake during the rehydration of halloysite-(7 Å) should involve sites other than the collapsed interlayers. The study of the rehydration process could, therefore, provide clues for isolating the signature of irreversibly lost H2O that was originally present in the 10 Å-interlayer. For this reason, the H- or D-form of halloysite-(7 Å), prepared in situ on the ATR element by drying the corresponding H- or D-form of halloysite-(10 Å) (Figs 5 and 6) was subsequently exposed and equilibrated to progressively increasing humidity, up to ~70% RH or RH(D)% (Fig. 7). Rehydration could be done using either H2O or D2O (Fig. 7), but the latter is preferable. This is because monitoring rehydration in the νΟ-D (2800–2200 cm–1) instead of the νΟ-H range eliminates the interference from the stretching modes of inner O-H and those inner-surface O-H species that are resistant to D2O exchange and insensitive to hydration changes (Fig. 7; see also Fig. S8 in the Supplementary material).
Detail of the ATR spectra in the νΟ-Η (νO-D) range during the in situ rehydration of cylindrical halloysite-(7 Å) 25US (left) and polygonal 23US (right). H- and D-forms are shown in blue and red, respectively. The spectra of the initial, dry -(7 Å) forms of each series are shown with a bold line. (a) Rehydration of H-(7 Å) form by H2O. (b1,b2) Rehydration of D-(7 Å) form by D2O. (c1,c2) Rehydration of H-(7 Å) form by D2O. Vertical bars indicate the y-axis scale of the spectra, common for each row. Compare with Fig. 5.
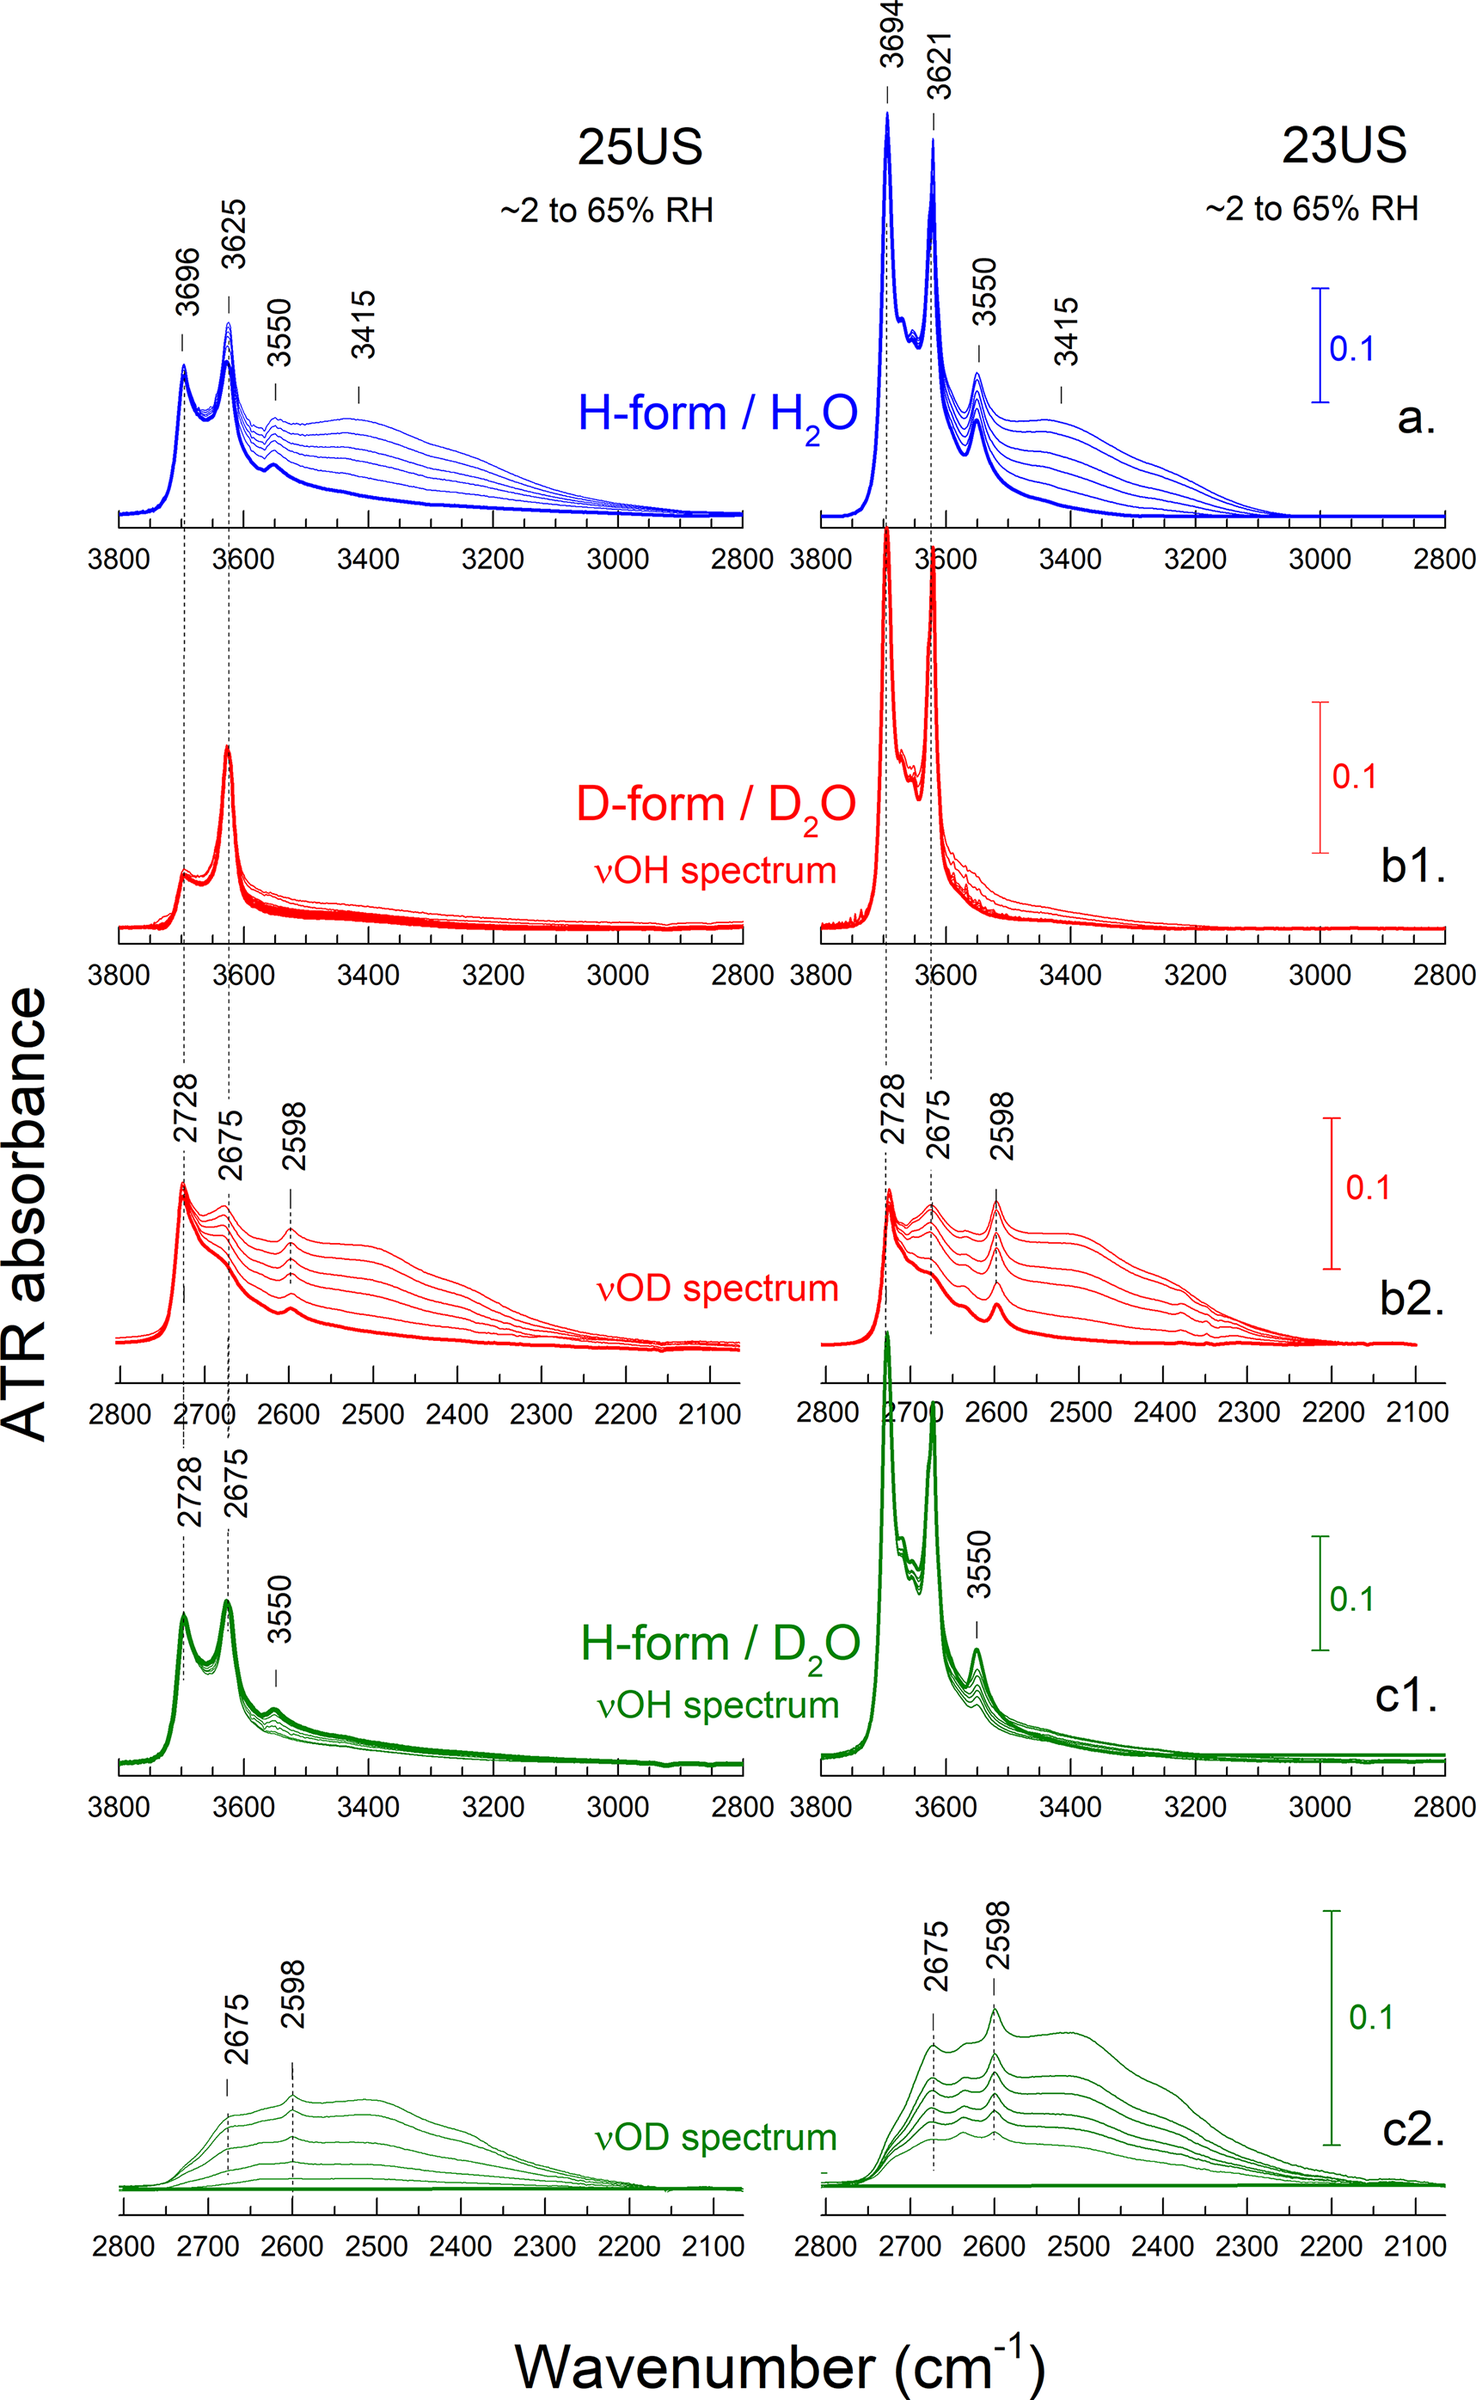
The spectra acquired in situ by hydrating the H- or D-forms of dry halloysite-(7 Å) (Figs 6 and 7) indicated that rehydration is, indeed, taking place. This was manifested by the increasing intensity of the ~3400, 3220, and 1630 cm–1 bands (2500, 2380, and 1200 cm–1 in the D-form). At similar relative humidity conditions, the intensity of these bands was considerably less in the rehydration than in the corresponding dehydration experiment (compare Fig. 7a, b2 with Fig. 5a, b2), suggesting that the 7 Å samples rehydrate only partially.
The inner-surface O-H (O-D) mode at ~3700 (~2730) cm–1 maintained its intensity and sharpness during rehydration. A relatively sharp band at ~2675 cm–1 appeared to increase upon rehydration (Fig. 7b2), relative to the aforementioned inner-surface νOD band (2728 cm–1, Fig. 7b2; νOH at 3694 cm–1, Fig. 7a). Finally, the so-called ‘hole’ H2O bands remained unchanged in position and width (~2600 cm–1, Fig. 7b2; 3550 cm–1, Fig. 7a; ~1215 and 1650 cm–1, Fig. 8) and did not shift back to their original 10 Å-position.
ATR spectra monitoring the δΗ2Ο (blue) or δD2Ο (red) ranges during the rehydration of halloysite 25US -(7 Å) (cylindrical) and 23US -(7 Å) (polygonal). These details belong to the spectra shown in Fig. 7a and 7b1,b2, respectively. Vertical bars indicate the y-axis scale of the spectra in each panel. Compare with Fig. 6.

The last type of experiment involved the rehydration of the H- (instead of the D-) form of halloysite-(7 Å) by D2O (Fig. 7c1 and c2). The advantage of this measurement stems from the fixation of the 7 Å inner-surface hydroxyls in the H-form prior to rehydration. As a result, these hydration-insensitive modes are absent from the νOD spectrum during rehydration by D2O (cf. Fig. 7b1–2 with c1–2). Interestingly, the ‘hole’ Η2O mode, which was unaffected by rehydration, turned out to be accessible to H/D exchange; its intensity at 3550 cm–1 decreased slowly and reappeared at ~2600 cm–1. In parallel, rehydration resulted in the progressive growth of the 2675 cm–1 band (Fig. 7c2) at the expense of a feature hidden under the inner OH stretch at ~3620 cm–1 (Fig. 7c1), indicating that this is also accessible to exchange. The accessibility of the ~2600 and 2675 cm–1 bands was observed in all halloysites investigated, both polygonal and cylindrical. In all cases there were no changes observed in the characteristic bands of the layer; the envelopes of inner OH deformations or the Si–O stretches remained unaffected (data not shown) and indistinguishable from those of the dry 7 Å halloysite (Figs 4 and S8).
Discussion
Anhydrous interlayer domains in halloysite-(10 Å)
To the best of the present authors’ knowledge, this paper includes the first IR study of natural halloysite-(10 Å) and its transition to halloysite-(7 Å), made possible by in situ equilibration to different RH% and H/D exchange experiments. The study of five different samples (three cylindrical and two polygonal), from various localities and in both the H2O- and D2O-saturated forms, enabled the extraction of the common traits of the dehydration process and their comparison with the corresponding XRD data and literature.
Remarkably, H/D exchange experiments indicated that a part of natural halloysite-(10 Å) was anhydrous, unresponsive to changes in hydration and resistant to H/D exchange. The relative amount of this anhydrous halloysite portion was expressed qualitatively in the spectrum of the D-halloysite-(7 Å) samples by the relative intensity of the non-exchanged inner-surface OH-stretch versus that of the exchanged inner-surface OD at ~3700 cm–1 and ~2730 cm–1, respectively (Fig. 5). Converting such relative intensities to relative amounts is not straightforward, however. The relative extinction coefficient of homologous OH and OD bands was approximated by Rouxhet et al. (Reference Rouxhet, Samudacheata, Jacobs and Anton1977 and references therein) with the ratio of the reduced masses, μ(OD)/μ(ΟΗ)≈1.9. Based on this approximation, and with the additional assumption that the species responsible for the bands at ~3700 and ~2600 cm–1 do not differ in terms of bonding, stacking order, etc., estimates of the non-accessible interlayer fraction could be obtained by comparing the intensities of the two bands in the spectrum of the 7 Å halloysite from D2O (e.g. the lowest RD% spectra of Fig. 5b1,b2). In the cylindrical samples, ~15% of the interlayers in 25US and 20–25% in 5CH and 6CH were already anhydrous in the 10 Å material equilibrated at 70% RH. The corresponding value for the polygonal 24US was ~30–35%. A much higher value (~50%) was obtained for the second polygonal sample (23US), but this presumably was biased by the contribution of exchange-resistant kaolinite (known to be present in this sample), to the intensity of the ~3700 cm–1 band. Remarkably, the presence of these moderate amounts of anhydrous interlayers in pure halloysites-(10 Å) is not easily detected by examining the profiles of the Si-O stretching and AlOH bending modes (Fig. 4) and would have probably remained unnoticed without the H/D exchange experiments.
The aforementioned anhydrous portion should, therefore, be attributed to some kind of interstratification of 7 Å layers or domains among predominantly 10 Å layers. The smallest possible such 7 Å spacings ought to be analogous to those in kaolinite, ~7.15 Å. With the exception of 23US, the XRD patterns provided no evidence for a kaolinite-type admixture in all samples and only 24US (30–35% anhydrous by infrared spectroscopy) had a weak XRD peak at ~7.25 Å (Fig. 1). In the same context, it is prudent to recall that the XRD patterns of all halloysite-(10 Å) samples investigated (Fig. 1) displayed a characteristic, although often subtle, ‘tail’ toward higher angles (smaller d spacings) which increased only very slightly after exposure to 70% RH at ambient temperature for 3 days (Fig. S1). Such a feature is compatible with the presence of interstratified layers of smaller thickness (<10 Å). Initial investigations by modeling the XRD patterns of such interstratification suggested that as much as 15–20% of 7 Å layers could be easily overlooked in samples that are predominantly in 10 Å form, in qualitative agreement with the infrared data. A similar tail to greater angles is apparent in most, if not all, published XRD patterns of 10 Å halloysite. It is also pertinent that the XRD pattern of the most hydrated sample examined by Churchman et al. (Reference Churchman, Aldridge and Carr1972) was modeled with 30% 7 Å layers, the presence of which was attributed to sample drying. The constant position of the 10 Å reflection in all samples (Fig. 1), regardless of the amount of anhydrous halloysite present, indicates a significant element of segregation of the 7 Å layers, rather than a simple random (R0) interstratification, in agreement with Churchman et al. (Reference Churchman, Aldridge and Carr1972).
Halloysite-(10 Å) in transition to halloysite-(7 Å)
Given the aforementioned presence of 7 Å interlayers in a primarily 10 Å halloysite, the best way to isolate the spectrum of halloysite-(10 Å) and study its transition to -(7 Å) was by converting the original halloysite-(10 Å) into its D-form and monitoring the O-D spectrum envelope upon controlled drying (Figs 5 and 6). This approach separated the spectrum of the inner OH from that of the accessible interlayer OH and H2O and eliminated interference from all possible types of anhydrous interlayers (intrinsic, kaolinite admixtures, etc.).
Although the eye-catching trend in the IR spectra along the 10 Å to 7 Å transition was the decrease of the H2O (D2O) stretching bands at ~3400, 3215 cm–1 (~2500, 2400 cm–1), the most direct evidence of the transition taking place was the increasing intensity of the inner-surface OH (OD) stretch at ~3700 (2730) cm–1 upon drying (Fig. 5), already noted by Farmer (Reference Farmer and Farmer1974). It was supposed that in the 10 Å state, the inner-surface OH groups are perturbed by the interlayer H2O molecules which resulted in a blurred infrared signature owing to H-bonding. As the interlayer H2O was removed and the anhydrous interlayer H-bonding network of the -(7 Å) phase began to form, the inner-surface OH bands grew sharper and appeared stronger, similar to their counterparts in the spectrum of kaolinite.
In addition to the interlayer, the transition was accompanied by changes in the Si-O stretching, as well as in the inner AlOH stretching and bending modes of the layer. For example, the transition to 7 Å caused the progressive shift of the 907 cm–1 AlOH deformation to higher frequencies. The transition was incomplete in cylindrical halloysite and accompanied by some broadening; but, in polygonal halloysite, a kaolinite-like band at 911 cm–1 was formed, accompanied by a low-frequency component at ~900 cm–1 (Fig. 4; Fig. S7). Similarly, the transition to 7 Å had a significant effect on the 1120 cm–1 in-plane Si-O mode depending on the predominant morphology of the tubes: All cylindrical halloysites-(7 Å) in this study displayed band broadening at approximately the same position (~1122 cm–1). On the contrary, all polygonal halloysites developed well-defined band splitting: in the second derivative spectra, the 1120 cm–1 singlet converted into a doublet with apparent positions at ~1115 and 1127 cm–1 (Fig. 4). Band-fitting analysis (Fig. S10) indicated that 24US-(10 Å) had a single, relatively sharp Si-O band at 1120 cm–1 (w≈16 cm–1) converting into a doublet with one sharp component at ~1115 cm–1 (w≈9 cm–1) as in kaolinite (cf. KGa-1b, KGa2, not shown), and a second, broader component at higher position (ν≈1125 cm–1, w≈24 cm–1).
Once the 7 Å phase had formed, rehydration by increasing relative humidity at ambient temperature left both the inner-surface OH (Figs 7 and 8) and the layer spectra unaffected, indicating that the interlayer could not re-expand to accommodate H2O again.
Infrared spectrum of H2O in halloysite
Describing the 10 Å to 7 Å transition in terms of H2O, instead of structural OH or Si-O vibrations is much more demanding owing to the well-known existence of various types of H2O in halloysite and their overlapping vibrational signatures. As summarized by Santagata and Johnston (Reference Santagata and Johnston2022), there are at least three main types of H2O in halloysite: interlayer, lumen, and unconfined, the third of these residing on the external surfaces of the tubes. Two kinds of interlayer H2O are assumed to exist: monolayer ‘associated’ H2O in the 10 Å interlayer and residual ‘hole’ H2O in the collapsed interlayer of the (7 Å) phase. According to the same authors, the different types of H2O do not produce separate dehydration events in thermogravimetric (TGA) experiments. Separation is possible by low-temperature differential scanning calorimetry (DSC) because, in contrast to unconfined bulk H2O, the lumen H2O freezes at –37°C and the interlayer water remains unfrozen down to –75°C.
Among these various types of H2O in halloysite, the presence of the so-called ‘hole’ H2O (D2O) is universally accepted and linked to the infrared bands at ~3550 and 1650 cm–1 (~2600, 1215 cm–1), as suggested first by Costanzo et al. (Reference Costanzo, Giese and Lipsicas1984). In fact, the infrared identification of halloysite-(7 Å) or of deintercalated kaolinite in the literature often relies on the detection of these 3550 and 1650 cm–1 bands (Frost et al., Reference Frost, Kristof, Kloprogge and Horvathz2002; Cheng et al., Reference Cheng, Frost, Yang, Liu and He2010; Hillier et al., Reference Hillier, Brydson, Delbos, Fraser, Gray, Pendlowski, Phillips, Robertson and Wilson2016). As an exception, Madejová et al. (Reference Madejová, Gates, Petit, Gates, Kloprogge, Madejova and Bergaya2017) reported the spectrum of a 7 Å halloysite lacking the 3550 cm–1 band, perhaps due to drying of the KBr-halloysite pellet at 120°C overnight. Despite its prominent signature in the IR spectra, ‘hole’ H2O in halloysite-(7 Å) exists in very small amounts. According to the measurements of Santagata and Johnston (Reference Santagata and Johnston2022), 25US halloysite-(10 Å) has ~5.5–7 molecules of H2O per Si2Al2O5(OH)4, of which 2 are assumed to be in the interlayer, ~0.2–0.4 are lining the lumen, and the remaining ~3–5 are unconfined or inside the lumen. In halloysite-(7 Å), <0.2 molecules of H2O remain as defects, to account for ‘hole’ and possibly other chemisorbed species.
The obvious starting point in analyzing the infrared spectral trends accompanying the -(10 Å) to -(7 Å) transition was the assignment of the O-H stretching bands at 3400 and 3220 cm–1 and the corresponding bending at ~1630 cm–1. These bands represent intramolecularly H-bonded H2O structures, such as those in the interlayer of smectite (e.g. Madejová, Reference Madejová2003) or the so-called ‘zeolitic’ H2O in the hydrated tunnels of palygorskite and sepiolite (Bukas et al., Reference Bukas, Tsampodimou, Gionis and Chryssikos2013). These bands underwent a strong decrease in intensity upon drying with minor shifts in position (Figs 3, 5 and 6) and were only partially recovered upon rehydration (Figs 7 and 8). Based on this partial recovery and the fact that the 10 Å to 7 Å transition is known to be irreversible, it could be concluded that these main H2O stretching bands of the 10 Å samples involved the interlayer of halloysite but were not specific to it and included contributions from the lumen or various other types of unconfined H2O.
In the aforementioned cases of smectite and palygorskite/sepiolite minerals, structure-specific information for the interlayer was obtained not from the spectrum of intermolecularly bonded H2O, but from the modes of ‘terminal’ or ‘dangling’ O-H bonds of H2O (O-Hw in Kuligiewicz et al., Reference Kuligiewicz, Derkowski, Szczebra, Gionis V and Chryssikos2015a) pointing towards the clay surface. These bands appear as sharp, high-frequency components of the H2O stretching envelope when the surface is neutral or weakly charged and, consequently, the H-bonding interactions are very weak. They are best seen in the O-D part of the spectrum of deuterated samples, which is free from the interference of structural OH modes. For example, two such bands of D2O residing in the uncharged tunnels of sepiolite were observed, at 2685 and 2635 cm–1 (H2O: 3630, 3565 cm–1; Bukas et al., Reference Bukas, Tsampodimou, Gionis and Chryssikos2013), whereas the weakly charged interlayer of smectite gave rise to a single band at ~2685–2700 cm–1 with its exact position dictated by the charge of the layer (Kuligiewicz et al., Reference Kuligiewicz, Derkowski, Szczebra, Gionis V and Chryssikos2015a,Reference Kuligiewicz, Derkowski, Emmerich, Christidis, Tsiantos, Gionis and Chryssikosb). No such bands are detectable when the H2O-surface interactions involve strong H-bonds, such as those with the edge OH species.
In the case of D-halloysite-(10 Å), two high-frequency D2O stretching bands at ~2675 and 2625 cm–1 were observed in all cylindrical and polygonal samples (Figs 3 and 5) and could be attributed to ‘dangling’ O-D bonds. The former decreased in intensity upon drying to the 10 Å form but reappeared in the same position upon rehydration. The latter yielded the aforementioned ‘hole’ water band at ~2600 cm–1 in a two-mode manner and would not return to 2625 cm–1 upon rehydration (Figs 5 and 7). The different fate of these bands upon rehydration suggested that these were probably due to D2O in different chemical environments, only one of which was irreversibly affected by the collapse of the 10 Å layer.
The 2625 cm–1 band that was lost irreversibly upon drying, converting to its 7 Å analog at ~2600 cm–1 should, therefore, be assigned to the interface between the interlayer D2O and the siloxane sheet of halloysite-(10 Å). It was assumed that the removal of this interlayer water created interlayer defects or domains trapping a small amount of residual D2O, such as the so-called ‘hole’ water (Costanzo and Giese, Reference Costanzo and Giese1985; Joussein et al., Reference Joussein, Petit, Fialips, Vieillard and Righi2006), with a νOD stretching mode at ~2600 cm–1. ‘Hole’ H2O was originally described as a bidentate ligand of the siloxane sheet of the interlayer, with its oxygen interacting with the inner-surface aluminol groups (Costanzo et al., Reference Costanzo, Giese and Lipsicas1984). The bidentate interaction with the siloxane sheet is compatible with the relatively high frequency of the bending mode (δH2O at 1650 cm–1, δD2O at 1215 cm–1; by Santagata and Johnston, Reference Santagata and Johnston2022, and references therein) as well as with the observation of a single δΗDO mode. Contrary to the common use of the term, ‘hole’ H2O should not be considered as shielded inside the ditrigonal cavities of the collapsed 7 Å nanotubes. Instead, it remained accessible to D2O vapors at ambient temperature forming ‘hole’ D2O whereas the inner -OH group remained unaffected (Fig. 7c).
‘Hole’ H2O defects, trapped inside the collapsed interlayer, were considered in the literature to cause local ~8.5 Å perturbations of layer spacings. The extent to which the segregation of such local interlayer anomalies could lead to interstratified ~8.5 Å layers or, even, coherent packets of layers as implied by Costanzo and Giese (Reference Costanzo and Giese1985) or Joussein et al. (Reference Joussein, Petit, Fialips, Vieillard and Righi2006), cannot be decided on the basis of the vibrational spectra. It should, however, be reflected in the shape and positions of the basal peaks of halloysite-(7 Å) in the corresponding XRD patterns; as it was in the work of Naamen et al. (Reference Naamen, Jemai, Ben Rhaiem and Ben Haj Amara2003) on synthetic kaolinite hydrates, as analogues for the dehydration of halloysite 10 Å to halloysite 7 Å. Indeed, preliminary modeling of the positions and profiles of the basal (00l) peaks observed during dehydration sequences was poor when residual 10 Å layers were considered, and improved by the introduction of 8.5 Å layers, instead (Fig. S10).
What remains to be addressed is the assignment of the dangling O-D band at ~2675 cm–1 (Fig. 7; Fig. S9). A tentative assignment of this band to H2O lining the lumen should be dismissed. This type of confined water ought to be in strong H-bonding interaction with the AlOH groups and should not produce a high-frequency ‘dangling’ bond band. Alternatively, the 2675 cm–1 band could be related to another internal morphological imperfection of the tubes which may exist in the original 10 Å-form but is greatly accentuated by drying. Early evidence from electron microscopy (Dixon and McKee, Reference Dixon and McKee1974; Kohyama et al., Reference Kohyama, Fukushima and Fukami1978) suggested that the tubes respond to the collapse of their hydrated -(10 Å) interlayer by crystallite detachment which causes the formation of ‘crevices’ between packets of layers. Similar slit- or lens-shaped pores in halloysite-(7 Å) were reported by Churchman et al. (Reference Churchman, Davy, Aylmore, Gilkes and Self1995) and adopted by Santagata and Johnston (Reference Santagata and Johnston2022). The recent study of Gray-Wannell et al. (Reference Gray-Wannell, Cubillas, Aslam, Holliman, Greenwell, Brydson, Delbos, Strachan, Fuller and Hillier2023) suggested that in many nanotubes, both cylindrical and polygonal, examined in cross-section by transmission electron microscopy (TEM), the spiraling entity was ordered packets of layers, often separated by crevices. These crevices may have formed during the dehydration of the halloysite, although in the case of a sample with polygonal nanotubes, Kohyama et al. (Reference Kohyama, Fukushima and Fukami1978) demonstrated that the crevices existed in the hydrated state but became larger in the dry state, to the extent that the apparent diameter of the nanotube increased remarkably upon drying. Support for the simultaneous formation of ordered (i.e. kaolinite-like) and disordered domains during the dehydration of halloysite-(10 Å) was provided by the broadening or splitting of the Si-O stretching and Al-OH bending modes which accompanies the transition to the 7 Å structure (Fig. 4; Fig. S8).
In contrast to the lumen which is lined solely by hydrophilic AlOH, these crevices created by layer detachment have both octahedral aluminol and tetrahedral siloxane inner surfaces, as noted by Gray-Wannell et al. (Reference Gray-Wannell, Cubillas, Aslam, Holliman, Greenwell, Brydson, Delbos, Strachan, Fuller and Hillier2023). It is reasonable to anticipate that once these open structures are present, they would be dehydrating and rehydrating freely. On this basis, the 2675 cm–1 band was tentatively assigned to the dangling O-D (O-H) bonds of crevice-confined water, which are pointing towards the neutral siloxane inner surfaces.
Conclusions
The systematic IR spectroscopic investigation of halloysite-(10 Å) in both its H2O- and D2O-forms has provided several O-H(D) vibrational proxies for understanding the transition to the 7 Å form. The removal of H2O from the originally hydrated interlayer of halloysite-(10 Å) leads to the decrease of intermolecularly associated H2O content and is accompanied by the sharpening of the inner AlOH stretching modes at ~3700 cm–1. The latter is one of the many infrared spectral trends suggesting the formation of kaolinite-like domains, especially in polygonal halloysites. The well-known spectrum of ‘hole’ H2O at 3550, 1650 cm–1 (D2O at ~2600, 1215 cm–1), which has been associated in the literature with the presence of ~8.5 Å layers, was observed in the spectra. In addition, another type of defect-related species with νΟ-D at ~2675 cm–1 was observed by H/D exchange. Its corresponding νO-H at ~3620 cm–1 was masked by the strong inner AlOH stretch. Rehydration of halloysite-(7 Å) led to the partial recovery of the associated H2O as well as to the growth of the new defect H2O species, despite the fact that neither the anhydrous nor the ‘hole’ H2O-containing interlayers showed signs of rehydration.
The IR spectra of halloysite-(10 Å), show the presence of a significant fraction (typically ~15–35%) of anhydrous layers which are resistant to H/D exchange at ambient conditions. These layers are considered to be interstratified in a segregated manner in order to account for the constant position of the 10 Å basal reflection in XRD patterns along with its characteristic skewing towards lower d spacings (Fig. 1), as well as for the relatively narrow profiles of the Si-O and Al-OH layer modes (Fig. 4). It is unknown whether the 7 Å domains in what otherwise superficially appeared to be pure ‘end member’ halloysite-(10 Å) are intrinsic, kaolinite-like defects associated with the formation of the original layered architecture of the tubes, or secondary formations due to subsequent partial H2O deintercalation events that have resulted in the presence of completely dehydrated (anhydrous) layers.
Halloysite-(7 Å), formed by the dehydration of the 10 Å phase, is not a well-defined end member. This is manifested by broad and asymmetric 001 reflection profiles, the position of which is highly dependent on dehydration conditions (maxima at ~7.9 Å after 50 h at ambient laboratory conditions, Fig. 2; or ~7.4 Å after 1 week at 60°C, Fig. 1, Fig. S9). The 00l patterns of these 7 Å materials could not be fitted satisfactorily by random (R0) interstratifications of the ideal end-member layers, suggesting that layers of >7 Å spacing (e.g. ~8.5 Å) are necessary (Fig. S10).
The IR spectra collected during the dehydration of halloysite towards 7 Å show that the originally regular siloxane structure relaxed into two spectroscopically distinct arrangements, one with kaolinite-like order and the other very disordered. The splitting was very clear in polygonal halloysites, whereas a single very broad distribution was observed in cylindrical halloysite (Fig. 4; Figs S7 and S10). It may be speculated that the formation of well-defined kaolinitic domains in halloysite-(7 Å) is facilitated by the presence of planar segments in polygonal halloysite. In general, such segments are not noted in most cylindrical halloysites, possibly owing to the smaller diameter of the tubes. Nevertheless, it may be noted that the cross-sections of several cylindrical tubes studied by TEM can begin to show some flattening (e.g. fig. 5 in Gray-Wannell et al., Reference Gray-Wannell, Cubillas, Aslam, Holliman, Greenwell, Brydson, Delbos, Strachan, Fuller and Hillier2023).
Based on the aforementioned results, it is clear that the conversion in terms of the pure end members postulated by Churchman et al. (Reference Churchman, Aldridge and Carr1972) is incomplete in all samples. Indeed, a hypothetical complete reorganization of the original 10 Å nanotubes into regular cylindrical or polygonal 7 Å ones would require the cleavage and reassembly of all H-bonds within the spiral interlayer and should pose an enormous activation barrier. A more plausible scenario, compatible with the present findings, involves local reordering taking place at the expense of increasing disorder accumulated elsewhere in the structure. Once the structure is locally stabilized by the formation of the ordered domains, it would not be able to return to the original 10 Å upon rehydration, because the ordered domains would act as cross-links and ‘lock’ the defects in place. Tubular halloysite-(7 Å) should be perceived as inherently disordered and far from the idealized carpet-roll model that is typically assumed (cf. Gray-Wannell et al., Reference Gray-Wannell, Cubillas, Aslam, Holliman, Greenwell, Brydson, Delbos, Strachan, Fuller and Hillier2023). All of these aspects of structure should be important determinants of the technological applications of HNTs which are almost inevitably always in the halloysite-(7 Å) form.
Within the layer, the loss of the stabilizing effect of the H2O interlayer is compensated by distortions that are active in the spectra. These are likely to involve tetrahedral rotation and flattening (Bailey, Reference Bailey, Farmer and Tardy1989; Singh, Reference Singh1996; Niu, Reference Niu, Yuan, Thill and Bergaya2016). The extent of these changes is larger in polygonal rather than cylindrical halloysite and allows the distinguishing of the two types of nanotubes. In terms of layer stacking, disorder is manifested by the interstratification of ~8.5 Å layers, which justify the presence of ‘hole’ H2O in the spectra, as well as by layer detachment and the formation of crevice-shaped pores (cf. Kohyama et al., Reference Kohyama, Fukushima and Fukami1978; Churchman et al., Reference Churchman, Davy, Aylmore, Gilkes and Self1995; Santagata and Johnston, Reference Santagata and Johnston2022; Gray-Wannell et al., Reference Gray-Wannell, Cubillas, Aslam, Holliman, Greenwell, Brydson, Delbos, Strachan, Fuller and Hillier2023) which have been associated with the newly discovered 2675 cm–1 νO-D band.
Supplementary material
To view supplementary material for this article, please visit http://doi.org/10.1017/cmn.2024.37.
Data availability statement
Data are available upon reasonable request.
Author contribution
All the authors have contributed as per their expertise.
Acknowledgements and financial support
Research at NHRF was financed by reinvesting income to the Applied Spectroscopy Laboratory of TPCI, a provider of research services to industry. SH thanks Helen Pendlowski for assistance in acquiring XRD data and acknowledges support from the Rural & Environment Science & Analytical Services Division of the Scottish Government.
Competing interest
The authors declare no competing interests.


 Open access

