


1. Introduction
Intermediate input costs exceed 50% of gross output revenues for industrial production in most countries (Jones, Reference Jones2011). The time window from purchases of intermediates to the receipt of sales revenue is non-negligible, which leads to additional working capital demand for firms despite the provision of trade credit from suppliers (Fazzari and Petersen, Reference Fazzari and Petersen1993; Gao, Reference Gao2017; Bigio and La’o, Reference Bigio and La’o2020; Almeida, et al. Reference Almeida, Carvalho and Kim2024). In economies with underdeveloped financial markets, natural questions are (i) how financial frictions affect the firm-level use of intermediate inputs and (ii) the extent of total factor productivity (TFP) loss when firms face financial constraints in intermediate inputs.
This paper addresses these questions by studying the Chinese manufacturing sector. First, we present empirical evidence that domestically owned firms are, on average, financially constrained in intermediate inputs as opposed to foreign-owned firms in China. Utilizing the National Tax Survey Database (NTSD, 2007–2011), we exploit the staggered implementation of 2007–2009 value-added tax (VAT) reform and the one-time 2008 corporate income tax (CIT) reform for identification.
Specifically, in 2007, firms in several industries in the central six provinces (e.g., Hunan, Anhui) in China were allowed to deduct the equipment investment costs from the VAT liability, which reduced firms’ tax burden and released internal funds for alternative uses. Previous studies show that this reform boosted capital investments for treated firms (Liu and Mao, Reference Liu and Mao2019; Chen, Jiang, Liu, Serrato, and Xu, Reference Chen, Jiang, Liu, Serrato and Xu2023). Similarly, for intermediate inputs, we find that treated firms increased their intermediate inputs by four percentage points as a fraction of gross output compared to the control group after the reform. This treatment effect was more pronounced for firms that were more financially constrained–specifically, younger, non-state-owned, and smaller in total assets. Our results also hold for the treatment event when the VAT reform was expanded to all domestic firms later in 2009 and when the CIT reform took place in 2008.
Second, we write a partial equilibrium model of industrial dynamics à la Hopenhayn (Reference Hopenhayn1992) to quantify the TFP loss induced by financially constrained intermediate inputs. To be clear, we focus on a representative industry and thus examine the within-industry TFP loss rather than the amplified aggregate TFP loss explored in multi-sector input-output studies such as Acemoglu et al. (Reference Acemoglu, Carvalho, Ozdaglar and Tahbaz-Salehi2012) and Bigio and La’o (Reference Bigio and La’o2020). We model financial frictions as costly equity and debt issuances (Cooley and Quadrini, Reference Cooley and Quadrini2001; Arellano, et al. Reference Arellano, Bai and Zhang2012). Due to the working capital requirement, firms pay a fraction of intermediate inputs a period ahead when they make next-period capital investment decisions. Firms borrow one-period debt for both inputs, with the option to default based on later realizations of gross-output productivity. Since financial intermediaries can only recover part of the debt upon firms’ default, firms are thus charged with an interest rate premium that reflects their default risks.
We calibrate our model to the Chinese Annual Survey of Industrial Firms (ASIF, 1998–2007) data, which has a longer panel and a more comprehensive coverage of the manufacturing sector than NTSD. We then simulate a sample of firms that resemble ASIF. In both ASIF and the model simulated data, we perform the standard Hsieh and Klenow (Reference Hsieh and Klenow2009) reallocation exercise, except that we use the gross-output production function. The gross-output TFP loss (or equivalently, the potential gross-output TFP gain) is defined as the percentage change in the industry-level gross output when we reallocate capital, labor, and intermediate inputs to equalize their marginal revenue products across firms while keeping the industry-level stocks of each input constant. Our calculations show that the potential within-industry TFP gain is 38% for an average industry in ASIF and 27% for the representative industry in our benchmark model. This result suggests that our model accounts for about 71% of the misallocation in the Chinese data.
We then implement several counterfactual experiments to decompose the overall misallocation in our benchmark model into components caused by intermediate input and capital frictions. We find that financially constrained intermediate inputs account for about 18% of the misallocation in the benchmark model, whereas the extensively studied financial frictions on capital account for only about 2% of the misallocation. This result aligns with the higher cost share of intermediate inputs in the gross-output production function and their repetitive purchasing needs. It is also consistent with the weak nexus between financially constrained capital and misallocation found in the literature (Midrigan and Xu, Reference Midrigan and Xu2014; Moll, Reference Moll2014). Our findings suggest that financial frictions cause more misallocation when intermediate inputs are also constrained.
Lastly, we investigate the implications of our findings for (i) the value-added productivity measurement and (ii) the quantification of misallocation using the Hsieh and Klenow (Reference Hsieh and Klenow2009)’s method. As pointed out by Gandhi, et al. (Reference Gandhi, Navarro and Rivers2020), using either gross-output or value-added production functions could paint a different picture of the productivity heterogeneities across firms. In our case, distortions on intermediate inputs contaminate the value-added productivity measure, making it no longer purely technological. Compared to the value-added productivity absent intermediate input distortions, we show that the distorted value-added productivity faces a downward bias. This bias becomes more severe when the intermediate input distortion increases in its absolute value. When the intermediate input distortion is size-dependent (Restuccia and Rogerson, Reference Restuccia and Rogerson2008; Guner, et al. Reference Guner, Ventura and Xu2008) as in the case of financial constraints, we find that the top decile firms in terms of gross output productivities exhibit a downward bias of value-added productivities by about 35% in ASIF and by 16% in our model.
The distorted value-added productivities affect the within-industry reallocation of capital and labor under the Hsieh and Klenow (Reference Hsieh and Klenow2009) method. Given the further downward bias in value-added productivities for more productive firms, the HK reallocation exercise assigns a smaller fraction of industry-level input stock to these firms than what is efficient. Using capital as an example, we find that the “efficient” capital reallocated to top decile firms in terms of gross output productivity averages 4% lower than what is truly efficient in ASIF and 1.7% lower in our model. In contrast, the remaining 90% of firms receive a reallocated capital that exceeds what is efficient.
We cannot determine whether the HK method overestimates or underestimates misallocation since our misallocation measure is a gross-output TFP loss while the HK measure is a value-added TFP loss. The conversion between the two requires a fully-blown multi-industry input-output model, as studied in Hang, et al. (Reference Hang, Krishna and Tang2020).Footnote 1 Borrowing from their findings, we convert our gross-output TFP loss to the value-added TFP loss that can be readily compared with the HK measure. Results show that the HK method underestimates the within-industry value-added TFP losses in both ASIF and the model simulated data. Therefore, in environments where intermediate inputs are likely distorted (such as China and India in Boehm and Oberfield, Reference Boehm and Oberfield2020), it is essential for researchers to use gross output production functions.
This paper is built on several strands of the misallocation literature. The first is the growing literature on intermediate inputs and misallocation. Most discussion focuses on the input-output transmission of sectoral distortions to the aggregate economy. For instance, Jones (Reference Jones2011) shows that distortions have a multiplier effect and cause a significant aggregate TFP decline through sectoral input-output linkages. Similar studies include Bartelme and Gorodnichenko (Reference Bartelme and Gorodnichenko2015), Bigio and La’o (Reference Bigio and La’o2020), and Osotimehin and Popov (Reference Osotimehin and Popov2023) among many others. Other studies document specific frictions on intermediate inputs. For instance, Boehm and Oberfield (Reference Boehm and Oberfield2020) finds that firm-level intermediate inputs are distorted in areas with weak law enforcement in India. We contribute to this literature by providing empirical evidence on financial frictions of intermediate inputs.
The second strand is on financially constrained capital and misallocation. One theoretical view states that the misallocation caused by this channel could be moderate because firms can self-finance. This view contradicts the ample empirical evidence of financially constrained firms (Gilchrist, et al. Reference Gilchrist, Sim and Zakrajsek2013; Wu, Reference Wu2018; Whited and Zhao, Reference Whited and Zhao2021). Self-financing does not undo misallocation when productivities are less persistent (Caselli and Gennaioli, Reference Caselli and Gennaioli2013), when there are fixed cost barriers (Midrigan and Xu, Reference Midrigan and Xu2014), when the initial state of the economy is badly misallocated (Buera and Shin, Reference Buera and Shin2013), and when borrowing constraints are endogenous and tighter for smaller and younger firms (Gopinath, et al. Reference Gopinath, c. Kalemli-Özcan and Villegas-Sanchez2017; Bai, et al. Reference Bai, Lu and Tian2018). This paper quantitatively shows that financial frictions cause a larger misallocation if intermediate inputs are also constrained.
The last strand of the literature is on size-dependent distortions and misallocation. In Restuccia and Rogerson (Reference Restuccia and Rogerson2008) and Guner, et al. (Reference Guner, Ventura and Xu2008), distortions that positively correlate with firm-level productivities reduce the aggregate TFP more than uncorrelated distortions. Baqaee and Farhi (Reference Baqaee and Farhi2020) shows how the size-dependent distortion matters for misallocation when the log normality assumption for productivities and distortions fails. We contribute by showing how a size-dependent intermediate input distortion biases value-added productivities, particularly for the most productive firms. Therefore, we are closely related to Hang, et al. (Reference Hang, Krishna and Tang2020), which also emphasizes how intermediate input distortions cause the divergence of misallocation measures under the two alternative gross-output and value-added approaches.
The rest of the paper is structured as follows. Section 2 introduces how we identify the financial constraints on intermediate inputs in the Chinese firm-level data. Section 3 introduces the model. Section 4 calibrates the model, computes the misallocation in the model, and decomposes the overall misallocation caused by different frictions. Section 5 discusses how financially constrained intermediate inputs distort value-added productivity and affect the quantification of misallocation. Section 6 concludes.
2. Empirical evidence from the tax reform
This section provides empirical evidence that firms face financial constraints in intermediate inputs. Using the firm-level tax data in China, we exploit tax reforms during the period of 2004–2009 and use the difference-in-difference strategy to identify how the tax reforms reduce the tax burden and hence boost the use of intermediate inputs for financially constrained firms.
2.1 Institutional background
VAT and CIT are the two major business taxes in China, accounting for approximately 25% and 19% of the total tax revenue in 2011, respectively (Chen, He, Liu, Serrato, and Xu, Reference Chen, He, Liu, Serrato and Xu2021). Below, we briefly describe the VAT and CIT systems and their recent reforms relevant to our empirical analysis. For a detailed examination of business taxes in China, we refer readers to Chen, He, Liu, Serrato, and Xu (Reference Chen, He, Liu, Serrato and Xu2021).
The VAT system classifies firms into two types of taxpayers: small-scale and general, depending on whether the firm’s annual receipt falls below a certain threshold. For manufacturing firms, this threshold was 1 million CNY before 2008 and increased to 5 million CNY after 2008. A small-scale taxpayer pays a rate of 4 or 6% over the sales of goods. In contrast, a general taxpayer pays a rate of 17% based on the value-added, that is, the VAT liability is calculated as the total value of sales net costs related to intermediate inputs.Footnote 2 Unlike intermediate inputs, costs related to equipment investment were not allowed to be deducted from the VAT liability.
Starting in 2004, China gradually removed this exclusion of equipment to reduce capital costs and to stimulate business investment. Initially, a pilot program in 2004 allowed firms in specific manufacturing industries in three northeastern provinces to deduct new equipment costs from their VAT liability. In July 2007, this reform expanded to firms in 26 cities within six central provinces, covering roughly the same industries. In July 2008, the reform included firms in five cities in Inner Mongolia and counties affected by the Wenchuan earthquake. Finally, in January 2009, the reform extended to all domestic firms across all industries. Detailed information about the affected industries and provinces at different reform stages is provided in the appendix in Figure A.1. Small-scale taxpayers were not affected throughout this period, as their VAT was based on overall sales. Foreign firms were also unaffected since they had been permitted to deduct equipment costs before the reform started.
In parallel with the VAT reform, the CIT system also underwent significant changes in 2008. Before 2008, the standard CIT rate was 33%, while foreign firms benefited from preferential rates of 15% or 24%, depending on their location in special economic zones and alignment with government-favored industries (Chen, He, Liu, Serrato, and Xu, Reference Chen, He, Liu, Serrato and Xu2021). In contrast, domestic firms paid the standard rate. Beginning in January 2008, this dual-track system was abolished, and a unified tax rate of 25% was applied to all firms, both foreign and domestic. These reforms benefited domestic firms by reducing their tax burden and freeing up internal funds for alternative uses.
2.2 Data
The primary dataset used in our empirical analysis is the NTSD data collected by the State Taxation Administration of China from 2007 to 2011, covering both the VAT and CIT reforms. Similar to the better-known ASIF dataset, NTSD includes firm-level balance sheet information with a detailed breakdown of different types of business taxes. Compared to ASIF, NTSD has the advantages of (i) covering small, service, and agricultural firms and (ii) reporting firm-level value-added and intermediate inputs after 2008.
We focus on the manufacturing subsample in the NTSD database. Following Chen, Jiang, Liu, Serrato, and Xu (Reference Chen, Jiang, Liu, Serrato and Xu2023), we concatenate this data with the ASIF data (2005–2007) to include more pre-reform years in the subsequent difference-in-differences analysis. We convert the 2011 industry classification code (GB/T 4754–2011) to the 2002 code (GB/T 4754–2002) to ensure the consistency of industries across the years. To ensure comparability of firm sizes across the two datasets, we drop small-scale taxpayers in the NTSD dataset. The resulting unbalanced panel from 2005 to 2011 includes 150,861 firms and 1,050,276 firm-year observations. Table 1 reports summary statistics of key variables in our dataset.
Summary statistics for the 2005–2011 manufacturing panel

Notes: The 2005–2011 panel is a concentrated dataset that combines the 2005–2007 ASIF and the 2007–2011 NTSD. Variables are winsorized at the top and bottom 1% levels. Fraction of sales exported and leverage are capped at 1. Profit margin is defined as the total profit divided by the total asset.
2.3 Difference-in-difference results
We are interested in exploring whether the reduction of tax burden increases firm-level intermediate inputs, especially for financially constrained firms. To this end, we run the following regression
 \begin{align} mshare_{ispt}= \gamma Treat_{spt} \times Post_{spt}+ \delta Treat_{spt}+ \mathbf {X}_{it}\boldsymbol {\beta } + \Delta _{st} + \Delta _{pt} + \epsilon _{ispt}, \end{align}
where $mshare_{ispt}$
is the intermediate input values divided by gross output for firm
$mshare_{ispt}$
is the intermediate input values divided by gross output for firm $i$
in industry
$i$
in industry $s$
located in province
$s$
located in province $p$
at time
$p$
at time $t$
.
$t$
. $Treat_{spt}$
is the treatment dummy, and
$Treat_{spt}$
is the treatment dummy, and $Post_{spt}$
is a dummy for the time periods after the policy reforms, both of which may vary depending on the firm’s province
$Post_{spt}$
is a dummy for the time periods after the policy reforms, both of which may vary depending on the firm’s province $p$
and industry
$p$
and industry $s$
. The coefficient
$s$
. The coefficient $\gamma$
thus captures how the reduced tax burden could affect the firm-level usage of intermediate inputs.
$\gamma$
thus captures how the reduced tax burden could affect the firm-level usage of intermediate inputs. $\mathbf {X}_{it}$
are firm-level control variables that include a state-owned dummy, age, log capital stock, log asset, leverage, fraction of output exported, and the profit margin.
$\mathbf {X}_{it}$
are firm-level control variables that include a state-owned dummy, age, log capital stock, log asset, leverage, fraction of output exported, and the profit margin. $\Delta _{st}$
and
$\Delta _{st}$
and $\Delta _{pt}$
are industry-year and province-year fixed effects that control for any time-varying changes that are heterogeneous across industries and provinces.
$\Delta _{pt}$
are industry-year and province-year fixed effects that control for any time-varying changes that are heterogeneous across industries and provinces.
The two reform events we study are the VAT reform in 2007 and the combined VAT and CIT reforms in 2008 and 2009. In the first event of the 2007 VAT reform, we define the treatment group as firms in the six central provinces in the specified industries and the control group as foreign firms and firms treated in the 2004 pilot program. In the second event, we do not separately study the 2008 CIT reform and the 2009 VAT reform since the two were chronologically close and both targeted all domestic firms. Meanwhile, the 2008 VAT tax reform targeted firms in Inner Mongolia and counties affected by the Wenchuan earthquake, which were also a subset of treated firms in the 2008 CIT reform. Thus, we define the treated group in 2008 and 2009 as domestic firms that were not treated in 2007, and as in the previous case, the control group includes foreign firms and firms treated in the 2004 pilot program. As one can see, we do not include later-treated domestic firms in the first control group and the earlier-treated domestic firms in the second control group to make the DID analysis as clean as possible. We also exclude observations that switch their treatment status before and after the two events.
Effect of tax reforms on firm-level intermediate input shares: baseline results

Notes: Standard error are in parentheses and clustered at the industry-province-year level. ***, **, and * denote significance at the 1%, 5%, and 10% levels, respectively.
Parallel trend and time-varying treatment effects

Notes: Control variables and the specification of fixed effects are the same as in columns (2) and (4) in Table 2. Standard error are in parentheses and clustered at the industry-province-year level. ***, **, and * denote significance at the 1%, 5%, and 10% levels, respectively.
Table 2 displays our baseline regression results. Compared to the control group, treated firms significantly increased their intermediate input shares by four percentage points after the 2007 reform and two percentage points after the 2008–09 reforms. This result is consistent with the idea that treated firms with extra funds from the reduced tax burden are now able to buy more intermediate inputs, suggesting a potential role of financial constraints. To further confirm this idea, we next (i) check the parallel trend assumption between the treatment and control groups and (ii) check if the increase of intermediate inputs is more pronounced for firms that tend to be more financially constrained.
To test the parallel trend assumption, we interact the treatment dummy with year dummies before and after reforms: $\mathbf {1}$
(before
$\mathbf {1}$
(before $t$
), where
$t$
), where $t=1, 2, 3$
and
$t=1, 2, 3$
and $\mathbf {1}$
(after
$\mathbf {1}$
(after $s$
) with
$s$
) with $s=0, 1, 2, 3, 4$
. For instance, for the 2007 VAT reform, firm-year observations in 2006 are assigned with
$s=0, 1, 2, 3, 4$
. For instance, for the 2007 VAT reform, firm-year observations in 2006 are assigned with $\mathbf {1}$
(before
$\mathbf {1}$
(before $1$
) = 1 and the rest before and after dummies being 0. We set the coefficient of
$1$
) = 1 and the rest before and after dummies being 0. We set the coefficient of $treat \times \mathbf {1}$
(before
$treat \times \mathbf {1}$
(before $1$
) to be 0. The rest of the regression specifications are the same as in columns (2) and (4) in Table 2. Table 3 lists the coefficient estimates for the interaction terms between
$1$
) to be 0. The rest of the regression specifications are the same as in columns (2) and (4) in Table 2. Table 3 lists the coefficient estimates for the interaction terms between $treat$
and each before/after dummy. We find that before each reform event, treated and control firms were not significantly different, supporting the parallel trend hypothesis. After the 2007 reform, treated firms were not significantly different from control firms in 2007, which could be explained by the fact that the reform came out in the middle of the year. However, treated firms significantly increased their intermediate inputs in 2008, 2009, and 2011, consistent with our results in Table 2. In 2010, the interaction term is marginally insignificant with a t-statistic of 1.31. For the 2008–09 reforms, treated firms significantly increased intermediate inputs immediately in 2008 and throughout the rest of our sample period, again consistent with our results in Table 2.
$treat$
and each before/after dummy. We find that before each reform event, treated and control firms were not significantly different, supporting the parallel trend hypothesis. After the 2007 reform, treated firms were not significantly different from control firms in 2007, which could be explained by the fact that the reform came out in the middle of the year. However, treated firms significantly increased their intermediate inputs in 2008, 2009, and 2011, consistent with our results in Table 2. In 2010, the interaction term is marginally insignificant with a t-statistic of 1.31. For the 2008–09 reforms, treated firms significantly increased intermediate inputs immediately in 2008 and throughout the rest of our sample period, again consistent with our results in Table 2.
For the last round of our empirical analysis, we study whether the treatment effects are more pronounced for smaller, younger, and non-state-owned firms, which are financially constrained in the literature (Cooley and Quadrini, Reference Cooley and Quadrini2001; Song, et al. Reference Song, Storesletten and Zilibotti2011; Bai, et al. Reference Bai, Lu and Tian2018; Jin, et al. Reference Jin, Zhao and Kumbhakar2019). We define a $small$
dummy as one if firms are below the median level of log assets and zero otherwise. Similarly, we define a
$small$
dummy as one if firms are below the median level of log assets and zero otherwise. Similarly, we define a $young$
dummy when a firm is younger than the median age of 7. We thus include a triple interaction term one at a time into our baseline regressions in columns (2) and (4) in Table 3. Table 4 shows that all the triple interaction terms are positive, suggesting that, indeed, smaller, younger, and non-state-owned treated firms increase their intermediate inputs more than the average treated firms.
$young$
dummy when a firm is younger than the median age of 7. We thus include a triple interaction term one at a time into our baseline regressions in columns (2) and (4) in Table 3. Table 4 shows that all the triple interaction terms are positive, suggesting that, indeed, smaller, younger, and non-state-owned treated firms increase their intermediate inputs more than the average treated firms.
Larger effects of tax reforms on firm-level intermediate shares for more constrained firms

Notes: Standard error are in parentheses and clustered at the industry-province-year level. ***, **, and * denote significance at the 1%, 5%, and 10% levels, respectively.
2.4 Robustness checks
We conduct a series of robustness checks. The first robustness check examines whether our results are influenced by the 2008 financial crisis and the subsequent 2009 stimulus plan implemented by the Chinese government. One alternative hypothesis suggests that the observed increase in $mshare$
in Table 2 for the 2008–09 reforms may be attributed to a decline in sales during the crisis rather than an increase in intermediate inputs. Given the weakening international demand at the time, this hypothesis is particularly relevant for exporting firms.
$mshare$
in Table 2 for the 2008–09 reforms may be attributed to a decline in sales during the crisis rather than an increase in intermediate inputs. Given the weakening international demand at the time, this hypothesis is particularly relevant for exporting firms.
To test this, we estimate a modified version of equation (1) that includes an additional triple interaction term, $Treat \times Post \times Exporter$
. The results, presented in Column (1) of Table 5, indicate that the increase in intermediate input share is smaller for exporters, thus rejecting the alternative hypothesis.
$Treat \times Post \times Exporter$
. The results, presented in Column (1) of Table 5, indicate that the increase in intermediate input share is smaller for exporters, thus rejecting the alternative hypothesis.
Robustness check for the 2008–09 reforms: financial crisis and stimulus plan

Notes: “All firms” in column (1) refers to the same sample as in Table 2. The size of “All firms” in column (2) shrinks because of missing stimulus loan data for 20 cities (out of 339 cities in the firm-level data, including four centrally-administrated cities, Beijing, Shanghai, Tianjin, and Chongqing). Standard error are in parentheses and clustered at the industry-province-year level. ***, **, and * denote significance at the 1%, 5%, and 10% levels, respectively.
Another alternative hypothesis related to the financial crisis is that China’s stimulus plans, rather than the reduced tax burden emphasized in our analysis, drove the increased use of intermediate inputs.Footnote 3 We argue that the increase in intermediate inputs in Table 3 started in 2008 before the stimulus plan, which invalidates the alternative hypothesis. For the period starting in 2009, the alternative hypothesis does not necessarily reject the notion of financially constrained intermediate inputs, as the increased credit supply may play the same role as the relaxed tax burden. Nevertheless, it is ideal to disentangle the impact of tax reforms from that of the stimulus plans.
We thus exploit the cross-city variation in stimulus scales and test whether our difference-in-difference coefficients change accordingly. Summarized by Bai, et al. (Reference Bai, Hsieh and Song2016), the national stimulus plan directed resources to favored industries (e.g., infrastructure and poverty-alleviating projects in less-developed regions) with a local solution that city administrations, motivated by their political career goals, funded these projects by local commercial banks. As a result, the scale of the stimulus plan varied across cities, which could be quantified as excessive loans as a percentage of city-level GDPs in 2009. “Excessive” means a loan balance that exceeds the predicted value using city-level loan balances and loan growth rates from 2004 to 2008 as in Chen, et al. (Reference Chen, He and Liu2020).
We borrow this city-level excessive loan data, $bl09$
, from Chen, et al. (Reference Chen, He and Liu2020) (downloaded from He’s website). We create a dummy,
$bl09$
, from Chen, et al. (Reference Chen, He and Liu2020) (downloaded from He’s website). We create a dummy, $HiStimu_{c}$
, which labels firms located in a city
$HiStimu_{c}$
, which labels firms located in a city $c$
with its excessive loan above the median (10% of 2009 city GDPs) and estimate:
$c$
with its excessive loan above the median (10% of 2009 city GDPs) and estimate:
 \begin{align} mshare_{iscpt}= & \gamma _1 Treat_{spt} \times Year08_{t} + \gamma _2 Treat_{spt} \times Post09_{t} + \gamma _3 Treat_{spt} \times HiStimu_{c} \times Post09_{t} \nonumber \\ & + \gamma _4 HiStimu_{c} \times Post09_{t} + \delta _1 Treat_{spt} + \delta _2 HiStimu_{c} + \delta _3 Treat_{spt} \times HiStimu_{c} \nonumber \\ & + \mathbf {X}_{it}\boldsymbol {\beta } + \Delta _{st} + \Delta _{pt} + \epsilon _{iscpt}, \end{align}
for the 2008–09 reforms. Here, $Year08_{t}$
is the dummy for the year 2008, and
$Year08_{t}$
is the dummy for the year 2008, and $Post09_{t}$
is the dummy indicating years starting from (including) 2009.
$Post09_{t}$
is the dummy indicating years starting from (including) 2009.
According to equation (2), the treatment effect on the treated group in 2008 is $\gamma _1$
. Starting from (including) 2009, the treatment effect on the treated firms in low-stimulus cities is
$\gamma _1$
. Starting from (including) 2009, the treatment effect on the treated firms in low-stimulus cities is $\gamma _2$
, and in high-stimulus cities, is
$\gamma _2$
, and in high-stimulus cities, is $\gamma _2+\gamma _3$
. If the previously found result on increased intermediate inputs was entirely driven by the stimulus plan,
$\gamma _2+\gamma _3$
. If the previously found result on increased intermediate inputs was entirely driven by the stimulus plan, $\gamma _1$
would be statistically insignificant from 0, and
$\gamma _1$
would be statistically insignificant from 0, and $\gamma _4$
would be positive and statistically significant. In addition,
$\gamma _4$
would be positive and statistically significant. In addition, $\gamma _3$
would be positive and significant.
$\gamma _3$
would be positive and significant.
Columns (2) and (3) of Table 5 present our results. In column (2), we find that first, the estimate of $\gamma _1$
,
$\gamma _1$
, $0.026$
, is comparable to the estimate in Table 3, suggesting the robustness of our early results. Second, contrary to the alternative hypothesis,
$0.026$
, is comparable to the estimate in Table 3, suggesting the robustness of our early results. Second, contrary to the alternative hypothesis, $\gamma _4$
is negative and statistically significant,
$\gamma _4$
is negative and statistically significant, $-0.008$
. In other words, controlled firms located in high-stimulus cities decreased their intermediate inputs after 2009, which refutes the hypothesis that stimulus plans increased intermediate inputs for all firms. Compared to controlled firms, the treatment effect for treated firms in these high-stimulus cities is an increase of their intermediate inputs by
$-0.008$
. In other words, controlled firms located in high-stimulus cities decreased their intermediate inputs after 2009, which refutes the hypothesis that stimulus plans increased intermediate inputs for all firms. Compared to controlled firms, the treatment effect for treated firms in these high-stimulus cities is an increase of their intermediate inputs by $0.025$
. This treatment effect is indeed larger than that for treated firms in low-stimulus cities,
$0.025$
. This treatment effect is indeed larger than that for treated firms in low-stimulus cities, $\gamma _2=0.009$
. Our results in column (3) of Table 5 are quantitatively similar if we drop state-owned firms from the sample. Therefore, we conclude that the stimulus alone did not explain the increased intermediate inputs, but it did explain jointly with the tax reforms.
$\gamma _2=0.009$
. Our results in column (3) of Table 5 are quantitatively similar if we drop state-owned firms from the sample. Therefore, we conclude that the stimulus alone did not explain the increased intermediate inputs, but it did explain jointly with the tax reforms.
In the second robustness check, a potential concern regarding the results of the 2007 VAT reform presented in Table 2 is that the observed increase in intermediate input share for firms in the six central provinces may be attributable to the CIT reform rather than the VAT reform. Unfortunately, we cannot rule out this hypothesis, as the absence of gap years between the two reforms prevents us from conducting a staggered difference-in-difference analysis. Yet, if we include firms from the six central provinces into the treatment group in the regression for the 2008–09 reforms, our results do not change.
In the last robustness check, we run a regression specification that includes firm fixed effects to control for unobserved firm heterogeneities. Columns (1)–(4) in Table 6 show that the treatment effect remains robust, and its coefficient estimates even increase for both reforms. Meanwhile, we run a placebo test for the 2008–09 reforms to confirm that our treatment effect is not due to other economic forces. Specifically, we look into the service subsample of NTSD, which covers construction, transportation, information, retail and wholesale, real estate, and business services industries.Footnote
4
We choose the service subsample because, first, these industries are subject to business tax, and their intermediate input levels should not be affected by the VAT reform. Second, since these industries have less competing needs in financing for capital investment, their intermediate input levels are less likely to be constrained and affected by the CIT reform.Footnote
5
We thus define the placebo treatment group as domestic firms located outside the central six provinces and the placebo control group as foreign firms. We rerun our regression in Table 2, and results are displayed in columns (5) and (6) of Table 6. As we conjectured, the coefficients of the interaction term $treatment \times post$
are insignificant.
$treatment \times post$
are insignificant.
Robustness check: firm heterogeneities and placebo test

Notes: Standard error are in parentheses and clustered at the firm level in columns (1) – (4) and at the industry-province-year level in columns (5) – (6). ***, **, and * denote significance at the 1%, 5%, and 10% levels, respectively.
3. Model
This section incorporates financially constrained intermediate inputs into a standard partial equilibrium model of industry dynamics (Hopenhayn, Reference Hopenhayn1992). We use this model to quantify the magnitude of TFP loss caused by the constrained intermediate inputs. Given the extensive literature on capital, we also include financial frictions on capital to compare TFP losses caused by financial frictions on both inputs.
To summarize, firms in our model borrow for capital and intermediate inputs. They endogenously default (Cooley and Quadrini, Reference Cooley and Quadrini2001; Arellano, et al. Reference Arellano, Bai and Zhang2012) on the debt. The borrowing interest rates reflect this default risk. We abstract away from the input-output production network here (Jones, Reference Jones2011; Acemoglu et al. Reference Acemoglu, Carvalho, Ozdaglar and Tahbaz-Salehi2012; Liu, Reference Liu2019; Osotimehin and Popov, Reference Osotimehin and Popov2023) and aim to quantify the magnitude of within-industry misallocation.
3.1 Firms
The representative industry $s$
in the economy is populated with a mass of firms,
$s$
in the economy is populated with a mass of firms, $\mathbb {M}_t$
, which grows over time at a rate of
$\mathbb {M}_t$
, which grows over time at a rate of $g$
to capture the fast growth of the Chinese manufacturing sector (Brandt, et al. Reference Brandt, Van Biesebroeck and Zhang2012). Firm
$g$
to capture the fast growth of the Chinese manufacturing sector (Brandt, et al. Reference Brandt, Van Biesebroeck and Zhang2012). Firm $i$
produces output
$i$
produces output $Y_{it}$
at time
$Y_{it}$
at time $t$
according to the production function
$t$
according to the production function
 \begin{align} Y_{it}=A_{it} K_{it}^{\beta _k}L_{it}^{\beta _l} M_{it}^{\beta _m}, \end{align}
where $K_{it}$
,
$K_{it}$
, $L_{it}$
, and
$L_{it}$
, and $M_{it}$
are capital, labor, and intermediate inputs with cost shares of
$M_{it}$
are capital, labor, and intermediate inputs with cost shares of $\beta _k$
,
$\beta _k$
, $\beta _l$
and
$\beta _l$
and $\beta _m$
,
$\beta _m$
, $\beta _k+\beta _l+\beta _m=1$
. Firms compete monopolistically within the representative industry, and the industry-level output is aggregated as
$\beta _k+\beta _l+\beta _m=1$
. Firms compete monopolistically within the representative industry, and the industry-level output is aggregated as
 \begin{align} Y_{st}= \bigg \{ \sum _{i=1}^{\mathbb {M}_t} Y_{it}^{\frac {\sigma -1}{\sigma }} \bigg \} ^ {\frac {\sigma }{\sigma - 1}}, \end{align}
with an elasticity of substitution $\sigma$
. Combining equations (3) and (4) gives firm
$\sigma$
. Combining equations (3) and (4) gives firm $i$
’s revenue production function
$i$
’s revenue production function
 \begin{align} P_{it}Y_{it}=exp(z_{it}) K_{it}^{\tilde {\beta }_k} L_{it}^{\tilde { \beta }_l } M_{it}^{\tilde {\beta }_m}, \end{align}
where $P_{it}$
is the output price and
$P_{it}$
is the output price and $\tilde {\beta }_x = \beta _x (\sigma -1 ) / \sigma$
, for
$\tilde {\beta }_x = \beta _x (\sigma -1 ) / \sigma$
, for $x \in \{K, L, M\}$
. Revenue productivity
$x \in \{K, L, M\}$
. Revenue productivity $exp(z_{it})$
equals
$exp(z_{it})$
equals $P_{st} Y_{st}^{1/\sigma } A_{it}^{(\sigma -1)/\sigma }$
, where
$P_{st} Y_{st}^{1/\sigma } A_{it}^{(\sigma -1)/\sigma }$
, where $P_{st}$
is the industry-level output price. For ease of exposition, the rest of our model refers to
$P_{st}$
is the industry-level output price. For ease of exposition, the rest of our model refers to $exp(z_{it})$
as the firm-level productivity and
$exp(z_{it})$
as the firm-level productivity and $A_{it}$
as the firm-level quantity productivity. In a stationary distribution of firms,
$A_{it}$
as the firm-level quantity productivity. In a stationary distribution of firms, $P_{st}$
and
$P_{st}$
and $Y_{st}$
are constants over time, and hence their levels have no effect on the later computation of misallocation as in Hsieh and Klenow (Reference Hsieh and Klenow2009).Footnote
6
$Y_{st}$
are constants over time, and hence their levels have no effect on the later computation of misallocation as in Hsieh and Klenow (Reference Hsieh and Klenow2009).Footnote
6
Following Midrigan and Xu (Reference Midrigan and Xu2014), we include a permanent component of firm-level productivity $z_{it}$
,
$z_{it}$
, $\bar {z}_i$
,
$\bar {z}_i$
, $\bar {z}_i \sim N(\mu _{\bar {z}},\sigma _{\bar {z}}^2)$
, and a transitory component
$\bar {z}_i \sim N(\mu _{\bar {z}},\sigma _{\bar {z}}^2)$
, and a transitory component $\mu _{it}$
that follows an AR(1) process with persistence
$\mu _{it}$
that follows an AR(1) process with persistence $\rho$
 \begin{align} \mu _{it+1}=\rho \mu _{it} + \epsilon _{it+1}, \quad \epsilon _{it+1} \sim N(0,\sigma _{\epsilon }^2). \end{align}
We assume that the labor input is static and not distorted; that is, firms choose $L_{it}$
given
$L_{it}$
given $z_{it}$
,
$z_{it}$
, $K_{it}$
, and
$K_{it}$
, and $M_{it}$
to maximize
$M_{it}$
to maximize
 \begin{align} \pi _{it}= \max _{L_{it}} \left \{ P_{it} Y_{it}(z_{it},K_{it},M_{it},L_{it})-wL_{it} \right \}. \end{align}
In the international finance literature (e.g., Neumeyer and Perri, Reference Neumeyer and Perri2005; Mendoza and Yue, Reference Mendoza and Yue2012), labor inputs are subject to a working capital constraint. We do not follow this approach here since financially constrained labor does not delink the gross-output and value-added productivities, which is the focus of our paper.
Financial frictions
We incorporate the financial friction on intermediate inputs by imposing a working capital requirement. Specifically, at $t$
, firms pay
$t$
, firms pay $\omega \lt 1$
fraction for the next period intermediate input
$\omega \lt 1$
fraction for the next period intermediate input $M_{it+1}$
at the same time when they set capital
$M_{it+1}$
at the same time when they set capital $K_{it+1}$
. The rest,
$K_{it+1}$
. The rest, $1-\omega$
fraction, is paid at time
$1-\omega$
fraction, is paid at time $t+1$
. At
$t+1$
. At $t+1$
, firms choose the usage of intermediate inputs up to its pre-determined level, i.e.,
$t+1$
, firms choose the usage of intermediate inputs up to its pre-determined level, i.e., $\tilde {M}_{it+1}\leq M_{it+1}$
, to maximize their profit
$\tilde {M}_{it+1}\leq M_{it+1}$
, to maximize their profit $\Pi _{it+1}$
:
$\Pi _{it+1}$
:
 \begin{align} \Pi _{it+1}=\max _{\tilde {M}_{it+1} \leq M_{it+1}} & \left \{ \pi _{it+1}(z_{it+1},K_{it+1},\tilde {M}_{it+1}) - (1-\omega ) M_{it+1} +(M_{it+1}-\tilde {M}_{it+1}) \right \}. \end{align}
This timing arrangement reflects the fact that firms purchase the inventory of materials ahead of production and further ahead of the collection of sales revenue (Fazzari and Petersen, Reference Fazzari and Petersen1993; Gao, Reference Gao2017; Almeida, et al. Reference Almeida, Carvalho and Kim2024). $\omega$
hence pins down the average working capital need of firms to finance upfront for the material inventory
$\omega$
hence pins down the average working capital need of firms to finance upfront for the material inventory $M_{it}$
.
$M_{it}$
.
How do firms finance capital and the $\omega$
fraction of intermediate inputs investment? Similar to Cooley and Quadrini (Reference Cooley and Quadrini2001) and Arellano, et al. (Reference Arellano, Bai and Zhang2012), we model financial frictions as costly equity and debt issuances. First, entrepreneurs incur a cost of
$\omega$
fraction of intermediate inputs investment? Similar to Cooley and Quadrini (Reference Cooley and Quadrini2001) and Arellano, et al. (Reference Arellano, Bai and Zhang2012), we model financial frictions as costly equity and debt issuances. First, entrepreneurs incur a cost of $c_e$
for each unit of new equity issuance. Second, when they borrow, there is a limited enforcement problem. As detailed later, the price of bond
$c_e$
for each unit of new equity issuance. Second, when they borrow, there is a limited enforcement problem. As detailed later, the price of bond $q_{it}(z_{it}, B_{it+1}, K_{it+1}, M_{it+1})$
decreases with the expected default probability, implying a higher interest rate of borrowing. In the special case with a zero default probability, debt price
$q_{it}(z_{it}, B_{it+1}, K_{it+1}, M_{it+1})$
decreases with the expected default probability, implying a higher interest rate of borrowing. In the special case with a zero default probability, debt price $q_{it}=1/(1+r_2)$
where
$q_{it}=1/(1+r_2)$
where $r_2$
is the risk-free borrowing rate. The rate
$r_2$
is the risk-free borrowing rate. The rate $r_2$
exceeds the saving rate
$r_2$
exceeds the saving rate $r_1$
by assuming a per-dollar intermediation cost of
$r_1$
by assuming a per-dollar intermediation cost of $c_I$
.
$c_I$
.
With frictions specified above, the end-of-period dividend $D_{it}$
is
$D_{it}$
is
 \begin{align} d_{it} & =\Pi _{it}(z_{it},K_{it},M_{it})-I_{it}-C(K_{it},K_{it+1})-\frac {\omega M_{it+1}}{1+r_1}- B_{it}+q_{it}(z_{it},B_{it+1},K_{it+1},M_{it+1}) B_{it+1}, \end{align}
 \begin{align} D_{it}& =\bigg ( 1+ \textbf {1} (d_{it}\lt 0)c_e \bigg )d_{it}, \end{align}
where $I_{it}=K_{it+1}-(1-\delta )K_{it}$
is the investment and
$I_{it}=K_{it+1}-(1-\delta )K_{it}$
is the investment and $C(K_{it},K_{it+1})$
is the associated adjustment cost that equates to
$C(K_{it},K_{it+1})$
is the associated adjustment cost that equates to $\xi K_{it}+ \frac {\theta }{2} (K_{it+1}-K_{it})^2/K_{it}$
. Equation (9) and (10) thus specify that firms borrow
$\xi K_{it}+ \frac {\theta }{2} (K_{it+1}-K_{it})^2/K_{it}$
. Equation (9) and (10) thus specify that firms borrow $B_{it}$
and issue new equity to finance capital and the
$B_{it}$
and issue new equity to finance capital and the $\omega$
fraction of intermediate input investments.Footnote 7
$\omega$
fraction of intermediate input investments.Footnote 7
Value functions and default
For simplicity, the rest of the model is in a recursive form and abstracts away the firm subscript $i$
.
$i$
.
At the beginning of each period, a firm chooses to default or repay after $z$
is realized. Given the state variables
$z$
is realized. Given the state variables $(z,B,K,M)$
and the bond price schedule
$(z,B,K,M)$
and the bond price schedule $q^{\prime}(z,B^{\prime},K^{\prime},M^{\prime})$
, the value of repayment is
$q^{\prime}(z,B^{\prime},K^{\prime},M^{\prime})$
, the value of repayment is
 \begin{align} & V^r(z,B,K,M) =\max _{B^{\prime},K^{\prime},M^{\prime}} \bigg \{ D+\beta (1- \psi ) E_{z^{\prime}|z}V(z^{\prime},B^{\prime},K^{\prime},M^{\prime}) \bigg \}, \end{align}
and the value of default is
 \begin{align} V^d(z,B,K,M) =\max _{B^{\prime},K^{\prime},M^{\prime}} & \left \{ D^d + \beta (1- \psi ) E_{z^{\prime}|z}V(z^{\prime},B^{\prime},K^{\prime},M^{\prime}) \right \}, \end{align}
 \begin{align} \text {s.t.} \quad D^d & = \bigg ( 1+ \textbf {1}(d^d\lt 0)c_e \bigg ) d^d, \end{align}
 \begin{align} d^d &= -\frac {\omega M^{\prime}}{1+r_1}- K^{\prime}-C(0,K^{\prime})+q(z,B^{\prime},K^{\prime},M^{\prime}) B^{\prime}. \end{align}
In other words, once default, the firm loses capital $K$
and the fraction of intermediate inputs it has paid
$K$
and the fraction of intermediate inputs it has paid $\omega M$
and thus generates zero revenue at time
$\omega M$
and thus generates zero revenue at time $t$
. The unpaid intermediate inputs,
$t$
. The unpaid intermediate inputs, $(1-\omega )M$
, are returned to suppliers without a repudiation cost for simplicity.
$(1-\omega )M$
, are returned to suppliers without a repudiation cost for simplicity.
By equation (12), we allow default when firms continue operations. After the default decision, the firm is subject to an exogenous exit shock with a probability $\psi$
. With equations (11) and (12), the value function
$\psi$
. With equations (11) and (12), the value function $V=\max \{V^r, V^d\}$
and the default variable
$V=\max \{V^r, V^d\}$
and the default variable $\chi$
equals to 1 if
$\chi$
equals to 1 if $V=V^d$
and 0 otherwise.
$V=V^d$
and 0 otherwise.
3.2 Entrants
In each period $t$
, there are
$t$
, there are $\mu _{ent} \mathbb {M}_t$
mass of entrants. Each entrant draws an initial permanent productivity
$\mu _{ent} \mathbb {M}_t$
mass of entrants. Each entrant draws an initial permanent productivity $\bar {z}$
from a distribution
$\bar {z}$
from a distribution $N(0,\sigma _z^2)$
and a transitory productivity
$N(0,\sigma _z^2)$
and a transitory productivity $\mu _0$
from another distribution
$\mu _0$
from another distribution $N(0,\sigma _{\mu }^2)$
. The entrant also draws an initial wealth
$N(0,\sigma _{\mu }^2)$
. The entrant also draws an initial wealth $B_0\lt 0$
independently from a Pareto distribution with the density function
$B_0\lt 0$
independently from a Pareto distribution with the density function $g(-B_0)$
,
$g(-B_0)$
,
 \begin{align} g(-B_0)= \begin{cases} \frac {\alpha a_{\mathrm {min}}^\alpha }{(-B_0)^{\alpha +1}} & if -B_0 \ge a_{\mathrm {min}}, \\ 0 & if -B_0 \lt a_{\mathrm {min}}, \end{cases} \end{align}
where $a_{min}$
is the minimum wealth.
$a_{min}$
is the minimum wealth.
Firms do not enter and produce right away. A preparation period exists for entrants to build up capital stock and intermediate inputs out of scratch, according to their initial productivity $z_0=\bar {z}+\mu _0$
and wealth draw
$z_0=\bar {z}+\mu _0$
and wealth draw $B_0$
. Their choices of borrowing
$B_0$
. Their choices of borrowing $B^{\prime}_{ent}(z_0,-B_0,0,0)$
, capital
$B^{\prime}_{ent}(z_0,-B_0,0,0)$
, capital $K^{\prime}_{ent}(z_0,-B_0,0,0)$
, and intermediate inputs
$K^{\prime}_{ent}(z_0,-B_0,0,0)$
, and intermediate inputs $M^{\prime}_{ent}(z_0,-B_0,0,0)$
for the first production period are given by maximizing the value function
$M^{\prime}_{ent}(z_0,-B_0,0,0)$
for the first production period are given by maximizing the value function $V^e(z_0,B_0,0,0)$
,
$V^e(z_0,B_0,0,0)$
,
 \begin{align} V^e(z_0,B_0,0,0) =\max _{B^{\prime},K^{\prime},M^{\prime}} & \bigg \{ D^e+\beta (1-\psi ) E_{z^{\prime}|z_0}V(z^{\prime},B^{\prime},K^{\prime},M^{\prime}) \bigg \}, \end{align}
 \begin{align} \text {s.t.} \qquad D^e & = \bigg ( 1+\textbf {1}(d^e\lt 0)c_e \bigg ) d^e, \end{align}
 \begin{align} d^e & = -\frac {\omega M^{\prime}}{1+r_1}- K^{\prime}-B_0+q(z,B^{\prime},K^{\prime},M^{\prime}) B^{\prime}. \end{align}
We assume no capital adjustment costs for entrants.
3.3 Financial intermediaries
There exists a continuum of risk-neutral competitive intermediaries that take deposits and lend. Given debt price functions $q^{\prime}(z,B^{\prime},K^{\prime},M^{\prime})$
, the problem for a competitive lender is to choose a supply function
$q^{\prime}(z,B^{\prime},K^{\prime},M^{\prime})$
, the problem for a competitive lender is to choose a supply function $B^{\prime s}=B^{\prime s}(z,K^{\prime},M^{\prime};q^{\prime})$
to maximize its expected profit:
$B^{\prime s}=B^{\prime s}(z,K^{\prime},M^{\prime};q^{\prime})$
to maximize its expected profit:
 \begin{align} &\max _{B^{\prime}} \bigg \{ (1-\psi ) \bigg ( (1-E_{z^{\prime}|z}\chi ^{\prime} )B^{\prime} \nonumber \\ &\qquad +E_{z^{\prime}|z} \left [ \chi ^{\prime}\min \{B^{\prime}-\lambda _2 \omega M^{\prime} - (\lambda _1(1-\delta )-\xi )K^{\prime},0\} \right ] \bigg )-(1+r_2) q^{\prime}B^{\prime} \bigg \}. \end{align}
The first term is debt repayment $B^{\prime s}$
with a probability
$B^{\prime s}$
with a probability $(1-\psi )(1-E_{z^{\prime}|z}\chi ^{\prime})$
. The second term gives an expected loss when the borrower defaults, in which case the intermediary recovers
$(1-\psi )(1-E_{z^{\prime}|z}\chi ^{\prime})$
. The second term gives an expected loss when the borrower defaults, in which case the intermediary recovers $\lambda _1$
of the undepreciated capital net of a fixed adjustment cost and
$\lambda _1$
of the undepreciated capital net of a fixed adjustment cost and $\lambda _2$
of intermediate inputs the borrower has paid.
$\lambda _2$
of intermediate inputs the borrower has paid.
3.4 Equilibrium
A recursive equilibrium is a debt price function $q^{\prime}(z,B^{\prime},K^{\prime},M^{\prime})$
, policy functions of incumbent firms
$q^{\prime}(z,B^{\prime},K^{\prime},M^{\prime})$
, policy functions of incumbent firms $B^{\prime d}(z,B,K,M; q^{\prime})$
,
$B^{\prime d}(z,B,K,M; q^{\prime})$
, $K^{\prime}(z,B,K,M; q^{\prime})$
, and
$K^{\prime}(z,B,K,M; q^{\prime})$
, and $M^{\prime}(z,B,K,M; q^{\prime})$
, a transition indicator function for incumbents
$M^{\prime}(z,B,K,M; q^{\prime})$
, a transition indicator function for incumbents $\mathbb {T}(z,B,K,M;B^{\prime},K^{\prime},M^{\prime})$
, policy functions of entrants
$\mathbb {T}(z,B,K,M;B^{\prime},K^{\prime},M^{\prime})$
, policy functions of entrants $B^{\prime}_{ent}(z_0,-B_0,0,0; q^{\prime})$
,
$B^{\prime}_{ent}(z_0,-B_0,0,0; q^{\prime})$
, $K^{\prime}_{ent}(z_0,-B_0,0,0; q^{\prime})$
, and
$K^{\prime}_{ent}(z_0,-B_0,0,0; q^{\prime})$
, and $M^{\prime}_{ent}(z_0,-B_0,0,0; q^{\prime})$
, a default rule
$M^{\prime}_{ent}(z_0,-B_0,0,0; q^{\prime})$
, a default rule $\chi (z,B,K,M)$
, a transition indicator function for entrants
$\chi (z,B,K,M)$
, a transition indicator function for entrants $\mathbb {T}_{ent}(z,B,0,0;B^{\prime},K^{\prime},M^{\prime})$
, a supply function of funds
$\mathbb {T}_{ent}(z,B,0,0;B^{\prime},K^{\prime},M^{\prime})$
, a supply function of funds $b^s(z,K^{\prime},M^{\prime};q^{\prime})$
, a debt price function
$b^s(z,K^{\prime},M^{\prime};q^{\prime})$
, a debt price function $q^{\prime}(z,B^{\prime},K^{\prime},M^{\prime})$
, an endogenous mass of firms
$q^{\prime}(z,B^{\prime},K^{\prime},M^{\prime})$
, an endogenous mass of firms $M^{\prime}$
, and a probability density function of firms
$M^{\prime}$
, and a probability density function of firms $f^{\prime}(z^{\prime},B^{\prime},K^{\prime},M^{\prime})$
such that
$f^{\prime}(z^{\prime},B^{\prime},K^{\prime},M^{\prime})$
such that
-
a. given the debt price function $q^{\prime}(z,B^{\prime},K^{\prime},M^{\prime})$
, policy functions of
$B^{\prime d}(z,B,K,M; q^{\prime})$
,
$K^{\prime}(z,B,K,M; q^{\prime})$
, and
$M^{\prime}(z,B,K,M; q^{\prime})$
, and the default rule
$\chi (z,B,K,M)$
solve the problem of incumbent firms. Policy functions of
$B^{\prime}_{ent}(z_0,-B_0,0,0; q^{\prime})$
,
$K^{\prime}_{ent}(z_0,-B_0,0,0; q^{\prime})$
, and
$M^{\prime}_{ent}(z_0,-B_0,0,0; q^{\prime})$
solve the problem of entrant firms;
$q^{\prime}(z,B^{\prime},K^{\prime},M^{\prime})$
, policy functions of
$B^{\prime d}(z,B,K,M; q^{\prime})$
,
$K^{\prime}(z,B,K,M; q^{\prime})$
, and
$M^{\prime}(z,B,K,M; q^{\prime})$
, and the default rule
$\chi (z,B,K,M)$
solve the problem of incumbent firms. Policy functions of
$B^{\prime}_{ent}(z_0,-B_0,0,0; q^{\prime})$
,
$K^{\prime}_{ent}(z_0,-B_0,0,0; q^{\prime})$
, and
$M^{\prime}_{ent}(z_0,-B_0,0,0; q^{\prime})$
solve the problem of entrant firms; -
b. given the debt price function
$q^{\prime}(z,B^{\prime},K^{\prime},M^{\prime})$
, the supply function of funds
$B^s(z,K^{\prime},M^{\prime};q^{\prime})$
solves the lenders’ problem; -
c. the debt price function
$q^{\prime}(z,B^{\prime},K^{\prime},M^{\prime})$
clears the supply and the demand of funds at the firm-level, if
$B^{\prime}\gt 0$
: -
d. the distribution
$f^{\prime}$
and the mass of firms
$\mathbb {M}^{\prime}$
evolve recursively as in equations (20), (21), and (22), given an initial mass
$\mathbb {M}_0$
, an initial firm distribution
$f_0$
, a mass of entrants
$\mu _{ent}$
, a default rule
$\chi (z,B,K,M)$
, and policy functions of incumbents and entrants: (20)
\begin{align} & f^{\prime}( z^{\prime},B^{\prime},K^{\prime},M^{\prime}) = \mu _{ent} \int _z \int _B \phi (z) g(-B) \mathbb {T}_{ent}(z,B,0,0;B^{\prime},K^{\prime},M^{\prime}) dz dB + (1-\psi ) \nonumber \\ & \quad\!\!\! \int _z \int _B \int _K\! \int _M \! (1-\chi ^{\prime}(z^{\prime},B^{\prime},K^{\prime},M^{\prime})) f(z,B,K,M)\mathbb {T}(z,B,K,M;B^{\prime},K^{\prime},M^{\prime}) \phi (z^{\prime}|z)dz dB dK dM, \end{align}
(21)
\begin{align} & f^{\prime}(z^{\prime},0,0,0) \nonumber \\ &\quad\!\! = \!\int _z \int _B \int _K \int _M \!\chi ^{\prime}(z^{\prime},B^{\prime},K^{\prime},M^{\prime}) f(z,B,K,M)\mathbb {T}(z,B,K,M;B^{\prime},K^{\prime},M^{\prime}) \phi (z^{\prime}|z)dz dB dK dM, \end{align}
(22)
\begin{align} & \mathbb {M}^{\prime}=\mathbb {M} \times (1+\mu _{ent}-\psi ), \end{align}
where
$\phi (z^{\prime}|z)$
is the conditional probability according to the AR(1) process. A stationary distribution is defined as (i)
$\mathbb {M^{\prime}}=\mathbb {M}$
and (ii)
$f^{\prime}(z,B,K,M)=f(z,B,K,M)$
for any state
$(z,B,K,M)$
.


4. Quantitative analysis
This section quantitatively evaluates the extent of misallocation caused by financial frictions on intermediate inputs. We describe how we parametrize our model, introduce the mechanism of financial frictions, and decompose misallocation generated by each friction in the model. Our results show the channel of financially-constrained intermediate inputs important, generating a larger TFP loss than the better-studied channel of financially-constrained capital.
4.1 Parametrization
We first introduce the mapping between our model and the Chinese data. Unlike the empirical analysis, we use the ASIF (1998–2007) data to calibrate our model since ASIF has a longer panel and is more representative of the manufacturing sector in China. Given a set of parameters, we simulate firms from the model-implied stationary distribution and obtain the top 20% subsample in sales that can be directly compared to the ASIF data.Footnote
8
In the simulated data, intermediate inputs usage $\tilde {M}$
, not the pre-paid level
$\tilde {M}$
, not the pre-paid level $M$
, corresponds to the observed firm-level intermediate inputs in ASIF.
$M$
, corresponds to the observed firm-level intermediate inputs in ASIF.
In terms of parameters, we parametrize the cost of equity issuance $c_e=0.3$
as in Cooley and Quadrini (Reference Cooley and Quadrini2001). The capital adjustment cost is parametrized by
$c_e=0.3$
as in Cooley and Quadrini (Reference Cooley and Quadrini2001). The capital adjustment cost is parametrized by $\xi =0.039$
and
$\xi =0.039$
and $\theta =0.049$
following Cooper and Haltiwanger (Reference Cooper and Haltiwanger2006). Capital depreciation rate
$\theta =0.049$
following Cooper and Haltiwanger (Reference Cooper and Haltiwanger2006). Capital depreciation rate $\delta$
equals to
$\delta$
equals to $0.09$
. Firms’ discount factor
$0.09$
. Firms’ discount factor $\beta$
is 0.94, which implies a risk-free borrowing interest rate
$\beta$
is 0.94, which implies a risk-free borrowing interest rate $r_2=0.06$
according to People’s Bank of China during the period of 1998–2007. Similarly, the saving interest rate
$r_2=0.06$
according to People’s Bank of China during the period of 1998–2007. Similarly, the saving interest rate $r_1$
equals
$r_1$
equals $0.03$
to match the average deposit rate. The exit rate
$0.03$
to match the average deposit rate. The exit rate $\psi$
is 0.08 to match the average exit rate during the period of 2008–2012 according to a firm survival analysis report by the State Administration for Industry and Commerce of China.Footnote
9
Given these values, we have
$\psi$
is 0.08 to match the average exit rate during the period of 2008–2012 according to a firm survival analysis report by the State Administration for Industry and Commerce of China.Footnote
9
Given these values, we have $\beta (1-\psi )(1+r_2)\lt 1$
that ensures unconstrained firms invest efficiently as in Arellano, et al. (Reference Arellano, Bai and Zhang2012).
$\beta (1-\psi )(1+r_2)\lt 1$
that ensures unconstrained firms invest efficiently as in Arellano, et al. (Reference Arellano, Bai and Zhang2012).
In the gross-output production function, the intermediate input share $\tilde {\beta }_m$
is 0.61 following Jones (Reference Jones2011). Following Hsieh and Klenow (Reference Hsieh and Klenow2009), we assume that
$\tilde {\beta }_m$
is 0.61 following Jones (Reference Jones2011). Following Hsieh and Klenow (Reference Hsieh and Klenow2009), we assume that $\tilde {\beta }_k$
and
$\tilde {\beta }_k$
and $\tilde {\beta }_l$
are equal and set as
$\tilde {\beta }_l$
are equal and set as $0.5(1-1/\sigma -\tilde {\beta }_m)$
to reflect that the labor fraction of GDP is 50% in Chinese national accounts. We then calibrate the return-to-scale parameter
$0.5(1-1/\sigma -\tilde {\beta }_m)$
to reflect that the labor fraction of GDP is 50% in Chinese national accounts. We then calibrate the return-to-scale parameter $1-1/\sigma =0.85$
to match the fact that 84.5% of total gross output is produced by the top 10% firms in sales in the manufacturing sector, which are equivalently the top 50% firms in the ASIF data. The rationale is that as
$1-1/\sigma =0.85$
to match the fact that 84.5% of total gross output is produced by the top 10% firms in sales in the manufacturing sector, which are equivalently the top 50% firms in the ASIF data. The rationale is that as $1-1/\sigma$
increases, gross output in the economy is more concentrated within the largest firms. The annual growth rate in the manufacturing population during this period is approximately 9%, according to the economic censuses of 2004 and 2008. Combined with the exit rate, the relative mass of entrants
$1-1/\sigma$
increases, gross output in the economy is more concentrated within the largest firms. The annual growth rate in the manufacturing population during this period is approximately 9%, according to the economic censuses of 2004 and 2008. Combined with the exit rate, the relative mass of entrants $\mu _{ent}$
is thus 17%. We set the threshold sales
$\mu _{ent}$
is thus 17%. We set the threshold sales $y_c$
such that the fraction of firms with sales greater than
$y_c$
such that the fraction of firms with sales greater than $y_c$
is 20%.
$y_c$
is 20%.
Capital and intermediate input recovery rates, $\lambda _1$
and
$\lambda _1$
and $\lambda _2$
, determine how binding the borrowing constraint is. Inspired by Bai, et al. (Reference Bai, Lu and Tian2018), we calibrate
$\lambda _2$
, determine how binding the borrowing constraint is. Inspired by Bai, et al. (Reference Bai, Lu and Tian2018), we calibrate $\lambda _2$
to match the level of leverage (i.e., debt-to-asset ratio) and
$\lambda _2$
to match the level of leverage (i.e., debt-to-asset ratio) and $\lambda _1$
to match its slope with respect to asset percentiles in the ASIF data.Footnote
10
In the model, the leverage ratio is defined as debt over the sum of capital and the pre-paid intermediate inputs. Our numerical experiments find that the leverage level is sensitive to
$\lambda _1$
to match its slope with respect to asset percentiles in the ASIF data.Footnote
10
In the model, the leverage ratio is defined as debt over the sum of capital and the pre-paid intermediate inputs. Our numerical experiments find that the leverage level is sensitive to $\lambda _2$
and its slope with respect to asset sensitive to
$\lambda _2$
and its slope with respect to asset sensitive to $\lambda _1$
. This gives us
$\lambda _1$
. This gives us $\lambda _1=0.60$
and
$\lambda _1=0.60$
and $\lambda _2=0.10$
.
$\lambda _2=0.10$
.
Model parameters

The productivity process is calibrated to match the productivity moments in the ASIF data. We discretize the permanent productivity $\bar {z}_i$
into 5 grids, and the transitory productivity
$\bar {z}_i$
into 5 grids, and the transitory productivity $\mu _{it}$
into 15 grids, using Tauchen (Reference Tauchen1986)’s method. The persistence of transitory productivity
$\mu _{it}$
into 15 grids, using Tauchen (Reference Tauchen1986)’s method. The persistence of transitory productivity $\rho$
and its standard deviation are chosen to match the 1-year persistence and the cross-sectional dispersion of productivities in the data. The mean and standard deviation of the permanent productivity distribution are jointly calibrated to match the average and the 5-year persistence of firm-level productivities in the data.
$\rho$
and its standard deviation are chosen to match the 1-year persistence and the cross-sectional dispersion of productivities in the data. The mean and standard deviation of the permanent productivity distribution are jointly calibrated to match the average and the 5-year persistence of firm-level productivities in the data.
For entrants, the productivity distribution of entrants is the same as that of incumbents. The shape parameter $\alpha$
and minimum wealth
$\alpha$
and minimum wealth $a_{min}$
of the initial wealth distribution determine the first-period output for entrants. The fraction of intermediate inputs paid a period ahead
$a_{min}$
of the initial wealth distribution determine the first-period output for entrants. The fraction of intermediate inputs paid a period ahead $\omega$
impacts how fast a firm grows post entry and the relative market share for firms of different ages. Thus, the three parameters, namely,
$\omega$
impacts how fast a firm grows post entry and the relative market share for firms of different ages. Thus, the three parameters, namely, $\alpha$
,
$\alpha$
, $a_{min}$
, and
$a_{min}$
, and $\omega$
are jointly determined to match the facts that 6.94% of newly-established firms younger than five years old have sales greater than
$\omega$
are jointly determined to match the facts that 6.94% of newly-established firms younger than five years old have sales greater than $y_c$
, that these firms are 65.56% of an average ASIF firm in sales, and that 37.09% of ASIF entrants are older than five over a 5-year period in the data.Footnote
11
$y_c$
, that these firms are 65.56% of an average ASIF firm in sales, and that 37.09% of ASIF entrants are older than five over a 5-year period in the data.Footnote
11
Table 7 lists all parameters and their values, and Table 8 shows the differences of moments between the model and the data. The model overall well replicates the data in targeted moments, except for the market share of top 10% firms, which is generally a moment hard to match. In addition, the model is also close to the data in the following five non-targeted moments: (i) the slope of the intermediate inputs usage to gross-output ratio (%, $\tilde {M}/Y$
) with respect to asset percentiles; (ii) the slope of the capital to gross-output ratio (%,
$\tilde {M}/Y$
) with respect to asset percentiles; (ii) the slope of the capital to gross-output ratio (%, $K/Y$
) with respect to asset percentiles; (iii) the standard deviation of interest rates; (iv) the coefficient of variation of log marginal revenue product of intermediate inputs (
$K/Y$
) with respect to asset percentiles; (iii) the standard deviation of interest rates; (iv) the coefficient of variation of log marginal revenue product of intermediate inputs ( $\log MRPM$
); (v) the coefficient of variation of log marginal revenue product of capital (
$\log MRPM$
); (v) the coefficient of variation of log marginal revenue product of capital ( $\log MRPK$
).
$\log MRPK$
).
Model moments compared to data

Notes: Model statistics are for the top 20% firms in the sales distribution. Leverage is computed as debt over asset. In the model, asset corresponds to the sum of capital and pre-paid intermediate inputs. The leverage(%)-asset slope is obtained by regressing the leverage ratio (%) on the asset percentiles. Intm-output-ratio(%)-asset slope and capital-output-ratio(%)-asset slope are similarly defined. Over a 5-year window, newly-established firms are the ones with ages younger than five by the end year. End-year entrants are firms that are not in the ASIF at the beginning of the 5-year window but show up by the end year. These firms could be newly-established ones or those that expand with their sales surpassing the threshold level during the 5-year window.
4.2
Financial frictions: roles of
$c_e, \lambda _1$
, and
$\lambda _2$


This subsection illustrates the mechanism of financial frictions via comparative statics of $c_e, \lambda _1$
, and
$c_e, \lambda _1$
, and $ \lambda _2$
. We choose statistics that reflect the financial condition, the equilibrium size, and the marginal revenue product statistics of firms in the top 20% subsample of our simulated data.
$ \lambda _2$
. We choose statistics that reflect the financial condition, the equilibrium size, and the marginal revenue product statistics of firms in the top 20% subsample of our simulated data.
Role of
$c_e$

We firstly set $c_e$
to two alternative levels, 0 and 1. Table 9 shows that as the cost of equity issuance increases from 0 to 1, the equilibrium fraction of firms that issue new equity decreases from 80.06% to 73.35%. Simultaneously there is an increasing fraction of firms default. The average leverage ratio decreases from 0.57 to 0.36, consistent with Bolton, et al. (Reference Bolton, Wang and Yang2021) that argues how a costly equity issuance decreases firms’ capacity to borrow. Meanwhile, the correlation between the leverage and the asset percentile increases with
$c_e$
to two alternative levels, 0 and 1. Table 9 shows that as the cost of equity issuance increases from 0 to 1, the equilibrium fraction of firms that issue new equity decreases from 80.06% to 73.35%. Simultaneously there is an increasing fraction of firms default. The average leverage ratio decreases from 0.57 to 0.36, consistent with Bolton, et al. (Reference Bolton, Wang and Yang2021) that argues how a costly equity issuance decreases firms’ capacity to borrow. Meanwhile, the correlation between the leverage and the asset percentile increases with $c_e$
, reflecting the increasing importance of assets in debt financing when equity becomes costly. As a result, the capital stock for an average firm decreases substantially from 874.61 to 360.92. In addition, misallocation of capital and intermediate inputs increases with increasing standard deviations of marginal products, from 0.15 to 0.25 for intermediate inputs and from 0.36 to 0.72 for capital.
$c_e$
, reflecting the increasing importance of assets in debt financing when equity becomes costly. As a result, the capital stock for an average firm decreases substantially from 874.61 to 360.92. In addition, misallocation of capital and intermediate inputs increases with increasing standard deviations of marginal products, from 0.15 to 0.25 for intermediate inputs and from 0.36 to 0.72 for capital.
Comparative statics when varying $c_e, \lambda _1$
, and
$c_e, \lambda _1$
, and $\lambda _2$

Notes: Statistics are for the top 20% firms in the sales distribution. Leverage(%)-asset slope is obtained by regressing the leverage ratio (%) on the asset percentiles. $c_e$
is the equity issuance cost.
$c_e$
is the equity issuance cost. $\log MRPM$
(
$\log MRPM$
( $\log MRPK$
) represents log marginal revenue product of intermediate inputs (capital).
$\log MRPK$
) represents log marginal revenue product of intermediate inputs (capital). $\lambda _1$
and
$\lambda _1$
and $\lambda _2$
are recovery rates for capital and intermediate inputs.
$\lambda _2$
are recovery rates for capital and intermediate inputs.
Role of
$\lambda _1$

We secondly change the capital recovery rate into two other levels, 0 and 1. Table 9 shows that when the recovery rate increases from 0 to 1, the fraction of firms with new equity issuance increases from 72.16% to 77.50%. The fraction of defaulting firms is 0 when $\lambda _1=0$
because the leverage decreases to a lower level of 0.45. Meanwhile, since capital plays no role as collateral when
$\lambda _1=0$
because the leverage decreases to a lower level of 0.45. Meanwhile, since capital plays no role as collateral when $\lambda _1=0$
, the leverage(%)-asset slope is −0.16, reflecting a greater need to borrow for smaller firms. This slope increases to 0.35 when capital becomes the perfect collateral, i.e.,
$\lambda _1=0$
, the leverage(%)-asset slope is −0.16, reflecting a greater need to borrow for smaller firms. This slope increases to 0.35 when capital becomes the perfect collateral, i.e., $\lambda _1=1$
. In equilibrium, the average capital increases from 459.63 to 674.08. The average
$\lambda _1=1$
. In equilibrium, the average capital increases from 459.63 to 674.08. The average $\log MRPK$
decreases from 0.50 to 0.36 with a decreasing standard deviation from 0.46 to 0.37, suggesting that capital misallocation is smaller when the capital recovery rate is higher. The result is the opposite for
$\log MRPK$
decreases from 0.50 to 0.36 with a decreasing standard deviation from 0.46 to 0.37, suggesting that capital misallocation is smaller when the capital recovery rate is higher. The result is the opposite for $\log MRPM$
. When
$\log MRPM$
. When $\lambda _1$
increases from 0 to 1, the mean and standard deviation of
$\lambda _1$
increases from 0 to 1, the mean and standard deviation of $\log MRPM$
increases because firms invest more in capital than intermediate inputs.
$\log MRPM$
increases because firms invest more in capital than intermediate inputs.
Role of
$\lambda _2$

Moment changes by varying $\lambda _2$
are similar to those by varying
$\lambda _2$
are similar to those by varying $\lambda _1$
, which can be summarized as follows: (i) the change of leverage ratio is more sensitive to
$\lambda _1$
, which can be summarized as follows: (i) the change of leverage ratio is more sensitive to $\lambda _2$
while the leverage(%)-asset slope is more sensitive to
$\lambda _2$
while the leverage(%)-asset slope is more sensitive to $\lambda _1$
and (ii) the mean and standard deviation of
$\lambda _1$
and (ii) the mean and standard deviation of $\log MRPM$
are not sensitive to
$\log MRPM$
are not sensitive to $\lambda _2$
, suggesting that once there is a working capital constraint, the key parameter to determine its misallocation is the cost of equity and the capital recovery rate.
$\lambda _2$
, suggesting that once there is a working capital constraint, the key parameter to determine its misallocation is the cost of equity and the capital recovery rate.
4.3 Quantifying misallocation caused by constrained intermediate inputs
We next explore the magnitude of misallocation caused by financially constrained intermediate inputs. Methodologically, we first calculate the potential TFP gain in our model simulated data, which can be summarized as follows:
 \begin{align} \Delta \log TFP_s = \log \bigg \{ \sum _{i=1}^{\mathbb {M}} A_{i}^{\sigma -1} \bigg \}^ {\frac {1}{\sigma -1}} - \log \bigg \{ \sum _{i=1}^{\mathbb {M}} (A_{i} \frac {TFPR_{i}}{ TFPR_s})^{\sigma -1} \bigg \}^{\frac {1}{\sigma -1}}, \end{align}
where $TFPR_{i}$
summarizes distortions in firm-level capital and intermediate inputs. In each counterfactual experiment, we change the model by removing certain frictions (e.g., financial frictions on intermediate inputs) and then simulate another set of firms from this alternative model. In this new data, we calculate the alternative TFP gain. We attribute the difference between the two TFP gains as the additional misallocation caused by the removed frictions.
$TFPR_{i}$
summarizes distortions in firm-level capital and intermediate inputs. In each counterfactual experiment, we change the model by removing certain frictions (e.g., financial frictions on intermediate inputs) and then simulate another set of firms from this alternative model. In this new data, we calculate the alternative TFP gain. We attribute the difference between the two TFP gains as the additional misallocation caused by the removed frictions.
Experiments
We introduce how we design our experiments as follows. Experiment 1 removes the financial friction on intermediate inputs. To do so, we modify the post-equity issuance dividend $D$
as
$D$
as
 \begin{align} d_{it} & =\Pi _{it}(z_{it},K_{it},B_{it})-I_{it}-C(K_{it},K_{it+1})- B_{it}+q_{it}(z_{it},B_{it+1},K_{it+1},M_{it+1}) B_{it+1}, \end{align}
 \begin{align} D_{it}& = \left ( 1+\textbf {1}(d_{it}\lt 0)c_e \right ) d_{it} -\frac {\omega M_{it+1}}{1+r_1}. \end{align}
The equations specify that firms finance intermediate inputs out of a separate zero-cost equity issuance (or equivalently, debt financing without enforcement frictions). Similarly, Experiment 2 removes the financial friction on capital with the modified $D$
being
$D$
being
 \begin{align} d_{it} & =\Pi _{it}(z_{it},K_{it},B_{it}) -\frac {\omega M_{it+1}}{1+r_1} - B_{it}+q_{it}(z_{it},B_{it+1},K_{it+1},M_{it+1}) B_{it+1}, \end{align}
 \begin{align} D_{it}& =(1+\textbf {1}(d_{it}\lt 0)c_e)d_{it} -I_{it}-C(K_{it},K_{it+1}). \end{align}
Experiment 3 then removes the financial constraint and the working capital friction on intermediate inputs. In other words, intermediate inputs in this counterfactual experiment are flexible and undistorted. Similarly, Experiment 4 removes adjustment costs and financial constraints on capital together. In these experiments, equity and debt issuances are still costly.Footnote
12
Lastly, Experiment 5 removes the above capital and intermediate input frictions by modifying $d_{it}$
and
$d_{it}$
and $D_{it}$
as in equations (26) and (27), letting
$D_{it}$
as in equations (26) and (27), letting $\omega =0$
and setting
$\omega =0$
and setting $C(K_{it},K_{it+1})=0$
. Experiment 5 only has the time-to-build friction for capital.
$C(K_{it},K_{it+1})=0$
. Experiment 5 only has the time-to-build friction for capital.
In this partial equilibrium framework, output levels are not comparable across experiments. Thus, we compare between experiments by looking into potential TFP gains in their simulated data. Conceptually, we are interested in understanding how much the static misallocation would be if firms hypothetically lived in the counterfactual economy.
Results
Table 10 presents our results that can be summarized as follows. First, a comparison between Benchmark and Experiment 5 implies that one-period time-to-build for capital combined with stochastic productivities drives the most misallocation, about 73%, in the Benchmark model. This number is unexpectedly high, given the rich specification of frictions in the model. However, this result is consistent with Asker, et al. (Reference Asker, Collard-Wexler and De Loecker2014), which find that the dynamic nature of capital with a series of stochastic productivities accounts for most of the cross-country TFP differences.
Potential total factor productivity gains in the benchmark model and counterfactual experiments

Notes: Model statistics are for the top 20% firms in the sales distribution. Experiment 1 removes financial frictions on intermediate inputs (1). Experiment 2 removes financial frictions on capital (3). Experiment 3 removes financial frictions and the working capital restriction (2) on intermediate inputs. Experiment 4 removes financial frictions and capital adjustments on capital (4). Experiment 5 removes all the above frictions, with only the time-to-build restriction for capital.
Second, we find greater importance of financial frictions on intermediate inputs than on capital in generating misallocation. Differencing the Benchmark and Experiment 1 implies that 18% (4.78/26.76) of the Benchmark misallocation is due to financially constrained intermediate inputs, substantially higher than the fraction, 2%, from financially constrained capital obtained by differencing the Benchmark and Experiment 2. This discussion contributes to the existing studies that find that the amount of misallocation from financially constrained capital is small if firms can self-finance (e.g., Midrigan and Xu, Reference Midrigan and Xu2014; Moll, Reference Moll2014). Our results show that if there are also financially constrained intermediate inputs, the importance of financial frictions would substantially increase.
Third, although we embed the financial frictions on intermediate inputs by imposing a working capital restriction, the restriction itself does not generate a substantial misallocation. In Experiment 3, when intermediate inputs can be flexibly chosen after the realization of the contemporaneous productivity, the magnitude of misallocation drops only slightly to 20.32%. Thus, among the overall misallocation of 6.44% induced by intermediate input frictions, 26% is from the working capital restriction and 74% ([26.76–21.98]/[26.76–20.32]) is from financial frictions.
Fourth, in accounting for the misallocation in ASIF, we find that intermediate input frictions account for 17% of misallocation in China, while capital frictions (financial frictions plus adjustment costs) account for 7%. Our Benchmark model overall accounts for 71% misallocation in ASIF.
5. Further discussions
Most misallocation literature models firms as value-added producers and quantifies misallocation by treating the value-added productivities as technological. This section first discusses that the presence of financial frictions on intermediate inputs implies that the value-added productivity measure would be contaminated with the distortions. With the size-dependent feature of financial frictions, this section then discusses how the Hsieh and Klenow (Reference Hsieh and Klenow2009)’s method could underestimate the magnitude of within-industry misallocation.
5.1 Implications for the measurement of value-vdded productivity
To see how the value-added productivity is distorted, we introduce the firm-level value-added production function as
 \begin{align} Y_{i}^\nu =A^\nu _{i} K_{i}^{\alpha _k^s}L_{i}^{\alpha _l^s}, \end{align}
where $Y_{i}^\nu$
is the value-added quantity and
$Y_{i}^\nu$
is the value-added quantity and $A^\nu _{i}$
is its productivity. We drop the subscript
$A^\nu _{i}$
is its productivity. We drop the subscript $t$
for simplicity.
$t$
for simplicity. $\alpha _k^s$
and
$\alpha _k^s$
and $\alpha _l^s$
are the industry-specific value-added cost shares of capital and labor, respectively. We assume that the value-added revenue is
$\alpha _l^s$
are the industry-specific value-added cost shares of capital and labor, respectively. We assume that the value-added revenue is $P_{i}Y_{i}- P_m M_{i}$
as observed in firm-level data; that is, the distortion
$P_{i}Y_{i}- P_m M_{i}$
as observed in firm-level data; that is, the distortion $\tau ^M_{i}$
is non-pecuniary. This value-added approach aggregates the firm-level value-added
$\tau ^M_{i}$
is non-pecuniary. This value-added approach aggregates the firm-level value-added $Y_{i}^\nu$
to the industry-level value-added
$Y_{i}^\nu$
to the industry-level value-added $Y_s^\nu$
:
$Y_s^\nu$
:
 \begin{align} Y_s^\nu =\left (\sum _{i=1}^{\mathbb {M}} (Y_{i}^\nu )^{\frac {\sigma ^\nu -1}{\sigma ^\nu }}\right )^{\frac {\sigma ^\nu }{\sigma ^\nu -1}}, \end{align}
with the elasticity of substitution $\sigma ^\nu$
. For simplicity, we assume
$\sigma ^\nu$
. For simplicity, we assume $\sigma ^\nu =\sigma$
. The industry-level value-added price is thus
$\sigma ^\nu =\sigma$
. The industry-level value-added price is thus $P_s^{\nu }=(\sum _{i=1}^{\mathbb {M}} (P_{i}^{\nu })^{1-\sigma })^{1/(1-\sigma )}$
.
$P_s^{\nu }=(\sum _{i=1}^{\mathbb {M}} (P_{i}^{\nu })^{1-\sigma })^{1/(1-\sigma )}$
.
How is the value-added productivity $A_{i}^v$
related to the true productivity
$A_{i}^v$
related to the true productivity $A_{i}$
? In the appendix, we show that
$A_{i}$
? In the appendix, we show that
 \begin{align} A_{i}^\nu (\tau _{i}^m)= \left ( \frac {(P_s Y_s ^{\frac {1}{\sigma }})^\frac {1}{1-\tilde {\beta }^s_m}}{P_s^\nu (Y_s^\nu )^{\frac {1}{\sigma }}} \Gamma _s(\tau _{i}^m)\right )^{\frac {\sigma }{\sigma -1}} A_{i}^{\alpha _a^s}, \end{align}
where $ \alpha _a^s= 1/(1-\tilde {\beta }_m^s)$
and cost shares are
$ \alpha _a^s= 1/(1-\tilde {\beta }_m^s)$
and cost shares are
 \begin{align*} \alpha _k^s=\frac {\beta _k^s(1-\beta _m^s)}{1-\tilde {\beta }_m^s} \text {, } \alpha _l^s=\frac {(1-\beta _k^s)(1-\beta _m^s)}{1-\tilde {\beta }_m^s}\text {, } \tilde {\beta }_m^s = \beta _m^s\frac {\sigma -1}{\sigma }\text {, }\alpha _k^s+\alpha _l^s\lt 1, \end{align*}
and
 \begin{align} \Gamma _{s}(\tau _{i}^m)=\left (1-\frac {\tilde {\beta }_m^s}{1+\tau _{i}^m}\right ) \left ( \frac {\tilde {\beta }_m^s}{(1+\tau _{i}^m)P_m}\right )^ {\frac {\tilde {\beta }_m^s}{1-\tilde {\beta }_m^s}}. \end{align}
Note that when $\tau _{i}^m=0$
or when
$\tau _{i}^m=0$
or when $\tau _{i}^m$
is equal across firms, the log value-added productivity
$\tau _{i}^m$
is equal across firms, the log value-added productivity $A_{i}^v$
is proportional to the log gross-output productivity
$A_{i}^v$
is proportional to the log gross-output productivity $A_{i}$
. This result has also been studied in Hang, et al. (Reference Hang, Krishna and Tang2020).
$A_{i}$
. This result has also been studied in Hang, et al. (Reference Hang, Krishna and Tang2020).
Different from Hang, et al. (Reference Hang, Krishna and Tang2020), we further study how the value-added productivities $A_{i}^\nu$
would look like when
$A_{i}^\nu$
would look like when $\tau _{i}^m$
is size-dependent (Restuccia and Rogerson, Reference Restuccia and Rogerson2008; Guner, et al. Reference Guner, Ventura and Xu2008). The property of “size-dependent” distortions implies a higher average
$\tau _{i}^m$
is size-dependent (Restuccia and Rogerson, Reference Restuccia and Rogerson2008; Guner, et al. Reference Guner, Ventura and Xu2008). The property of “size-dependent” distortions implies a higher average $\tau _{i}^m$
for more productive firms in terms of
$\tau _{i}^m$
for more productive firms in terms of $A_i$
, or mathematically speaking,
$A_i$
, or mathematically speaking,
 \begin{align} \tau _{i}^m= c_0 + \rho ^\tau \log A_i + \zeta _i, \end{align}
where $c_0$
is a constant,
$c_0$
is a constant, $\rho ^\tau \gt 0$
and
$\rho ^\tau \gt 0$
and $E(\zeta _i)=0$
. For the case of financial frictions,
$E(\zeta _i)=0$
. For the case of financial frictions, $\rho ^\tau \gt 0$
since more productive firms demand more debt borrowings for inputs and are hence more likely to be constrained, ceteris paribus. We confirm that this is the case in the Chinese data and also in our model. The correlation coefficients between
$\rho ^\tau \gt 0$
since more productive firms demand more debt borrowings for inputs and are hence more likely to be constrained, ceteris paribus. We confirm that this is the case in the Chinese data and also in our model. The correlation coefficients between $\log MRPM_{i}$
and
$\log MRPM_{i}$
and $\log A_{i}$
are 0.27 in ASIF and 0.49 in the model simulated data. The same size-dependent property is true for the capital distortion
$\log A_{i}$
are 0.27 in ASIF and 0.49 in the model simulated data. The same size-dependent property is true for the capital distortion $\tau _i^k$
: the correlation coefficients between
$\tau _i^k$
: the correlation coefficients between $\log MRPK_{i}$
and
$\log MRPK_{i}$
and $\log A_{i}$
are 0.58 in ASIF and 0.56 in the model simulated data.
$\log A_{i}$
are 0.58 in ASIF and 0.56 in the model simulated data.
How does this size-dependent structure of distortions affect the estimate of value-added productivity? To formalize the question, we define the bias in $\log A_{i}^\nu$
as the difference between the distorted log productivity,
$\log A_{i}^\nu$
as the difference between the distorted log productivity, $\log A_{i}^\nu (\tau _{i}^m)$
, and the hypothetical log productivity absent intermediate input distortions,
$\log A_{i}^\nu (\tau _{i}^m)$
, and the hypothetical log productivity absent intermediate input distortions, $\log A_{i}^\nu (0)$
:
$\log A_{i}^\nu (0)$
:
 \begin{align} \Delta \log A_{i}^\nu (\tau _{i}^m)=\frac {\sigma }{\sigma -1}\bigg [\log \left (\Gamma _s(\tau _{i}^m)\right ) - \log \left ( \Gamma _s(0)\right )\bigg ]. \end{align}
PropositionA.1 in the appendix states that $\log A_{i}^\nu$
is biased downward more when
$\log A_{i}^\nu$
is biased downward more when $\tau _{i}^m$
deviates further away from zero in terms of absolute value. PropositionA.2 further states that if
$\tau _{i}^m$
deviates further away from zero in terms of absolute value. PropositionA.2 further states that if $\tau _{i}^m$
positively correlates with
$\tau _{i}^m$
positively correlates with $\log A_i$
, most productive firms have the most severe downward bias. Figure 1 intuitively illustrates these results. We plot the bias against the decile of
$\log A_i$
, most productive firms have the most severe downward bias. Figure 1 intuitively illustrates these results. We plot the bias against the decile of $\tau _{i}^m$
distortions on the left panel and the bias against the decile of true productivity
$\tau _{i}^m$
distortions on the left panel and the bias against the decile of true productivity $\log A_{i}$
on the right panel. It is evident that (i) the downward bias is substantial when
$\log A_{i}$
on the right panel. It is evident that (i) the downward bias is substantial when $\tau _i^m$
is high and (ii) most productive firms in terms of
$\tau _i^m$
is high and (ii) most productive firms in terms of $\log A_{i}$
have the most substantial downward bias in value-added productivity, by about 35% in ASIF and 16% in the model. In the data, we also observe a substantial downward bias on
$\log A_{i}$
have the most substantial downward bias in value-added productivity, by about 35% in ASIF and 16% in the model. In the data, we also observe a substantial downward bias on $\log A_{i}^\nu$
for least productive firms because these firms, on average, receive subsidies (i.e., a negative
$\log A_{i}^\nu$
for least productive firms because these firms, on average, receive subsidies (i.e., a negative $\tau _{i}^m$
). We do not have this result in the model since firms are either financially constrained with a positive
$\tau _{i}^m$
). We do not have this result in the model since firms are either financially constrained with a positive $\tau _{i}^m$
or unconstrained with a zero
$\tau _{i}^m$
or unconstrained with a zero $\tau _{i}^m$
.
$\tau _{i}^m$
.
Downward biases in value-added productivities for different levels of $\tau ^m_i$
and
$\tau ^m_i$
and $\log A_i$
.
$\log A_i$
.
Notes: Model statistics are for the top 20% firms in the sales distribution. The bias is defined as $\log A_{i}^\nu (\tau _{i}^m) - \log A_{i}^\nu (0)$
. Deciles of intermediate input distortions and log gross output productivities are calculated for the pooled 1998–2007 data. Deciles in the model are calculated for the representative industry. The lowest decile represents the lowest 10% of firms using the sorted variable.
$\log A_{i}^\nu (\tau _{i}^m) - \log A_{i}^\nu (0)$
. Deciles of intermediate input distortions and log gross output productivities are calculated for the pooled 1998–2007 data. Deciles in the model are calculated for the representative industry. The lowest decile represents the lowest 10% of firms using the sorted variable.

5.2 Connecting to the conventional misallocation measure
A subsequent question is how our TFP gain is distinct from the TFP gain in Hsieh and Klenow (Reference Hsieh and Klenow2009)’s method. We first note that our TFP gain differs from the one computed in Hsieh and Klenow (Reference Hsieh and Klenow2009). Specifically, our TFP gain takes the industry-level capital $K_s$
, labor
$K_s$
, labor $L_s$
, and intermediate inputs
$L_s$
, and intermediate inputs $M_s$
constant and thus is a gross-output TFP gain. In contrast, the HK takes the industry-level capital and labor constant and implicitly allows industry-level intermediate inputs to vary optimally as implied by any pre-specified gross output production function. The TFP gain in Hsieh and Klenow (Reference Hsieh and Klenow2009) is thus a value-added TFP gain.
$M_s$
constant and thus is a gross-output TFP gain. In contrast, the HK takes the industry-level capital and labor constant and implicitly allows industry-level intermediate inputs to vary optimally as implied by any pre-specified gross output production function. The TFP gain in Hsieh and Klenow (Reference Hsieh and Klenow2009) is thus a value-added TFP gain.
Difference in capital levels after reallocation between the two approaches $(K_{i}^{eff,\nu }-K_{i}^{eff})/K_{i}^{eff}$
.
$(K_{i}^{eff,\nu }-K_{i}^{eff})/K_{i}^{eff}$
.
Notes: Model statistics are for the top 20% firms in the sales distribution. $K_{i}^{eff,\nu }$
is the level of post-reallocation “efficient” capital under the HK approach, and
$K_{i}^{eff,\nu }$
is the level of post-reallocation “efficient” capital under the HK approach, and $K_{i}^{eff}$
is the efficient level under the GO approach. Deciles of log gross output productivity are calculated within industries in the ASIF data and within the representative industry in the model simulation. The lowest decile represents the least productive 10% of firms.
$K_{i}^{eff}$
is the efficient level under the GO approach. Deciles of log gross output productivity are calculated within industries in the ASIF data and within the representative industry in the model simulation. The lowest decile represents the least productive 10% of firms.

Second, given the above distinction, the distorted value-added productivities pose challenges for the misallocation quantification under the HK approach. We illustrate this point using the allocation of capital as an example, as the allocation of labor is the same as the case of capital. In our reallocation exercise, the efficient capital $K_{i}^{eff}$
for firm
$K_{i}^{eff}$
for firm $i$
should be
$i$
should be
 \begin{align} K_{i}^{eff} = \frac { (A_{i})^{\sigma -1}}{\sum _{i=1}^{\mathbb {M}} (A_{i})^{\sigma -1} } K_s\text {,} \end{align}
In contrast, under the HK approach, the reallocation exercise allocates $K_{i}^{eff,\nu }$
to firm
$K_{i}^{eff,\nu }$
to firm $i$
$i$
 \begin{align} K_{i}^{eff,\nu } &= \frac { (A_{i})^{\sigma -1} [\Gamma _{s}(\tau _{i}^{m})]^{\sigma \alpha _a^s}}{\sum _{i=1}^{\mathbb {M}} (A_{i})^{\sigma -1} [\Gamma _{s}(\tau _{i}^m)]^{\sigma \alpha _a^s} } K_s, \end{align}
The two “efficient” capital $K_{i}^{eff}$
and
$K_{i}^{eff}$
and $K_{i}^{eff,\nu }$
differ due to the existence of
$K_{i}^{eff,\nu }$
differ due to the existence of $\Gamma _s(\tau _{i}^m)$
, and are equal only if firms are undistorted or identically distorted with a constant
$\Gamma _s(\tau _{i}^m)$
, and are equal only if firms are undistorted or identically distorted with a constant $\tau _s^m$
within industries. If intermediate input distortions are on average greater for higher
$\tau _s^m$
within industries. If intermediate input distortions are on average greater for higher $A_{i}$
firms as in the last section, capital for the most productive firms after reallocation could be, on average, lower under the HK approach than what is efficient.Footnote 13
$A_{i}$
firms as in the last section, capital for the most productive firms after reallocation could be, on average, lower under the HK approach than what is efficient.Footnote 13
Figure 2 graphically presents the difference between the two “efficient” capital stock levels. Consistent with our conjecture, we find that for firms in the highest decile of $A_{i}$
, their average “efficient” capital under the HK approach is 1.7% lower than the efficient average capital in the model and 4% lower in the ASIF data. However, for the remaining 90% firms, the HK reallocation allocates too much capital than what is efficient. These results are driven by the fact that in both model and data, the average intermediate input friction increases in
$A_{i}$
, their average “efficient” capital under the HK approach is 1.7% lower than the efficient average capital in the model and 4% lower in the ASIF data. However, for the remaining 90% firms, the HK reallocation allocates too much capital than what is efficient. These results are driven by the fact that in both model and data, the average intermediate input friction increases in $\log A_i$
.
$\log A_i$
.
A final question is that given Figure 2, whether the HK approach overestimates or underestimates the potential value-added TFP gain in the Chinese data and in our model. Answering this question requires a fully-blown multi-industry input-output model as in Jones (Reference Jones2011), which is done by Hang, et al. (Reference Hang, Krishna and Tang2020). We borrow from Hang, et al. (Reference Hang, Krishna and Tang2020)’s results and convert the within-industry gross-output TFP gain to the within-industry value-added TFP gain by
 \begin{align} \text {Value-added TFP gain} = \frac {1}{1-\beta _m} \times \text {Gross-output TFP gain}. \end{align}
According to this formula, the potential value-added TFP gain is 135% in ASIF and 96% in our Benchmark model. Following the HK approach, however, the potential value-added TFP gain is lower, 103% in ASIF and 45% in our benchmark model. These differences are caused by a lower $K_{i}^{eff,\nu }$
for most productive firms since these firms are assigned with underestimated value-added productivities under the HK method. Our results imply that it is crucial to use the gross-output production function when researchers study misallocation in an environment in which intermediate inputs are likely distorted, such as China here and India in Boehm and Oberfield (Reference Boehm and Oberfield2020).
$K_{i}^{eff,\nu }$
for most productive firms since these firms are assigned with underestimated value-added productivities under the HK method. Our results imply that it is crucial to use the gross-output production function when researchers study misallocation in an environment in which intermediate inputs are likely distorted, such as China here and India in Boehm and Oberfield (Reference Boehm and Oberfield2020).
6. Conclusion
Most of the existing literature on misallocation studies distortions in firm-level inputs of capital and labor. This paper provides the first empirical evidence on financially constrained intermediate inputs and builds a quantitative model to evaluate its importance in accounting for misallocation in China’s ASIF data.
This paper contributes to the literature in three folds. Using the Chinese exogenous tax reform events and the difference-in-difference method, it first provides evidence of how firms are financially constrained in intermediate inputs in China. Second, it shows a greater quantitative role of financially constrained intermediate inputs in causing misallocation than financially constrained capital. Third, the paper points out how constrained intermediate inputs distort firm-level value-added productivity measures. When more productive firms are more constrained in intermediate inputs, the standard Hsieh and Klenow (Reference Hsieh and Klenow2009) reallocation exercise tends to reallocate less capital than what is efficient, causing a potential underestimation of misallocation in the Chinese firm-level data and in our model.
Acknowledgements
Wenya would like to express sincere thanks to her advisors, Jim MacGee and Igor Livshits, for their continuous support. We thank David Rivers, Simona Cociuba, Xiaodong Zhu, Loren Brandt, Michael Song, Johannes Van Biesebroeck, Sophie Osotimehin, and Jing Hang for their insightful discussions. We also thank conference participants at the ES World Congress (Bocconi), NAESM (Davis), SAET (Taipei), Wuhan University CERW Workshop, Midwest Macro Workshop (Baton Rouge), and AESM (Hong Kong). Lastly, we thank Qiyu Xu for her excellent research assistance. All errors are ours.
A. Appendix
The value-added tax reform coverages at its different stages, from Liu and Mao (Reference Liu and Mao2019).

Expression of value-added productivity
Using the gross-output production function, the first-order condition of intermediate inputs is
 \begin{align} P_s Y_s^{\frac {1}{\sigma }} A_{i}^{\frac {\sigma -1}{\sigma }} \beta _m^s \frac {\sigma -1}{\sigma } M_{i}^{\frac {\sigma -1}{\sigma }\beta _m^s-1} (K_{i}^{\beta _{k}^{s}} L_{i}^{1-\beta _k^s})^{(1-\beta _m^s)\frac {\sigma -1}{\sigma }} = P_m(1+\tau _{i}^M). \end{align}
Therefore the value-added revenue is
 \begin{align} P_{i}^\nu Y_{i}^\nu & = P_{i}Y_{i} - P_mM_{i} = [1-\frac {\beta _m^s(\sigma -1)}{\sigma (1+\tau _{i}^m)}]P_{i} Y_{is,} \nonumber \\ & = \left [1-\frac {\tilde {\beta }^s_m}{1+\tau _{i}^m}\right ] \left (P_sY_s^{\frac {1}{\sigma }}\right )^{\frac {1}{1-\tilde {\beta }^s_m}} \left [ \frac {\tilde {\beta }^s_m}{(1+\tau _{i}^m)P_m}\right ]^ {\frac {\tilde {\beta }^s_m}{1-\tilde {\beta }^s_m}} (A_{i}^{\alpha _a^s})^{\frac {\sigma -1}{\sigma }} (K_{i}^{\alpha _k^s} L_{i}^{\alpha _l^s})^{\frac {\sigma -1}{\sigma }}, \end{align}
where $ \alpha _a^s = 1/\left (1-\tilde {\beta }_m \right )$
,
$ \alpha _a^s = 1/\left (1-\tilde {\beta }_m \right )$
, $\alpha _k^s=\beta _k^s(1-\beta _m^s)/(1-\tilde {\beta }^s_m)$
, and
$\alpha _k^s=\beta _k^s(1-\beta _m^s)/(1-\tilde {\beta }^s_m)$
, and $\alpha _l^s=\beta _l^s (1-\beta _m^s) /(1-\tilde {\beta }^s_m)$
. The second equation holds by expressing
$\alpha _l^s=\beta _l^s (1-\beta _m^s) /(1-\tilde {\beta }^s_m)$
. The second equation holds by expressing $M_{i}$
as a function of
$M_{i}$
as a function of $K_{i}$
and
$K_{i}$
and $L_{i}$
from equation (A.1).
$L_{i}$
from equation (A.1).
Entry in the Annual Survey of Industrial Firm (ASIF) data over a 5-year window

Notes: Entrants are defined as firms that enter into the ASIF data by the end of a 5-year window. Vice versa for incumbents. Age is calculated by the difference of year $t$
and the birth year.,
$t$
and the birth year.,
Since $Y_{i}^\nu =[P_{i}^\nu Y_{i}^\nu /(P_s^\nu (Y_s^\nu )^{\frac {1}{\sigma }})]^{\frac {\sigma }{\sigma -1}}$
, we obtain the value-added productivity as expressed in the main text.
$Y_{i}^\nu =[P_{i}^\nu Y_{i}^\nu /(P_s^\nu (Y_s^\nu )^{\frac {1}{\sigma }})]^{\frac {\sigma }{\sigma -1}}$
, we obtain the value-added productivity as expressed in the main text.
Proposition A.1.
For $\tau _{i}^m \geq \tilde {\beta }^s_m-1$
, the value-added production function is well-defined with the gross-output value exceeding the intermediate input cost. The percentage bias of the actual value-added productivity,
$\tau _{i}^m \geq \tilde {\beta }^s_m-1$
, the value-added production function is well-defined with the gross-output value exceeding the intermediate input cost. The percentage bias of the actual value-added productivity, $A_{i}^\nu (\tau _{i}^m)$
, from its hypothetical level when intermediate input distortions are absent,
$A_{i}^\nu (\tau _{i}^m)$
, from its hypothetical level when intermediate input distortions are absent, $A_{i}^\nu (0)$
, is
$A_{i}^\nu (0)$
, is
 \begin{align} \Delta \log A_{i}^\nu (\tau _{i}^m)=\frac {\sigma }{\sigma -1}\bigg [\log \left (\Gamma _s(\tau _{i}^m)\right ) - \log \left ( \Gamma _s(0)\right )\bigg ]. \end{align}
We have $ \Delta \log A_{i}^\nu (\tau _{i}^m) \leq 0$
and the equality holds when
$ \Delta \log A_{i}^\nu (\tau _{i}^m) \leq 0$
and the equality holds when $\tau _{i}^m=0$
. The downward bias of value-added productivity,
$\tau _{i}^m=0$
. The downward bias of value-added productivity, $\Delta \log A_{i}^\nu (\tau _{i}^m)$
, is more severe when
$\Delta \log A_{i}^\nu (\tau _{i}^m)$
, is more severe when $\tau _{i}^{m}$
increases in its absolute value.
$\tau _{i}^{m}$
increases in its absolute value.
Proof.
-
1. Let
$\tilde {\tau }_{i}^m= \frac {1}{1+\tau _{i}^m}$
:which is negative if
\begin{align*} \frac {\partial \Gamma _{s} }{\partial \tilde {\tau }_{i}^m}= P_m^{\frac {\tilde {\beta }^s_m}{1-\tilde {\beta }^s_m}} \frac {\tilde {\beta }^s_m}{1-\tilde {\beta }^s_m} (\tilde {\tau }_{i}^m)^{\frac {\tilde {\beta }_m}{1-\tilde {\beta }_m}}[(\tilde {\tau }_{i}^m)^{-1} -1], \end{align*}
$\tilde {\tau }_{i}^m \gt 1$
(i.e.,
$\tau _{i}^m\lt 0$
) and positive if
$\tilde {\tau }_{i}^m \lt 1$
(i.e.,
$\tau _{i}^m\gt 0$
). Since
$\tilde {\tau }_{i}^m$
is decreasing in
$\tau _{i}^m$
,
$\Gamma _{s}$
is decreasing in
$\tau _{i}^m$
for positive
$\tau _{i}^m$
, increasing for negative
$\tau _{i}^m$
. The second order derivative shows the maximum is obtained when
$\tau _{i}^m=0$
.


Proposition A.2.
Suppose $\tau _{i}^m$
is size-dependent, i.e.,
$\tau _{i}^m$
is size-dependent, i.e., $\tau _{i}^m= c_0+\rho ^\tau \log A_{i}+\zeta _{i}$
,
$\tau _{i}^m= c_0+\rho ^\tau \log A_{i}+\zeta _{i}$
, $\rho ^\tau \gt 0$
, and
$\rho ^\tau \gt 0$
, and $\zeta _{i}$
is a random variable with a zero mean. We have the following results:
$\zeta _{i}$
is a random variable with a zero mean. We have the following results:
-
1. the expected negative bias, conditional on the gross-output productivity,
$E (\Delta \log A_{i}^\nu | A_{i})$
, is more severe when firms are away from the productivity level of
$\log A_{0} = -(1+2ac_0)/(2a\rho ^\tau )$
, where
$a=0.5[\tilde {\beta }^s_m(1-\tilde {\beta }^s_m)-1]/(1-\tilde {\beta }^s_m)^2$
. -
2. for sufficiently productive firms, the expected negative bias,
$E (\Delta \log A_{i}^\nu | A_{i})$
, is more severe when
$\tau _{i}^m$
becomes more size-dependent.


Proof.
When $corr(\tau _{i}^m, \log A_{i})\neq 0$
, one can rewrite
$corr(\tau _{i}^m, \log A_{i})\neq 0$
, one can rewrite
 \begin{align*} \tau _{i}^m=c_0+\rho ^\tau \log A_{i}+\zeta _{i}, \end{align*}
where $c_0$
is a constant,
$c_0$
is a constant, $\rho ^\tau \neq 0$
, and
$\rho ^\tau \neq 0$
, and $E(\zeta _{i})=0$
.
$E(\zeta _{i})=0$
.
The deviation of log value-added quantity productivity:
 \begin{align} \frac {\sigma -1}{\sigma } \Delta \log A_{i}^\nu & = \log \Gamma _{s}(\tau _{i}^m) - \log (\Gamma _{s}(0)), \nonumber \\ & = -\frac {\tilde {\beta }^s_m}{1-\tilde {\beta }^s_m} \log (1+\tau _{i}^m) + \log (1- \frac {\tilde {\beta }^s_m}{1+\tau _{i}^m}) - \log (1-\tilde {\beta }^s_m), \nonumber \\ & \approx -\frac {\tilde {\beta }^s_m}{1-\tilde {\beta }^s_m} \bigg ( \tau _{i}^m - 0.5 (\tau _{i}^m)^2 \bigg ) + \frac {1}{1-\tilde {\beta }^s_m} \tau _{i}^m - 0.5 \frac {1}{(1-\tilde {\beta }^s_m)^2} (\tau _{i}^m)^2, \nonumber \\ & = \tau _{i}^m + a(\tau _{i}^m)^2. \end{align}
where $a=0.5[\tilde {\beta }^s_m(1-\tilde {\beta }^s_m)-1]/(1-\tilde {\beta }^s_m)^2\lt 0$
. The approximate equation holds by Taylor expansions up to an order two. Therefore
$a=0.5[\tilde {\beta }^s_m(1-\tilde {\beta }^s_m)-1]/(1-\tilde {\beta }^s_m)^2\lt 0$
. The approximate equation holds by Taylor expansions up to an order two. Therefore
 \begin{align} \frac {\sigma -1}{\sigma } E(\Delta \log A_{i}^\nu | A_{i}) = a (\rho ^\tau )^2 (\log A_{i})^2 + \rho ^\tau (1+2ac_0) \log A_{i} + ac_0^2 + aVAR(\zeta _{i}) + c_0. \end{align}
The parabola reaches the maximum at $\log A_0= -(1+2ac_0)/(2a\rho ^\tau )$
. Thus for
$\log A_0= -(1+2ac_0)/(2a\rho ^\tau )$
. Thus for $\log A_{i} \in [\log A_0, \infty )$
, average deviation is decreasing in
$\log A_{i} \in [\log A_0, \infty )$
, average deviation is decreasing in $\log A_{i}$
. Vice versa for
$\log A_{i}$
. Vice versa for $\log A_{i} \in (-\infty, \log A_0)$
. Meanwhile,
$\log A_{i} \in (-\infty, \log A_0)$
. Meanwhile,
 \begin{align} \frac {\partial \frac {\sigma -1}{\sigma } E(\Delta \log A_{i}^\nu | A_{i}) }{\partial \rho ^\tau }= 2a\rho ^\tau (\log A_{i})^2 + (1+2ac_0), \end{align}
which is negative for sufficiently large $\log A_{i}$
when distortions are size-dependent, i.e.,
$\log A_{i}$
when distortions are size-dependent, i.e., $\rho ^\tau \gt 0$
. Therefore, more size-dependent distortions cause a disproportionately negative deviation of
$\rho ^\tau \gt 0$
. Therefore, more size-dependent distortions cause a disproportionately negative deviation of $\log A_{i}^\nu$
for very productive firms.
$\log A_{i}^\nu$
for very productive firms.


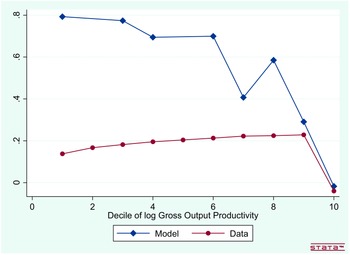


 Open access