

Introduction
Tonsillectomy with or without adenoidectomy is one of the most common surgical procedures performed in children. The most common indications for adenotonsillectomy are airway obstruction resulting in sleep-disordered breathing or obstructive sleep apnoea (OSA), and recurrent infection.Reference Ingram and Friedman1 Even if surgery-related bleeding in paediatric patients is considered an uncommon event, adenotonsillectomy surgery has a non-negligible incidence of bleeding complications. The latter occur in about 2–7 per cent of cases, both early and delayed, and range from mild to life-threatening. The generally recognised causes of bleeding are surgical trauma, ineffective local haemostasis and local infections. Several studies have been conducted to determine the best strategy to screen paediatric patients at potential risk of bleeding during or after surgery.Reference De Luca Canto, Pachêco-Pereira, Aydinoz, Bhattacharjee, Tan and Kheirandish-Gozal2
Post-operative haemorrhage following tonsillectomy can be classified as either primary/early (occurring within 24 hours of surgery) or secondary/delayed (occurring more than 24 hours after surgery). The incidence is variable, depending in part on how haemorrhage is defined and measured. Primary haemorrhage typically ranges from 0.2 to 2.2 per cent, and secondary haemorrhage between 0.1 and 3 per cent.Reference De Luca Canto, Pachêco-Pereira, Aydinoz, Bhattacharjee, Tan and Kheirandish-Gozal2–Reference Lowe, van der Meulen, Cromwell, Lewsey, Copley and Browne4 Secondary haemorrhage most commonly occurs 5–10 days post-operatively,Reference Liu, Anderson, Willging, Myer, Shott and Bratcher5 and is caused by premature separation of the eschar, which may be precipitated by an underlying infection or dehydration.Reference Johnson, Elluru and Myer6
Post-operative haemorrhage usually stops spontaneously, but it sometimes requires a return to the operating theatre for haemorrhage control and, in rare cases, a blood transfusion. A minor bleeding episode increases the risk that a major bleeding episode will occur; it is therefore recommended that children who have experienced a bleeding episode be hospitalised overnight for observation.Reference Sarny, Ossimitz, Habermann and Stammberger7–Reference Lescanne, Chiron, Constant, Couloigner, Fauroux and Hassani9 These episodes can be life-threatening or, in rare cases, life-ending.Reference Windfuhr, Schloendorff, Sesterhenn, Prescher and Kremer10 A post-operative haemorrhage can cause difficulty in securing the airway by intubation, leading to an anoxic injury.Reference Subramanyam, Varughese, Willging and Sadhasivam3
Children with bleeding disorders are at increased risk of post-operative bleeding complications, including delayed bleeding occurring up to two weeks after surgery. They therefore require close monitoring for a prolonged duration. Older children are at higher risk of post-operative haemorrhage compared with young children.Reference Liu, Anderson, Willging, Myer, Shott and Bratcher5,Reference Sarny, Ossimitz, Habermann and Stammberger7,Reference Hessén Söderman, Ericsson, Hemlin, Hultcrantz, Månsson and Roos11 Post-operative haemorrhage is also more common in patients who undergo tonsillectomy for chronic tonsillitis than for OSA.Reference Perkins, Liang, Gao, Shultz and Friedman12 This is because children with chronic tonsillitis have more scarring between the tonsil and the surrounding tissue, making removal more difficult.
Children with a haemorrhage of any cause can be categorised by severity into four classes, based on per cent loss of blood volume. Clinical features are typically used to estimate blood volume deficit.Reference Hazinski, Barkin and Barkin13,Reference Waltzman, Mooney, Major trauma, Fleisher, Ludwig and Henretig14 Many children presenting with class II haemorrhage will be in shock, and all children with classes III and IV haemorrhage will be in shock. The approach to haemorrhage is different depending on the haemorrhage class (Table 1).
Haemorrhage management according to severity classificationReference Hazinski, Barkin and Barkin13,Reference Waltzman, Mooney, Major trauma, Fleisher, Ludwig and Henretig14

Children compensate for blood loss by vasoconstriction and tachycardia, and may lose up to 30 per cent of their blood volume before hypotension is first observed.Reference Hazinski, Barkin and Barkin13,Reference Waltzman, Mooney, Major trauma, Fleisher, Ludwig and Henretig14 Tachycardia compensation is seen in a class II haemorrhage (15–30 per cent blood loss), while hypotension only appears when the haemorrhage is classified as class III (30–40 per cent blood loss). Blood loss also affects haematocrit and haemoglobin levels in the blood. Depending on the degree of blood loss and the amount of crystalloid replacement, the patient may present with significant anaemia. It can be difficult or impossible to quantify the blood loss from haemorrhage after tonsillectomy. Much of the blood can be swallowed, and vomited blood may be very difficult to estimate. Dizziness and orthostatic vital signs may suggest hypovolaemia in children who have been operated on.15
Currently, an approach based on a child's personal bleeding history is considered more cost-effective than a complete haemostatic screening, but there is no definitive way to predict which children will bleed. When a child loses blood, the physiological response is tachycardia, before blood pressure changes. Therefore, we wanted to investigate whether a child's heart rate is a reliable way to identify an initial change in blood volume.
We hypothesised that the relationship between heart rate and haematocrit could be associated with the amount of bleeding as opposed to the presence of bleeding, as post-tonsillectomy bleeding is readily apparent in the majority of cases. In addition, we expected that the decreases in haemoglobin and haematocrit could be predicted based on the changes in heart rate. We expected to find a relation between haemodynamic indices (heart rate) and laboratory indices (haemoglobin and haematocrit) in the setting of blood loss, in children. If such a relationship is found, it will provide a novel way to identify early bleeding events after surgical procedures by the simple measurement of heart rate.
This information might enable physicians to monitor patients more carefully after surgery. Parents or caregivers will be able to monitor their child post-surgery, at home, using basic medical tools, and if the child starts to bleed, the parents or caregivers will be able to provide them with appropriate medical care, long before their bleeding becomes severe. The information we expect to gather from this study might also provide us with a reliable means of monitoring children who undergo different kinds of surgical procedures or experience different traumas, and be used in different settings, whether in hospital or pre-hospital settings.
Materials and methods
Ethical considerations
The study was performed after being approved by the Helsinki Committee in the medical centre (approval number: 17NHR). We ensured patient confidentiality and anonymity.
Study design
A retrospective analytical study was conducted. We collected data from the electronic charts of those medical centre patients who were diagnosed with post-operative bleeding between October 2007 and October 2017. We used the International Classification of Diseases, 9th Revision, Clinical Modification diagnosis codes 998.11 ‘Hemorrhage complicating a procedure’ and 28.7 ‘Control of hemorrhage after tonsillectomy and adenoidectomy’ to identify the patients. The Advia 2120i Hematology Analyzer (Siemens, Tarrytown, New York, USA) was used in the laboratory to determine the haemoglobin and haematocrit levels.
Participants
The study population included all patients aged under 18 years who were treated in our medical centre during a 10-year period (September 2007 to September 2017) and diagnosed with post-operative bleeding.
Exclusion criteria
Patients who had been diagnosed at the medical centre but were operated on elsewhere and patients for whom there were insufficient data were excluded.
Research bias
Tachycardia measurements are non-specific and can be influenced by the anxiety caused by bleeding, regardless of the amount of blood loss. In order to minimise this bias, we also collected the laboratory data for the patients and compared this information against haemodynamic indices such as heart rate.
We based our collected data on the International Classification of Diseases, 9th Revision, Clinical Modification diagnosis codes. It is possible that some patients were not coded with this diagnosis code.Reference Phillips, Ellsperman, Matt and Zarzaur16
Variables
Our study focused on certain variables, including: pre- and post-operative heart rate, haematocrit level, and haemoglobin level. We documented the following information: age, gender, background illnesses (e.g. anaemia), and pre-operative heart rate, haematocrit level and haemoglobin level. Heart rate before surgery was measured in the hospital on the day of surgery; post-operative heart rate, haematocrit level and haemoglobin level were measured while being admitted to the hospital for bleeding and once hospitalised.
Statistical analysis
Quantitative data were described using mean and standard deviation, and median and range values. Qualitative data were described using frequencies and percentages. Changes in haemodynamic variables and in laboratory indices (haemoglobin and haematocrit) before the surgery and after the post-operative bleeding diagnosis were assessed. Quantitative data were compared using a paired sample t-test or Wilcoxon signed-rank test. The choice of test depended on the sample size and the distribution of the differences of measures between time points. Qualitative data were compared using McNemar's test.
The correlation between changes in haemodynamic variables and laboratory measurements was examined using Pearson's correlation, a univariate linear regression model and Spearman's correlation. A scatterplot was used to present the relationship between the changes in haemodynamic indices and the changes in laboratory indices. A multivariate linear regression model was used to evaluate the relationship between the changes in haemodynamic indices and laboratory indices adjusted to age and gender.
Comparisons among and between subgroups were made as follows. Quantitative data were compared using analysis of variance, the Kruskal–Wallis test, the independent sample t-test or the Wilcoxon rank sum test. The tests were chosen according to: the number of groups that were compared, the sample size and the data distribution in those groups. Qualitative data were compared using the chi-square test and Fisher's exact test. The choice of tests was made according to the preliminary assumptions required for these tests.
A p-value of less than 0.05 was considered statistically significant. P-values were two-sided, unless otherwise mentioned.
Sample size
All patients diagnosed with post-operative bleeding, who were being treated in the medical centre during the study period (expected to be at least 200 patients), were to be included. For R = 0.7, based on 200 subjects, the two-sided 95 per cent confidence interval (CI) for proportions was calculated as 0.62–0.76; for R = 0.6, the 95 per cent CI was 0.50–0.68.
Results
We collected data from 218 patients, but only 122 of them had sufficient data to be included in the statistical analysis. The average patient age was 6.9 years (Figure 1), and half of the patients (54.1 per cent) were males. The patients were mostly healthy, with no medical background illnesses (only one patient had anaemia and one patient had thalassaemia). The majority of patients (81.1 per cent, n = 99) underwent tonsillectomy with adenoidectomy; only 6.6 per cent (n = 8) underwent adenoidectomy only.
Age frequency of the patients (n = 122; mean age (standard deviation) = 6.9 (5.202) years).

Hospital protocol requires that patients are admitted for post-operative bleeding, in case of a return to the emergency room, even if the history and physical examination findings are positive only for blood-tinged sputum. In 14 patients (11 per cent), a return to the operating theatre for control of bleeding was required, and 4 patients (3 per cent) were treated with a blood transfusion. The average time between surgery and bleeding was 5.8 days (median of 6 days) (Figure 2).
Time from surgery to post-operative (post-op) bleeding event (n = 121; mean time (standard deviation) = 5.8 (3.061) days).

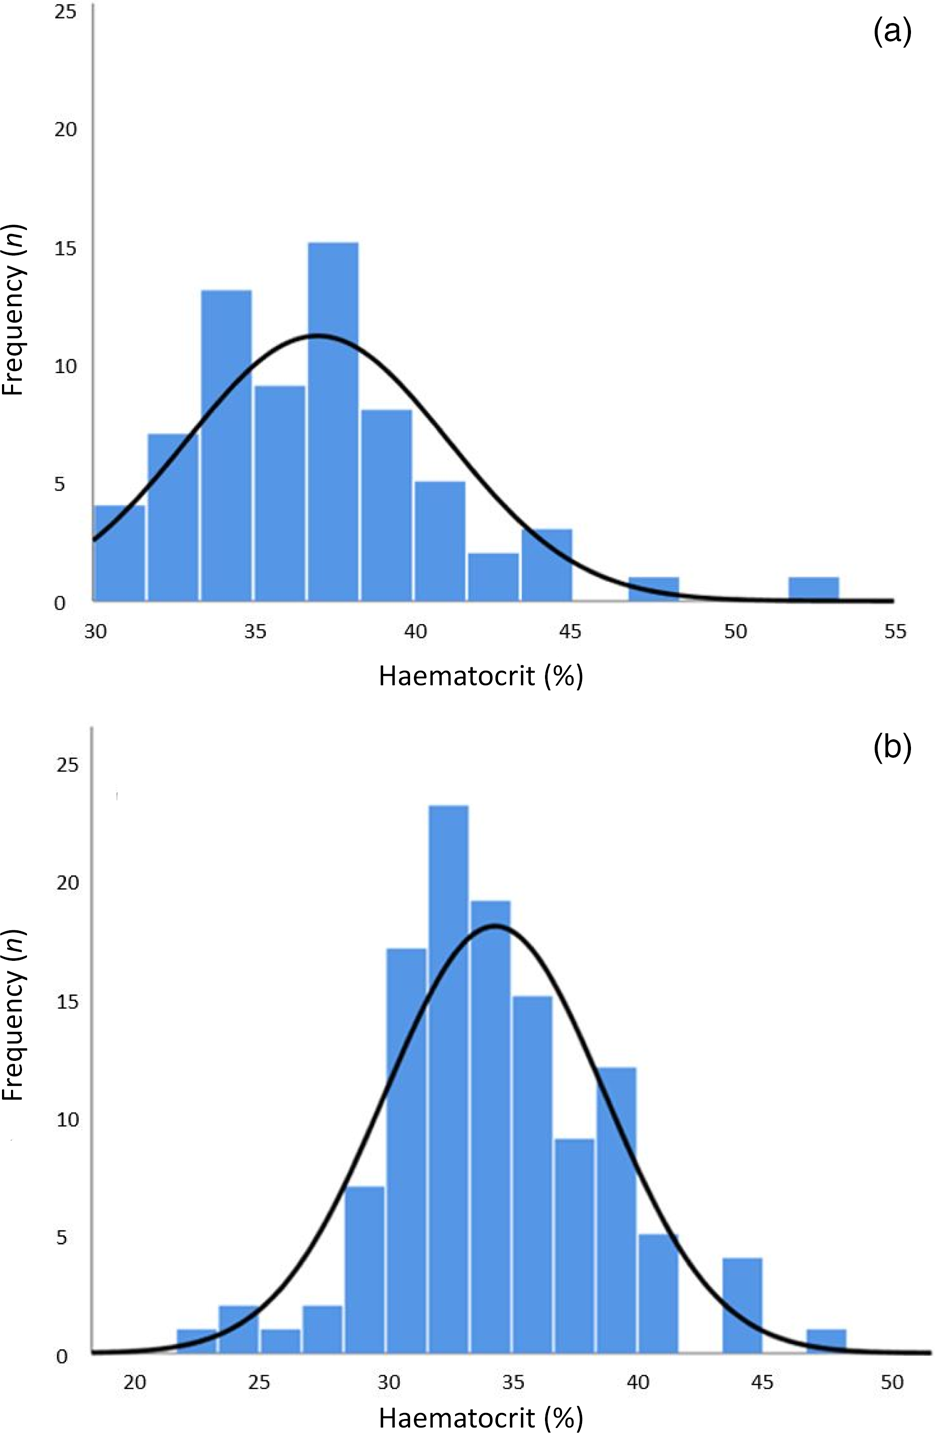
The average haemoglobin level was 12.4 g/dl before surgery (Figure 3a) and 11.7 g/dl after surgery (Figure 3b). The average haematocrit level was 37.0 per cent before surgery (Figure 4a) and 34.3 per cent after surgery (Figure 4b). These decreases in haemoglobin and haematocrit levels were statistically significant (paired sample t-tests, p < 0.001). The average heart rate was 97 beats per minute (bpm) before surgery and 108 bpm after surgery. This increase in heart rate was statistically significant (paired sample t-test, p < 0.001).
Haemoglobin levels (a) before surgery (n = 68; mean haemoglobin (standard deviation) = 12.4 (1.414) g/dl), and (b) during post-operative bleeding event (n = 122; mean haemoglobin (standard deviation) = 11.7 (1.532) g/dl).

Haematocrit levels (a) before surgery (n = 68; mean haematocrit (standard deviation) = 37.0 (4.075) %), and (b) during post-operative bleeding event (n = 118; mean haematocrit (standard deviation) = 34.3 (4.374) %).
We calculated the differences (Δ) between the heart rate measurements before the surgery and those after the bleeding appeared. The average delta was 11 bpm (50th percentile = 9). The mean delta values of the haemoglobin and haematocrit levels were −0.88 g/dl and −2.83 g/dl, respectively. No statistically significant correlation was found between the differences in heart rate and the differences in haemoglobin (R = 0.104, p = 0.48((Figure 5a). There was also no correlation between the differences in heart rate and the differences in haematocrit (R = 0.084, p = 0.57) (Figure 5b).
Correlation between differences in heart rate and differences in (a) haemoglobin and (b) haematocrit. bpm = beats per minute

Discussion
The main purpose of the research was to determine whether there was a correlation between the increase in heart rate and the decreases in haemoglobin and haematocrit levels in the setting of post-surgical bleeding. According to medical literature, we know that bleeding in children causes an increase in heart rate.Reference Hazinski, Barkin and Barkin13,Reference Waltzman, Mooney, Major trauma, Fleisher, Ludwig and Henretig14 Today, there still is no medical tool or a diagnostic test that can predict whether a child will bleed following surgery, or if occult bleeding will occur following a surgical procedure. Therefore, we saw importance in finding a measurement tool or test to assess patients who had undergone surgery.
In this study, we were able to show that there is a significant increase in heart rate, and decreases in both haemoglobin and haematocrit levels, in the setting of bleeding in children. These findings are logical and comply with the known physiology of children.Reference Hazinski, Barkin and Barkin13,Reference Waltzman, Mooney, Major trauma, Fleisher, Ludwig and Henretig14 Unfortunately, our study hypothesis was not supported, as we failed to show a correlation between the elevation in heart rate and the decreases in haemoglobin and haematocrit levels. Nevertheless, this is an important negative finding, with clinical applicability. Based on these findings, we discourage monitoring the heart rate of paediatric patients after tonsillectomy surgery solely for the purpose of predicting acute blood loss.
Limitations
We believe there are multiple reasons for our findings. Most significantly, many of the medical files collected were lacking data: documentation of haemoglobin or haematocrit levels after surgery was missing for some children, and not all children underwent heart rate measurements before and after surgery. Furthermore, the medical centre receives many patients with medical emergencies who have been operated on in other medical centres; we did not have any data on these patients’ vital signs and/or laboratory tests conducted prior to surgery. Thus, the correlation was based on a smaller than expected number of patients.
In addition, the International Classification of Diseases, 9th Revision codes that we used to identify relevant patients are probably used more often by otolaryngology doctors than those in other fields of medicine. We thus focused on a relatively homogeneous group of patients in a certain age group who underwent specific kinds of otolaryngology surgical procedures.
Another explanation for the findings is that there was simply no correlation between the heart rate increase and the haemoglobin and haematocrit decreases. Child physiology may involve a more complicated mechanism that makes the correlation less linear than anticipated. Yet another possibility is that heart rate is affected by environmental and individual factors (e.g. the parents’ or caregiver's reaction to the child's bleeding, and the child's fear of strangers), weakening the link between tachycardia and haemorrhage in children.
A review of similar studies with different patient populations and settings revealed substantial variability in the relationship between blood loss and clinical signs.Reference Pacagnella, Souza, Durocher, Perel, Blum and Winikoff17 A study on adult trauma patients revealed a statistically significant correlation between heart rate and haemoglobin level.Reference Bruns, Lindsey, Rowe, Brown, Minei and Gentilello18 In another study on adult trauma patients, which investigated whether it is possible to determine which patients with substantial bleeding before hospital arrival will need a packed red blood cell transfusion, there was no correlation with heart rate.Reference Liu, Khitrov, Gates, Odom, Havens and de Moya19 Such variability makes it difficult to establish specific cut-off points for clinical signs that could be used as triggers of clinical interventions.Reference Pacagnella, Souza, Durocher, Perel, Blum and Winikoff17
• This study investigated whether there was a relationship between changes in heart rate and differences in haemoglobin level, in children with post-operative blood loss
• Over 10 years, there were 218 cases of post-operative bleeding in children aged under 18 years
• There was a significant increase in heart rate after bleeding had started
• There was no correlation between differences in haemoglobin and haematocrit and changes in heart rate from before surgery to after bleeding had started
• Changes in heart rate from before surgery to after bleeding has started cannot predict differences in haemoglobin and haematocrit levels
Conclusion
We have shown that there is an increase in heart rate after bleeding occurs, with decreases in haemoglobin and haematocrit levels, in paediatric patients admitted to a hospital for post-surgical bleeding. We discourage monitoring the heart rate of paediatric patients after tonsillectomy surgery solely for the purpose of predicting acute blood loss. Further studies should be conducted that focus on a more diverse group of patients in different medical settings, such as trauma patients and patients who have undergone different procedures.
Acknowledgements
We wish to thank Mrs Orly Yakir for the statistical analysis and Galilee-CBR for the editorial assistance.
Competing interests
None declared


 Open access