


Introduction
The use of existing oil wells for long-term carbon capture and storage (CCS) has increased the interest in examining how the process of carbon dioxide injection for enhanced oil recovery (CO2-EOR) may have influenced microbial communities (Tyne et al., Reference Tyne, Barry, Lawson, Byrne, Warr, Xie, Hillegonds, Formolo, Summers and Skinner2021; Wragg et al., Reference Wragg, West and Bateman2013). The use of CO2-EOR, while utilised for production value, has not been well studied for its microbial impacts, particularly its influence on the in situ microbes and their gas processes in reservoirs. Microbes can produce or consume additional CO2, convert CO2 into methane and potentially consume that methane. The in situ subsurface microbiome will dictate the success or failure of CCS.
In oil reservoirs, methane is formed by either thermogenic or biogenic processes (Wuebbles et al., Reference Wuebbles2002; Stolper et al., Reference Stolper, Martini, Clog, Douglas, Shusta, Valentine, Sessions and Eiler2015; Gieg et al., Reference Gieg, Duncan and Suflita2008). The enzyme methyl coenzyme reductase A (McrA) is the major enzymatic step of biogenic methanogenesis (Wilmoth et al., Reference Wilmoth, Schaefer, Schlesinger, Roth, Hatcher, Shoemaker and Zhang2021). Previous studies have shown that CO2-EOR may enhance the rate of microbial methanogenesis (Tyne et al., Reference Tyne, Barry, Lawson, Byrne, Warr, Xie, Hillegonds, Formolo, Summers and Skinner2021). However, additional impacts such as oxygen introduction, which can occur alongside CO2 injection, could also impact methanogenesis. There is a long-standing hypothesis that microbial methanogenesis can only take place under strict anaerobic conditions, supported by the inhibitory effects of oxygen on McrA. However, previous reports have indicated that methanogenesis, a strictly anaerobic process, can take place under oxic conditions, known as the methane paradox (Wilmoth et al., Reference Wilmoth, Schaefer, Schlesinger, Roth, Hatcher, Shoemaker and Zhang2021; Angle et al., Reference Angle, Morin, Solden, Narrowe, Smith, Borton, Rey-Sanchez, Daly, Mirfenderesgi and Hoyt2017; McKay et al., Reference McKay, Smith, Barnhart, Schweitzer, Malstrom, Goudea and Fields2021; Schweitzer et al., Reference Schweitzer, Smith, Barnhart, McKay, Gerlach, Cunningham, Malmstrom, Goudeau and Fields2022). While this happens in wetlands and coal beds, we have little understanding if the methane paradox occurs in deep oil wells, but with the injection of gas and fluids, contaminating oxygen may create this paradox.
In Louisiana, the Olla field had CO2 injected for CO2-EOR in the 1980s, whereas Nebo Hemphill has a similar geochemical composition but has had no gas injection (Tyne et al., Reference Tyne, Barry, Lawson, Byrne, Warr, Xie, Hillegonds, Formolo, Summers and Skinner2021). This system has been studied by isotopic, geochemical and microbiological methods (McIntosh et al., Reference McIntosh, Warwick, Martini and Osborn2010; Shelton et al., Reference Shelton, McIntosh, Warwick and Yi2014, Reference Shelton, Akob, McIntosh, Fierer, Spear, Warwick and McCray2016a,Reference Shelton, McIntosh, Warwick and McCrayb, Reference Shelton, Andrews, Akob, DeVera, Mumford, McCray and McIntosh2018; Tyne et al., Reference Tyne, Barry, Lawson, Byrne, Warr, Xie, Hillegonds, Formolo, Summers and Skinner2021), but not yet via metagenomics. A previous study in this area showed different isotopic signatures for methane-clumped isotopes between the fields, and attributed it to an enhancement in the methanogenesis rate caused by higher levels of CO2 in the Olla field (Tyne et al., Reference Tyne, Barry, Lawson, Byrne, Warr, Xie, Hillegonds, Formolo, Summers and Skinner2021). An earlier study came to a different conclusion, stating that the Olla field had more ideal environmental conditions such as pH, temperature and salinity (Shelton et al., Reference Shelton, McIntosh, Warwick and Yi2014). Previously, some of these wells were analysed for microbial composition using amplicon sequencing of the 16S rRNA gene (Shelton et al., Reference Shelton, Akob, McIntosh, Fierer, Spear, Warwick and McCray2016a), which found an abundance of Methanothermococcus and Methanococcus species. A follow-up 16S rRNA gene amplicon study looked more closely at CO2-affected versus CO2-unaffected wells, and again showed these dominant methanogens, with a greater diversity of bacteria (Shelton et al., Reference Shelton, Andrews, Akob, DeVera, Mumford, McCray and McIntosh2018). This study identified indicator bacteria that were specific to CO2-affected wells, noting that many of these were known to be obligately aerobic taxa (Shelton et al., Reference Shelton, Andrews, Akob, DeVera, Mumford, McCray and McIntosh2018). Using the 16S rRNA gene amplicon approach, this study concluded that CO2 injection did not resoundingly change the microbial community of the oil wells. Since aerobic bacteria were identified, we contemplated that a methane paradox may be occurring and sought to better define what contributed to the higher methanogenesis suspected during CO2 storage (Tyne et al., Reference Tyne, Barry, Lawson, Byrne, Warr, Xie, Hillegonds, Formolo, Summers and Skinner2021).
Here we used 16S rRNA gene amplicon and metagenomic analyses to explore the methane origins within the Olla and Nebo Hemphill fields using wells sampled by Tyne et al. (Reference Tyne, Barry, Lawson, Byrne, Warr, Xie, Hillegonds, Formolo, Summers and Skinner2021) in a similar area studied by the other studies (McIntosh et al., Reference McIntosh, Warwick, Martini and Osborn2010; Shelton et al., Reference Shelton, McIntosh, Warwick and Yi2014, Reference Shelton, Akob, McIntosh, Fierer, Spear, Warwick and McCray2016a,Reference Shelton, McIntosh, Warwick and McCrayb, Reference Shelton, Andrews, Akob, DeVera, Mumford, McCray and McIntosh2018; Tyne et al., Reference Tyne, Barry, Lawson, Byrne, Warr, Xie, Hillegonds, Formolo, Summers and Skinner2021). We propose a model based on metagenomes showing that in the Olla field, organisms capable of respiring oxygen are tightly linked to the enhanced methanogenic activities in CO2-treated wells, suggesting that the methane paradox is occurring in this deep ecosystem. In the Nebo Hemphill field, continued anoxic conditions slowed the microbial breakdown of material, leading to a lower production of methane. This work suggests that gas injection, such as used for CCS, may change in situ subsurface microbiomes, possibly creating unexpected interactions.
Methods
Sample location and geological background
Samples for gas and produced water analysis were collected from the Olla field (wells O1, O5, O4) located in La Salle Parish Louisiana, and the Nebo-Hemphill field (wells NHH3, NHH6), which is located 20 km to the southeast of the Olla field (Table 1). The Olla field had CO2 injected between 1983 and 1986 for enhanced oil recovery purposes, the Nebo-Hemphill oil field has had no CO2 injected (Tyne et al., Reference Tyne, Barry, Lawson, Byrne, Warr, Xie, Hillegonds, Formolo, Summers and Skinner2021). Both fields produce from the Paleocene-Eocene Wilcox group, which comprises 600–1500 m of sediments ranging from marine clastic to fluvial deltaic deposits with coal beds up to 6 m thick interspersed. These wells exhibit a range of temperatures from 39.1 to 55°C (Supplementary Table S1). Produced water samples were collected and filtered immediately from wells. For geochemistry and C and H stable isotope analysis, gas cylinders were shipped to Isotech Inc. in Champaign, Illinois, USA. Standard procedures were used for measurements as previously described (Tyne et al., Reference Tyne, Barry, Lawson, Byrne, Warr, Xie, Hillegonds, Formolo, Summers and Skinner2021).
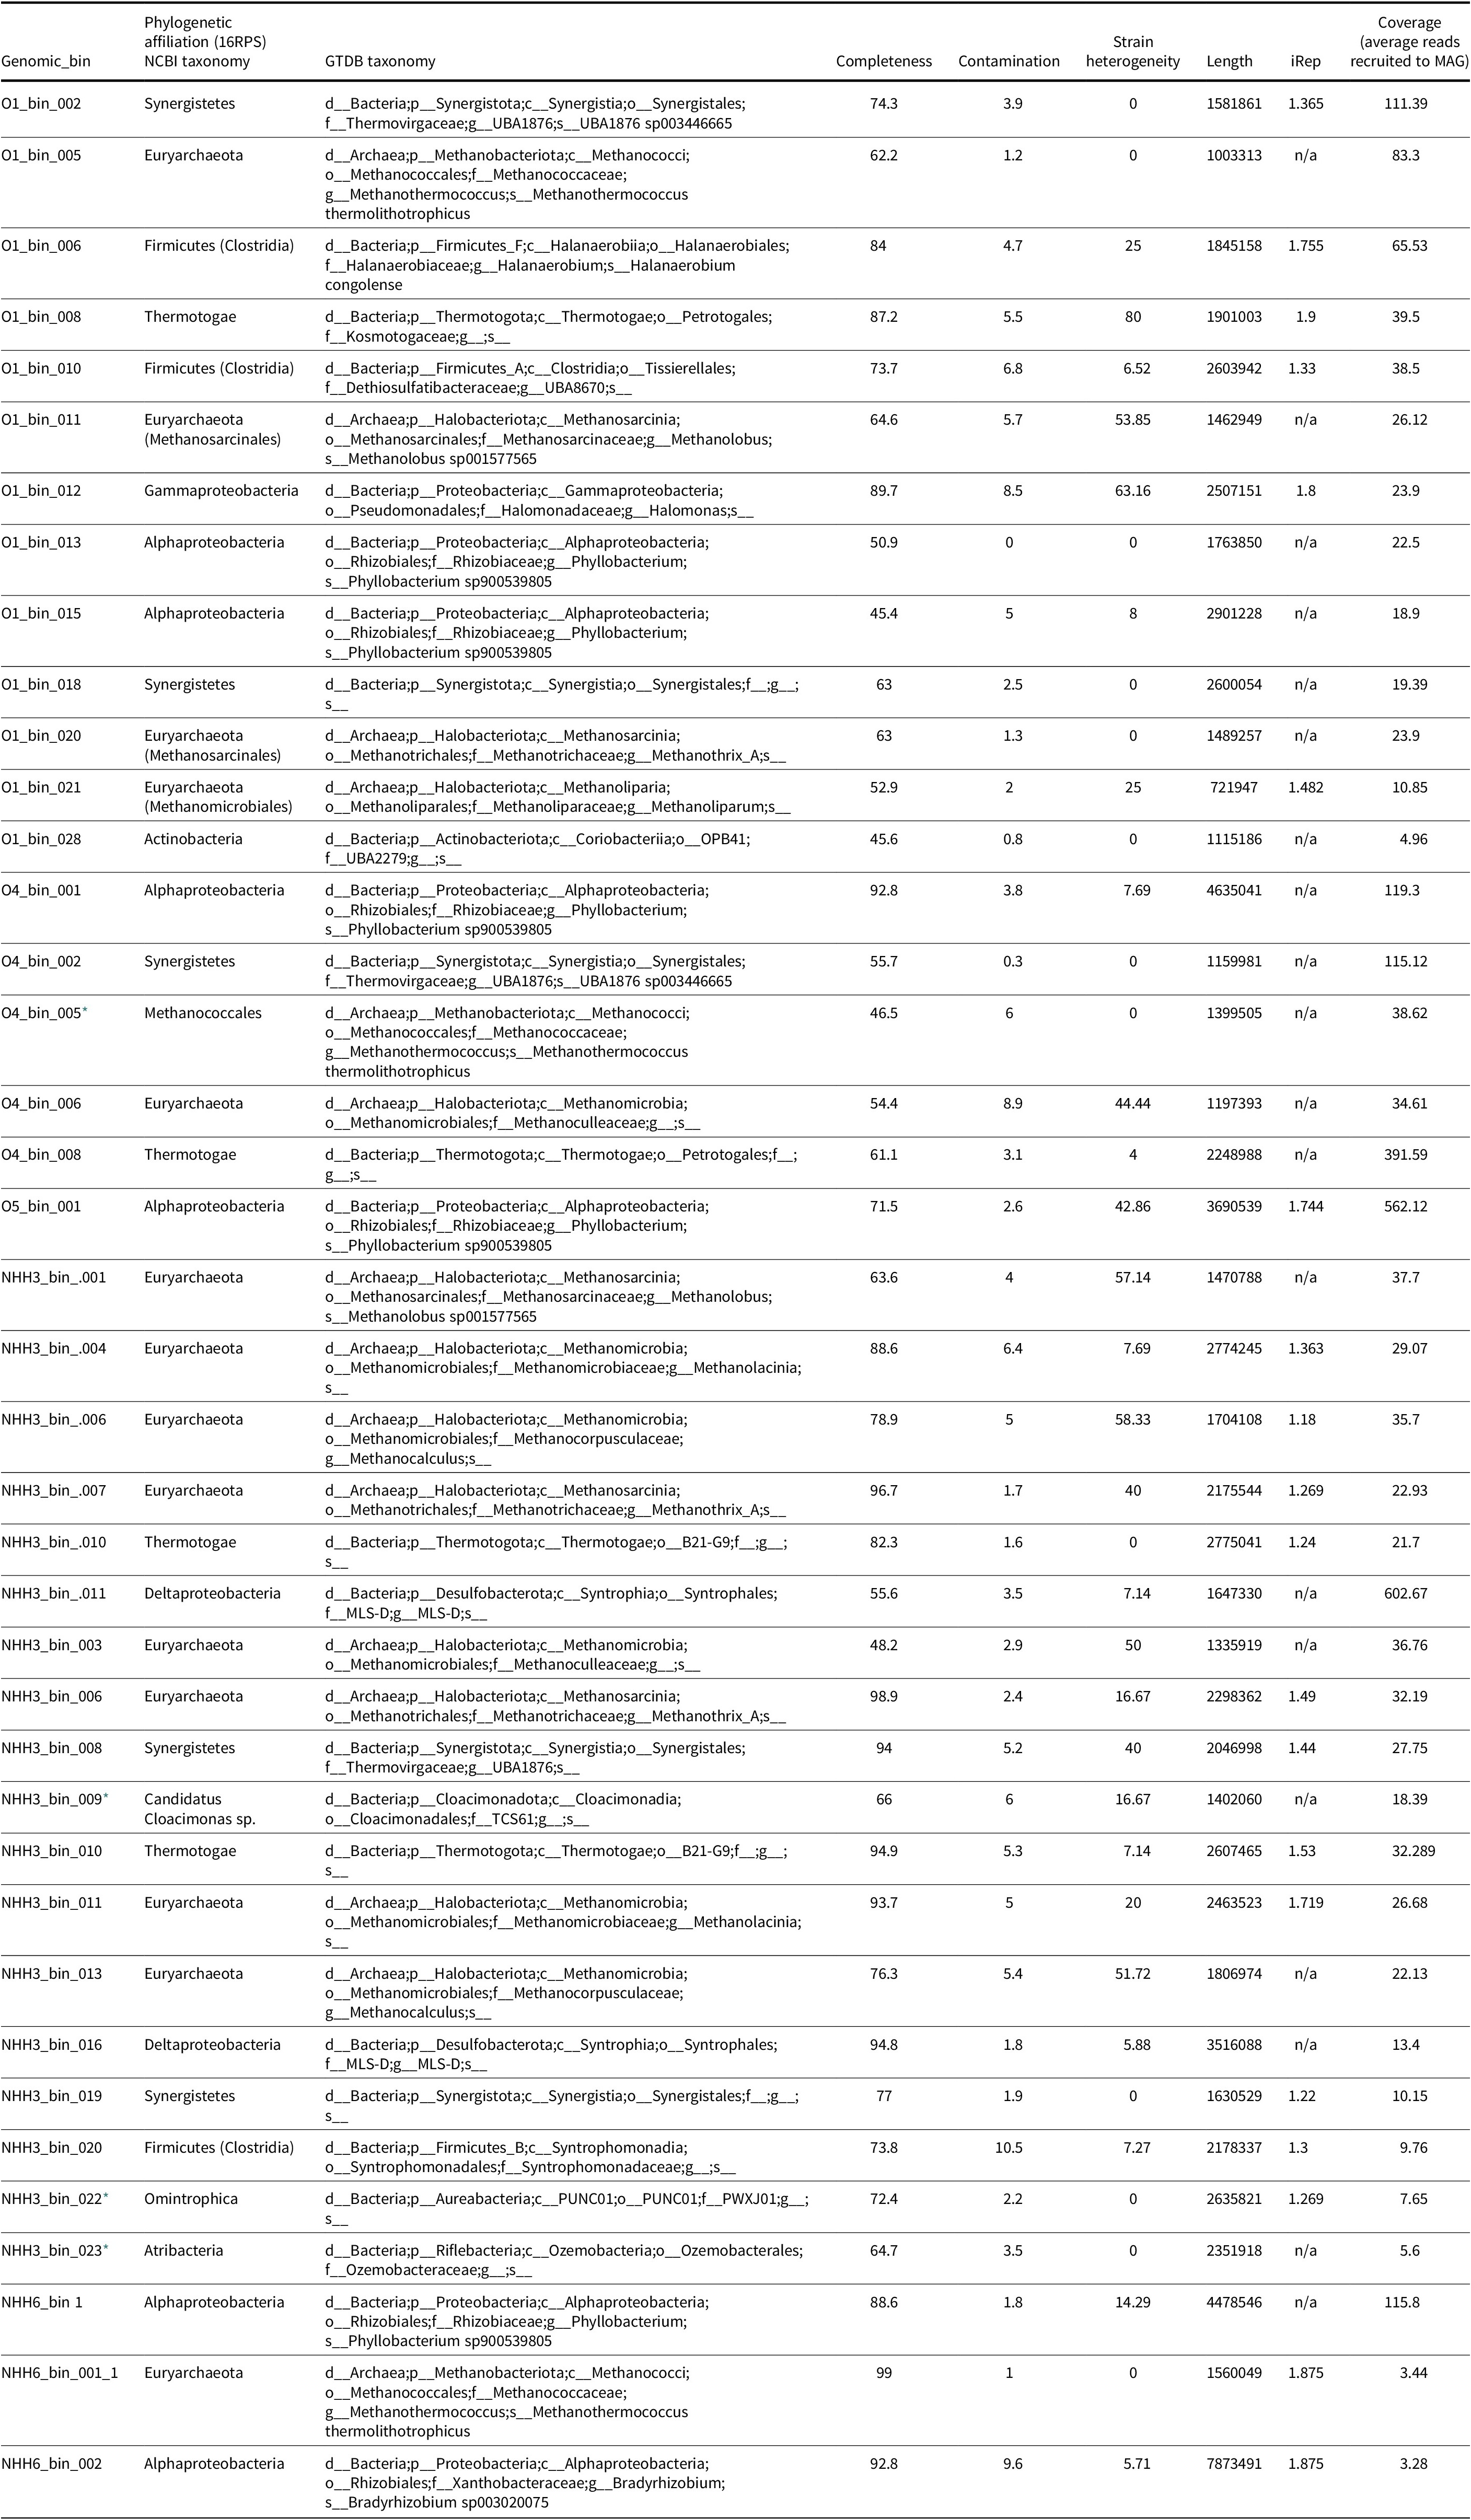
Details of the MAGs reconstructed from the oil reservoirs

* MAG identity was assessed using GTDB-tk only
16S rRNA gene amplicon and metagenomic library preparation and sequencing
Produced fluids were sampled from each well and filtered onto a Sterivex filter until the filter clogged (Supplementary Table S1). Samples with >1000 mL of passed fluid were used for sequencing (specific volumes in Supplementary Table S1). Filters were immediately frozen at -80°C and kept frozen until they were processed using the MoBio PowerSoil DNA isolation kit for Sterivex filters as previously described (Christman et al., Reference Christman, León-Zayas, Zhao, Summers and Biddle2020). The DNA obtained was quantified using Qubit® fluorometer (Life Technologies), and used as a template for amplifying the V6 hypervariable region of 16S rRNA gene sequences using primer pairs BV6 969F (ACGCGHNRAACCTTACC) and BV6 1046R (CGACRRCCATGCANCACCT) for bacteria and AV6 958F (AATTGGANTCAACGCCGG) and AV6 1048R (CGRCRGCCATGYACCWC) for archaea (Comeau et al., Reference Comeau, Li, Tremblay, Carmack and Lovejoy2011). 16S rRNA gene sequencing was performed by Molecular Research (Shallowater, TX, USA) using Illumina MiSeq and their standard methods. Metagenomic libraries of the remaining DNA extracted were prepared using extracted DNA and the NEBNext UltraN II DNA library preparation kit. The metagenomic libraries were sequenced (2 × 250 bp) on an Illumina HiSeq platform at the Sequencing & Genotyping Center, University of Delaware.
Sequence analysis and Metagenome Assembled Genome recovery
16S rRNA gene amplicon sequence data were processed using the MR DNA analysis pipeline (Molecular Research). Briefly, reads were joined, depleted of barcodes and ambiguous base calls removed. Sequences were denoised, operational taxonomic units generated (97% similarity) and chimeras removed. Data were processed in MacQiime v 1.9.1 (Caporaso et al., Reference Caporaso, Kuczynski, Stombaugh, Bittinger, Bushman, Costello, Fierer, Peña, Goodrich and Gordon2010) using the SILVA v128 database (Quast et al., Reference Quast, Pruesse, Yilmaz, Gerken, Schweer, Yarza, Peplies and Glöckner2012) for taxonomic identification. While this is not an updated database, the authors wanted to compare the present data with older datasets that were previously published, and as such have not updated this analysis.
Metagenomic reads were quality trimmed using Trimmomatic (Bolger et al., Reference Bolger, Lohse and Usadel2014) applying default parameters then individually assembled using MegaHit (Li et al., Reference Li, Liu, Luo, Sadakane and Lam2015) with default settings. Assembled contigs larger than 1 kb were binned using MaxBin v2.2.7 (Wu et al., Reference Wu, Tang, Tringe, Simmons and Singer2014). The quality of the bins was improved via two strategies: (1) manual refinement via removing contigs exhibiting major coverage and GC skews; and (2) using Vizbin (Laczny et al., Reference Laczny, Sternal, Plugaru, Gawron, Atashpendar, Margossian, Coronado, van der Maaten, Vlassis and Wilmes2015) through clustering contigs based on genomic signature calculation. Finally, the quality and completeness of the bins were assessed using CheckM (Parks et al., Reference Parks, Imelfort, Skennerton, Hugenholtz and Tyson2015). Metagenome Assembled Genomes (MAGs) over 40% complete were prioritised for analysis. Genomes were de-replicated using dRep (version v2.0.5 with ANI > 99%) (Olm et al., Reference Olm, Brown, Brooks and Banfield2017). The sequence depth of contigs in each sample was determined by mapping trimmed reads onto the contigs using BBMap v.37.61 (Bushnell Reference Bushnell2014).
Raw data are available from the NCBI SRA database under BioProject ID PRJNA874027.
Phylogenetic placements
The phylogenomic placements of the MAGs were assessed using both concatenated alignment of 16 ribosomal proteins (RPs) and a concatenated alignment of 120 single-copy markers against the taxonomic scheme of the Genome Taxonomy Database using GTDB-Tk. Only three MAGs lacked enough ribosomal proteins and their phylogenetic positions were instead evaluated using GTDB-tk. Maximum-likelihood trees were calculated on the concatenation of 16 ribosomal proteins (L2, L3, L4, L5, L6, L14, L15, L16, L18, L22, L24, S3, S8, S10, S17 and S19) discovered, aligned and concatenated as previously described (Farag et al., Reference Farag, Zhao and Biddle2021). Trees were made using IQ-Tree (v1.6.6) (Nguyen et al., Reference Nguyen, Schmidt, von Haeseler and Minh2015) (located on CIPRES web server) (Miller et al., Reference Miller, Pfeiffer and Schwartz2010) using reference sequences (Hug et al., Reference Hug, Baker, Anantharaman, Brown, Probst, Castelle, Butterfield, Hernsdorf, Amano and Ise2016). Evolutionary distances were calculated based on the best-fit substitution model (VT + F + R10), single branch location was tested using 1000 ultrafast bootstraps and approximate Bayesian computation (Hoang et al., Reference Hoang, Chernomor, von Haeseler, Minh and Vinh2018), and branches with bootstrap support >80% were marked by black circles. The taxonomic profiles of the MAGs were verified using GTDBTk v1.3.0 (Chaumeil et al., Reference Chaumeil, Mussig, Hugenholtz and Parks2019) applying default parameters and GTDB Release 95.
Metabolic reconstruction and functional annotation
Metabolic capacities of queried MAGs were screened via their predicted proteins against in-house Hideen Markov Model (HMM) databases representing the key genes for different microbial energy metabolisms (electron donors and acceptors) and various biogeochemical cycles, including carbon, hydrogen, sulfur and nitrogen, as previously described (Farag et al., Reference Farag, Biddle, Zhao, Martino, House and León-Zayas2020; Beckmann et al., Reference Beckmann, Farag, Zhao, Christman, Prouty and Biddle2021). The level of completion of pathways in MAGs was assessed through querying predicted proteins against the Kyoto Encyclopedia of Genes and Genomes (KEGG) database using BlastKoala as previously described (Kanehisa et al., Reference Kanehisa, Sato and Morishima2016). MAGs were clustered based on the abundance profiles of the key metabolic genes as previously described (Kanehisa et al., Reference Kanehisa, Sato and Morishima2016) using the clustergrammer web-based tool (Fernandez et al., Reference Fernandez, Gundersen, Rahman, Grimes, Rikova, Hornbeck and Ma’ayan2017) applying Euclidean distance and complete linkage type. The clustering was supported by a combined p value of 0.0 for the ANOVA F-statistics results, indicating strong statistical significance. Replication rates of recovered MAGs were calculated using the iRep program applying default parameters (Brown et al., Reference Brown, Olm, Thomas and Banfield2016). The software only calculates iRep values for draft genomes only (≥70% complete, ≤200 fragments/Mbp sequence and ≤5% contamination).
Methyl coenzyme M reductase alpha subunit tree
The McrA phylogenetic tree was built by aligning McrA protein sequences detected using HMMsearch to reference sequences belonging to the McrA protein family using MUSCLE v3.8.31(Edgar Reference Edgar2004). Reference sequences were collected from AnnoTree (Mendler et al., Reference Mendler, Chen, Parks, Lobb, Hug and Doxey2019) using the KEGG entry K00399. Aligned sequences were manually curated using Geneious v9.0.5 (https://www.geneious.com). A maximum likelihood tree was constructed using IQ-TREE (v2.2.0) (Nguyen et al., Reference Nguyen, Schmidt, von Haeseler and Minh2015) through the CIPRES web server (Miller et al., Reference Miller, Pfeiffer and Schwartz2010) and evolutionary relationships were computed using the best fit model. Branch locations were tested using 1000 ultrafast bootstraps and the single branch position was evaluated using approximate Bayesian computation (Nguyen et al., Reference Nguyen, Schmidt, von Haeseler and Minh2015; Hoang et al., Reference Hoang, Chernomor, von Haeseler, Minh and Vinh2018).
Results
Oil-dwell microbial community structures based on the 16S rRNA gene survey
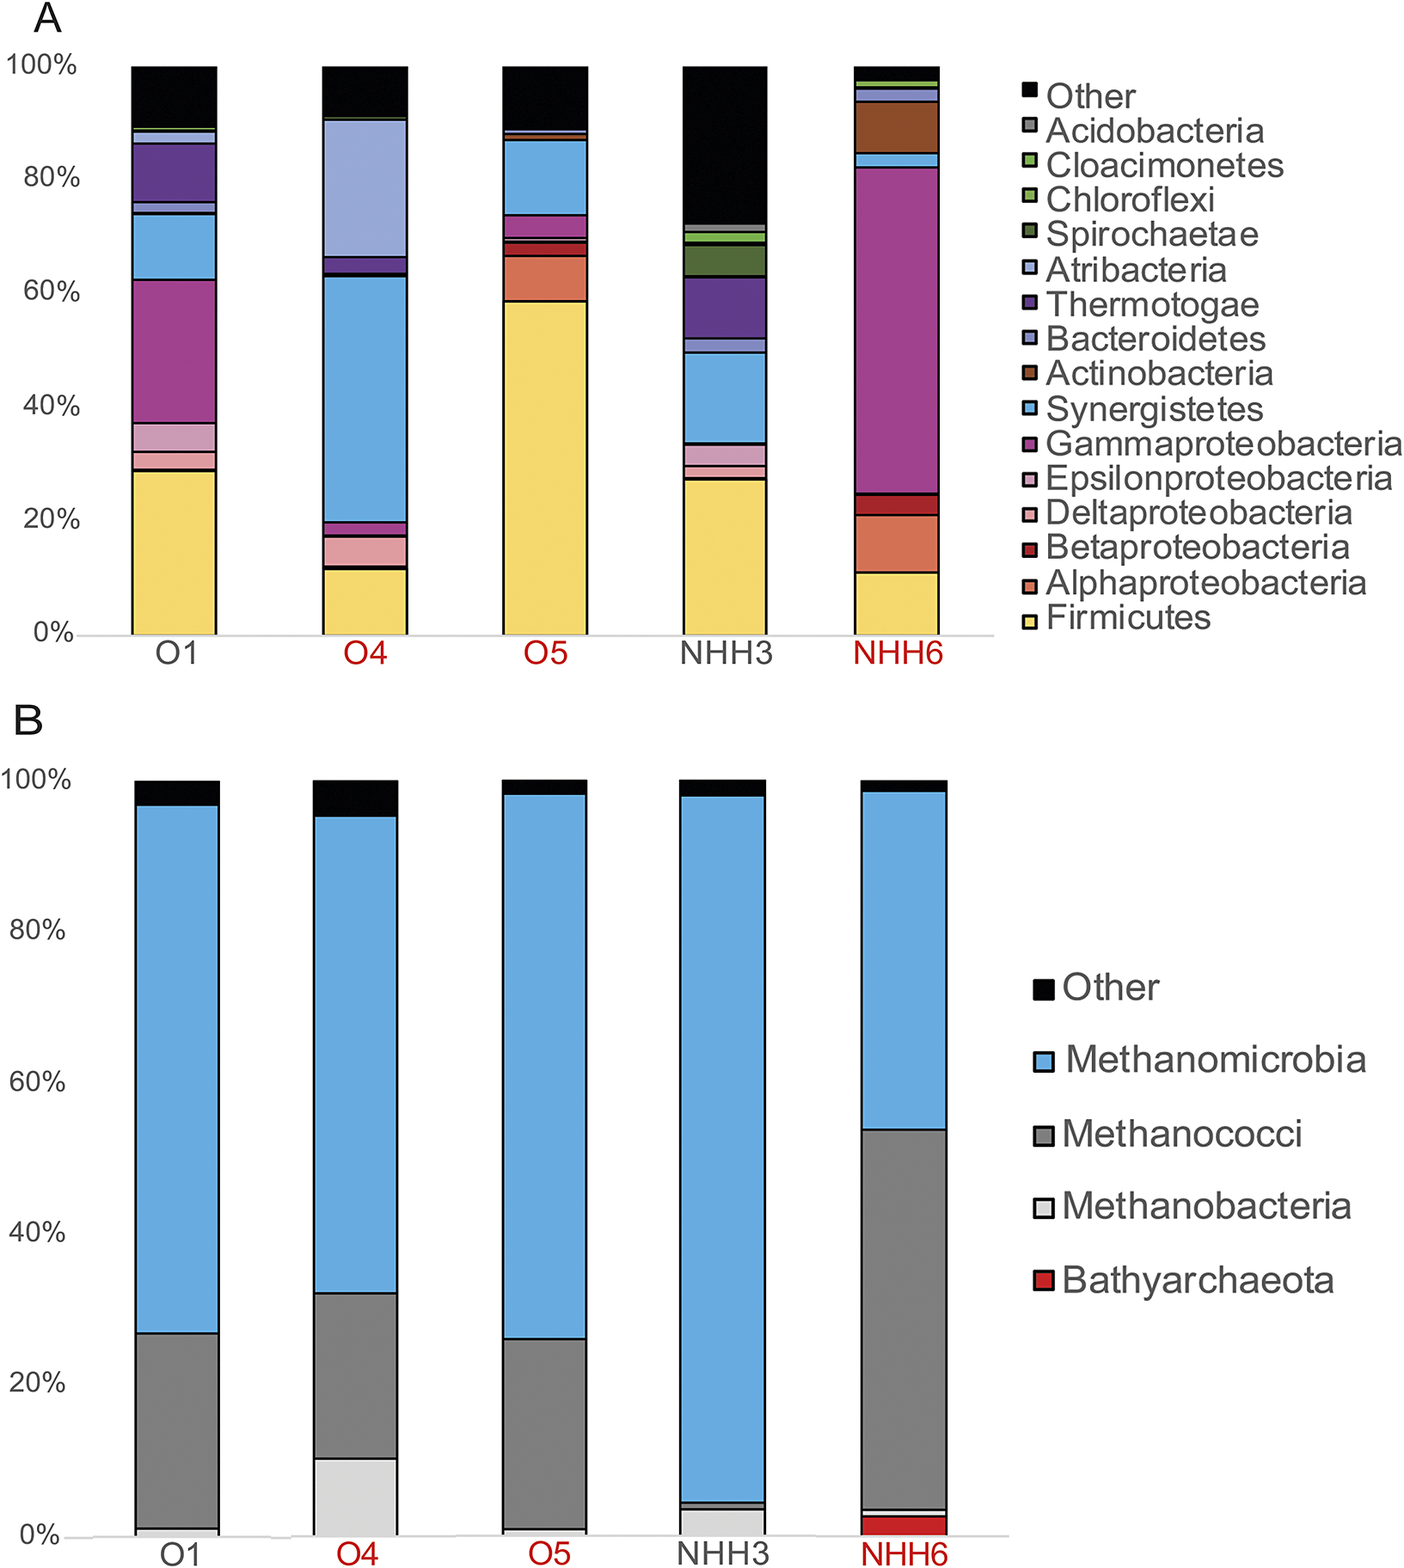
The microbes inhabiting the five different wells were examined through 16S rRNA gene-based analysis, separately analysing archaea and bacteria. Members of the euryarchaeotal classes, Methanomicrobia and Methanococci, represented the most abundant archaeal lineages in all of the sampled wells (Fig. 1). Methanomicrobia ranged between 44.75% in NHH6 up to 95.54% in NHH3, and Methanococci ranged between 0.8% in NHH3 up to 50.35% in NHH6. In contrast, the representation of the bacterial lineages was not steady along the wells and varied widely from one site to another. Bacterial communities were, in general, dominated by lineages belonging to Firmicutes, Alphaproteobacteria, Gammaproteobacteria, Deltaproteobacteria, Synergistetes, Thermotoga and Atribacteria (Fig. 1). Firmicutes were present in all wells with relative abundance ranges between 11% and 57%. Gammaproteobacteria were highly represented in wells O1 (25.02%) and NHH6 (57.27%). Well O4 was dominated by Synergistis (43.29%) and Atribacteria (24.24%). Since 16S rRNA gene amplicon analysis done with separate primers does not accurately indicate microbial abundance or determine function, and primers have detection limitations, we sequenced the metagenomes of these wells to interrogate the taxonomy and genetic potential of the entire microbial system without specific-primer bias. We acknowledge that genome-centric methods also have bias, but our ultimate goal is to examine metabolic potential, which a genome-centric metagenomic analysis does allow.
Microbial community structure in the six petroleum reservoirs of this study using 16S rRNA gene analysis. ‘O’ names are from the Olla field, ‘NHH’ names are from Nebo Hemphill. (A) Bacterial community structure. (B) Archaeal community structure. Well names in red indicate that oxygen was detected in the sample (Supplementary Table S1).

MAG quality and representation
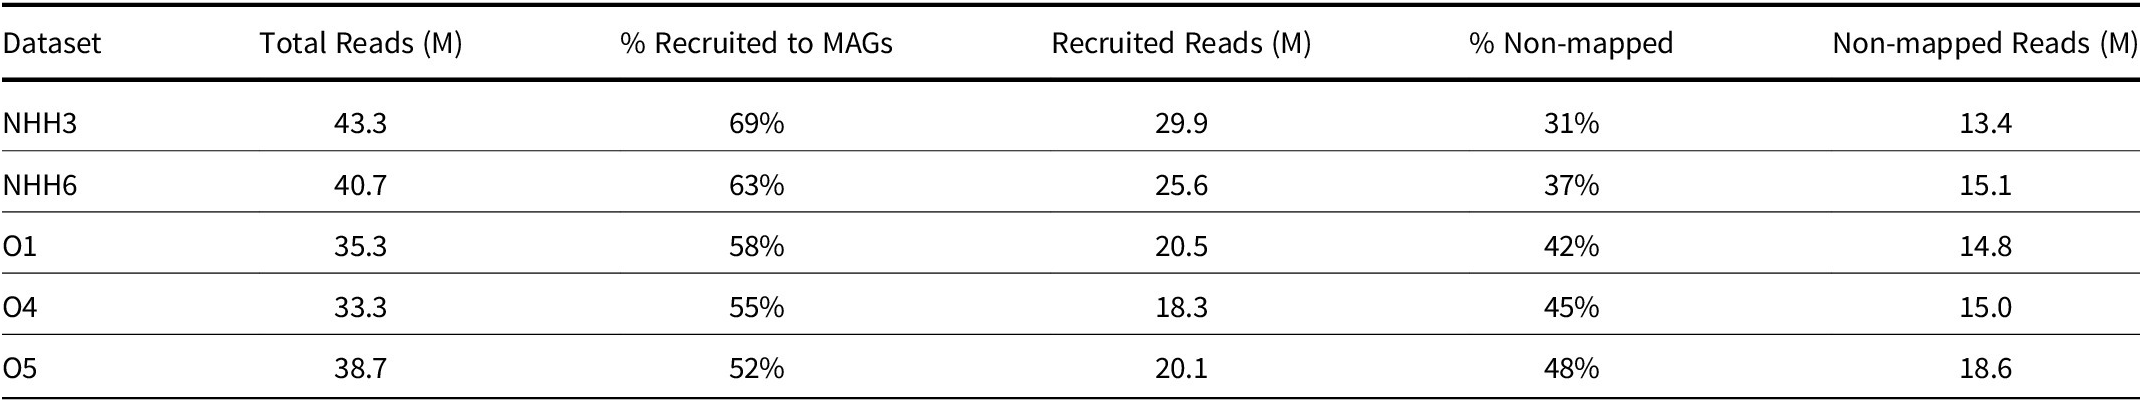
We employed genome-enabled metagenomics to resolve MAGs at each of the sites under study to understand the abundance and full metabolic potentials of the lineages present. We recovered 40 non-redundant MAGs belonging to 12 archaeal and bacterial phyla (Table 1; Fig. 2). In the discussion of the lineages we will use NCBI taxonomy; the current GTDB taxonomy correlations are listed in Table 1. Our percentage of recruited reads to MAGs ranged from 52% to 69%, showing that the majority of data went into MAG analysis (Table 2). MAGs from each well site were clustered together using the average nucleotide identity (ANI) cut-off score of 99%. Genomic bins showing the greatest completeness and smallest contamination levels were selected per cluster. Of the 40 MAGs, 13 were from O1, five were from O4, one was from O5, 18 were from NHH3 and three were from NHH6.
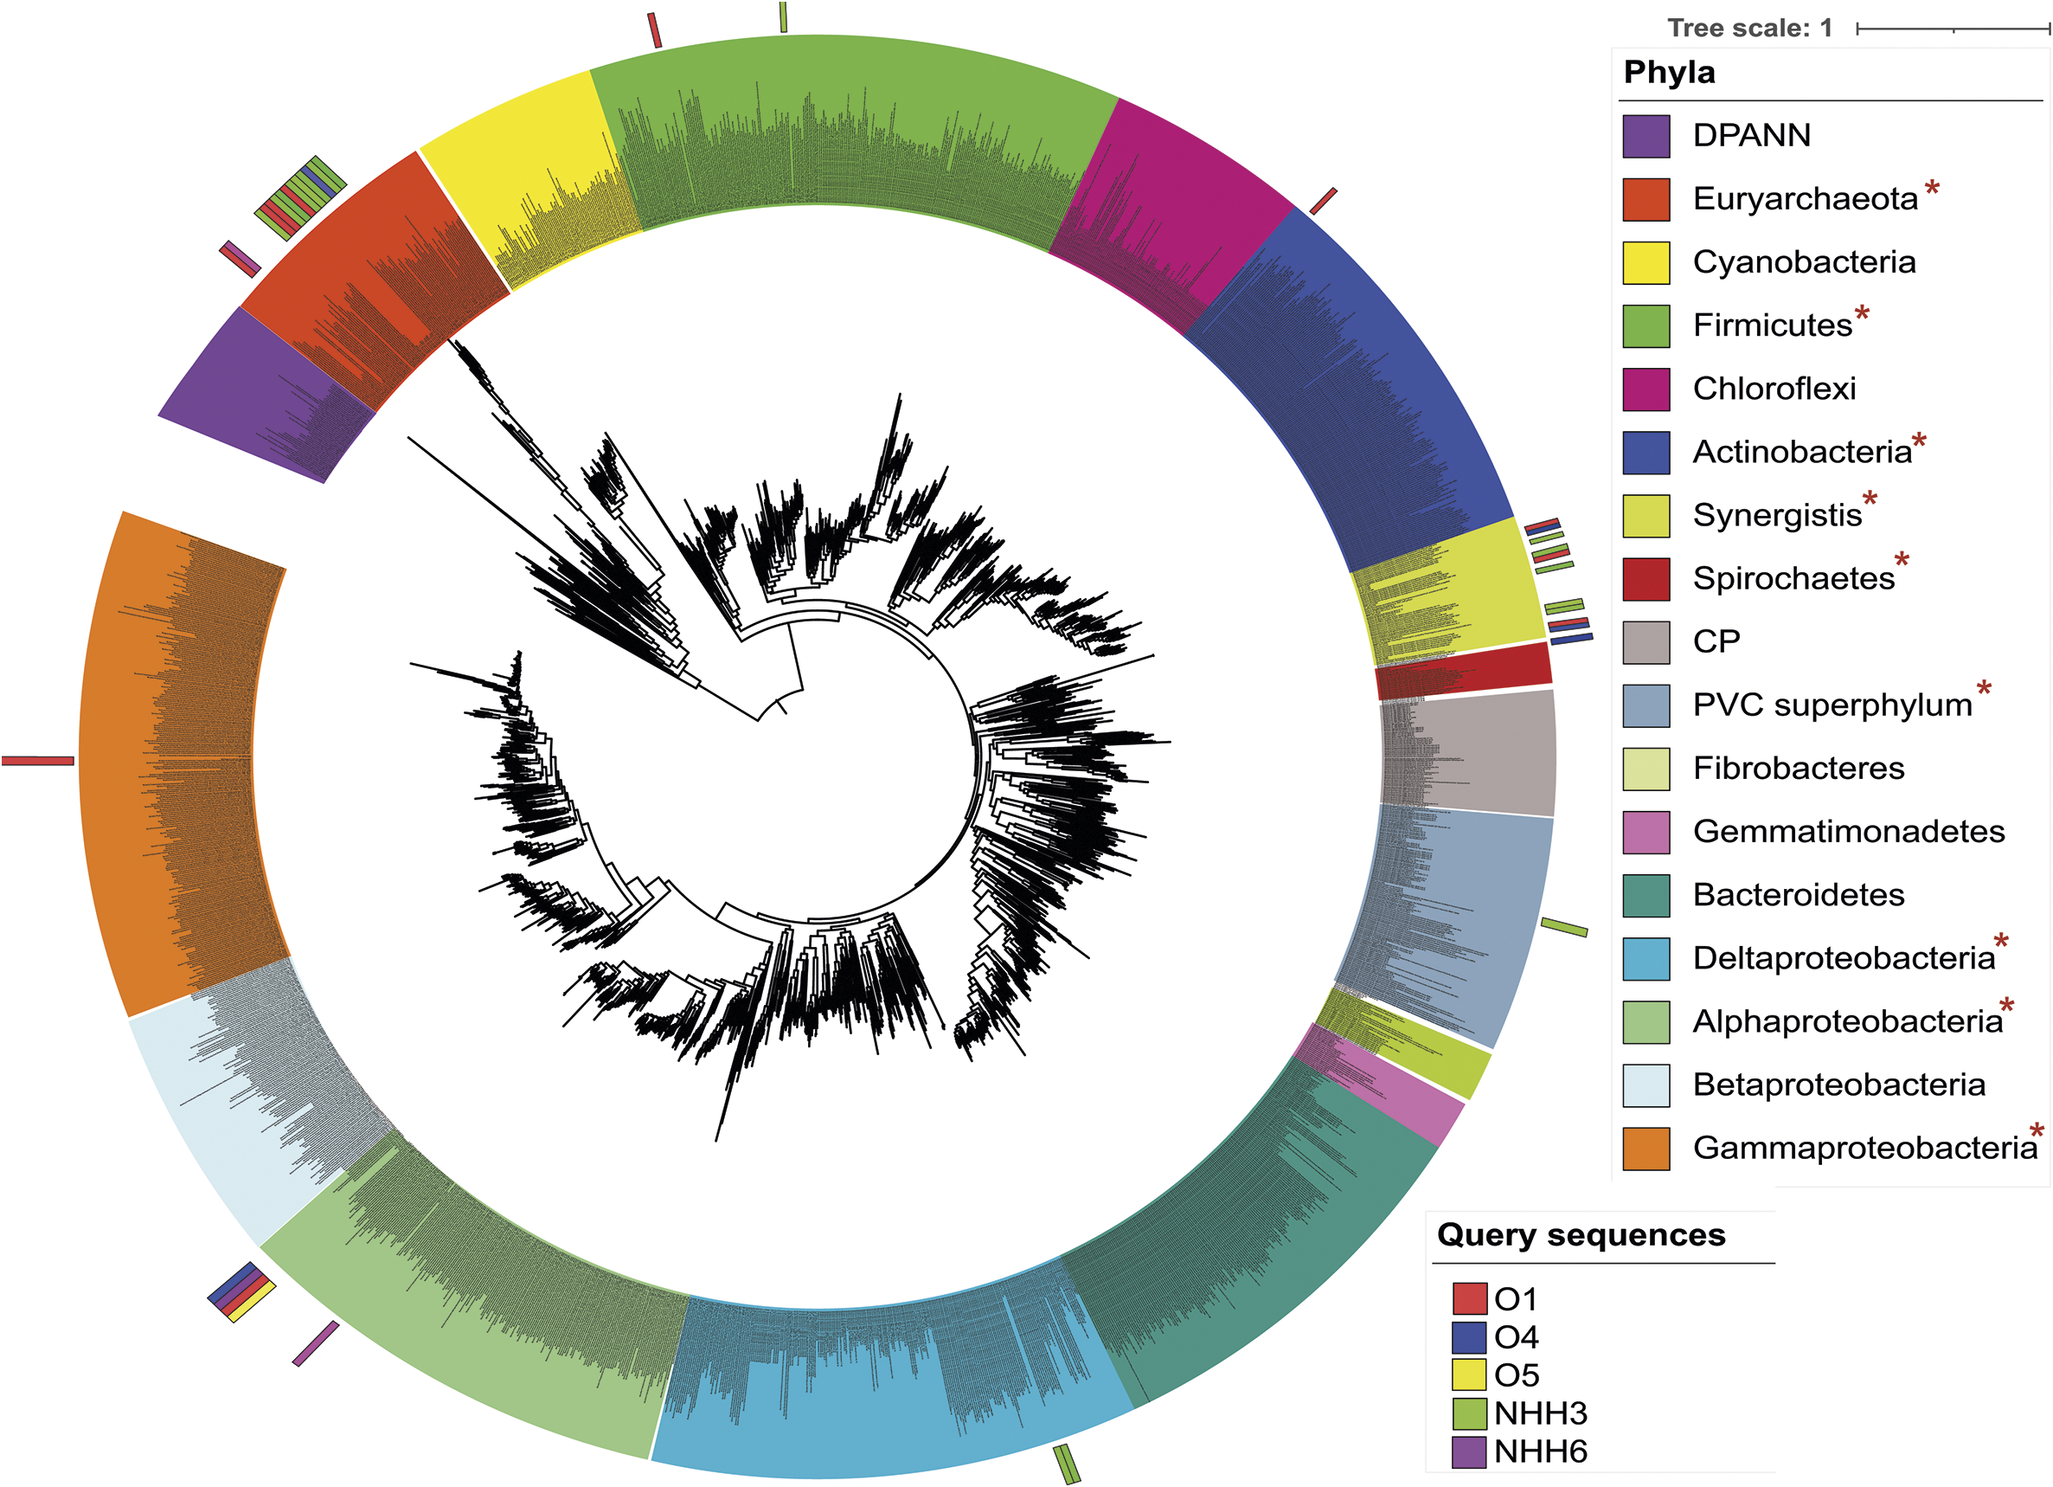
Phylogenetic placement of the draft genomes recovered from different petroleum reservoirs. The maximum-likelihood phylogenetic tree was calculated based on the concatenation of 16 ribosomal proteins (L2, L3, L4, L5, L6, L14, L15, L16, L18, L22, L24, S3, S8, S10, S17 and S19) retrieved from the Metagenome Assembled Genomes (MAGs) of this study and compared to reference archaeal and bacterial genomes. The relationships were inferred using the best fit substitution model (VT + F + R10) and nodes with bootstrap support >80% are marked by black circles. The scale bar indicates substitutions per site. Colours in the circle are the phyla and coloured bars on the outside of the circle indicate the query sequence well location within this study. Asterisks indicate phyla detected in this study via MAGs.

Read Recruitment to MAGs of Olla and Nebo Hemphill Wells

Recovered MAGs had estimated genome completeness ranging from 45.36% to 98.99% (median completeness of 73.78%, 31 MAGs were >60% complete) and showed low contamination levels <10% (median redundancy of 3.67%) (Table 1). Only genomes (>60% completeness and <5% contamination) were used to analyse the overall microbial functions and potential metabolic trade-offs between microbes in each site, and MAGs of lower completeness were used to examine redundancy of function within a specific class. Our phylogenomic analyses indicated that all the recovered MAGs belonged to one archaeal and 10 bacterial phyla (Fig. 2; Table 1). Euryarchaeota were highly represented in all analysed datasets with a total of 15/40 MAGs, and other lineages were less represented: Alphaproteobacteria had six, Synergistetes five, Thermotogae four, Firmicutes three, Deltaproteobacteria two and Gammaproteobacteria, Aureabacteria, Atribacteria, Cloacimonas and Actinobacteria were each represented by one MAG (Table 1). Sequence depth data of the MAGs indicated that members of phyla Synergistis, Firmicutes, Thermotogae, Proteobacteria and Euryarchaeota compose the majority of the microbial lineages present (Table 1).
Due to the high representation of euryarchaeotal MAGs, we subclassified them into sub-lineages (Supplementary Fig. S1). There was broad agreement on the Euryarchaeota sub-phylum affiliations between the MAGs (Supplementary Fig. S1) and the 16S rRNA gene amplicons (Fig. 1). Overall, 80% of the recovered Euryarchaeota MAGs belonged to phylum Halobacteriota; order Methanomicrobiales (six MAGs), order Methanotrichales (three MAGs), order Methanosarcinales (two MAGs) and one MAG (O1.bin.018) clustered with 16RPs sequences belonging to Candidatus Methanoliparium thermophilum. Additionally three Methanococcales MAGs were recovered, perhaps due to the high abundance of Methanococcales in datasets O1 (26% of archaea) and NHH6 (50% of archaea), as suggested by the 16S rRNA gene analysis.
Microbial community metabolic potential
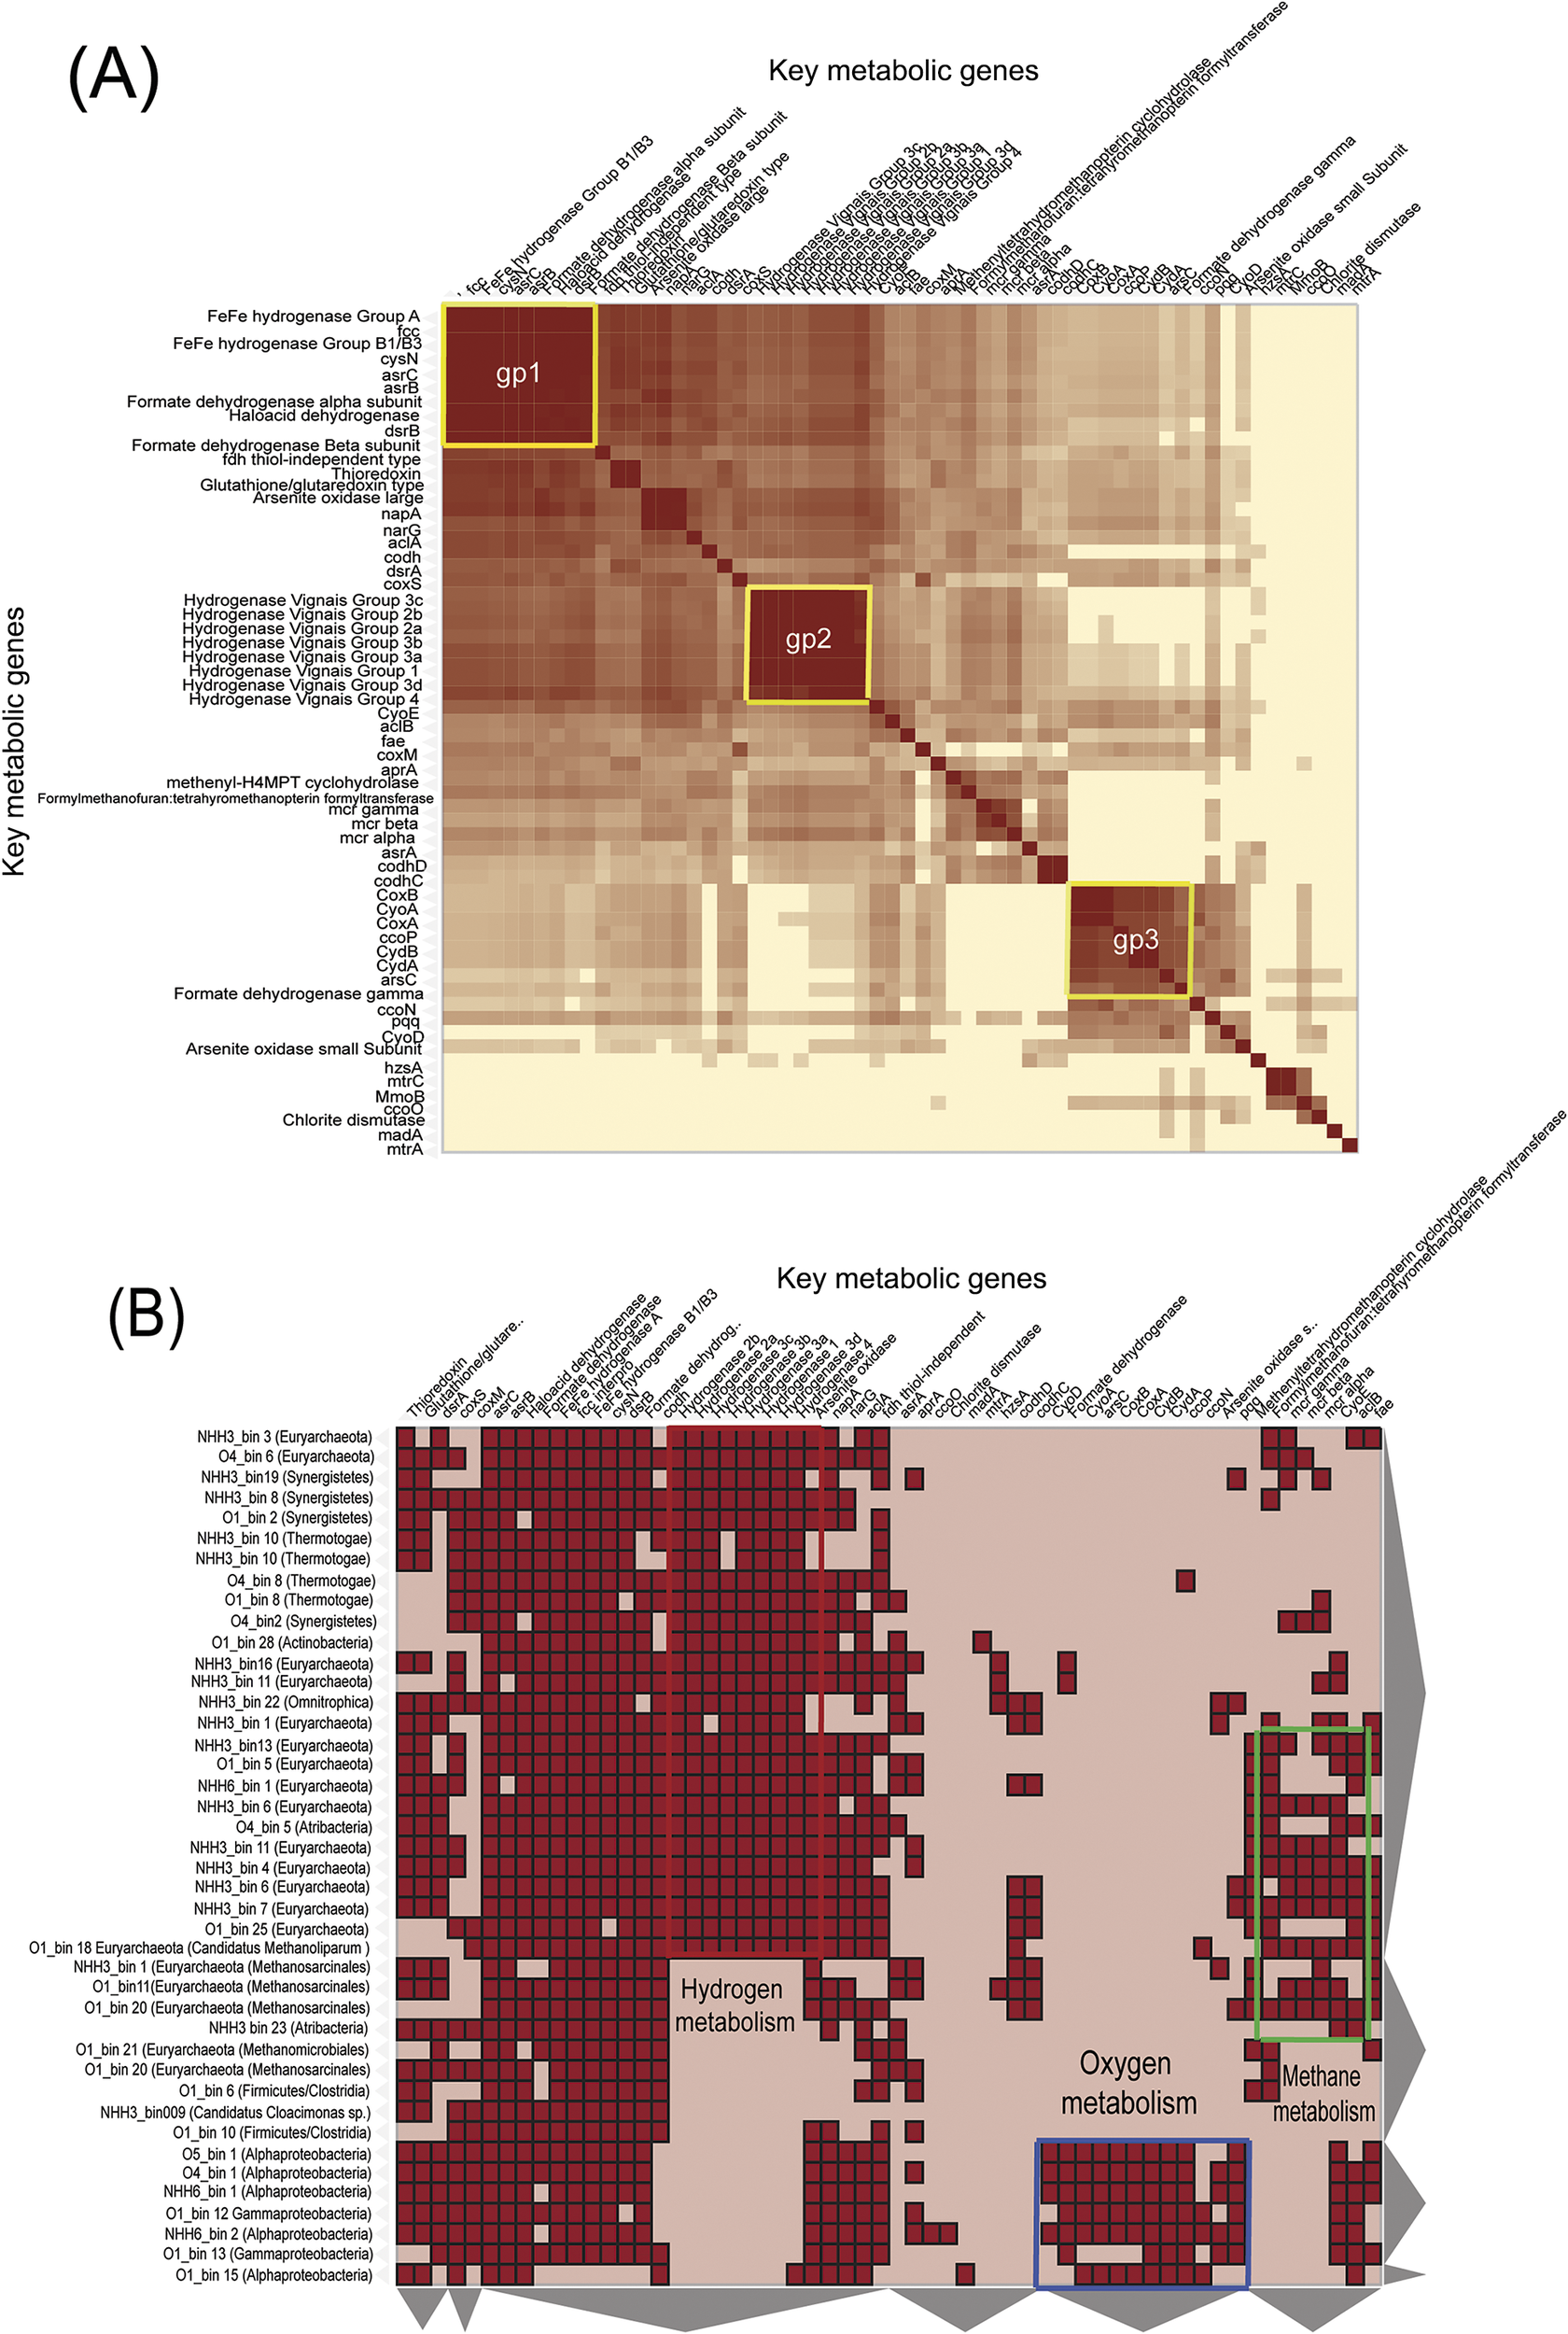
The 40 MAGs were screened using HMM databases to detect the presence/absence patterns of the key metabolic genes involved in different microbial energy metabolism (electron donors and acceptors) and biogeochemical cycles, including carbon, hydrogen, sulfur and nitrogen (Fig. 3; gene names and biogeochemical cycle details in Supplementary Table S1). The results suggest the presence of significant positive correlations between gene abundance in most of the wells (highlighted in yellow boxes in Fig. 3). The first cluster (gp 1) represents the core metabolic/energy-related genes that are present in almost 95% of the recovered MAGs from all wells, suggesting the importance of these genes for microbial survival. Genes in the first cluster can be categorised into three main groups: hydrogen metabolism-related genes (FeFe hydrogenase Group A and FeFe hydrogenase Group B1/B3), which potentially couple the oxidation of reducing equivalents with the liberation of H2 to be used in different fermentative pathways, sulfur metabolism including genes for sulfide oxidation (fcc), sulfite reduction (asrC and asrB), sulfate reduction (cycN and dsrB), and formate and arsenite reductases (Søndergaard et al., Reference Søndergaard, Pedersen and Greening2016). The second cluster (gp2) includes NiFe hydrogenases and was mainly present in MAGs belonging to three phyla, Euryarchaeota, Thermotogae and Synergistetes. Notably, most Euryarchaeota MAGs carried multiple copies of NiFe hydrogenases and belong to different classes. A detailed phylogenetic analysis of the NiFe hydrogenases (Supplementary Fig. S2) showed that the majority of the genes belong to group 4, which couples the oxidation of formate or other C1 compounds with the evolution of hydrogen to build proton motive force and produce energy. Also, some NiFe hydrogenases encoded by Synergistetes and Euryarchaeota MAGs were clustered with group 3d, which was involved in transferring electrons between H2 and NAD molecules. Lastly, many of the Euryarchaeota MAGs carried genes encoding for NiFe hydrogenase group 3a, which couples the oxidation of H2 to reduction of co-enzyme F420 during methanogenesis (Greening et al., Reference Greening, Biswas, Carere, Jackson, Taylor, Stott, Cook and Morales2016). The third gene cluster (gp3) includes genes that are involved in aerobic respiration at low (e.g. ccoN, ccoO, ccoP, cyoE, cydA, cydB) and high (e.g. coxA and coxB) oxygen tension. Notably, these oxygen respiration-related genes were limited to MAGs belonging to different proteobacterial classes (Alpha- and Gammaproteobacteria) (Fig. 3B) and from sites with detected oxygen levels: O4, O5 and NHH6; Supplementary Table S2). However, genes for oxygen tolerance were also detected in many alpha- and gamma-proteobacteria affiliated MAGs recovered from the O1 dataset despite no oxygen being detected in this well (Supplementary Table S2).
Microbial community functional gene analysis. (A) Similarity clustering heatmap of microbial community structures and functions coloured by abundance. The row and column of the matrix are identical (consisting of the genes involved in biogeochemical cycles and energy metabolism). The darker the colour, the higher the copy number of genes in the microbial community. The clustering was performed using Euclidean distance and complete linkage methods. Yellow boxes highlight the positive correlation clusters seen across all wells. (B) Heatmap clustering the recovered Metagenome Assembled Genomes (x axis) based on different biogeochemical cycles and energy metabolism-related gene profiles (y axis). The clustering was performed using Euclidean distance and complete linkage methods (significance was tested using the ANOVA statistic test; p value = 0). The yellow square highlights genes in hydrogen metabolism, the blue square highlights genes in oxygen metabolism and the green square highlights genes in methane metabolism. Grey triangles indicate the boundaries of clustering.

Presence of methanogenic communities in the wells
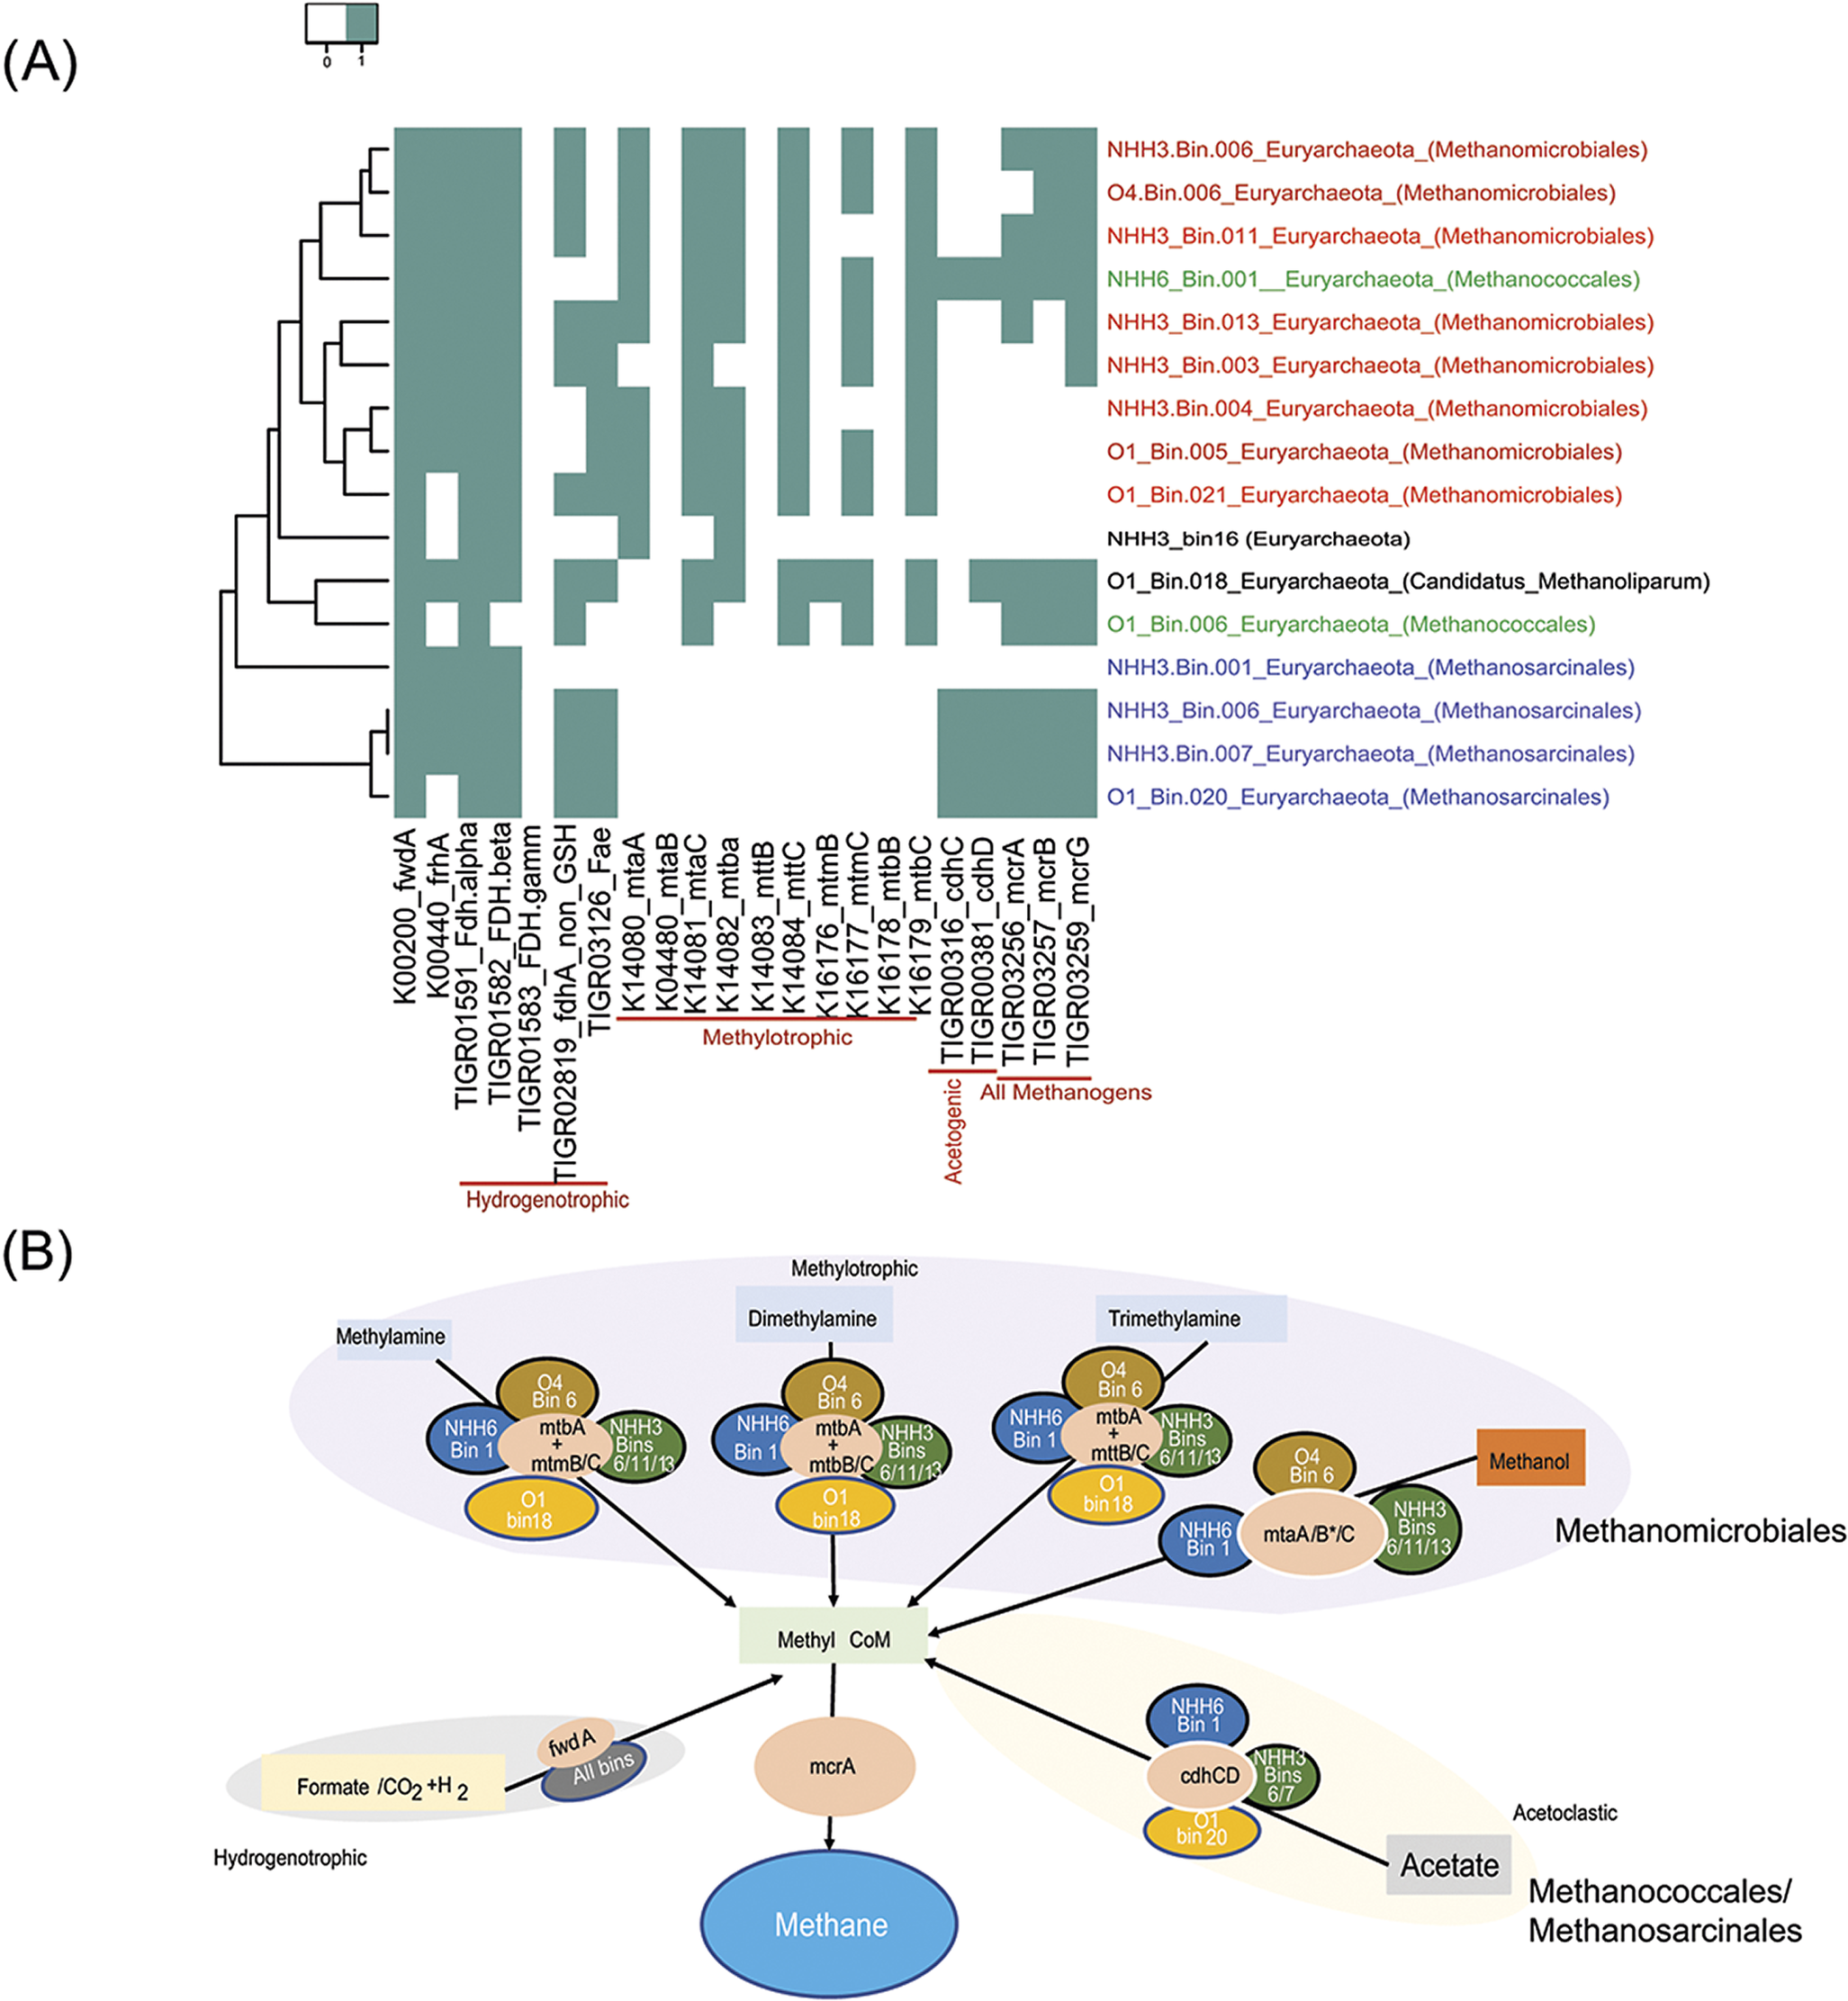
While gene signatures for aerobic respiration were seen, so was an anaerobic community. The abundance and the diversity of the methanogenic capabilities was reconstructed for hydrogenotrophic, acetoclastic and methylotrophic methanogenic pathways as well as anaerobic methane oxidation pathways across the 40 recovered MAGs. Our results indicated the presence of complete and functionally distinct methanogenic pathways in all examined communities. We detected the key gene for methanogenesis, methyl CoA reductase catalytic subunit A (mcrA) in 10/15 MAGs belonging to the phylum Euryarchaeota. None of these genes was related to known methane oxidising organisms. In general, the phylogenetic distribution of the detected mcrA genes was congruent with the phylogenomic affiliations of their respective MAGs, which suggested the affiliations of the mcrA genes to four euryarchaeotal orders (Methanosarcinales, Methanomicrobiales, Methanococcales and Candidatus Methanoliparum) and eight different genera (Supplemental Fig. S3). We only considered the MAG to harbour potential methanogenic capability if the mcrA gene was present. The key genes of methanogenesis were mapped to the euryarchaeal MAGs to decipher their potential methanogenic capabilities and substrate specialisations (Fig. 4A). The 10 euryarchaeotal MAGs recovered from sites (NHH3, NHH6, O1 and O4) and encoding for the mcrA gene showed potential capabilities to perform hydrogenotrophic methanogenesis (Fig. 4B). All MAGs encoded for formylmethanofuran dehydrogenase subunit A (K00200) and formate dehydrogenase (fdh) suggesting their potential to utilise CO2 and formate as methanogenic substrates, respectively. Methylotrophic and acetoclastic methanogenic pathways showed limited phylogenetic and site distribution patterns (Fig. 4). For example, the key acetoclastic methanogenesis genes cdhC (TIGR00316) and cdhD (TIGR00381) together with the mcrA genes were exclusively identified in Methanosarcinales MAGs recovered from sites NHH3 and O1 and a Methanococcales MAG from NHH6. Similarly, we observed a limited distribution of the mtbA (K14082) gene, which is a hallmark gene for the methylamine-mediated methylotrophic methanogenesis pathway and encodes for methyl-Co (III) methylamine-specific corrinoid protein:coenzyme M methyltransferase to mediate the reduction of various methylamines to methane. This gene was only detected in Methanomicrobiales MAGs from wells NHH3 and O4, a MAG belonging to Candidatus Methanoliparum from O1 and a Methanococcales MAG from NHH6.
Methane processing pathways in the Olla and Nebo Hemphill wells. (A) Distribution patterns of the key methanogenic genes across all assembled genomes from the metagenomic datasets. Metagenome Assembled Genomes (MAGs) were clustered based on methanogenic capabilities deduced from the presence/absence profiles of the main genes of methanogenesis. MAG clustering was performed using Euclidean distance and average linkage methods. The x axis includes the methanogenic pathways included in the analysis and the y axis includes the MAGs analysed. Coloured areas indicate the gene is present and white areas indicate the gene is absent. (B) Potential methanogenesis pathways encoded by the MAGs by starting substrate and genes/bins involved. All bins contained methyl CoM and mcrA genes.

Hydrocarbon degradation analysis in well O1 indicates potential metabolic trade-offs between aerobic and anaerobic microbial phyla
The 40 reconstructed genomes from all wells were screened for the presence of genes involved in the degradation of aromatic hydrocarbons. Our HMM-based analyses indicated the absence of the typical genes for anaerobic aromatic hydrocarbon degradation, n-alkane succinate synthase (assA) and benzylsuccinate synthase (bssA) from the MAGs and the metagenomic datasets. Then, we tested the possibility for aerobic hydrocarbon degradation through surveying all MAGs for proteins which play important roles in the degradation of aromatic hydrocarbons under oxic conditions, including oxygenases (including mono- and di-oxygenase) beside hydroxylase and esterase. We detected multiple oxygenases in MAGs belonging to Alpha and Gammaproteobacterial lineages recovered from well O1 and from wells with detected oxygen levels (NHH6, O4; Supplementary Table S2). Notably, these oxygenases were identified in MAGs with potential capabilities to respire oxygen as a terminal electron acceptor under high or low oxygen tensions (Fig. 3). Unfortunately, the numbers of MAGs recovered from NHH6 and O4 were not sufficient to draw full conclusions about the potential hydrocarbon degradation capacities in these two wells. However, we were able to use the 10 MAGs recovered from well O1 to broadly understand the potential mechanism of hydrocarbon degradation in this well.
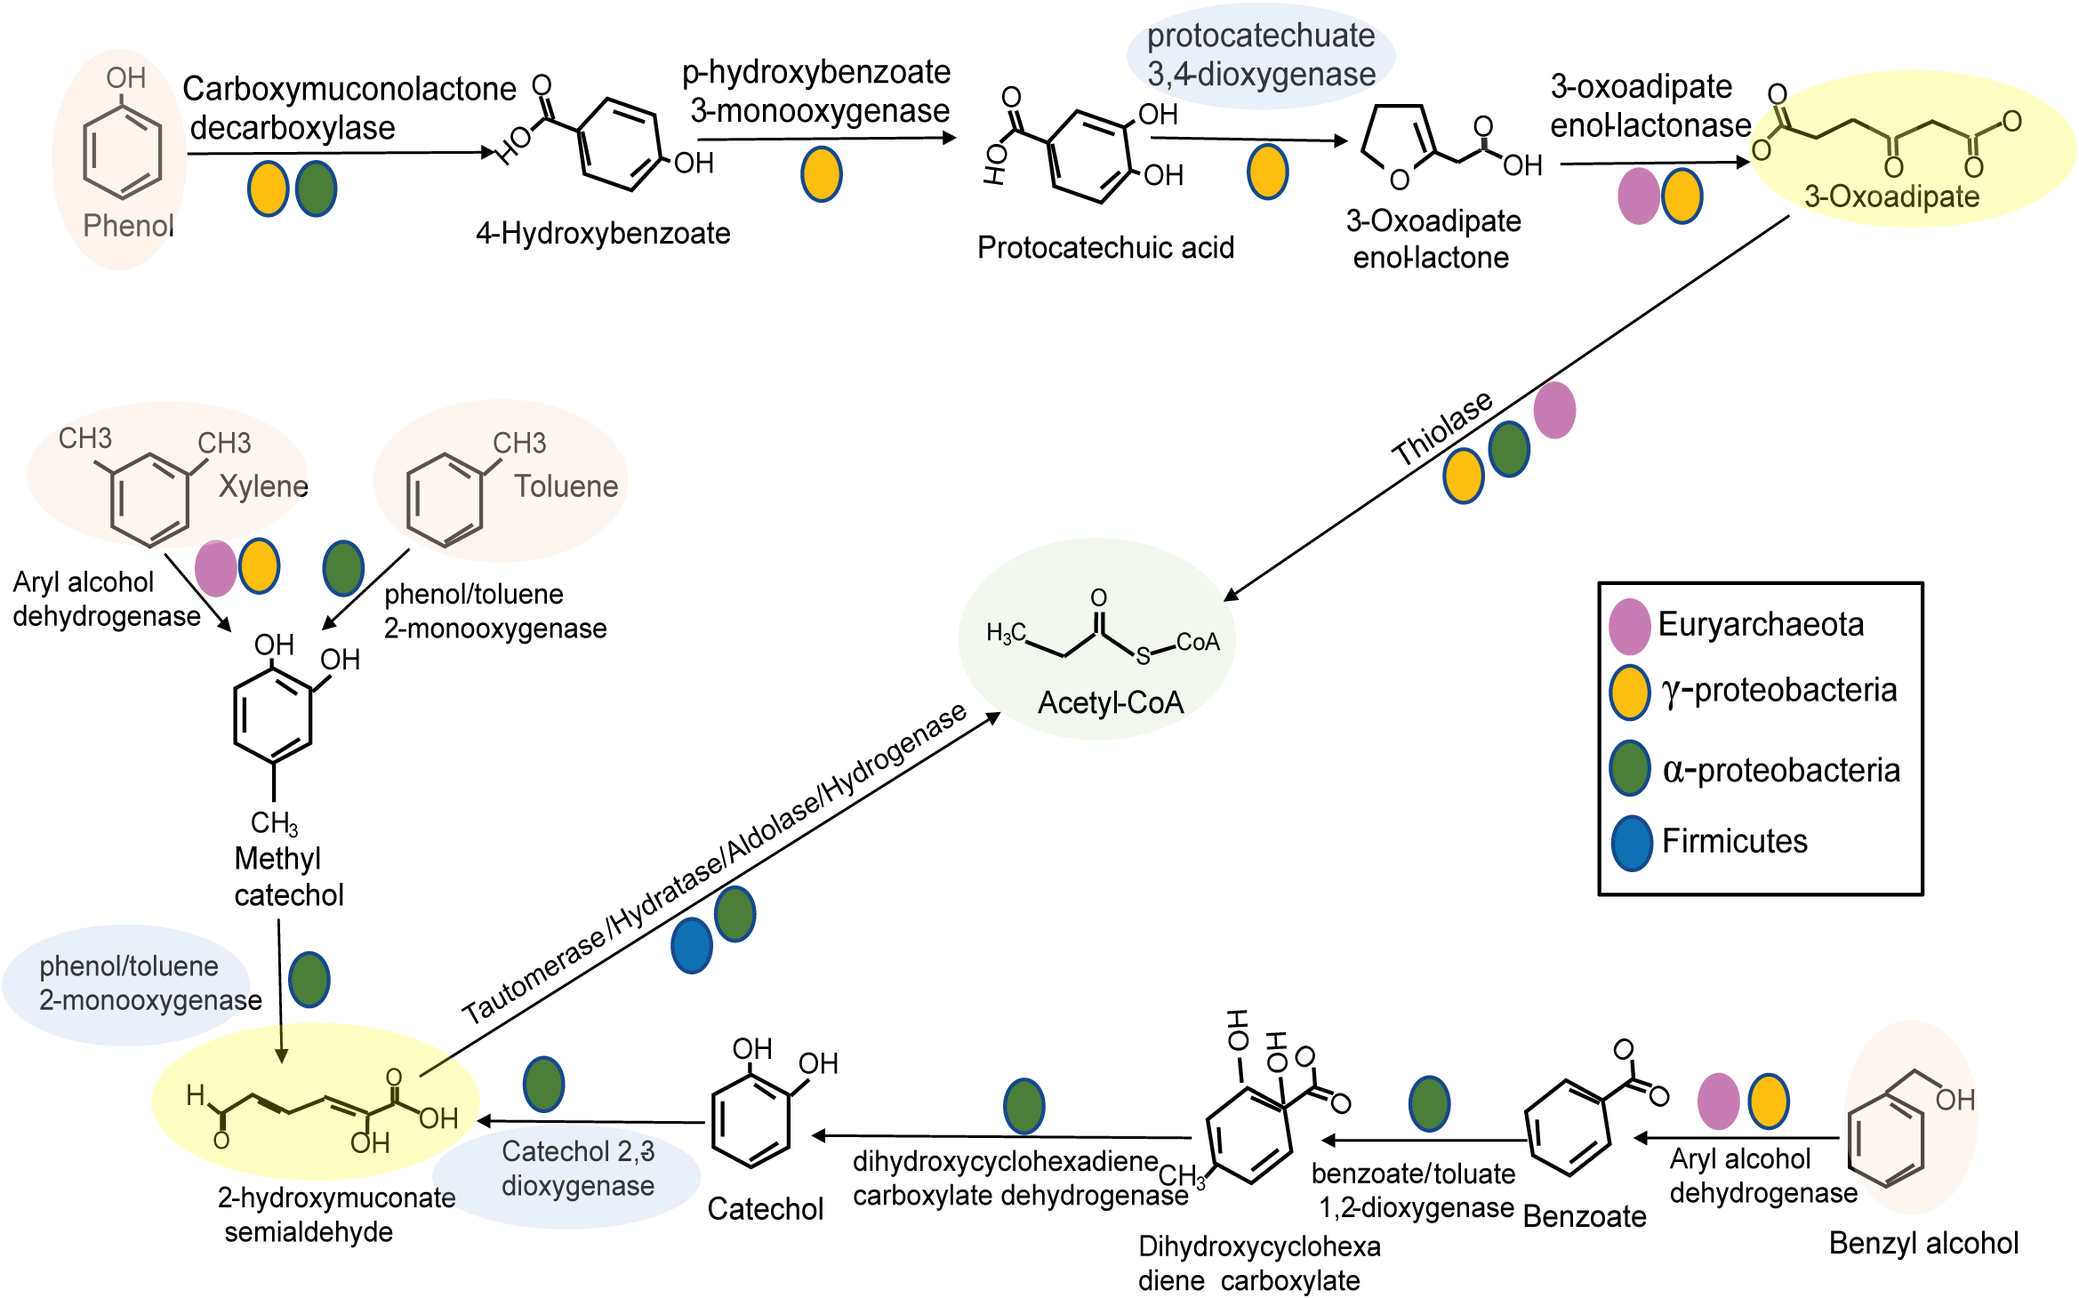
In the MAGs from well O1, no single microbe encoded the high energy-yielding entire hydrocarbon degradation pathway. Unlike C1 compound-related pathways (e.g. methane and formate), most of the MAGs encoded a single step or a few steps in hydrocarbon degradation. Metabolic reconstruction of the O1 MAGs revealed potential cooperation between various microbial lineages. We propose the model that Alphaproteobacteria, Gammaproteobacteria, Firmicutes and Euryarchaeota work together to degrade aromatic hydrocarbons including phenols, benzyl alcohol, xylene and toluene (Fig. 5). This suggests that the aromatic hydrocarbon degradation process requires cooperation between multiple microbial taxa to metabolise these compounds. With an open hydrocarbon ring, the microbial community has abundant signatures of beta-oxidation, which would further break down the aliphatic hydrocarbon under anaerobic conditions (Fig. 5).
Schematic model for coupled anaerobic/aerobic hydrocarbon degradation in well O1. Coloured symbols indicate in which lineage the genes were found. The oxygenase steps, shaded in blue, require oxygen and are encoded by Proteobacteria. Hydrocarbons are shaded in pink. Examples of aliphatic hydrocarbons are shaded in yellow. Acetyl-CoA, shaded in green, can be shared by fermentative organisms.

Genome sequencing depth, replication and geochemistry in situ
In the O1 dataset, where aerobic respiration genes were found (Fig. 3B), the predicted replication rates of organisms able to respire oxygen (e.g. Gammaprotebacteria O1_bin_012) were considered high (iRep>1.8; a value of 2 suggests genomes are actively replicating (37)) (Table 1). Overall, the organisms predicted to respire oxygen had replication values exceeding those detected of anaerobic organisms recovered from this dataset (Table 1). As the iRep method is genome-based, it could be interpreted equally across aerobes and anaerobes. However, we do note that iRep as a method should be interpreted with caution, as not every genome replicates the same way, but note the method has recently been shown to be effective in anaerobic archaeal genomes (Valentin-Alvarado et al., Reference Valentin-Alvarado, Appler, De Anda, Schoelmerich, West-Roberts, Kivenson, Crits-Christoph, Ly, Sachdeva and Greening2024). In contrast, the genome sequencing depth levels of anaerobic organisms (e.g. Synergistis O1_bin_002 and Euryarchaeota O1_bin_005) were abundant in the dataset with sequencing depth levels of 111.39X and 83.3X, respectively, which exceeded the sequencing depth estimates calculated for the expected aerobe Gammaprotebacteria O1_bin_012 (23.9X) (Table 1). These results suggest that aerobic organisms such as the Proteobacteria exhibited high levels of replication in situ, but that anaerobes were potentially more abundant due to their higher sequencing depth. For comparison in the NHH3 dataset, aerobic respiration-related genes were barely detected in any of the recovered MAGs, suggesting the presence of strict anoxic conditions in these wells and agreeing with the geochemical data collected for the same wells (Supplementary Table S2 and S3). The anaerobic organisms dwelling in the NHH3 wells have an average iRep value of 1.33 ± 0.11, suggesting that a third of all genomes are actively replicating, with the caveat that iRep may not be extremely reliable.
The geochemistry of these wells agreed somewhat with the genomic results. Despite the presence of aerobic respiration in the well O1 metagenome, no detectable oxygen was found (Supplementary Table S2). Wells O4, O5 and NHH6 also had aerobic respiration genes detected, along with oxygen gas at 10.24%, 9.01% and 0.015%, respectively. We note that well NHH6, which did not undergo the CO2-EOR process, contains only 0.015% oxygen, orders of magnitude less than the Olla field wells. We cannot rule out the possibility that this oxygen measurement may be a sampling error. However, the similarity of the other geochemistry of the oil field samples suggests that it is not an error (Supplementary Table S2 and S3). All of the wells in the Olla field (O1, O4, O5) showed an increased level of CO2, potentially remnant from the CO2-EOR process. Well O1 contained 10.2% CO2, while wells O4 and O5 contained 17.9% and 21.05%, respectively. Due to there being less CO2 within well O1 than the other Olla samples, but with undetectable oxygen, we interpret this to indicate that microbial metabolism has consumed CO2 within O1, and concurrently consumed the oxygen that was initially within the well, or that oxygen may be introduced in a cryptic manner continuously. In well O1, we found abundant signatures of aerobic metabolism (Fig. 3), but detected none in the NHH3 well, which is anoxic. Additionally, the sequencing depth and genome completion of the aerobic and anaerobic MAGs was high in O1, suggesting that this population is large and had been in place beyond a sudden contaminant. The contamination could have come during the final steps of fluid retrieval and sampling, but even the 16S rRNA gene amplicon sequencing results for the truly anoxic well, NHH3, did not show microbes known for aerobic metabolisms (Fig. 1).
Because of the signature of oxygen respiration metabolism in the metagenome and the relatively high oxygen levels in O4 and O5, we hypothesise that oxygen gas may have been introduced during the CO2-EOR process, alongside the injected CO2. Other sources of oxygen may also be possible, including groundwater interactions; however, the Nebo Hemphill samples appear unaffected. Considering the microbial consortium in O1 that has managed to trade steps in the consumption of hydrocarbons, as indicated by genomics (Fig. 5), the subsurface population of O1 may be actively consuming oxygen, keeping it below a level of detection.
Discussion
The Olla and Nebo Hemphill oil fields have been investigated multiple times for the microbiome of the petroleum system. Previous studies have noted the predominance of hydrogenotrophic methanogens and high rates of methane production, particularly at the Olla field (McIntosh et al., Reference McIntosh, Warwick, Martini and Osborn2010; Shelton et al., Reference Shelton, McIntosh, Warwick and Yi2014, Reference Shelton, Akob, McIntosh, Fierer, Spear, Warwick and McCray2016a,Reference Shelton, McIntosh, Warwick and McCrayb, Reference Shelton, Andrews, Akob, DeVera, Mumford, McCray and McIntosh2018; Tyne et al., Reference Tyne, Barry, Lawson, Byrne, Warr, Xie, Hillegonds, Formolo, Summers and Skinner2021). Previous studies also showed a dominance of methanogenic archaea and a group of diverse bacteria that vary from well to well (Shelton et al., Reference Shelton, Andrews, Akob, DeVera, Mumford, McCray and McIntosh2018). We found similar, but not exactly the same results, but we used a different methodology. Our work agrees in general with these previous studies and proposes a new mechanism for why the Olla field methanogenesis rates are particularly high. In addition to higher CO2 availability, we hypothesise, based on our evidence, that oxygen may play a role in hydrocarbon breakdown. The metagenomes presented here suggest that a combination of aerobic and anaerobic microorganisms works to allow greater access to aromatic carbons. Hydrocarbon degradation is more thermodynamically favourable under oxic conditions, when oxygenases and hydrolases can speed up the dearomatisation steps. We do note that only sampling the produced water is of course a limit on this study, and that in situ activity could occur with additional biofilm and rock-related organisms, and at this point we can offer no specifics as to how these microbial communities are segregated or together as physical assemblages in situ. Also, due to single-time sampling, years after CO2 injection, we are not able to predict or describe how such assemblages arose and may have changed over time.
Our data suggest oxic conditions enrich specific microbial groups capable of conducting syntrophic interactions with methanogens, linking hydrocarbon degradation to methanogenesis through the sharing of fermentative products (Fig. 6). In well O1, Alpha- and Gammaproteobacteria are dominant members encoding the capacity to degrade aromatic hydrocarbons using hydrolases and mono- and di-oxygenases. Their increased level of hydrocarbon degradation increases the accessible carbon and hydrogen sources in the oil well in the form of tractable fermentative products such as acetate (Supplementary Table S3), which supports methanogenic activities. No single MAG harboured the full set of genes required to completely mineralise aromatic hydrocarbons (C6+ compounds). Each MAG was consistently missing at least one or two steps in the pathway, but the entire function is encoded within the overall community. These cooperative networks should have the ability to mineralise recalcitrant compounds. Conversely, low-carbon compound metabolisms (e.g. formate, acetate, butyrate and methane) may be performed by single organisms. Additional conversions of substances may also occur by more minor populations not observed via metagenomics, yet observable in 16S rRNA gene amplicon sequencing. As such, our analysis is a broad pass on the biochemical potential of the community.
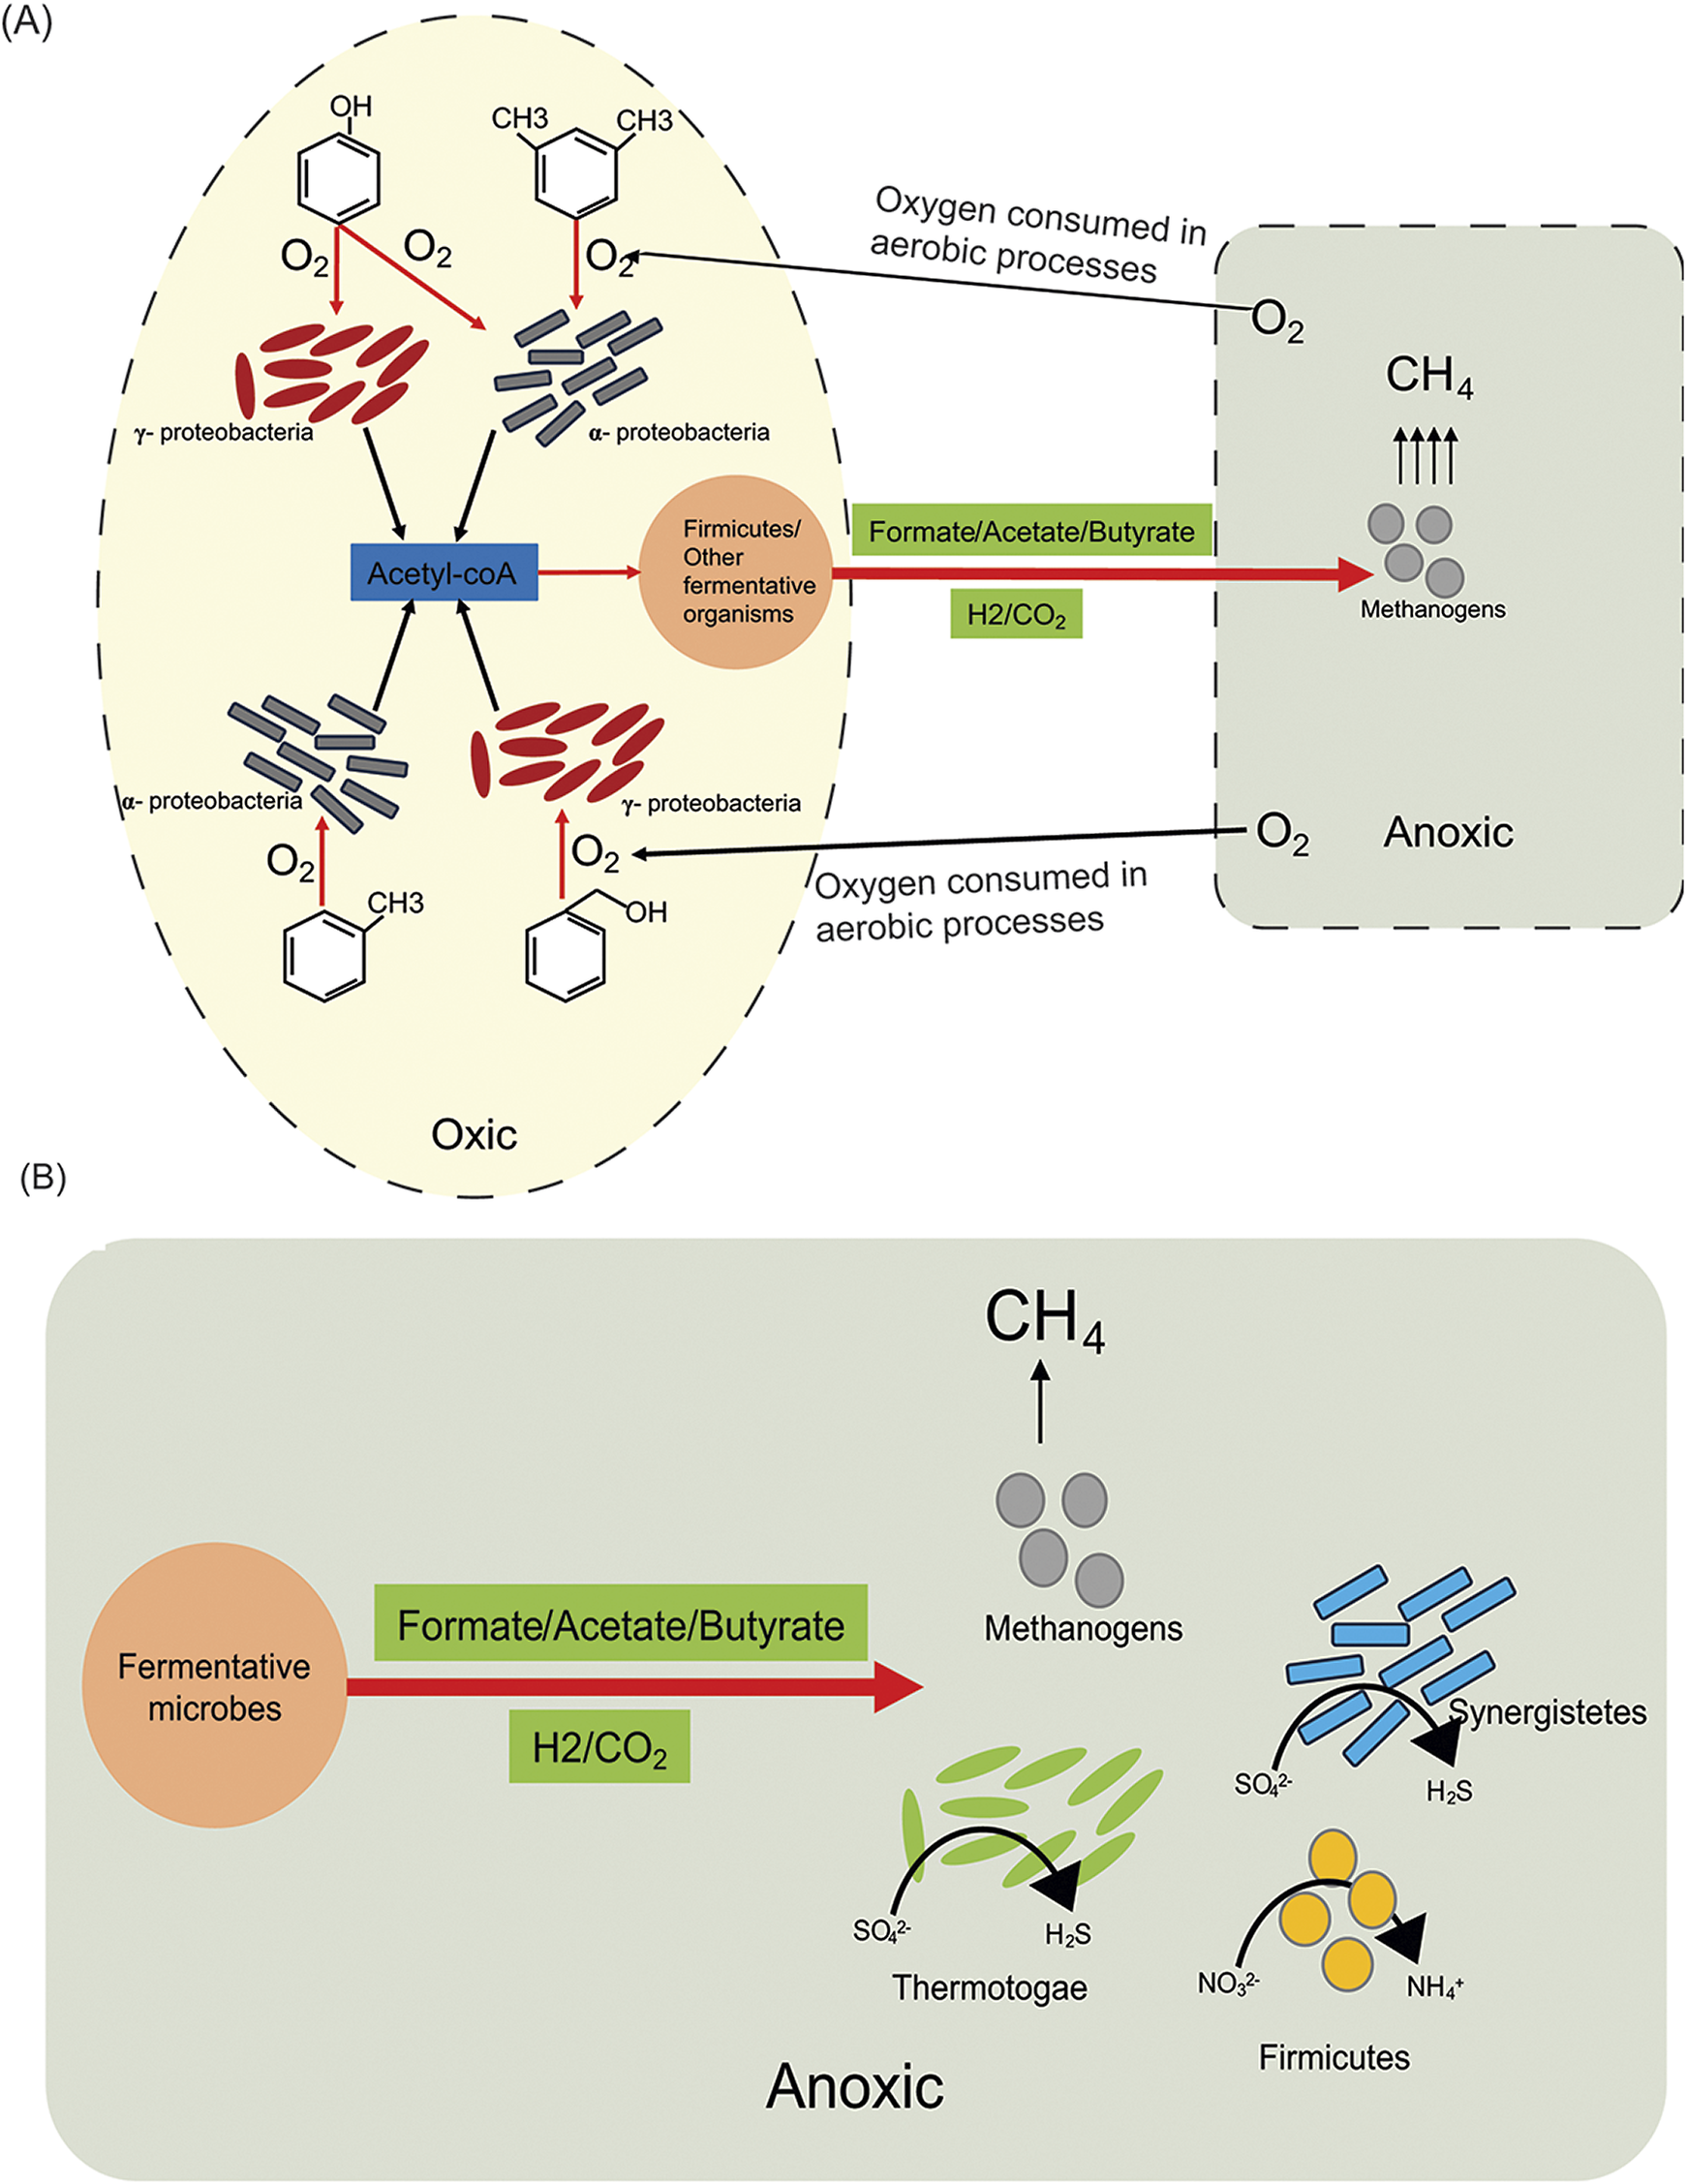
Proposed model of microbial interactions in the oil wells. (A) In well O1, products are shared across a proposed oxic/anoxic interface of unknown origin. (B) In well NHH3, anoxic conditions allow for competitive fermentative bacteria.

While well O1 no longer has measurable oxygen, we argue that it may have recently had more oxygen due to the abundance of oxygen-respiring organisms found, the geochemically similarities to other Olla wells that still have more oxygen and the intricacy of the metabolic network that developed in the well, something that we do not anticipate would happen in the relatively short time during sampling. The oxygen-respiring microbes have high replication rates and have a broad range of metabolic functions to create favourable conditions for methanogens. We hypothesise that, as found in other environments where methane is produced in the presence of oxygen (Wilmoth et al., Reference Wilmoth, Schaefer, Schlesinger, Roth, Hatcher, Shoemaker and Zhang2021, Angle et al., Reference Angle, Morin, Solden, Narrowe, Smith, Borton, Rey-Sanchez, Daly, Mirfenderesgi and Hoyt2017, Schweitzer et al., Reference Schweitzer, Smith, Barnhart, McKay, Gerlach, Cunningham, Malmstrom, Goudeau and Fields2022), this methane paradox occurs due to niche partitioning between oxic and anoxic communities with free transfer of metabolites, primarily fermentative products (e.g. formate, acetate and butyrate) as well as electrons across the oxic/anoxic transition zone (Fig. 6). The development of these niches with different oxic conditions would essentially require a relatively long residence time with low level of mixing in the oil well, as well as high replication rates and metabolic activities of the aerobic organisms enabling them to consume oxygen at high rates sufficient to create anoxic niches for methanogens and potentially draw down the ambient oxygen concentration. If this hypothesis is correct, wells O4 and O5 may develop in this direction also. While well NHH6 had a minor amount of oxygen (0.015%), it does not appear to be enough to shift the balance of hydrocarbon degradation in the oil well.
In the anoxic well NHH3, many bacterial groups have the capacity to utilise H2 and use sulfate/sulfite and in some cases nitrate as terminal electron acceptors. These bacterial groups show relatively high abundance along with members of Euryarchaeota. For example, in well NHH3, members of Thermotoga and Synergistetes were highly abundant and they showed the capacity to utilise molecular hydrogen using different classes of FeFe and NiFe hydrogenases as well as the potential to reduce sulfate, sulfite and nitrate. We hypothesise that fermentative bacteria outcompete methanogenic archaea for the available carbon and hydrogen substrate, thereby decreasing the amount of biogenic methanogenesis (Fig. 6). In contrast, the accumulation of fermentative products at a rate faster than their utilisation was seen in the wells with oxygen, which suggests a lower level of competition of fermentative bacteria with methanogenic archaea. Previous work suggested that the Olla field contained isotopic signatures indicative of a solely microbial origin for its methane, whereas the Nebo Hemphill field isotopically looks like a mixture of thermogenic and biogenic gas (Tyne et al., Reference Tyne, Barry, Lawson, Byrne, Warr, Xie, Hillegonds, Formolo, Summers and Skinner2021). Our work agrees with this, as the fermentative bacteria outcompeting the methanogens at Nebo Hemphill under anoxic conditions would create less biogenic methane gas.
The physio-chemical parameters of the Olla field are ideal for methanogenic activities (McIntosh et al., Reference McIntosh, Warwick, Martini and Osborn2010; Shelton et al., Reference Shelton, McIntosh, Warwick and Yi2014, Reference Shelton, Akob, McIntosh, Fierer, Spear, Warwick and McCray2016a,Reference Shelton, McIntosh, Warwick and McCrayb, Reference Shelton, Andrews, Akob, DeVera, Mumford, McCray and McIntosh2018; Tyne et al., Reference Tyne, Barry, Lawson, Byrne, Warr, Xie, Hillegonds, Formolo, Summers and Skinner2021). Many microbial activities appear to occur at the Olla field, including but not limited to microbial methanogenesis, methane oxidation and fermentation (Tyne et al., Reference Tyne, Barry, Lawson, Byrne, Warr, Xie, Hillegonds, Formolo, Summers and Skinner2021; Shelton et al., Reference Shelton, McIntosh, Warwick and Yi2014). Because of the microbial community and its ability to efficiently break down hydrocarbon material, the activity of methanogenic microbes may also be enhanced. We hypothesise due to the measurement of oxygen from Olla wells O4 and O5, and the presence of aerobic bacterial genes in these wells, that oxygen may have been delivered to the subsurface during the process of CO2-EOR. In comparison with Nebo Hemphill, where well NHH6 contained a minor amount of oxygen, and NHH3 had no detectable oxygen, we observe that fermentative bacteria may be outcompeting methanogenic archaea, preventing the production of biogenic gas. Alternative theories are possible, considering that additional oil reservoirs have previously shown genes of aerobic organisms (An et al., Reference An, Caffrey, Soh, Agrawal, Brown, Budwill, Dong, Dunfield, Foght and Gieg2013) and oxygen is generally more prevalent in subsurface environments, potentially due to in situ interactions with lithology (Ruff et al., Reference Ruff, Humez, de Angelis, Diao, Nightingale, Cho, Connors, Kuloyo, Seltzer and Bowman2023). If the process of CO2-EOR did trap oxygen below ground, this suggests that subsurface CCS should not only consider the potential for methane production during site selection, but that including oxygen may alter the availability for microbial substrates below ground. The subsurface biosphere will interact with native materials and introduced gases such as CCS, and we note these processes can be predicted prior to injection and measured during storage. Further studies with transcriptomics and metabolomics could better detail specific activated pathways to understand microbial interactions in the subsurface.
Supplementary material
The supplementary material for this article can be found at http://doi.org/10.1180/gbi.2025.10005.
COI statement
Funding for this work was provided by ExxonMobil Research and Engineering. The authors declare no conflict of interest.
Data availability
The datasets generated during and/or analysed during the current study are available in the NCBI repository, under BioProject ID PRJNA874027.
Acknowledgements
The authors thank all the technicians that assisted with well sampling, and Andrew Franca for research support. Support from the University of Delaware CBCB Bioinformatics Core Facility and use of the BIOMIX computational cluster was made possible through funding from Delaware INBRE (NIH NIGMS P20 GM103446), the State of Delaware, and the Delaware Biotechnology Institute. This work was funded by ExxonMobil Research and Engineering.


 Open access