





Introduction
Throughout the coronavirus disease 2019 (COVID-19) pandemic, wastewater-based epidemiology (WBE) complemented traditional disease surveillance infrastructure by offering information about symptomatic and asymptomatic severe acute respiratory syndrome coronavirus 2 (SARS-CoV-2) infections in sewered populations (~80% of U.S. households) without reliance on clinical testing, which can depend on test availability, health behaviours, and healthcare access. Additional advantages of WBE include its ability to monitor viral variants and use wastewater levels as a leading indicator of cases and related COVID-19 outcomes [Reference Maal-Bared1–Reference Xiao3]. While estimates of lead time vary across studies and by variant-driven waves of the pandemic, their trends are generally expected to align (e.g., increasing wastewater concentrations corresponding to increasing case rates and vice versa) [Reference Hopkins2, Reference Xiao3]. Accordingly, trend analyses of wastewater data can offer public health authorities practical situational awareness of pandemic progression and facilitate the assessment of disparities among sewersheds.
A variety of approaches have been used to detect and characterize trends in SARS-CoV-2 wastewater concentrations and COVID-19 outcomes. Several public-facing dashboards [4, 5] categorize wastewater trends according to their direction, magnitude, and/or duration. The U.S. Centers for Disease Control and Prevention (CDC) National Wastewater Surveillance System (NWSS) [6] has been tracking wastewater viral activity levels (relative to baseline concentrations), along with 15-day per cent changes over time. Per cent change and cross-correlation analyses were applied in studies relating SARS-CoV-2 wastewater concentrations and COVID-19 case incidence [Reference Hopkins2, Reference Chan7, Reference Schenk8]. Others have identified peak SARS-CoV-2 wastewater concentrations and the extent to which they precede peaks in COVID-19 case incidence and/or hospital admissions [Reference Schenk8–Reference Saguti10]. This growing body of literature suggests that trends and turning points can offer valuable insight to guide public health responses like additional testing/vaccination efforts, targeted educational messaging, and/or staff/resource allocations in medical facilities [Reference Kirby11, Reference Hrudey and Conant12].
Like many other communities in the United States and around the world, the metropolitan area of Las Vegas, Nevada (population: 2.23 million people as of 2020) launched a multi-agency SARS-CoV-2 wastewater surveillance effort that began early in the COVID-19 pandemic [Reference Gerrity13]. Weekly wastewater sampling was carried out in Las Vegas’ seven sewersheds through April 2023, achieving 2–3 years of uninterrupted time series of SARS-CoV-2 normalized and non-normalized concentrations. This study seeks to identify significant trends and trend turning points in the time series and further determine if the identified trends were concordant across concentrations and COVID-19 incidence and/or reflective of local changes in testing, vaccination, dominant SARS-CoV-2 variants, and disease control. As an international tourist destination, Las Vegas presents a unique setting for these analyses; the inclusion of 2022–2023 post-Omicron data also facilitates the study of trends after widespread changes in clinical testing/reporting requirements (i.e., from clinic-based, mandatory reporting to more unreported, at-home testing).
Methods
SARS-CoV-2 wastewater monitoring data
Details of SARS-CoV-2 wastewater surveillance in the seven Las Vegas area sewersheds have been described previously [Reference Gerrity13]. Sewershed characteristics and wastewater sample collection/processing procedures are shown in Table 1, with the sewershed boundaries shown in Supplementary Figure S1. Sewershed 1 contains the largest residential population and the tourism-heavy casino-resort corridor of the Las Vegas Strip, serving nearly one million weekly visitors [Reference Vo14]. Weekly wastewater samples from these seven sewersheds were collected and transported on ice from the corresponding wastewater treatment plants (WWTPs) to the study laboratory on Monday mornings (or Tuesdays following Monday holidays), starting on 1 June 2020, for Sewersheds 1 and 4 (n = 150 sampling weeks) or the sewershed-specific sampling start date for Sewersheds 2–3 and 5–7 (n = 122–138 sampling weeks; see Supplementary Table S1), and ending on 15 April 2023 to align with the case data.
Sewershed characteristics and weekly wastewater sample collection and concentration details
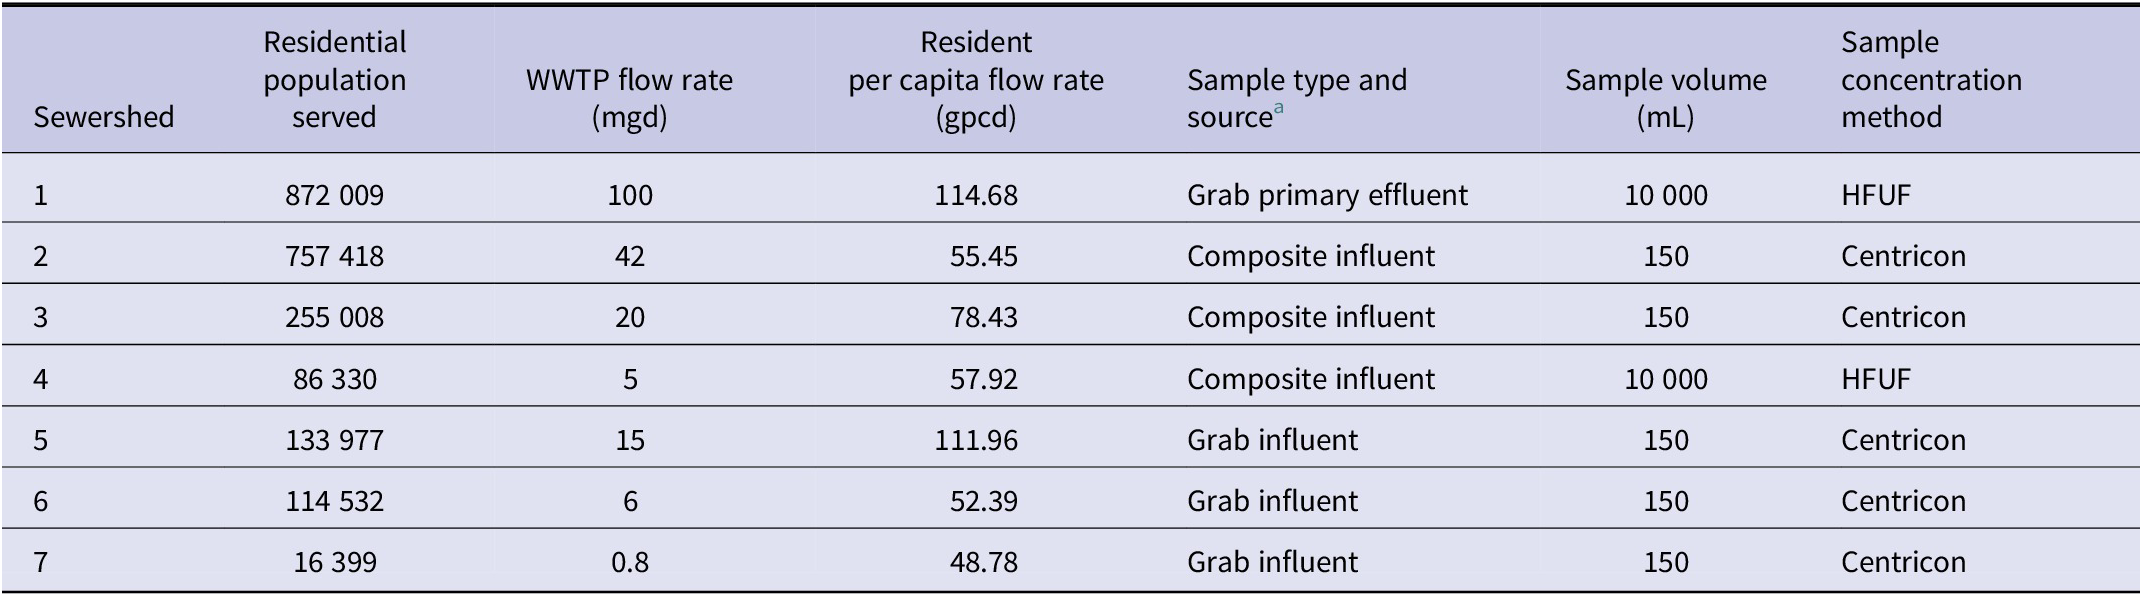
Abbreviations: WWTP = wastewater treatment plant; mgd = millions of gallons per day; gpcd = gallons per capita per day (daily flow rate/population served); HFUF = hollow-fibre ultrafiltration.
a Some differences in sample type and volume were artefacts of the early SARS-CoV-2 wastewater surveillance effort and were maintained throughout the study to avoid changes in methodology and data interpretation. Also, some sample characteristics (e.g., grab vs. composite) were related to practical limitations (e.g., no autosampler available at a given location).
Following sample preparation, quantitative polymerase chain reaction (qPCR) analyses quantified the RNA of SARS-CoV-2 and two process monitoring controls – exogenous spiked bovine coronavirus (BCoV) and human faecal indicator pepper mild mottle virus (PMMoV) – in the liquid concentrate of the sample in gene copies per litre (gc/L). BCoV served as a virus recovery control by facilitating adjustment for losses of SARS-CoV-2 genetic material during sample processing, while PMMoV was used separately as a normalization factor to adjust for changes in human faecal input and dilution that could confound wastewater-based assessments of SARS-CoV-2 levels. Multiple normalization factors have been explored [Reference Maal-Bared1, Reference Mazumder15], but the choice of normalization method and degree generally depend on logistical considerations and the expected system dilution. Supplementary Text S1 contains details of sample preparation/storage and qPCR assays at the study laboratory, including the handling of missing, non-detect, and below the limit of quantification (<LoQ) results.
COVID-19 confirmed case data
Corresponding COVID-19 polymerase chain reaction (PCR)-positive confirmed case counts (initial or reinfection) were provided by the Southern Nevada Health District as secondary data for this study, aggregated by week (Sunday–Saturday) according to specimen collection date (between Sunday, 31 May 2020, and Saturday, 15 April 2023). Detailed inclusion and exclusion criteria for these cases (n = 531,277) are shown in Supplementary Figure S2. Additional analysis of PCR-based testing rates over time was beyond the scope of this study, but the number of PCR-based tests performed in Nevada declined over time, with the exception of the Omicron surge. These cases were also previously geocoded at the census block level using the case’s residential address. The census blocks were then linked to the corresponding sewershed boundary to yield sewershed-specific weekly confirmed case rates (per 100,000 sewershed population). Census blocks crossing a sewershed boundary (n = 19 of 15,686 blocks) were assigned to the sewershed with the greatest overlap.
Study phases
Considering differences over time in testing (total testing in Phase 1 > 2 > 3 in the state of Nevada), vaccine availability, SARS-CoV-2 variant(s), disease control measures, and tourism volume to the Las Vegas area, the study timeframe was divided into three phases. Characteristics defining each study phase are shown in Table 2. Notably, the study timeframe began after the initial lockdowns from March to May 2020; it overlapped with the COVID-19 statewide Declaration of Emergency (end date: 19 May 2022) and the federal Public Health Emergency (end date: 11 May 2023). Prior SARS-CoV-2 WBE studies have also identified key periods and variant-driven waves of the pandemic based on similar milestones and characteristics [Reference Hopkins2,Reference Xiao3,Reference Cheng16,Reference Duvallet17].
Characteristics of local study phases in Southern Nevada
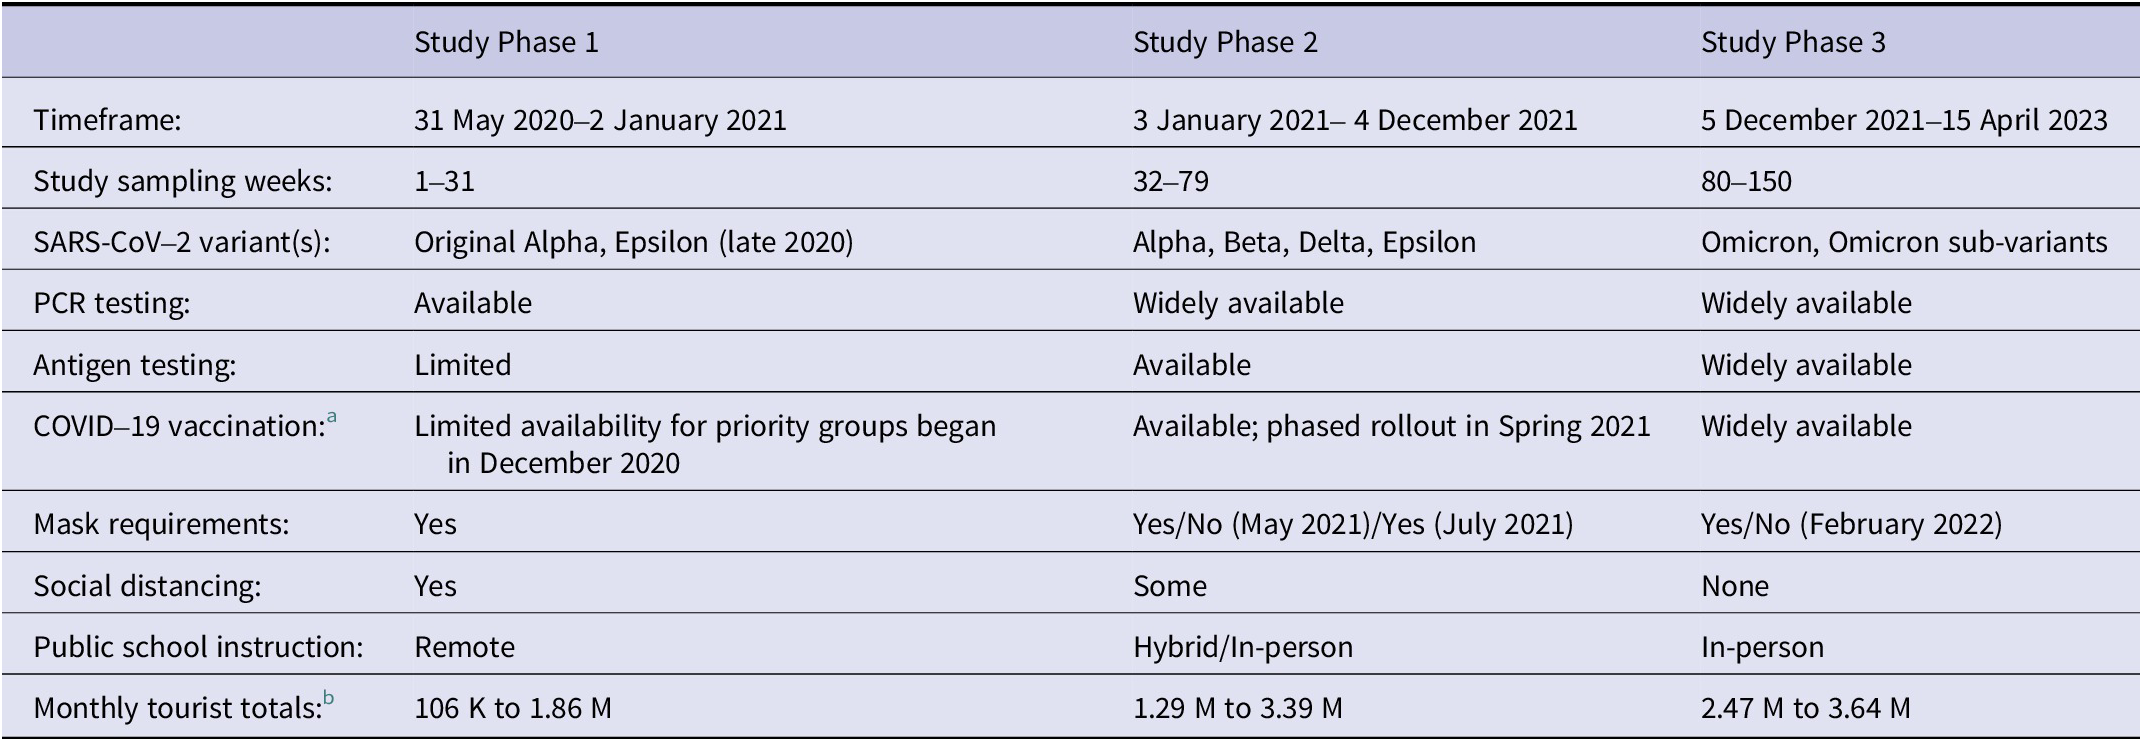
a Initial COVID-19 vaccine availability by brand in Clark County: Pfizer-BioNTech (December 2020), Moderna (December 2020), Janssen/Johnson & Johnson (March 2021), Novavax (August 2022).
b Source: Las Vegas Convention and Visitors Authority Visitor Statistics.
Statistical analyses
Joinpoint regression, a variation of linear regression, was used here because it accommodates time series data, captures trends that change direction, and identifies when trend change points (i.e., joinpoints) occur [Reference Kim18]. This ability to statistically identify the best-fit timing of joinpoints is a unique feature of joinpoint regression. Peaks, or joinpoints where a positive trend turns negative, were of particular interest to characterize variant-driven waves (i.e., surging cases), though all trend changes offer information about the variables studied over time. Joinpoint regression has been used previously to analyse multiple COVID-19-related variables, including case incidence [Reference Guimarães19–Reference Tang22], mortality [Reference Malli21, Reference Rovetta23], intensive care unit admissions, and vaccination rates [Reference Malli21], though it has not yet been applied to SARS-CoV-2 RNA wastewater concentrations.
Model specifications and selection
Joinpoint regression was performed by sewershed and study phase for (A) the log10 BCoV-corrected SARS-CoV-2 RNA wastewater concentration, (B) the log10 PMMoV-normalized SARS-CoV-2 RNA wastewater concentration (×1 million), and (C) sewershed-specific weekly COVID-19 confirmed case rates (per 100,000 sewershed population). Samples from Sewershed 7 were excluded from Phase 1 analyses due to the small number of sampling weeks (n = 3) resulting from its late start date. Temporal autocorrelation was suspected based on prior studies [Reference Maal-Bared1–Reference Xiao3] (and confirmed by autocorrelation and partial autocorrelation plots), so the error model was set to first-order autocorrelation estimated from the data. The maximum number of joinpoints allowed was sewershed-specific in Phase 1 (up to five for Sewersheds 1 and 4, and up to three for Sewersheds 2–3 and 5–6) due to their varying numbers of observations, but up to six were allowed for Phases 2 and 3; the minimum number of points between joinpoints was left at the default of two.
Model selection for the best-fit series of regressions and optimal number of joinpoints was based on the lowest weighted Bayesian information criterion (WBIC) value, which employs a weighted penalty term based on the data and change sizes [24]. The average weekly per cent change (AWPC) over the study phase and the weekly per cent changes (WPCs) for each of the identified segment(s) within the phases were then computed from the final selected models. The parametric method was used for calculating the confidence intervals (CIs) for the AWPC, WPCs, and joinpoint locations.
Assessing trend coherence
As joinpoint regression does not facilitate trend or turning point comparisons across variables, week-level agreement between the significant WPC trends of different variables was assessed using Cohen’s kappa (κ) statistic [Reference Cohen25]. Trends were considered to agree in a given study week if the WPC values for each pair of variables were either both significant and positive or both significant and negative. This approach summarizes the joinpoint results and assesses the alignment of significant trends when they occur. Specifically, it facilitated the comparison of trends identified in wastewater sample concentrations (generally collected on Mondays) with total confirmed cases reported in that week (Sunday–Saturday). Weeks of joinpoints or with non-significant WPC values were excluded from this analysis. Various thresholds for interpreting Cohen’s kappa have been proposed [Reference McHugh26, Reference Landis and Koch27]; generally, values below or near zero indicate no agreement, and values close to one suggest almost perfect agreement. Here, evidence of agreement was considered to be present if the 95% CI for a positive value of kappa did not include zero. The AC1 Agreement Coefficient [Reference Gwet28] and the Prevalence-Adjusted Bias-Adjusted Kappa (PABAK) Coefficient [Reference Byrt, Bishop and Carlin29] were also calculated to examine if they yielded different conclusions from the simple Cohen’s kappa.
Joinpoint Trend Analysis software (Version 5.0.2; May 2023; Statistical Methodology and Applications Branch, Surveillance Research Program, National Cancer Institute, Bethesda, MD, USA) and SAS Studio 3.82 software (SAS Version 9.4, SAS Institute Inc., Cary, NC, USA) were used to complete these analyses. The significance level was set at α = 0.05.
Human subjects statement
This study used secondary, aggregated data, and no human subjects were involved or identifiable. It is not subject to human subjects ethics approval, as recommended by the University of Nevada, Las Vegas, Office of Research Integrity.
Results
Summary statistics for the SARS-CoV-2 RNA wastewater concentration data (recovery-corrected or normalized) and confirmed COVID-19 case data by sewershed and phase are shown in Table 3. Sewershed 6 had the highest overall mean BCoV-corrected concentration (6.11 log10 gc/L; 95% CI = 6.01, 6.20) but was similar to that of Sewershed 2 (5.97 log10 gc/L; 95% CI = 5.91, 6.03) and Sewershed 5 (6.02 log10 gc/L; 95% CI = 5.93, 6.11). Similarities were also observed between the mean PMMoV-normalized concentrations of Sewersheds 5 (3.02 log10; 95% CI = 2.93, 3.10) and 6 (3.13 log10; 95% CI = 3.03, 3.23). Sewershed 5 had the highest overall mean confirmed incidence per week per 100,000 sewershed residents (205.74; 95% CI = 158.15, 253.33) but shared overlapping 95% CIs with all but the lowest mean weekly confirmed case rate observed in Sewershed 7 (106.51; 95% CI = 84.77, 128.26). Raw PMMoV concentrations were highest in Phase 3 but within the same order of magnitude as other phase maximum values. While mean wastewater concentrations were consistent across phases, mean case rates for all sewersheds were highest in Phase 1, which was the shortest period prior to widespread vaccination, characterized by higher testing rates and the first winter surge in cases.
Descriptive characteristics of weekly SARS-CoV-2 wastewater surveillance data and COVID-19 case incidence by sewershed, 31 May 2020 to 15 April 2023 and by study phase
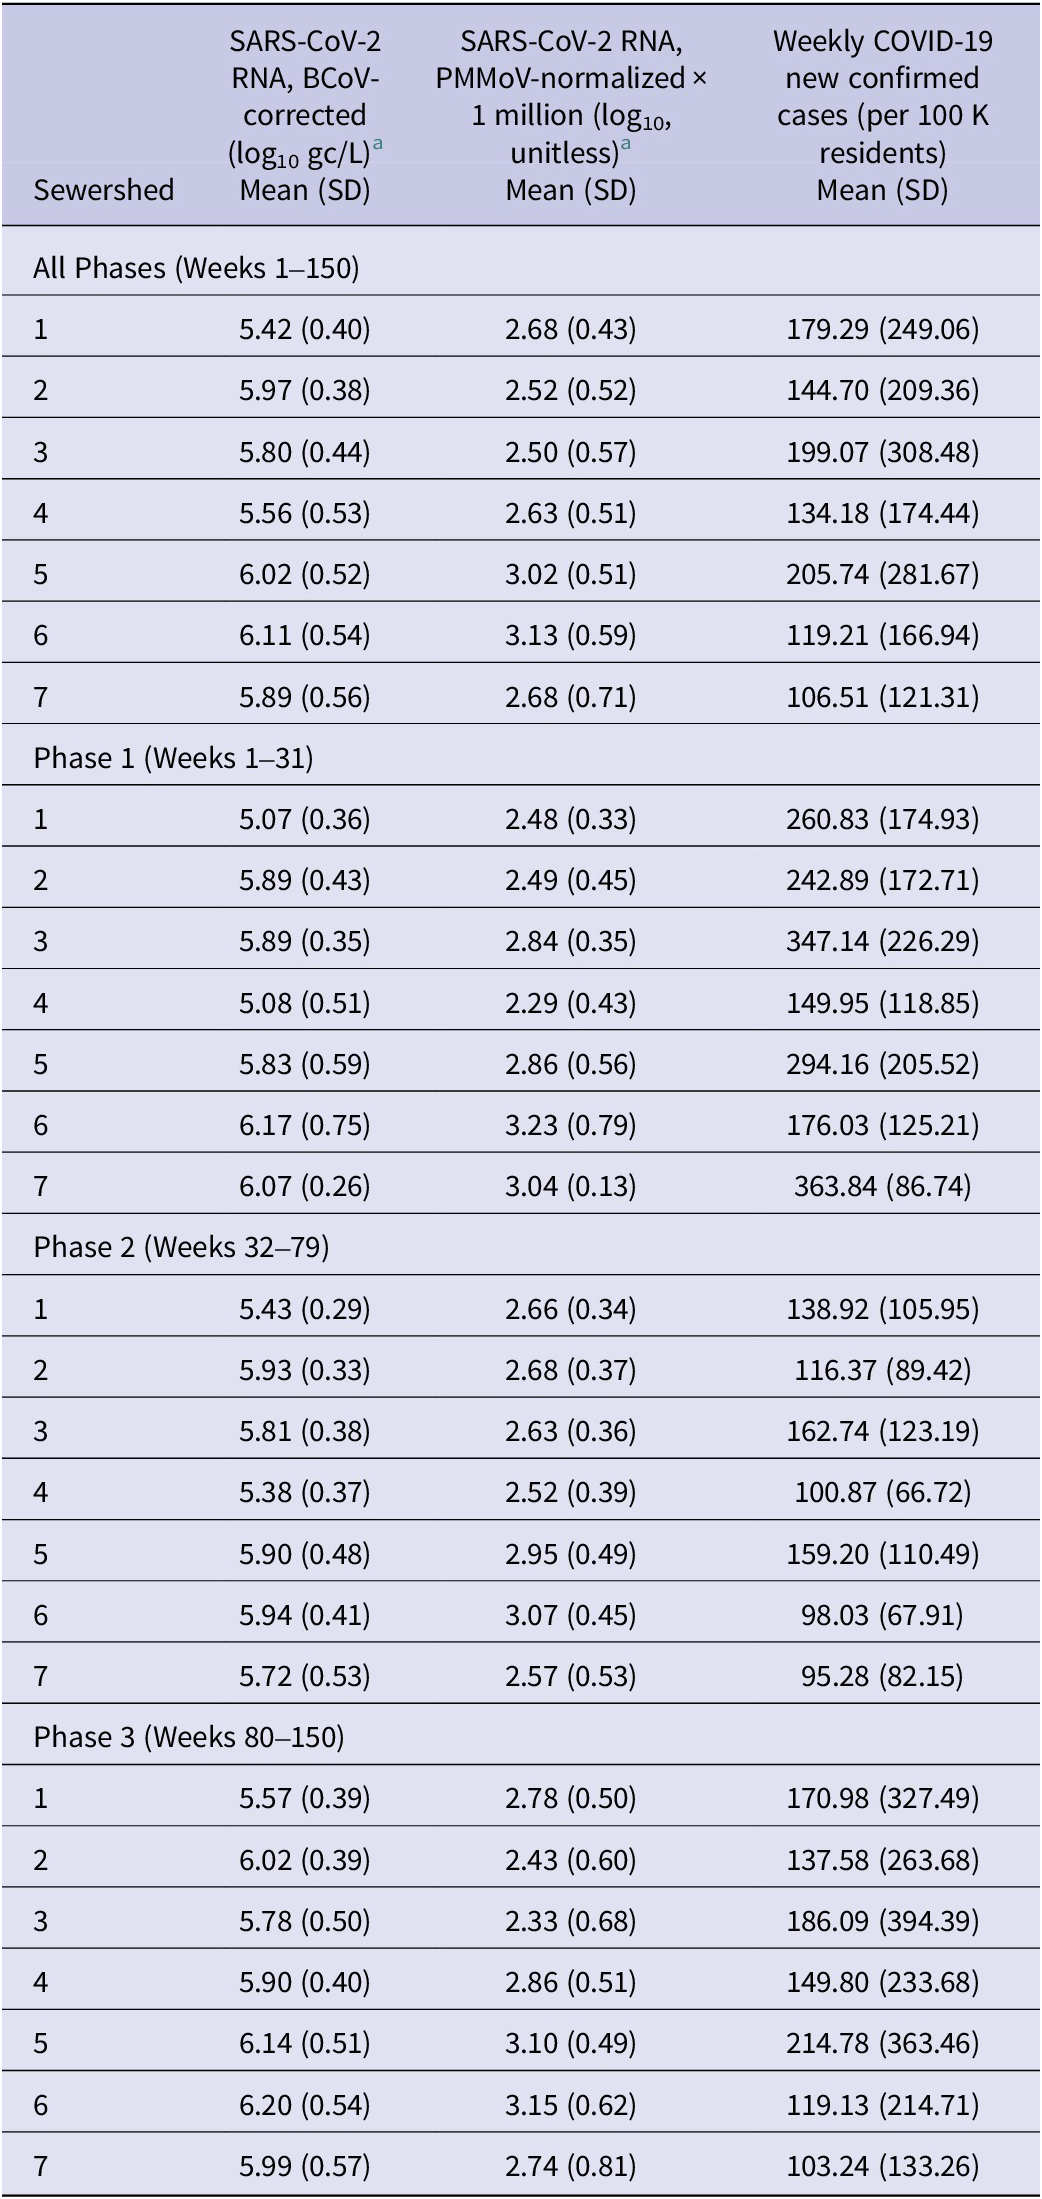
Abbreviation: SD = standard deviation.
a After imputation for <LoQ and non-detect samples, but prior to imputation for missing sample weeks.
Joinpoint regression analyses
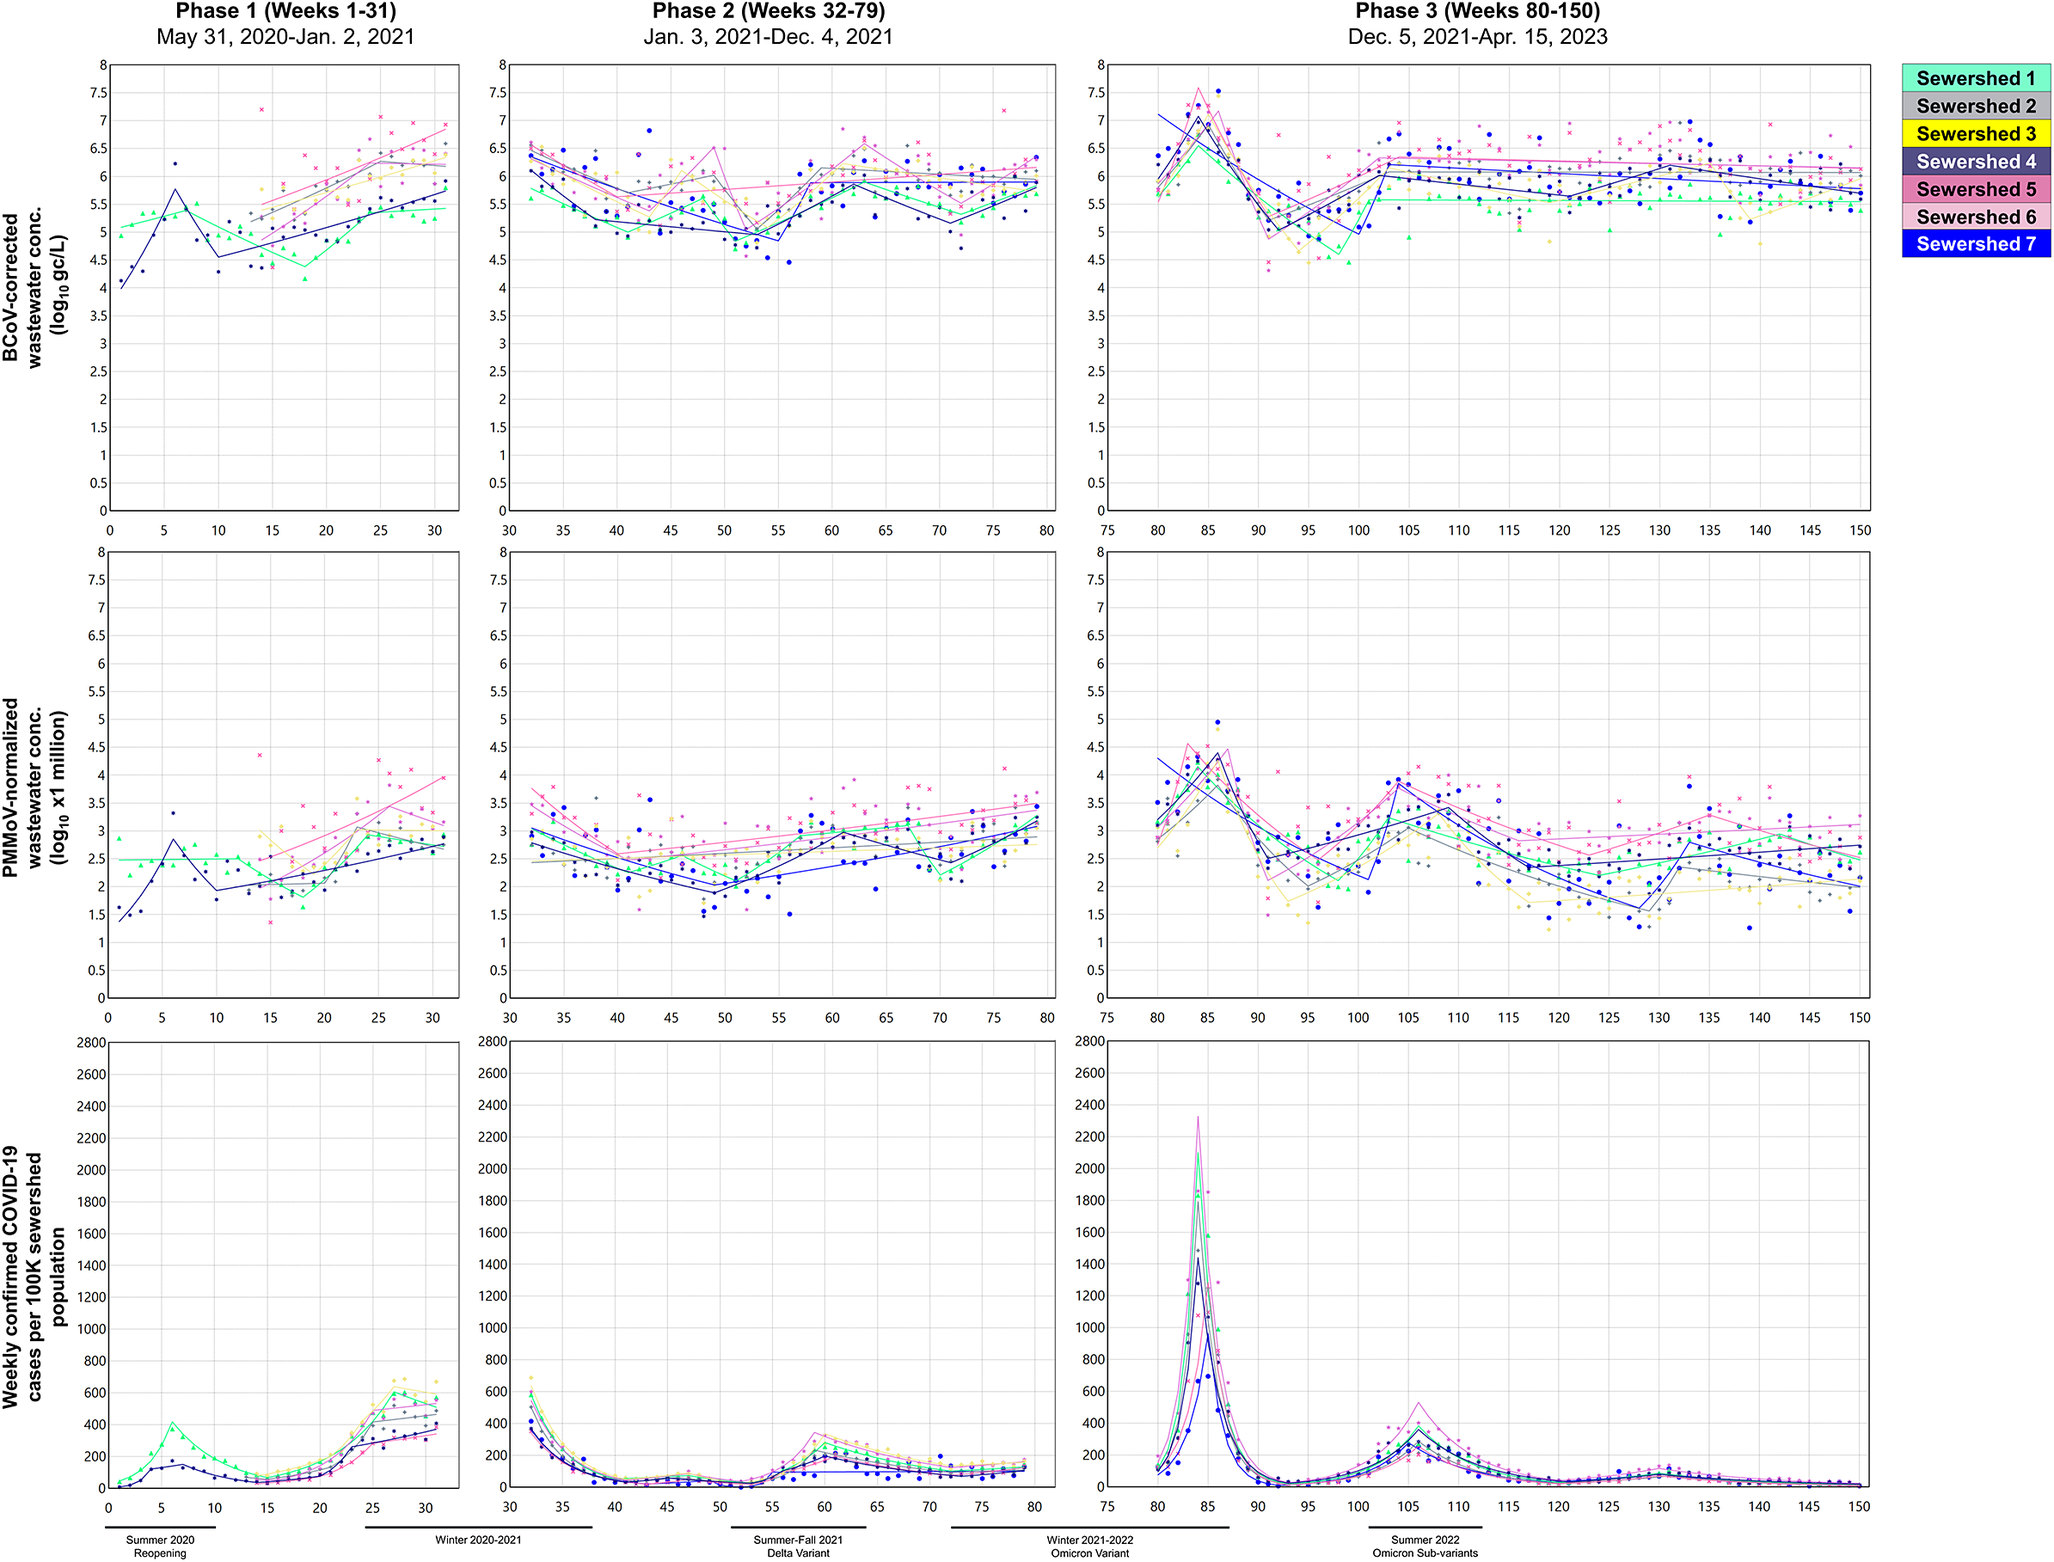
Time trend plots with the selected models (lowest WBIC values in Supplementary Table S2) for the variables and sewersheds by phase are shown in Figure 1. Most (55/60, 92%) of the selected models contained at least one joinpoint (trend turning point). Across the case and wastewater variables in the study sewersheds, Phase 1 models contained 0–5 joinpoints, while the Phase 2 and 3 models contained 0–6 and 2–6 joinpoints, respectively. Multiple similar peaks (i.e., joinpoints when WPCs switched from significantly positive to significantly negative) observed in the wastewater and case rate across sewersheds were consistent with known variant-driven waves, such as Summer 2020 post-lockdown reopening, Fall/Winter 2020 (Alpha/Epsilon variants), Summer 2021 (Delta variant), Winter 2021–2022 (Omicron variant), and Summer 2022 (Omicron sub-variants). The Delta and Omicron peaks identified by the models occurred between weeks 59 (7 July 2021) and 63 (8 August 2021), and between weeks 84 (2 January 2022) and 87 (23 January 2022), respectively. The Omicron peak was particularly evident in the BCoV-corrected wastewater concentrations (6 of 7 sewersheds) and in the case rates (7 of 7 sewersheds), but less so for the PMMoV-normalized concentrations (3 of 7 sewersheds).
Time trend plots showing the selected joinpoint regression models for (a) log10-transformed BCoV-corrected SARS-CoV-2 RNA wastewater concentrations, (b) log10-transformed PMMoV-normalized SARS-CoV-2 RNA wastewater concentrations (×1 million), and (c) weekly total COVID-19 confirmed cases per 100,000 sewershed population by study phase, highlighting surge periods.
AWPCs from the selected models, shown in Supplementary Table S3, indicate average change by sewershed across each phase. In Phase 1, all significant (p-values <0.05) AWPC values suggested increasing trends leading into the Fall/Winter 2020 wave, with values ranging from 0.97% (95% CI = 0.45, 1.50) to 2.85% (95% CI = 1.26, 4.46) for the wastewater concentrations and 8.29% (95% CI = 6.15, 10.5) to 15.6% (95% CI = 12.5, 18.8) for the confirmed case incidence. Across Phases 2 and 3, AWPCs for the wastewater concentrations were not statistically significant (with one exception for Sewershed 2 in Phase 2), suggesting either relatively stable concentrations over time or short-term increases/decreases obscured by the averaging. In contrast, AWPCs for the COVID-19 case rates showed mostly significant negative overall trends over these phases (−2.56% [95% CI = −4.00, −1.10] to −3.42% [95% CI = −5.47, −1.33]), despite the onset of the Delta and Omicron waves, respectively. In contrast to AWPCs, WPCs (Supplementary Table S4) and the locations of joinpoints offered more granular information about how and when trends changed over time within the study phases. Notably, WPC absolute values were larger in magnitude for the case rate than for the SARS-CoV-2 RNA wastewater concentrations, partly due to the logarithmic scale of the wastewater concentrations.
Consistency of trends identified by joinpoint regression
Table 4 summarizes the number of weeks with trend agreement (i.e., both significant positive or both significant negative WPC values) relative to the total number of weeks with significant WPC values (positive or negative) for each pair of variables compared overall and in specific study phases. Overall agreement occurred ~76% of the time across all pairs of variables (83% for BCoV-corrected vs. PMMoV-normalized, 82% for BCoV-corrected vs. COVID-19 confirmed case rate, and 64% for PMMoV-normalized vs. COVID-19 confirmed case rate). Weeks with co-occurrence of joinpoints (excluded from the calculations in Table 4) were, however, rare, occurring 0–6 times. Overall, Cohen’s κ values were substantial for the two wastewater variables (0.66; 95% CI = 0.59, 0.72) and between the BCoV-corrected wastewater and case rate (0.64; 95% CI = 0.57, 0.71), but there was less evidence of agreement between the PMMoV-normalized wastewater and case rate (0.30; 95% CI = 0.23, 0.37). In Phase 1, some sewersheds showed perfect agreement in week-level significant trends, but there was no overall phase effect on the percentages of weeks with agreement between cases and BCoV-corrected wastewater (Kruskal–Wallis p-value = 0.20) or PMMoV-normalized wastewater (p-value = 0.47), and phase-specific kappa values were similar to the all-phase kappa values, with overlapping 95% CIs. The AC1 Agreement Coefficient and the PABAK Coefficient yielded similar results (within ±0.02 of the Cohen’s κ), except in Phase 1 for PMMoV vs. COVID-19 case rate, for which these metrics did indicate some agreement (AC1 = 0.74; 95% CI = 0.57, 0.92; PABAK = 0.61; 95% CI = 0.39, 0.83).
Weeks with both significant positive or negative trends (WPCs) between variables out of total weeks with significant WPCs for both variables and overall Cohen’s kappa statistics
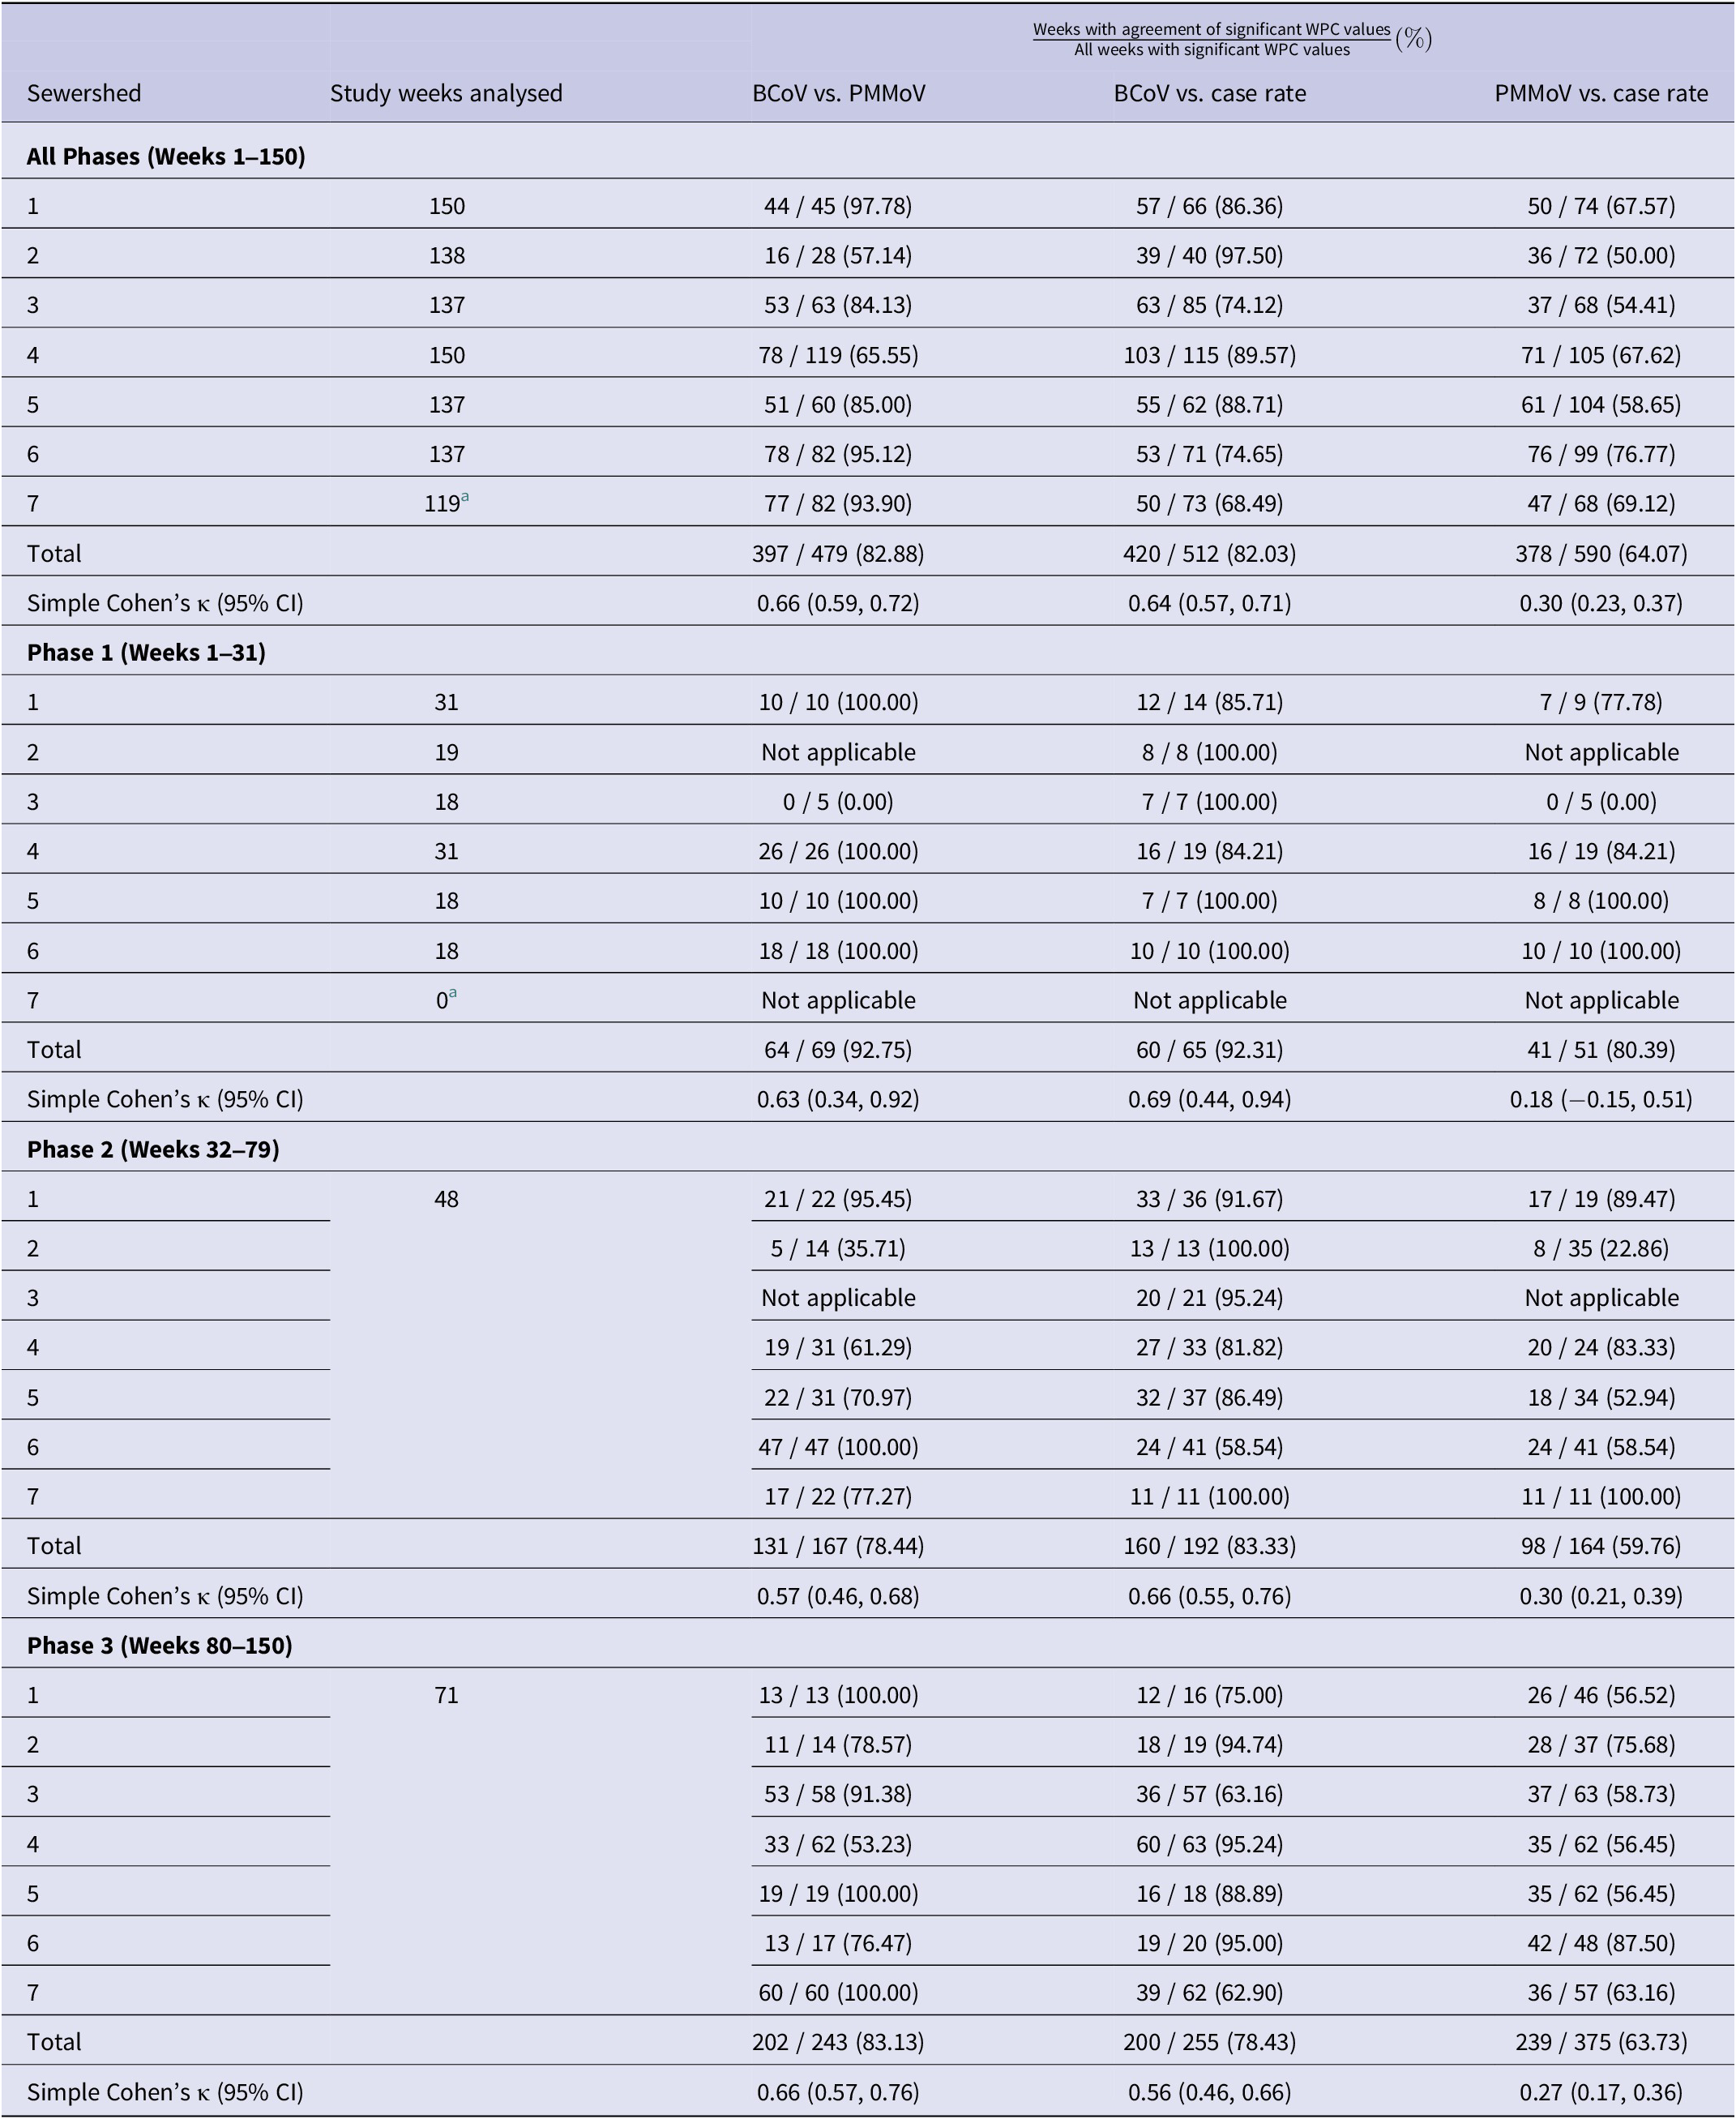
Note: ‘Not applicable’ values were not able to be calculated due to the absence of a significant trend for at least one of the variables being compared, or only one direction of trend recorded (i.e., all positive or all negative).
Abbreviations: WPC = weekly per cent change; CI = confidence interval.
a Excludes observations (n = 3) from Phase 1.
Sewershed-specific kappa statistics and corresponding 95% CIs over all phases are shown in Table 5, with all but two wastewater–case rate comparisons indicating evidence of week-level agreement. Significant kappa values ranged from slight (0.20; 95% CI = 0.08, 0.31 for PMMoV-normalized vs. case rate in Sewershed 5) to almost perfect (0.94; 95% CI = 0.84, 1.00 for BCoV-corrected vs. case rate in Sewershed 2). The only wastewater vs. case results without evidence of agreement were found to be between the PMMoV-normalized wastewater concentrations and confirmed case rates in Sewersheds 2 and 3. Of the significant results, several sewershed-specific kappa values were higher than the overall kappa value between the BCoV-corrected wastewater concentration and case rate (Sewersheds 1, 2, 4, 5) and between the PMMoV-normalized wastewater concentration and case rate (Sewersheds 1, 4, 6). Notably, the kappa statistics for Sewersheds 1 and 4 were higher than the overall kappa for both wastewater–case rate trend comparisons, suggesting better concordance in those sewersheds.
Cohen’s kappa statistics and 95% confidence intervals, by sewershed, for the agreement of statistically significant trends out of all weeks with significant trends
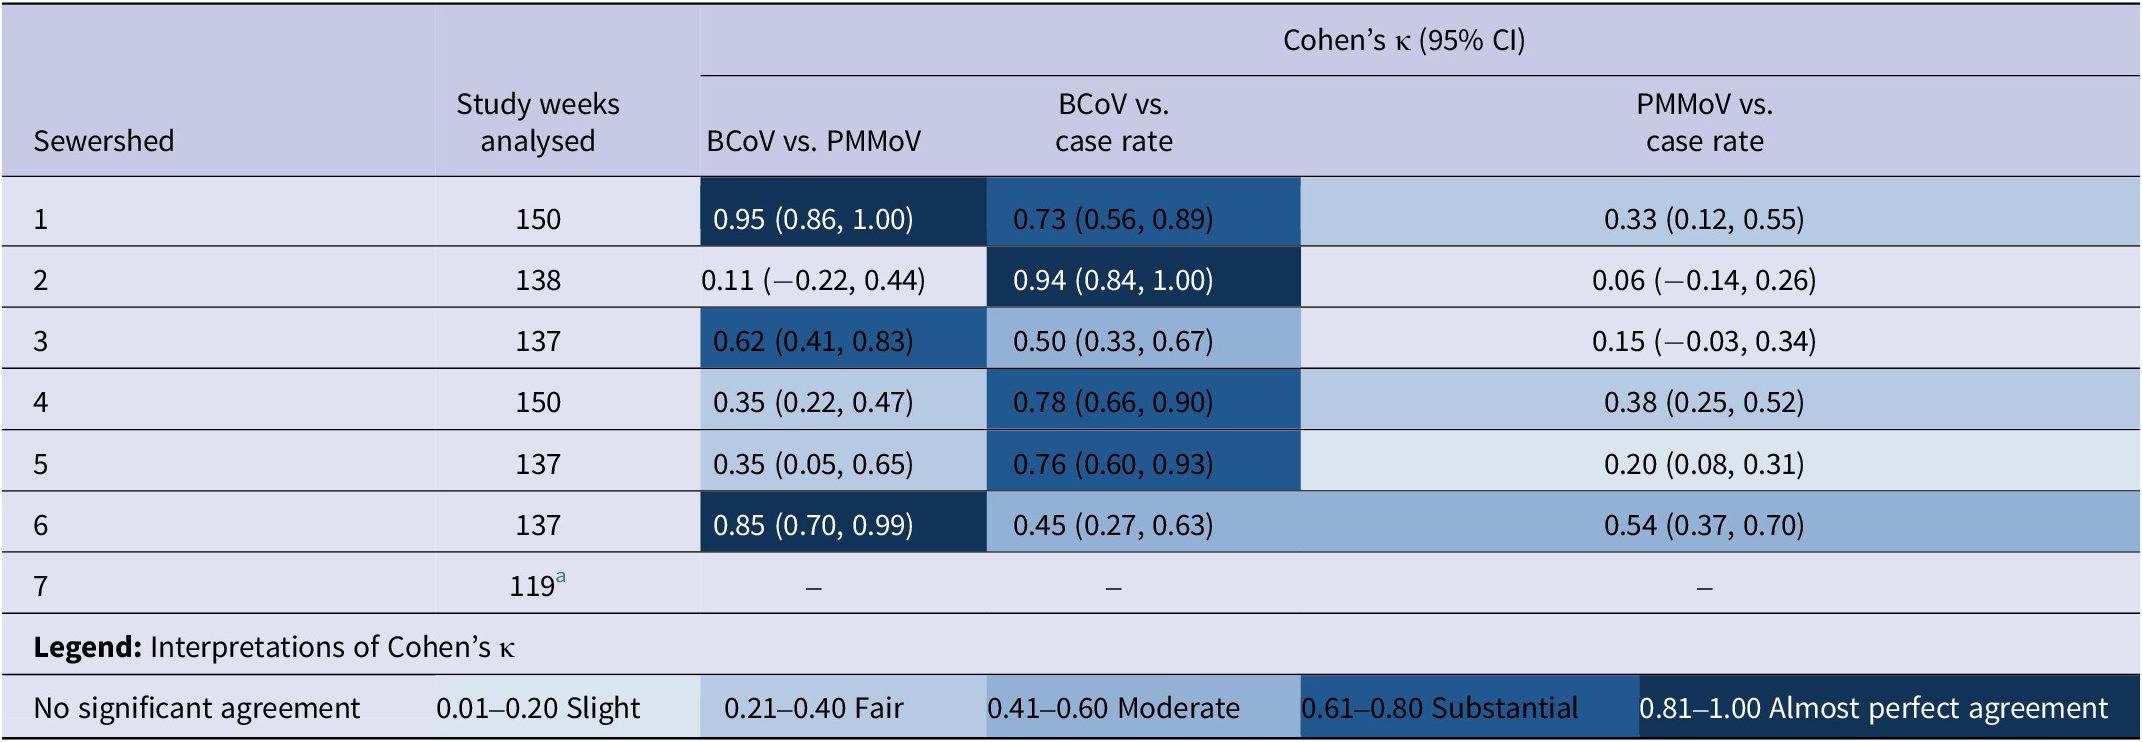
Abbreviation: CI = confidence interval.
a Excludes observations (n = 3) from Phase 1. The simple kappa statistic (as well as the AC1 Agreement Coefficient or the Prevalence-Adjusted Bias-Adjusted Kappa Coefficient) could not be calculated for Sewershed 7. This was because there were only significant negative trends for the BCoV-corrected wastewater concentration, with no aligning positive trends observed.
Discussion
Using joinpoint regression, this study identified significant positive and negative trends and trend turning points in sewershed-specific SARS-CoV-2 RNA wastewater concentrations and COVID-19 confirmed case rates between June 2020 and April 2023. While this method has been applied previously to other COVID-19-related variables [Reference Guimarães19–Reference Rovetta23], it has neither been applied to wastewater surveillance data nor to data collected after 2021. The results highlighted some variations in trends between recovery-corrected and PMMoV-normalized wastewater concentrations, cautioning that using normalized data can generate different conclusions. While normalization is generally recommended for comparing between sites/over time and for variable population sizes influenced by daily commuters and/or tourists (as in Las Vegas) [Reference Maal-Bared1, 30], this study and prior works have suggested that PMMoV normalization does not necessarily improve alignment/correlation between case and wastewater data [Reference Maal-Bared1, Reference Cheng16, Reference Greenwald31].
Based on the calculated AWPCs, confirmed case rates generally increased over Phase 1 and decreased over Phases 2 and 3. This finding is consistent with the 2020–2021 winter surge prior to COVID-19 vaccines becoming available, followed by increasing vaccination and changes in testing behaviours/requirements since early 2021 and particularly in the post-Omicron period. Underestimation of true COVID-19 case incidence was expected in Phase 3 post-Omicron, given the overwhelming shift to unreported, at-home antigen testing. Another joinpoint regression study similarly found that the weekly mean of COVID-19 case rates decreased as vaccination coverage increased [Reference Malli21]. The increasing trends in Phase 1 appeared to be much larger in magnitude than the decreasing trends in Phases 2 and 3, according to AWPC values, though Phase 1 was the shortest phase. While the wastewater concentrations (particularly the BCoV-corrected values) captured the increasing trends over Phase 1 for most sewersheds, the method did not identify significant decreasing trends over Phases 2 and 3.
This discordance (i.e., confirmed case rates decreasing overall without a corresponding decrease in wastewater concentrations) may be partially explained by changes to COVID-19 clinical testing behaviours that occurred nationwide throughout 2021 [Reference Rubin32]. Weidhaas et al. noted that long-term shedding may also explain why declines in SARS-CoV-2 RNA wastewater concentrations can lag behind declines in COVID-19 cases [Reference Weidhaas33]. It is also possible that wastewater concentrations offer a smoothed-out reflection of the actual infection dynamics in the population by simultaneously capturing new (pre-symptomatic), symptomatic, recovering, untested, and asymptomatic cases [Reference Weidhaas33, Reference Hamouda34], along with recovering tourism to the area in Phases 2 and 3 [35]. Nonetheless, the stability in wastewater concentrations, even as case rates declined, could indicate milder (untested) or asymptomatic cases that were not captured in reported clinical testing [Reference Hamouda34]. This underestimation of COVID-19 cases was particularly plausible during the Omicron waves in Phase 3. Another study in Ontario, Canada reported as high as a 19-fold underestimation of clinical cases at the peak of Omicron BA.2 during April 2022 [Reference Cheng16]. Future studies may explore optimal ways to account for such underestimation.
Significant WPC values quantified shorter trends within each phase. As in this study, Khaleghi et al. detected multiple waves of COVID-19 cases in their joinpoint regression analysis [Reference Khaleghi20]. More extreme peaks (e.g., with higher WPC magnitudes), such as the waves from the Delta and Omicron variants, were also detected by the BCoV-corrected concentration in most of the sewersheds. While there were other significant increasing trends in the confirmed case rate with smaller WPCs, the BCoV-corrected concentration did not always show corresponding increases, consistent with less pronounced changes in wastewater viral load. Although this analysis focused on peaks for characterizing local variant-driven waves, other types of joinpoints (e.g., where negative trends become positive) can also offer information about changes in pandemic trajectory.
Week-level trend agreement and Cohen’s kappa statistics provide evidence of overall (and common phase-specific) alignment between the identified trends in wastewater concentrations and COVID-19 case rates across all the sewersheds, though the agreement was weaker between the PMMoV-normalized concentrations and the case rates. While agreement of positive trends among wastewater and case variables has the clearest relevance to public health, concordant negative trends may also offer important situational awareness. Regarding the differences seen for the normalized and non-normalized wastewater concentrations relative to cases, Nagarkar et al. suggested that adjustments based on recovery, faecal indicators, and flow did not always increase the correlation between wastewater concentration and clinical case data, and, thus, the optimal adjustment factors may not be generalizable to all sewersheds [Reference Nagarkar36]. In Las Vegas, temporal trends based on non-normalized BCoV-corrected concentration trends appear to be better aligned with COVID-19 confirmed case data. Recent work by Leisman et al. [Reference Leisman37] similarly found recovery correction to be more important than normalization by PMMoV or wastewater flow when relating wastewater concentrations and clinical data. Their work concluded that this may be particularly true when the primary source of data variability stems from laboratory methods rather than system characteristics, such as dilution (e.g., from stormwater flows) or non-resident inputs. Wastewater PMMoV concentrations have their own inherent variation by season, location, diet, urbanization [Reference Maal-Bared1], and molecular assay used [Reference Crank38] that may also obscure any wastewater–case data relationships. Maal-Bared et al. [Reference Maal-Bared1] highlighted other challenges for PMMoV normalization, including morphological differences between PMMoV and SARS-CoV-2, and described a positive association between PMMoV concentration and temperature. This temperature relationship was also observed by Crank et al. [Reference Crank38] in the summers, in the same wastewater system as the current study. However, PMMoV concentrations did not change substantially across the phases here (each of which included a summer season).
Generally, sewershed-level differences in trend agreement may reflect sewershed-specific differences in wastewater composition, sampling approach (i.e., grab vs. composite), and flow dynamics, as well as residents’ access to clinical testing and demographic and socio-economic characteristics. Some sewersheds might be better indicators of community-wide surges than other sewersheds, as suggested by Hopkins et al. [Reference Hopkins2]. This study’s Sewershed 1, for example, contains the area’s airport and primary year-round tourism/lodging hub, though there are other smaller visitor lodging destinations in Downtown Las Vegas (Sewershed 2) and in Henderson (Sewersheds 5 and 6). Kappa statistics for Sewershed 7, where the population is substantially smaller than other sewersheds, could not be calculated due to the lack of aligning significant positive trends for the wastewater concentrations. Among other sewersheds, the kappa statistic for Sewershed 2 (kappa = 0.94; 95% CI = 0.84, 1.00) was the highest with respect to the BCoV-corrected wastewater–case rate comparison, followed by Sewersheds 4, 5, and 1, while the minimum kappa values appeared in Sewersheds 3 (0.50; 95% CI = 0.33, 0.67) and 6 (0.45; 95% CI = 0.27, 0.63). Sewershed 2 contained a relatively large population, while theoretically not being impacted by tourism as much as Sewershed 1. Smaller sewersheds (like Sewershed 7 here, which also involved grab sampling) may demonstrate more variability in target wastewater concentrations [Reference Chan7]. Other factors contributing to the sewershed-level disparity, including optimal adjustments for the presence of mobile/dynamic tourist and commuter populations, warrant further investigation.
There are other limitations to this analysis and its use of weekly data. First, joinpoint regression requires a time variable to be the main effect, involves multiple model customization decisions, and does not allow for the inclusion of covariates or spatial correlation effects. Notably, joinpoint-based AWPCs may be less informative for outbreak settings involving frequent and variable measurements like the wastewater and case data here. While group-level joinpoint regression comparisons are possible [24], this statistical approach does not directly facilitate comparisons of trends between different variables. Furthermore, this trend analysis did not include testing rates, and many prior studies used daily case data, instead of weekly case data, in conjunction with more frequent wastewater sampling. It is possible that analyses using weekly case totals underestimate their relationship with wastewater concentrations [Reference Weidhaas33]. Chan et al. specifically examined the effect of sampling frequency, concluding that at least four samples per week would be needed to detect intra-week variability [Reference Chan7]. The authors noted that greater sampling frequency facilitates earlier identification of trends, while acknowledging that resource constraints may limit sampling frequency [Reference Chan7]. On the other hand, Duvallet et al. included sampling locations with at least one sample per month and still found that wastewater data reflect trends in COVID-19 cases [Reference Duvallet17].
Sampling from community WWTPs also has inherent limitations. Samples from large sewersheds (e.g., Sewershed 1 with nearly 900,000 residents and greater tourism) provide population-level information but may not offer insights into specific demographic or socioeconomic subgroups within those sewersheds. In this study, septic tank parcels (and the cases corresponding to them) were not excluded from the sewersheds during geocoding of cases. With an average of 2.70 persons per household [39] and nearly 14,600 septic parcels in the Las Vegas area as of 2022, residential septic use involves approximately only 1.7% of the 2.32 million county residents. These individuals may also contribute to their surrounding sewershed and/or nearby sewersheds during daily movements outside their homes.
Implications for public health and future research
These findings complement previous studies linking SARS-CoV-2 wastewater surveillance data and COVID-19 public health outcomes in other large metropolitan communities. The highly concentrated, year-round tourism in Las Vegas, however, limits generalizability to urban areas with more stable populations. Joinpoint regression with similar datasets may be useful to inform real-time outbreak monitoring by detecting significant trends and change points, but, like other trend analyses, it requires several observations to differentiate sustained changes from inherent or temporary variability. For retrospective studies, analysis of key trend turning points may be useful in the post-hoc evaluation of the effectiveness/impact of public health responses and policy implementation, like quarantine and vaccination. Prior studies, for example, have used joinpoint regression to examine trends before and after similar pandemic milestones and response measures [Reference Khaleghi20, Reference Malli21].
The COVID-19 outcome in this study was new weekly confirmed case data, as opposed to new daily cases that others have studied in estimating wastewater’s lead time ahead of case incidence [Reference Hopkins2, Reference Xiao3, Reference Cheng16]. Daily new cases were of interest to the public in real time during the pandemic, but daily values are also subject to processing/reporting delays and changes in testing behaviours around weekends and holidays. Using weekly totals may avoid these issues and still offer practical situational awareness if a once-weekly wastewater sample reflects the total number of confirmed cases expected by the end of that week.
Public health interpretations of the alignment (or lack thereof) between wastewater surveillance and confirmed case data should recognize the myriad potential sources of variability, including wastewater sample type/source/timing, testing and vaccination rates, variant-specific shedding rates [Reference Prasek40], and tourist/visitor contributions [Reference Vo14], among others. Future efforts building on this work may include exploring other normalization approaches along with time offsets (i.e., leads/lags) between these variables with statistical approaches like cross-correlation [Reference Hopkins2, Reference Greenwald31] and non-linear/machine learning modelling techniques. Spatial correlations, spatiotemporal alignment, and integration of data sources also remain important considerations. Geocoding cases in census blocks within sewershed boundaries (as done here) offers more precision than using cases by postal code, depending on local sewer infrastructure/jurisdiction, although city- or postal-code-level data are usually more readily available. Residents’ daily movement between local sewershed boundaries is a broader issue in wastewater-based epidemiology that may be explored with pooled/community-wide estimates (e.g., total community viral load) and novel/real-time adjustment approaches.
Supplementary material
The supplementary material for this article can be found at http://doi.org/10.1017/S0950268825100058.
Data availability statement
Data are available from the corresponding author upon reasonable request.
Acknowledgements
The authors would like to acknowledge personnel at the collaborating health district and wastewater agencies for their assistance with data collection and sampling logistics.
Author contribution
Conceptualization: Casey Barber, Lung-Chang Chien, L.-W. Antony Chen, Brian Labus; Data curation: Lei Zhang, Cheryl Collins, Casey Barber, Katherine Crank, Katerina Papp, Daniel Gerrity; Methodology: Casey Barber, Lung-Chang Chien, L.-W. Antony Chen, Brian Labus; Formal analysis, Investigation, and Visualization: Casey Barber; Writing – original draft preparation: Casey Barber; Writing – review and editing: Lung-Chang Chien, L.-W. Antony Chen, Brian Labus, Katherine Crank, Katerina Papp, Daniel Gerrity, Edwin Oh, Anil Mangla, Cassius Lockett; Supervision: Lung-Chang Chien, L.-W. Antony Chen, Brian Labus, Daniel Gerrity, Edwin Oh. Funding acquisition: Lei Zhang, L.-W. Antony Chen. All authors read and approved the final manuscript.
Funding statement
This work was supported by the U.S. Centers for Disease Control and Prevention (grant number NH75OT000057–01-00). Its contents are solely the responsibility of the authors and do not necessarily represent the official views of the Centers for Disease Control and Prevention.
Competing interests
The authors declare none.


 Open access

