


Introduction
Sensory processing sensitivity (SPS) is defined as a personality trait characterized by an elevated sensitivity to both internal and external stimuli, including emotions, thoughts, and environmental cues such as lights or sounds (Aron & Aron, Reference Aron and Aron1997). Although SPS shares some overlapping features with other personality traits such as introversion and neuroticism, it is a distinct construct due to its unique pattern of reactivity to both positive and negative experiences (Aron & Aron, Reference Aron and Aron1997). SPS is conceptualized within the larger umbrella of theoretical frameworks on environmental sensitivity that explain how individuals react to those external and internal stimuli (Baryła-Matejczuk et al., Reference Baryła-Matejczuk, Ferrer-Cascales, Albaladejo-Blázquez, Ruiz-Robledillo, Fernández-Alcántara, Rubio-Aparicio, Lillo-Crespo and Costa-López2022; Ferrer-Cascales et al., Reference Ferrer-Cascales, Ruiz-Robledillo, Albaladejo-Blázquez, Costa-López, Fernández-Alcántara, Rubio-Aparicio, Lillo-Crespo and Baryła-Matejczuk2023; Greven et al., Reference Greven, Lionetti, Booth, Aron, Fox, Schendan, Pluess, Bruining, Acevedo, Bijttebier and Homberg2019). Prior research conducted by Aron and Aron (Reference Aron and Aron1997) estimated that around 15–20% of the population falls within the high range of the SPS trait. However, Lionetti and colleagues (Reference Lionetti, Aron, Aron, Burns, Jagiellowicz and Pluess2018), among 908 adults, found that 31% of participants identified as highly sensitive.
Although SPS shares conceptual territory with long-standing temperament constructs, it is important to distinguish it from Eysenck’s arousal-based dimensions and Gray’s reinforcement sensitivity theory (RST) (Eysenck, Reference Eysenck1967; Gray & McNaughton, Reference Gray and McNaughton2000). SPS and its standard measure, the Highly Sensitive Person Scale (HSPS), show partial overlap with broad personality factors and behavioral inhibition system (BIS) and behavioral activation system (BAS) dimensions (Greven et al., Reference Greven, Lionetti, Booth, Aron, Fox, Schendan, Pluess, Bruining, Acevedo, Bijttebier and Homberg2019; Smolewska et al., Reference Smolewska, McCabe and Woody2006). Factor-analytic work indicates that the HSPS decomposes into subcomponents (e.g., ease of excitation, low sensory threshold [LST], and aesthetic sensitivity [AES]) that relate differently to classical traits (Greven et al., Reference Greven, Lionetti, Booth, Aron, Fox, Schendan, Pluess, Bruining, Acevedo, Bijttebier and Homberg2019; Lionetti et al., Reference Lionetti, Pastore, Moscardino, Nocentini, Pluess and Pluess2019). For example, AES shows stronger relations with openness, whereas ease of excitation and LST correlate more with neuroticism and BIS-related measures (Greven et al., Reference Greven, Lionetti, Booth, Aron, Fox, Schendan, Pluess, Bruining, Acevedo, Bijttebier and Homberg2019; Lionetti et al., Reference Lionetti, Pastore, Moscardino, Nocentini, Pluess and Pluess2019). However, it is important to note that a significant proportion of SPS variance remains independent of these established constructs. Meta-analytic and review evidence suggests that SPS captures distinct tendencies toward deeper cognitive processing and heightened responsiveness to subtle environmental cues, which are not fully captured by Eysenck’s extraversion/neuroticism or Gray’s BIS/BAS (Lionetti et al., Reference Lionetti, Pastore, Moscardino, Nocentini, Pluess and Pluess2019). Furthermore, neuroimaging studies corroborate individuals with a high SPS score exhibit distinct patterns of task-related activation and resting-state functional connectivity, which are consistent with a deeper processing of social and sensory information (Acevedo et al., Reference Acevedo, Aron, Aron, Sangster, Collins and Brown2014, Reference Acevedo, Santander, Marhenke, Aron and Aron2021; Gerstenberg, Reference Gerstenberg2012). Therefore, SPS should be considered a related yet distinguishable construct of individual differences that overlaps with, rather than being reducible to, Eysenck’s dimensions or RST.
Aron and Aron (Reference Aron and Aron1997) note that SPS might have evolved as a way to promote the survival of species due to the heightened awareness of opportunity (e.g., food) and threats (e.g., predators) within the environment. People with elevated SPS are more likely to react to positive and negative stimuli in novel situations (Aron et al., Reference Aron, Aron and Jagiellowicz2012; Aron & Aron, Reference Aron and Aron1997). The differential susceptibility theory hypothesizes that, for better or for worse, people with levels of SPS can indicate a more sensitive nervous system to environmental stimuli (Belsky, Reference Belsky2016). This embraces a high sensitivity and responsivity to their environment that makes them more vulnerable when getting involved in risky conditions but also more supportive in enriched environments (Belsky, Reference Belsky2016). This is also explained by the neuroplasticity hypothesis, which claims that highly sensitive individuals are more likely to be malleable to both bad and good environmental conditions, increasing the probability to develop pathologies or healthy functions (Belsky, Reference Belsky2016; Moore & Depue, Reference Moore and Depue2016). Although SPS might have had evolutionary benefits for people, previous scholarship has indeed found that elevated SPS is a potential risk factor for anxiety and depression (Booth et al., Reference Booth, Standage and Fox2015) and other negative consequences (e.g., nightmares; Carr & Nielsen, Reference Carr and Nielsen2017). SPS is an area of literature gaining attraction among scholars; however, further research is needed to understand the relationship between SPS, mental disorders, and other negative outcomes.
Sensory Processing, Sensitivity, and Depression
Although SPS is not synonymous with psychopathological traits, individuals with elevated SPS who interact with adverse environments have a greater likelihood of developing maladaptive behaviors and increasing their chances for negative mental health symptoms (Greven et al., Reference Greven, Lionetti, Booth, Aron, Fox, Schendan, Pluess, Bruining, Acevedo, Bijttebier and Homberg2019). Notably, high-SPS people are more likely to experience depressive symptoms when compared to individuals with lower SPS thresholds (Liss et al., Reference Liss, Mailloux and Erchull2008). According to previous research, physiological studies have suggested a possible link between SPS levels and depressive symptoms due to the presence of particular mechanisms (i.e., 5-HTTLPR short-allele and low-density dopamine D2 receptor; Chen et al., Reference Chen, Chen, Moyzis, Stern, He, Li, Zhu and Dong2011; Homberg et al., Reference Homberg, Schubert, Asan and Aron2016) and the relationships they have with depressive symptoms.
Additionally, given that high-SPS individuals are more reactive to environmental stimuli, Liss and colleagues (Reference Liss, Mailloux and Erchull2008) share that a history of negative parental interactions (i.e., cold or uncaring interactions) increases the chances of greater depressive symptoms among high-SPS individuals. Aron and Aron (Reference Aron and Aron1997) share that the relationship between a negative parental environment and individuals noting a troubled childhood was more apparent among high-SPS men. However, researchers have hypothesized that the relation between SPS and depression might be a secondary circumstance of cognitive reactivity within individuals (Greven et al., Reference Greven, Lionetti, Booth, Aron, Fox, Schendan, Pluess, Bruining, Acevedo, Bijttebier and Homberg2019; Liss et al., Reference Liss, Mailloux and Erchull2008). Subsequently, researchers note that sensory stimuli are not the culprit for psychological distress (i.e., depression). Still, secondary thoughts and processes associated with the stimuli could lead to depressive symptoms among high-SPS individuals (Greven et al., Reference Greven, Lionetti, Booth, Aron, Fox, Schendan, Pluess, Bruining, Acevedo, Bijttebier and Homberg2019).
Sensory Processing Sensitivity and Sleep Quality
Due to both emotional and physiological reactivity to external (e.g., noise, lights, smells) and internal (e.g., hunger, body pain) stimuli, as well as their depth processing of environmental information, the overstimulation, the ease of excitation, and the subtleties analysis, highly sensitive individuals are more prone to feel overwhelmed by sensory stimulations (Greven et al., Reference Greven, Lionetti, Booth, Aron, Fox, Schendan, Pluess, Bruining, Acevedo, Bijttebier and Homberg2019). This could lead to individuals with high levels of SPS to experience negative outcomes of psychological health, such as sleep disturbances. As a matter of fact, previous research has extensively investigated the relationship between SPS and sleep (Costa-López et al., Reference Costa-López, Ruiz-Robledillo, Moreno, Albaladejo-Blázquez, Hernandez, Baryła-Matejczuk and Ferrer-Cascales2024), considering these traits as risky factors for the development of sleep alterations (Pieroni et al., Reference Pieroni, Raffone and Simione2024). People with high levels of SPS have also reported sleep disturbances (Costa-López et al., Reference Costa-López, Ruiz-Robledillo, Moreno, Albaladejo-Blázquez, Hernandez, Baryła-Matejczuk and Ferrer-Cascales2024; Pieroni et al., Reference Pieroni, Simione and Raffone2022). Indeed, neuroticism and depressive/anxious temperaments have been associated with poor sleep quality and sleep disturbances or dysfunctional sleep patterns (e.g., insomnia) in populations with no clinical diagnosis (Deguchi et al., Reference Deguchi, Iwasaki, Ishimoto, Ogawa, Fukuda, Nitta, Mitake, Nogi and Inoue2017; Larsgård & Saksvik-Lehouillier, Reference Larsgård and Saksvik-Lehouillier2017; van de Laar et al., Reference van de Laar, Verbeek, Pevernagie, Aldenkamp and Overeem2010). However, little is known regarding the specific association between SPS and sleep quality in the general population.
Depression as a Moderator in Sleep Quality
Sleep quality encompasses various features of sleep that include duration, arousal, and subjective aspects such as restfulness (Nelson et al., Reference Nelson, Davis and Corbett2022). The relationship between depression and sleep has been vastly studied due to high rates of co-occurrence (Afonso et al., Reference Afonso, Fonseca and Teodoro2022). Specifically, impaired sleep quality is a common chief complaint among individuals experiencing depression (Armitage, Reference Armitage2007). Researchers estimate that poor sleep quality impacts 50–90% of individuals diagnosed with depression (Tsuno et al., Reference Tsuno, Besset and Ritchie2005). To further amplify the relationship between depression and sleep, studies have found that a significant portion of individuals impacted by insomnia also have comorbid depression (Buysse et al., Reference Buysse, Angst, Gamma, Ajdacic, Eich and Rössler2008; Pandi-Perumal et al., Reference Pandi-Perumal, Monti, Burman, Karthikeyan, BaHammam, Spence, Brown and Narashimhan2020; Tsuno et al., Reference Tsuno, Besset and Ritchie2005).
Historically, research has associated poor sleep quality due to depression, leading practitioners only to treat depressive symptoms (Afonso et al., Reference Afonso, Fonseca and Teodoro2022). However, studies have provided evidence that sleep quality is impacted long after treatment for depression (Fang et al., Reference Fang, Tu, Sheng and Shao2019). Hinkelmann and colleagues (Reference Hinkelmann, Muhtz, Dettenborn, Agorastos, Moritz, Wingenfeld, Spitzer, Gold and Otte2013) share that residual insomnia is a common symptom of individuals who have gone through treatment for depression and is a risk factor for depression relapse. Thus, regarding the depression mechanisms related to sleep alterations, it has been suggested potential predictions of depression on sleep disturbances (Fang et al., Reference Fang, Tu, Sheng and Shao2019; Garmabi et al., Reference Garmabi, Andishmand, Naderi, Sharifnezhad, Darrudi, Malekzadeh, Amini and Gholami2024). Indeed, some researchers have reported that patients with depression diagnosis could present abnormalities in sleep quality among sleep patterns, which seems to be a clear sleep characteristic in individuals with depression (Garmabi et al., Reference Garmabi, Andishmand, Naderi, Sharifnezhad, Darrudi, Malekzadeh, Amini and Gholami2024). Specifically, it has been discovered that individuals with depressive symptoms may present biomarkers which could be associated with sleep impairment, such as an increase in inflammatory cytokines, rapid decrease in monoamines, or an increase in cholinergic tone, as well as a disruption in the circadian rhythm (Fang et al., Reference Fang, Tu, Sheng and Shao2019).
The Influence of Sociodemographic Variables in SPS, Depression, and Sleep Quality
A comprehensive understanding of individual differences in SPS, depression, and sleep quality is contingent on the consideration of sociodemographic variables, such as gender, age, and socioeconomic status. In relation to SPS, recent research has reported that women consistently exhibit higher scores on SPS measures in comparison with men, and a differential relationship between age and specific components of sensitivity has been demonstrated (Morales-Botello et al., Reference Morales-Botello, Betancort, Pérez-Chacón, Rodríguez-Jiménez and Chacón2025; Ueno et al., Reference Ueno, Takahashi and Oshio2019).
Similarly, the role of sociodemographic factors in depression has been extensively documented. Research has indicated that women have been shown to be at a disproportionately elevated risk of developing depressive symptoms in comparison with men (Salk et al., Reference Salk, Hyde and Abramson2017). Furthermore, the prevalence of such symptoms has been observed to be especially high during the periods of adolescence and early adulthood and with lower socioeconomic status (Kuehner, Reference Kuehner2017; Lorant et al., Reference Lorant, Deliège, Eaton, Robert, Philippot and Ansseau2003).
Research has demonstrated that sleep quality is also subject to systematic variation in accordance with sociodemographic characteristics. As indicated by Zhang and Wing (Reference Zhang and Wing2006), women have been found to report lower subjective sleep quality and higher rates of insomnia in comparison with men. Furthermore, research has suggested that age- and socioeconomic status–related changes in sleep architecture are a contributing factor to more frequent sleep disturbances in older adults (Ohayon et al., Reference Ohayon, Carskadon, Guilleminault and Vitiello2004; Patel et al., Reference Patel, Grandner, Xie, Branas and Gooneratne2010). These findings underscore the necessity of accounting for demographic variations when investigating the associations between SPS, depression, and sleep quality.
Purpose of the Study
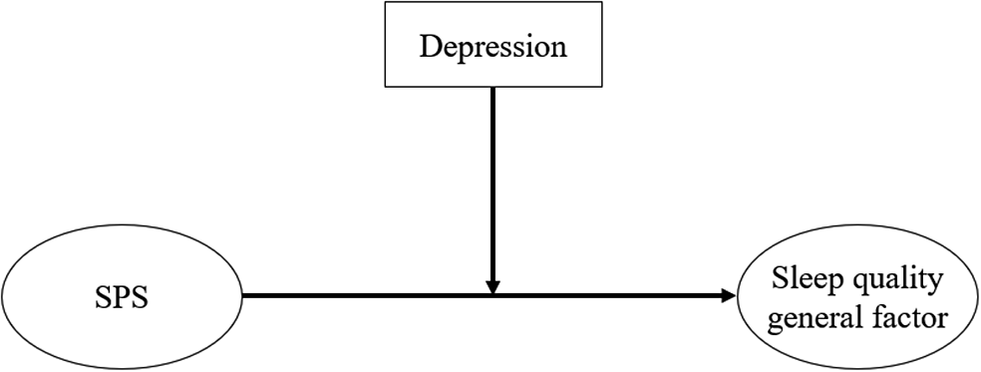
Based on the previous research studies and considering that sleep disturbances are among the mental health problems in the worldwide future agenda from 2018 to 2030 (World Health Organization, 2019), the objective of the present investigation was to further comprehend the relationship between SPS, depression, and sleep quality. First, we compared sensitivity groups in relation to depression and sleep quality. And then, we designed a moderation model, in which we examined depression as a moderator in the relationship between SPS and sleep quality. Particularly, we investigated the effects between SPS, depression, and sleep quality in Spanish adults. We hypothesized that (1) high levels of SPS will be significantly associated with high levels of sleep quality disturbances; (2) high levels of SPS will be significantly associated with high levels of depressive symptoms; and (3) depression will potentially moderate the relationship between SPS and sleep quality (Figure 1).
Theoretical research moderation model for the present study. SPS = sensory processing sensitivity.

Method
Participants
The sample involved a total of 1,122 Spanish adults, with a gender distribution of 75.8% female and 24.2% male participants, and an age range of 18 and 85 (M = 24.5, standard deviation [SD] = 11.2), residing in Spain. The sample comprised young, middle-aged, and older adults. Of these, 740 (66.0%) reported that they had completed secondary education, more than half of the sample were single (53.7%, n = 603), and 70.6% (n = 792) of the individuals had monthly incomes under 500€. Table 1 shows the sociodemographic information of the participants.
Sample characteristics (N = 1,122)

Note: M = mean; SD = standard deviation.
In accordance with the recommendations set out by Cohen (Reference Cohen1988), an examination was conducted to ascertain the statistical power of the study, with the objective of ensuring that the sample size was adequate for the detection of small-to-medium effects. The power analysis of the sample was performed using the Jamovi (2024, version 2.6) computer program. Power analysis indicated that a sample size of at least 665 individuals was required to identify large effects with a power of 95%, with an alpha level set at 0.05.
Measures
Sociodemographic Variables
Participants provided information about their age, gender, marital status, monthly incomes, and sexual orientation through an ad hoc questionnaire.
Sensory Processing Sensitivity
The HSPS-27 (Aron & Aron, Reference Aron and Aron1997; Chacón et al., Reference Chacón, Pérez-Chacón, Borda-Mas, Avargues-Navarro and López-Jiménez2021) is a self-report test for identifying highly sensitive people. It consists of 27 items with a 7-point Likert rating scale from 1 (not at all) to 7 (extremely). The higher the score, the higher the level of SPS. Example items from this measure include “I get rattled when I have a lot to do in a short amount of time” or “Being very hungry creates a strong reaction in me, disrupting my concentration or mood.” The Spanish version allows to calculate a general factor of sensitivity, and it also distributes the items in five subscales: (1) sensitivity to overstimulation (SOS); (2) LST; (3) AES; (4) fine psychophysiological discrimination (FPD); and (5) harm avoidance. Aron and Aron (Reference Aron and Aron1997) originally found internal consistency scores of (α = .87) and (α = .85). The Spanish version of the HSPS-27 is reliable in Spanish adults, demonstrating an internal consistency of (α = .92, ω = .93) (Chacón et al., Reference Chacón, Pérez-Chacón, Borda-Mas, Avargues-Navarro and López-Jiménez2021). This instrument also presents adequate reliability for the general factor of sensitivity throughout the study sample with Cronbach’s alpha and McDonald’s omega’s internal consistency coefficients: (α = .90, ω = .90). For this study, we used the general factor of sensitivity.
Sleep Quality
The Pittsburgh Sleep Quality Index (PSQI) Questionnaire (Buysse et al., Reference Buysse, Reynolds, Monk, Berman and Kupfer1989; Hita-Contreras et al., Reference Hita-Contreras, Martínez-López, Latorre-Román, Garrido, Santos and Martínez-Amat2014). The PSQI consists of 24 self-rated questions that assess sleep quality referencing the previous month. It is composed of seven subscales: (1) subjective sleep quality, (2) sleep latency, (3) sleep duration, (4) habitual sleep efficiency, (5) sleep disturbances, (6) use of sleeping medication, and (7) daytime dysfunction. These seven subscales build global scores ranging from 0 to 21, where a higher score represents poorer sleep quality. Example items from the PSQI measure include “During the past month, what time have you usually gone to bed at night?” or “During the past month, how often have you taken medicines to help you sleep (prescribed or ‘over the counter’)?” The PSQI has demonstrated good psychometric properties, showing high reliability for the general index of sleep quality through an internal consistency coefficient of Cronbach’s alpha (α = .81) (Hita-Contreras et al., Reference Hita-Contreras, Martínez-López, Latorre-Román, Garrido, Santos and Martínez-Amat2014). For this study, we used the general factor of sleep quality disturbances, and the reliability was (α = .72, ω = .72).
Depression
The Depression, Anxiety, and Stress Scale (DASS-21; Bados et al., Reference Bados, Solanas and Andrés2005; Lovibond & Lovibond, Reference Lovibond and Lovibond1995) is a 21-item scale measures negative emotional states of depression, anxiety, and stress. Respondents used a severity/frequency scale ranging from 0 (infrequent) to 3 (severe) to rate the extent to which they have experienced each state over the past week. For the current study, we only used the depression subscale, and an example item from this measure includes “I couldn’t seem to feel any positive feeling at all.” Scores were classified according to established severity cutoffs: normal (0–4), mild (5–6), moderate (7–10), severe (11–13), and extremely severe (14+). This instrument also presents adequate reliability throughout the study sample with Cronbach’s alpha and McDonald’s omega internal consistency coefficients in the depression subscale (α = .91; ω = .91).
Procedure
Participants were administered an online structured questionnaire to a general non-clinical population, which included a previously obtained informed consent form and a study description. Participation in the study was entirely voluntary, and their responses were anonymous. The sample was recruited using an exponential discrimination snowball sampling technique (Parker et al., Reference Parker, Scott, Geddes, Atkinson, Delamont, Cernat, Sakshaug and Williams2019), and the questionnaire was distributed through various social networks, as well as through the researchers’ email and WhatsApp contacts. The agreeable participants were asked to recommend other contacts who fit the research criteria and who potentially could be willing participants, who then, in turn, recommended other potential participants and so on.
The study received approval from the ethical committee of the University of Alicante (UA-2022-05-23_2) and followed the principles of the Declaration of Helsinki, as well as the data protection regulations (EU) 2016/679 of the European Parliament and of the Council dated April 27, 2016. Furthermore, the study adhered to the ethical guidelines provided in the Ethical Principles for Medical Research Involving Human Subjects by the World Medical Association (2013). This study was not pre-registered.
Data Analysis
Descriptive and correlation analyses (means, SDs, minimum and maximum values, skewness, kurtosis) were calculated for the study variables. Moreover, Pearson’s correlations were run to analyze the relationships among SPS, depression, and sleep quality. For the interpretation of these correlations, r values = .00 to .09 are considered as null correlation; r = .10 to .29 as weak correlation; r = .30 to .49 as moderate correlation; and r = .50 to .99 as strong correlation (Cohen, Reference Cohen1988; Hernández-Lalinde et al., Reference Hernández-Lalinde, Espinosa-Castro, Rodríguez, Chacón-Rangel, Toloza-Sierra, Arenas-Torrado, Carrillo-Sierra and Bermúdez-Pirela2018).
Cluster analysis. A two-step clustering analysis was run. First, a hierarchical analysis was performed to identify the number of clusters, and all clustering variables were standardized. Secondly, once the number of clusters was set, the K-means clustering analysis was carried out to detect the different sensitivity groups (low, medium, high) across the sample (Hennig et al., Reference Hennig, Meila, Murtagh and Rocci2015). To determine the optimal number of clusters, we applied the elbow method, which plots the within-cluster sum of squares against the number of clusters and identifies the point at which additional clusters no longer substantially reduce the variance (Cui, Reference Cui2020). Means and SDs were calculated to find out the level of severity of the depressive symptoms and the degree of sleep quality based on the sensitivity group (low, medium, and high).
One-way analysis of covariance (ANCOVA). To assess differences in depression and sleep quality among sensitivity groups, two ANCOVAs were performed and followed by the Bonferroni post hoc test, controlling gender, age, and monthly income. The effect size was also calculated, and to interpret it, η2 = .01 indicates a small effect, η2 = .06 indicates a medium effect, and η2 = .14 indicates a large effect. Also, ω2 < .01 signifies the effect size is small, .01 < ω2 < .06 = medium, and ω2 > .14 = large (Albers & Lakens, Reference Albers and Lakens2018). Differences with a p value < .05 were considered statistically significant. Preliminary analyses of differences in gender, age, and monthly incomes were conducted through chi-squared and one-way analysis of variance (ANOVA) analyses before carrying out the ANCOVAs to observe differences among sensitivity groups.
The moderation analysis was performed using Hayes’ (2022) PROCESS macro. This macro ran a series of ordinary least squares with the centered product term representing the interaction of SPS x depression (mild - moderate) and SPS x depression (mild - severe) as predictors of sleep quality. Gender, age, and monthly income variables were included in this analysis as possible confounders.
Reliability parameters of the instruments were also calculated through Cronbach’s α and McDonald’s ω for this study sample (McDonald, Reference McDonald1999). Unlike Cronbach’s α, McDonald’s ω uses factor loads and provides a more accurate estimate of reliability (Ventura-León & Caycho-Rodríguez, Reference Ventura-León and Caycho-Rodríguez2017).
All descriptive, reliability for the instruments, clustering, and ANOVA analyses used for this study sample were run with Statistical Package for the Social Sciences (SPSS) 28.0 for Windows.
All data were explored and demonstrated linearity, normality, independence, and homoscedasticity assumptions. To retain the hypothesis of these assumptions, we set p > .05.
Results
Preliminary and Correlation Analysis among the Study Variables
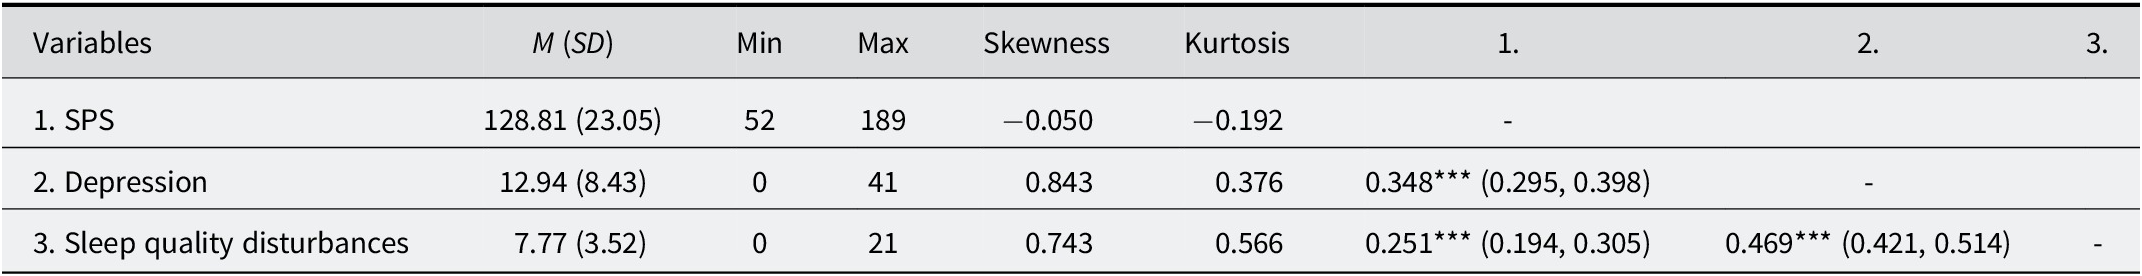
Descriptive statistics were firstly run for the general factor of sensitivity, the depression subscale, and the general factor of sleep quality disturbances (Table 2). Also, Pearson’s correlations revealed moderate and significant associations of depression with sleep quality disturbances (r = .469; p < .001) and SPS (r = .348; p < .001), respectively. A weak but significant correlation was found between SPS and sleep quality disturbances (r = .251; p < .001).
Descriptive and Pearson’s correlation analysis of the study variables (N = 1,122)

Note: M = mean; SD = standard deviation; Min = minimum; Max = maximum.
***p < .001.
Differences in Depression and Sleep Quality among Sensitivity Groups
After the clustering analysis, sensitivity groups were formed (low, medium, high) to find out the level of depressive symptoms and the degree of sleep quality depending on the level of sensitivity. Differences in gender, age, and monthly incomes among sensitivity groups are shown in Supplementary Table S1.
Tables 3 and 4 indicate the results of the descriptive and one-way ANCOVA analyses, in which we compared the three sensitivity groups in relation to the presence of depressive symptoms and sleep quality disturbances. Thus, the high-sensitivity group significantly reached the highest score for both depression (M = 15.96, p < .001) and sleep quality disturbances (M = 8.85, p < .001), compared to the other groups of sensitivity. Also, the effect size of the differences among the groups was medium for depression (η2 = .095) and small for sleep quality disturbances (η2 = .054). Moreover, the findings demonstrate a statistically significant influence of age (F = 88.49, p < .001, η2 = .126, ω2 = .125) and monthly incomes (F = 63.90, p < .001, η2 = .048, ω2 = .047) on depression, in addition to their established impact on sleep quality (age: F = 4.51, p = .034, η2 = .004, ω2 = .003, monthly incomes: F = 13.60, p < .001, η2 = .016, ω2 = .015), with the consideration of gender variable (F = 10.87, p < .001, η2 = .009, ω2 = .008).
Descriptive analysis, one-way analysis of covariance (ANCOVA), and post hoc analysis

Note: Differences in depression depending on the sensitivity group, considering gender, age, and monthly incomes as covariables (N = 1,122). SD = standard deviation; η2 = eta-squared; ω2 = Hays’ omega; d = Cohen’s d effect size parameter; CI = confidence interval.
Descriptive analysis, one-way analysis of covariance (ANCOVA), and post hoc analysis

Note: Differences in sleep quality depending on the sensitivity group, considering gender, age, and monthly incomes (N = 1,122). SD = standard deviation; η2 = eta-squared; ω2 = Hays’ omega; d = Cohen’s d effect size parameter; CI = confidence interval.
Depression as a Moderator in the Relationship between Sensory Processing Sensitivity and Sleep Quality
The results of the moderation of depression in the relationship between SPS and sleep quality are presented in Table 5 and Figure 2. The overall model is useful in predicting sleep quality, F (6, 1116) = 41.491, p < .001, R 2 = .158. The addition of depression significantly moderates the relationship between SPS and sleep quality (R 2 change = .008, F (2, 1116) = 5.717, p = .003). Specifically, the results show that an aggravation of depression increases the impact of SPS on sleep quality. No relevant differences were observed for gender, age, or monthly incomes as confounding variables.
Results of the moderation analysis for sleep quality as the outcome variable

F(6, 1116) = 41.491, p < .001, R2 = 0.158, interaction term R2 = 0.009, N = 1,122
Note: B = estimate; SE = standard error; CI = confidence interval.
Scatter plot graph. Moderation model representation of the study research.

Discussion
The main goal of this research was to examine the relationship between SPS, depression, and sleep quality. Specifically, our purpose was to compare sensitivity groups in relation to depression and sleep quality, as well as to analyze the moderating role of depression in the relationship between SPS and sleep quality.
Based on the analyses conducted for this study, our findings are in line with recent scientific evidence that has highlighted the essential role of SPS as a predictor of health-related issues (Greven et al., Reference Greven, Lionetti, Booth, Aron, Fox, Schendan, Pluess, Bruining, Acevedo, Bijttebier and Homberg2019). Specifically, Pearson’s correlation analysis shows positive and significant relationships between SPS, depression, and sleep quality disturbances. Despite the weak correlation between SPS and sleep quality disturbances, this relationship is still significant. Our research also indicates a higher level of depression and more sleep disturbances in the high-sensitivity group. Highly sensitive individuals tend to present a deeper perception and processing stimuli, and they are better able to recognize details in their surroundings and are more strongly influenced by what is going on around them (Lionetti et al., Reference Lionetti, Dumpfrey, Richetin, Fasolo, Nocentini, Penolazzi, Pluess, Santona, Spinelli and Preti2024). However, some researchers have confirmed important psychological implications predicted by this personality trait (Greven et al., Reference Greven, Lionetti, Booth, Aron, Fox, Schendan, Pluess, Bruining, Acevedo, Bijttebier and Homberg2019; Hellwig & Roth, Reference Hellwig and Roth2021). People high in SPS have been traditionally associated with maladaptive psychological outcomes and psychopathology symptoms (Baryła-Matejczuk et al., Reference Baryła-Matejczuk, Ferrer-Cascales, Albaladejo-Blázquez, Ruiz-Robledillo, Fernández-Alcántara, Rubio-Aparicio, Lillo-Crespo and Costa-López2022; Greven et al., Reference Greven, Lionetti, Booth, Aron, Fox, Schendan, Pluess, Bruining, Acevedo, Bijttebier and Homberg2019), and empirical studies have indeed demonstrated how SPS significantly and positively correlates with higher levels of depression and ruminative thinking (Lionetti et al., Reference Lionetti, Klein, Pastore, Aron and Pluess2022) and negatively with adaptive coping strategies to deal with it (Brindle et al., Reference Brindle, Moulding, Bakker and Nedeljkovic2015; Lionetti et al., Reference Lionetti, Dumpfrey, Richetin, Fasolo, Nocentini, Penolazzi, Pluess, Santona, Spinelli and Preti2024).
Beyond the direct associations observed between SPS, depressive symptoms, and sleep quality, it is important to situate SPS within the broader framework of personality research. While SPS is conceptually related to traits such as neuroticism and introversion, it captures a broader dimension of environmental sensitivity that goes beyond these constructs (Lionetti et al., Reference Lionetti, Aron, Aron, Burns, Jagiellowicz and Pluess2018; Smolewska et al., Reference Smolewska, McCabe and Woody2006). As demonstrated in previous studies, SPS has been shown to predict depressive symptoms and sleep disturbances, even when neuroticism is controlled for, thus highlighting its incremental validity and unique contribution to health-related outcomes (Booth et al., Reference Booth, Standage and Fox2015; Greven et al., Reference Greven, Lionetti, Booth, Aron, Fox, Schendan, Pluess, Bruining, Acevedo, Bijttebier and Homberg2019; Liss et al., Reference Liss, Timmel, Baxley and Killingsworth2005). This distinction is of particular importance in the context of SPS research, which relies heavily on self-report measures (Pluess et al., Reference Pluess, Assary, Lionetti, Lester, Krapohl, Aron and Aron2018). This raises the possibility of shared variance, which must be considered when interpreting results. The present findings lend support to the hypothesis that SPS is a distinct personality trait with specific relevance for understanding vulnerability to depression and sleep problems, as indicated by the emphasis placed on the discriminant validity of SPS (Booth et al., Reference Booth, Standage and Fox2015; Greven et al., Reference Greven, Lionetti, Booth, Aron, Fox, Schendan, Pluess, Bruining, Acevedo, Bijttebier and Homberg2019; Liss et al., Reference Liss, Timmel, Baxley and Killingsworth2005).
Previous theoretical research studies on SPS have indeed stated that high levels of heightened sensitivity can originate from a more sensitive nervous system (Greven et al., Reference Greven, Lionetti, Booth, Aron, Fox, Schendan, Pluess, Bruining, Acevedo, Bijttebier and Homberg2019; Lionetti & Pluess, Reference Lionetti and Pluess2023; Pluess et al., Reference Pluess, Lionetti, Aron and Aron2023), which allows a deeper processing of the external and internal stimuli, increasing the likelihood of stronger emotional responses (Acevedo et al., Reference Acevedo, Santander, Marhenke, Aron and Aron2021; Aron et al., Reference Aron, Aron and Jagiellowicz2012; Lionetti et al., Reference Lionetti, Aron, Aron, Burns, Jagiellowicz and Pluess2018; Pluess et al., Reference Pluess, Lionetti, Aron and Aron2023). Due to this, recent investigations have provided the scientific community with evidence related to how high sensitivity may increase more likely the risk for the appearance of mental health problems (Lionetti & Pluess, Reference Lionetti and Pluess2023; Liss et al., Reference Liss, Mailloux and Erchull2008), especially when highly sensitive people are exposed to adverse environments (Ferrer-Cascales et al., Reference Ferrer-Cascales, Ruiz-Robledillo, Albaladejo-Blázquez, Costa-López, Fernández-Alcántara, Rubio-Aparicio, Lillo-Crespo and Baryła-Matejczuk2023; Liss et al., Reference Liss, Mailloux and Erchull2008).
In addition to the established associations between SPS, depressive symptoms, and sleep quality, it is also important to consider the role of sociodemographic variables. The ANCOVAs conducted demonstrated that the disparities in depressive symptoms and sleep quality across sensitivity groups persisted after controlling for salient sociodemographic variables, including gender, age, and monthly incomes. This finding suggests that sociodemographic variables such as gender, age, and income contribute to explaining differences in depressive symptoms and sleep quality. However, the effects of high sensitivity remain significant even when these factors are taken into account. Recent research has explicitly examined the relationship between sociodemographic variables, such as age and gender, and SPS, and these findings are in alignment with the results obtained in this study (Hammarberg et al., Reference Hammarberg, Tran, Kirkman and Fisher2020; Lionetti et al., Reference Lionetti, Aron, Aron, Burns, Jagiellowicz and Pluess2018). For instance, Ueno et al. (Reference Ueno, Takahashi and Oshio2019) found that components of SPS, such as LST and ease of excitation, decline with age, while AES increases. These age-related trajectories are comparable across men and women. Furthermore, research has indicated that factors such as being female, of middle to older adult age, and living independently are among the strongest demographic predictors of high SPS. The collective findings of these studies indicate that gender and age are contributing factors to the variation observed in SPS (Morales-Botello et al., Reference Morales-Botello, Betancort, Pérez-Chacón, Rodríguez-Jiménez and Chacón2025).
Our results of the moderation analysis therefore demonstrate the effects of the presence of severe depressive symptoms with the interaction of SPS in sleep quality but not with mild–moderate depressive symptoms. In fact, previous research has shown the relationship between depression and sleep quality (Fan et al., Reference Fan, Ma, Zhang, Lin, Sun, Rosenheck and He2024; Fang et al., Reference Fang, Tu, Sheng and Shao2019). Particularly, it is well known through the recent scientific literature that alterations in sleep quality are the most prominent symptom among individuals with depressive symptoms, and it appears to be one of the main manifestations of depression (Fan et al., Reference Fan, Ma, Zhang, Lin, Sun, Rosenheck and He2024; Fang et al., Reference Fang, Tu, Sheng and Shao2019). Also, numerous studies have been also interested in the increase in sleep disturbances among depressive individuals, and these reports have been indeed supported by objective measures of sleep (Comsa et al., Reference Comsa, Anderson, Sharma, Yadav and Watson2022; Fan et al., Reference Fan, Ma, Zhang, Lin, Sun, Rosenheck and He2024).
The most important aspect of this analysis is that there is an intersection between SPS and mild–severe depression on the effects of sleep quality. That could mean that both the sensitivity trait and depression jointly have a potential effect on sleep quality. It is also relevant the intersection observed between sensitivity and depression. That is, depression is composed of relevant cognitive and emotional components, and a large number of researchers have empirically demonstrated the connection between sensitivity and these elements (Greven et al., Reference Greven, Lionetti, Booth, Aron, Fox, Schendan, Pluess, Bruining, Acevedo, Bijttebier and Homberg2019; Lionetti & Pluess, Reference Lionetti and Pluess2023). Although there is an important need for further comprehension of this association, recent research has reported the perception and processing of emotions and thoughts, and emotion regulation, considering the way that highly sensitive individuals interact with the environment, and the implications in well-being and quality of life (Costa-López et al., Reference Costa-López, Ferrer-Cascales, Ruiz-Robledillo, Albaladejo-Blázquez and Baryła-Matejczuk2021, Reference Costa-López, Ruiz-Robledillo, Moreno, Albaladejo-Blázquez, Hernandez, Baryła-Matejczuk and Ferrer-Cascales2024, Reference Costa-López, Ruiz-Robledillo, Moreno, Tirado, Albaladejo-Blázquez and Ferrer-Cascales2025; Lionetti et al., Reference Lionetti, Aron, Aron, Burns, Jagiellowicz and Pluess2018; Pluess et al., Reference Pluess, Lionetti, Aron and Aron2023). In fact, SPS has been also associated with long-term and greater depressive symptoms (Wright, Reference Wright2020). Previous studies have suggested the likelihood of the correlation between SPS and seasonal affective disorder, which is also composed of depressive and negative affect symptoms (Liss et al., Reference Liss, Mailloux and Erchull2008; Yano & Oishi, Reference Yano and Oishi2018). According to Yano and Oishi (Reference Yano and Oishi2018), the SPS domains of LST and ease of excitation could also lead to a strong link to higher reactivity to external and internal stimulations and that may cause a tendency to psychopathological issues such as depression.
According to these results and the scientific literature so far, it is well known that highly sensitive people have a tendency to present mental health challenges because of the high levels of arousability and their reactivity while interacting with environmental stimulations (Yano et al., Reference Yano, Kase and Oishi2019). Several studies have reported the positive correlation between SPS and psychopathology, such as cognitive and psychological dysfunctions, ruminations, or social avoidance (Yano et al., Reference Yano, Kase and Oishi2019). As researchers have recently indicated, SPS theoretical frameworks postulate that highly sensitive individuals, who exhibit various indicators of nervous system functioning, are disproportionately more likely to internalize the negative effects of both external and internal stimuli, thereby exacerbating the risk of psychopathology (May et al., Reference May, Smeeth, McEwen, Karam, Rieder, Elzagallaai, van Uum, Lionetti and Pluess2024). Although highly sensitive people could be positively affected by supportive experiences, they are particularly more susceptible to adverse ones (Lionetti & Pluess, Reference Lionetti and Pluess2023). According to the neurosensitivity hypothesis, genetic and environmental factors can shape heightened sensitivity, suggesting that brain sensitivity markers have been found (Acevedo et al., Reference Acevedo, Aron, Aron, Sangster, Collins and Brown2014; Pluess & Belsky, Reference Pluess and Belsky2013). These neural markers make individual differences in sensitivity and also differentiate groups of sensitivity with various stimuli-processing reactivity (Pluess, Reference Pluess2015). Indeed, based on this perspective, depending on the quality of their environmental exposure, they may show sensitivity to positive or negative experiences. Some researchers suggest that dysfunctional responses (i.e., over-arousability and strong emotional reactions) to environmental stimuli are related to psychopathological issues (Yano et al., Reference Yano, Kase and Oishi2019). Although there has been much research interested in the relationship between SPS and maladaptive psychological issues, there is less scientific evidence which supports the association of SPS with positive mental health outcomes so far. However, highly sensitive people have shown better social skills and emotional well-being in supportive environments (Lionetti et al., Reference Lionetti, Klein, Pastore, Aron and Pluess2022; Lionetti et al., Reference Lionetti, Dumpfrey, Richetin, Fasolo, Nocentini, Penolazzi, Pluess, Santona, Spinelli and Preti2024; Pluess & Boniwell, Reference Pluess and Boniwell2015).
Clinical Implications
Hence, the findings of this study could provide valuable insights for the scientific and clinical communities to delve deeper into the mechanisms underpinning the link between SPS and psychopathology. Additionally, these results empower clinical professionals to recognize and address maladaptive symptoms associated with heightened sensitivity to the environment, potentially aiding in the prevention of depressive symptoms and sleep disturbances among highly sensitive individuals (Greven et al., Reference Greven, Lionetti, Booth, Aron, Fox, Schendan, Pluess, Bruining, Acevedo, Bijttebier and Homberg2019).
Limitations and Strengths
Nevertheless, this study is not without limitations. First, employing a cross-sectional methodology, this study urges careful interpretation regarding the connections among SPS, depression, and sleep quality. Second, reliance on self-reported variables without incorporating objective measures such as clinical diagnoses or physical and mental health biomarkers is noted. It underscores the necessity for additional research to quantify the associations between SPS and mental health using both clinical and non-clinical samples, longitudinal frameworks, and objective biological markers indicative of sensitivity to environmental stimuli. Third, the utilization of a snowball sampling method engenders limitations in terms of the representativeness of the sample, given that participants were recruited through personal networks and online dissemination. Another limitation pertains to the categorization of depressive symptoms, which is currently handled as a group rather than as a continuous variable. Although we followed the recommended cutoff scores of the DASS-21 and merged adjacent categories to increase statistical power, this approach may have reduced the sensitivity of the analyses.
While acknowledging these limitations, this study also exhibits several strengths. Notably, it boasts a sufficiently representative sample size of the study population, facilitating generalizability to other populations sharing similar sociodemographic characteristics. Furthermore, as the global agenda and contemporary research seem to be focused on the identification of risk and protective factors of mental health (Arango et al., Reference Arango, Dragioti, Solmi, Cortese, Domschke, Murray, Jones, Uher, Carvalho, Reichenberg, Shin, Andreassen, Correll and Fusar-Poli2021), our findings align with existing research theories on SPS and could potentially contribute to the development of new models, as well as applied clinical intervention programs, given the observed associations between SPS, depression, and sleep quality assessed through self-report psychological measures.
Conclusion
Our study discloses new knowledge on the link between SPS and maladaptive mental health outcomes, such as depression and sleep quality disturbances, with the interaction of main sociodemographic variables (e.g., gender, age, and monthly incomes). SPS appears to be a predictor of sleep quality, and it can also interact with depression to modulate sleep quality. SPS may thus play an essential role in the development and state of health, depending on the kind of environmental experiences individuals are involved in. Furthermore, beyond the significant relationship of SPS and depressive symptoms, the last ones seem to moderate between SPS and sleep quality. Our research provides the scientific and clinical staff with information on how SPS and depressive symptoms can make changes in sleep quality and the moderation role of depression in the effects of SPS on sleep quality in adult samples.
Supplementary material
To view supplementary material for this article, please visit http://doi.org/10.1017/SJP.2026.10020.
Open science statement
All study materials, data, and analysis generated or analyzed during this study are included in this published article. The availability must be personally requested to the corresponding author.
Data availability statement
All data generated or analyzed during this study are included in this published article. The availability of data must be personally requested to the corresponding author.
Author contribution
Conceptualized the study: B.C.-L., N.R.-R., O.M., G.M., N.A.-B., R.F.-C.; designed the methodology: B.C.-L., N.R.-R., N.A.-B., R.F.-C.; provided software: B.C.-L., N.R.-R., N.A.-B., R.F.-C.; validated the data: B.C.-L., N.R.-R., N.A.-B., R.F.-C.; involved in formal analysis: B.C.-L., N.R.-R., N.A.-B., R.F.-C.; investigated the data: B.C.-L., N.R.-R., O.M., G.M., N.A.-B., R.F.-C.; curated the data: B.C.-L., N.R.-R., N.A.-B., R.F.-C.; wrote the original draft: B.C.-L., N.R.-R., O.M., G.M., N.A.-B., R.F.-C.; visualized the data: B.C.-L., N.R.-R., R.F.-C.; provided resources: N.R.-R., N.A.-B., R.F.-C.; wrote, reviewed, and edited the manuscript: N.R.-R., O.M., N.A.-B., R.F.-C.; supervised the data: N.R.-R., O.M., R.F.-C.; administered the project: N.A.-B., R.F.-C.; acquired funding: N.A.-B., R.F.-C.
Funding statement
This work was supported by the European Commission (Grant Number: 2020–1-PL01-KA203–082261).
Competing interests
The authors declared no potential competing interests with respect to the research, authorship, and/or publication of this article.


 Open access