Osteoarthritis as a musculoskeletal disease is a progressive deterioration of joints which results in pain, stiffness, and dysfunction of joints. Osteoarthritis is the main indication for total knee replacement (TKR), accounting for 97.5 percent of cases (1). In 2015, almost 60,000 TKRs were performed in Australia with over 70 percent of operations being undertaken in private hospitals (2). In public hospitals, despite government targets that no patient should wait more than 12 months, over 1,000 patients waited over 12 months in 2014–15 for their TKR from the time they were placed on the waiting list (3). Patients on waiting lists for TKR have been shown to experience deterioration in both physical function and health-related quality of life (Reference Kapstad, Rustoen, Hanestad, Moum, Langeland and Stavem4;Reference Desmeules, Dionne, Belzile, Bourbonnais and Frémont5). Such deterioration can impact on postsurgical outcomes as patients with greater functional limitations, pain and comorbidities before surgery tend to have poorer outcomes (Reference Desmeules, Dionne, Belzile, Bourbonnais, Champagne and Frémont6;Reference Lingard, Katz, Wright and Sledge7).
Earlier treatment of publicly funded patients may achieve health gains that justify the additional costs of reducing waiting times. One option to reduce waiting times is for the government to contract with private hospitals to undertake TKRs on patients who are likely to wait longer than the target waiting time if treated in a public hospital. This study reports on the cost-effectiveness of implementing a private contracting model to meet alternative maximum waiting time targets for publicly funded patients undergoing TKR.
METHODS
A linked decision tree and cohort Markov (state transition) model was developed to represent the pathways of patients waiting for a publicly funded TKR to a maximum age of 100 years. The eligible population comprises patients who are categorized as non-urgent, which is defined as a condition causing minimal or no pain, dysfunction, or disability, which is unlikely to deteriorate quickly and which does not have the potential to become an emergency (3).
The Western Ontario and McMaster Universities Arthritis Index (WOMAC) was used to represent patients’ health status. WOMAC is a disease-specific questionnaire for osteoarthritis patients that is used widely and has been thoroughly validated (Reference Bellamy, Buchanan, Goldsmith, Campbell and Stitt8). To achieve consistency across the data sources used to populate the cost-effectiveness model the WOMAC physical function scale was used rather than the full WOMAC score.
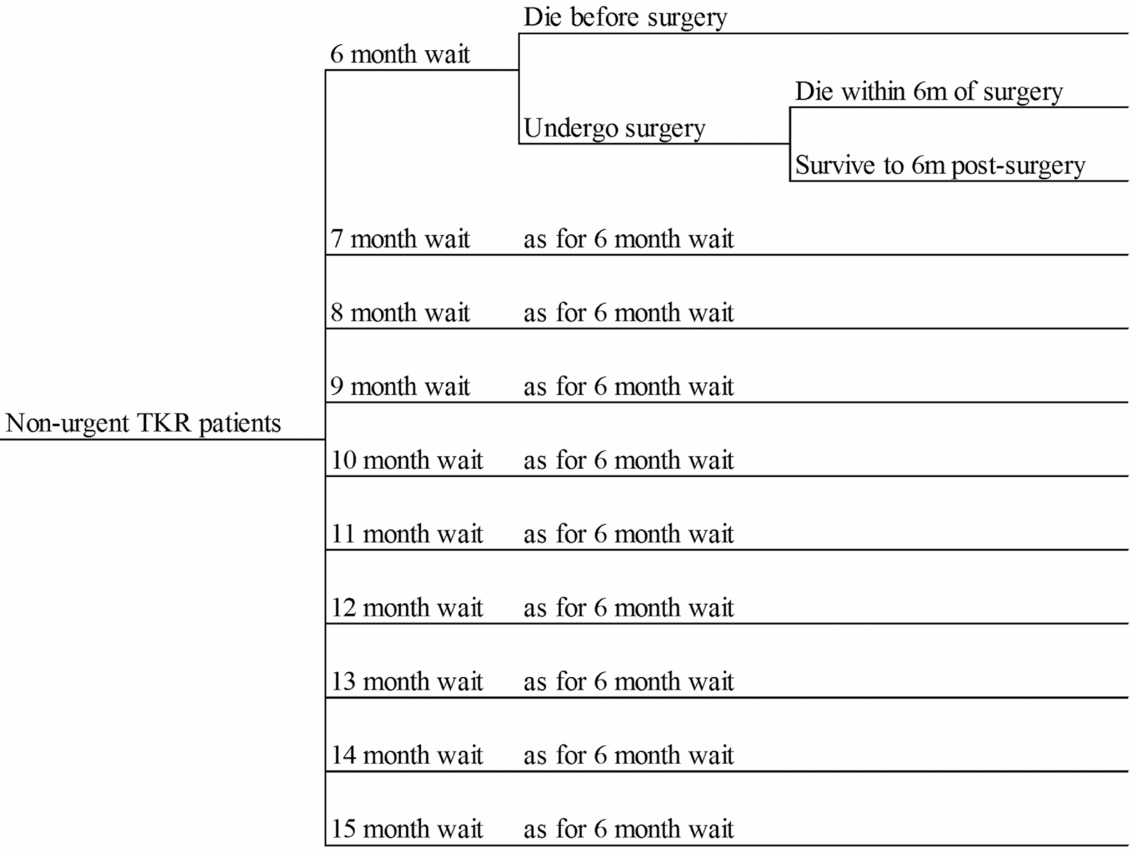
Figure 1 presents the decision tree structure, which assigns patients across 10 alternative waiting times for TKR (6 to 15 months), with the probabilities varying across the strategies being analyzed. For each waiting time, patients have a probability of remaining alive to undergo surgery. For those undergoing TKR, a probability of remaining alive 6 months postsurgery is specified. Average WOMAC scores at baseline, at time of surgery and at 6 months postsurgery are also represented in the decision tree. QALYs gained within the decision tree time horizon are estimated by applying mapped utility weights to the estimated pre- and postsurgery WOMAC scores. Patients dying pre- and postsurgery are assumed to die at the mid-point of the respective time periods. Costs represent resources used whilst waiting and during surgery and rehabilitation.
The decision tree structure.
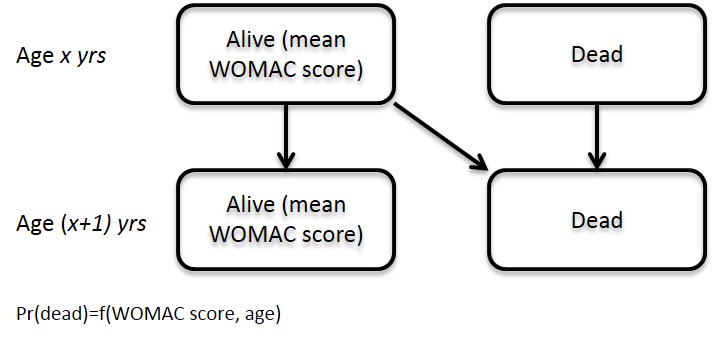
The Markov model presented in Supplementary Figure 1 estimates the costs and QALYs gained beyond 6 months post-TKR. The model comprises only two health states, alive and dead, but patients’ WOMAC scores are represented in the alive state, which determines health state utilities and probabilities of death. An annual model cycle was specified due to the assumed stability of patients’ WOMAC score postsurgery.
The analysis was undertaken from an Australian public healthcare system perspective. Where required, costs were transformed and uprated to represent 2016 Australian dollar values and all costs and QALYs were discounted at a rate of 5 percent per year.
The following sections summarize the data and methods used to estimate the model's input parameter values, which are presented in Table 1.
Model Input Parameter Values
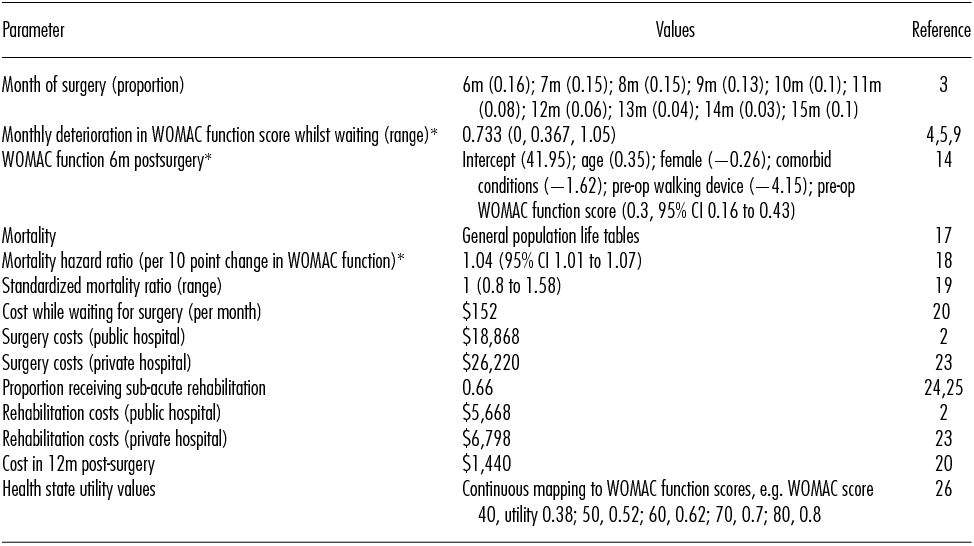
* WOMAC (Western Ontario and McMaster Universities Osteoarthritis Index) function is measured on a 0 to 100 scale (worst to best).
m, month.
Current Waiting Times for TKR
From 2010–11 to 2014–15, Australian Institute of Health and Welfare (AIHW) data show that on average 50 percent of patients waited over 6 months for a TKR, and 10 percent waited more than 1 year (3). The AIHW also reported that 60 percent of patients admitted for TKR were categorized as nonurgent. We assume that all patients categorized as urgent or semi-urgent wait less than 6 months for their surgery (the target is 3 months). Then, 84 percent of nonurgent patients are estimated to wait over 6 months (0.6 × 0.84 = 0.5). The remaining 16 percent of nonurgent patients undergo surgery within 6 months for all evaluated waiting time scenarios. It is estimated that 17 percent of nonurgent patients wait over 12 months (0.6 × 0.17 = 0.1).
To estimate waiting times for nonurgent patients, it is, first, assumed that no nonurgent patients wait less than 3 months for a TKR. A log normal distribution (mean 5.26; SD 0.75) was then fitted to match the estimated cumulative probabilities of surgery at 6 and 12 months (estimated as 3 and 9 months beyond the first surgery at 3 months). An upper limit of a 15 month waiting time was assumed.
Deterioration in Health Status on Waiting List
A review published in 2009 found two studies reporting changes in WOMAC score for patients waiting for knee replacement over short waiting periods (defined as less than 6 months) (Reference Kapstad, Rustoen, Hanestad, Moum, Langeland and Stavem4;Reference Kelly, Voaklander, Johnston, Newman and Suarez-Almazor9), but no high quality studies of the effect of long waiting times (Reference Hoogeboom, van den Ende and van der Sluis10). Kapstad et al. reported a statistically significant deterioration of 3 percentage points in WOMAC physical function over a mean waiting time of 102 days (Reference Kapstad, Rustoen, Hanestad, Moum, Langeland and Stavem4). Kelly et al. reported a nonsignificant improvement of 1.8 percentage points over a mean waiting time of 132 days, but suggested measurement bias may have influenced observed improvements (Reference Kelly, Voaklander, Johnston, Newman and Suarez-Almazor9). Both studies reported a significant deterioration in pain.
A more recent study reported a significant decline of 4.6 percentage points in WOMAC physical function scores over a mean waiting time of 183 days (Reference Desmeules, Dionne, Belzile, Bourbonnais and Frémont5). This study also presented deterioration by waiting time, showing a decline of 11 percentage points for patients waiting 9–12 months, though patients waiting >12 months experienced less functional decline. The authors suggest this result may be due to response shift in patients waiting such long times that results in a change in an individual's conceptualization of physical function.
Desmeules et al. showed that the decline in functional status to a waiting time of 12 months was approximately linear (Reference Desmeules, Dionne, Belzile, Bourbonnais and Frémont5). A weighted average of the monthly decline across the three studies was selected as the base case estimate. To account for the observed improvements reported by Kelly et al. (Reference Kelly, Voaklander, Johnston, Newman and Suarez-Almazor9), physical function was assumed to have remained stable in improvers and an average decline was based on the 19 percent of patients who reported a decline in function. To represent the uncertainty around the estimated monthly deterioration rate, alternative scenarios included assumptions of stable function (zero deterioration), and monthly deteriorations of 0.367 percentage points (half the base case) and 1.06 percentage point (based on the 9–12 months waiting time group reported by Desmeules et al.).
Change in Health Status Postsurgery
A review of the literature identified a range of studies reporting change on health status following TKR. In some studies, it was difficult disentangle the effects of waiting times and differences in preoperative health status (Reference Desmeules, Dionne, Belzile, Bourbonnais, Champagne and Frémont6;Reference Hajat, Fitzpatrick and Morris11). Hamilton et al. (Reference Hamilton, Henderson, Gaston, MacDonald, Howie and Simpson12) and Judge et al. (13) presented models that predicted postsurgical Oxford Knee Score (OKS) as a function of patients’ score presurgery. However, in the absence of data describing deterioration in OKS over the waiting period, priority was assigned to studies reporting change in health status as represented by the WOMAC instrument.
Using data from 860 patients undergoing TKR in the United Kingdom, the United States, and Australia (n = 170), Lingard et al. fitted four separate regression models to predict WOMAC pain and function scores at 12 and 24 months postsurgery, showing that preoperative WOMAC scores in both domains are strong predictors of outcomes (Reference Lingard, Katz, Wright and Sledge7). Controlling for relevant preoperative factors, Australian patients achieved better outcomes than UK patients but worse than U.S. patients. Unfortunately, intercept coefficients were not presented for the models and so postsurgical WOMAC scores could not be generated for use in the cost-effectiveness model.
Jones et al. followed 276 Canadian patients undergoing TKR (Reference Jones, Voaklander and Suarez-Alma14). The fitted regression model predicting WOMAC function at 6 months postsurgery also found preoperative function to be a significant predictor, with a very similar co-efficient to those reported by Lingard et al. – patients’ postsurgery WOMAC function score included one third of their presurgery score. Jones and colleagues presented all model coefficients and so this model was used to generate postsurgery WOMAC function scores as a function of presurgery age, gender, WOMAC function score, number of co-morbid conditions, and use of a walking device. As the eligible population are defined as non-urgent, we assume patients have no co-morbidities and do not use a walking device.
Two studies were identified that reported on outcomes at multiple time-points beyond 6 months postsurgery. Kirwan et al. measured pain and disability at annual intervals to 5 years postsurgery and reported relatively stable results for both aspects beyond 1 year postsurgery (Reference Kirwan, Currey, Freeman, Snow and Young15). Rissanen et al. reported some decline in physical ability between 6 months and 2 years post-TKR, though walking, use of stairs and use of devices outcomes improved out to 2 years (Reference Rissanen, Aro, Sintonen, Slätis and Paavolainen16). Quality of life (as measured using the 15D preference-based instrument) remained stable. On the basis of these studies, in the base case it is assumed that the estimated postsurgery WOMAC score remains constant over patients’ lifetimes.
Mortality
Mortality is applied as a function of age and WOMAC function score with an additional adjustment to control for differences between the age-matched general population and the patient population undergoing TKR. Age- and gender-specific mortality probabilities for the Australian general population were derived from Life Tables (17).
Hawker et al. estimated the mortality effects of WOMAC functional status by observing mortality over 13 years in a cohort of 2,156 individuals aged over 55 years old with at least moderately symptomatic hip or knee osteoarthritis. Adjusting for a wide range of sociodemographic and clinical covariates, the authors estimated a hazard ratio of 1.04 (95 percent CI 1.01–1.07) per 10-point increase in baseline WOMAC function score (Reference Hawker, Croxford and Bierman18). The mortality probability in the general population was applied to a mean WOMAC function score of 60 with the reported hazard ratio applied to increase and decrease mortality probabilities for lower and higher WOMAC scores, respectively.
Patients undergoing TKR may have different underlying mortality risks to the general population and so it may not be appropriate to apply general population mortality probabilities. A population-based cohort study of 1,163 English osteoarthritis patients aged over 35 years reported a standardized mortality ratio (SMR) of 1.58 (95 percent CI 1.41–1.70) (Reference Nüesch, Dieppe, Reichenbach, Williams, Iff and Jüni19). This SMR was applied to uprate the WOMAC-adjusted general population mortality probabilities.
Resource Use and Costs
Resource use was estimated for four sequential phases of the cost-effectiveness model: presurgery, surgery, rehabilitation, and postsurgery/rehabilitation.
No Australian data were identified describing resource use by patients waiting for TKR nor following completion of the surgical and rehabilitation treatment phases. The most relevant data source was a retrospective study of 298 patients undergoing TKR in Canada (Reference Quan, Lafreniere and Johnson20), which estimated costs of Canadian $3.24 per day in the year preceding surgery and Canadian $2.55 per day in the year postsurgery. The Purchasing Power Parity (PPP) in 1997 was applied to convert to Australian dollars (21), which were then uprated to 2016 Australian values using the Health Prices Index (22). The daily presurgery costs was applied to waiting times and an annual postsurgery cost was applied. TKR revisions were not represented in the model and so costs beyond 1-year postsurgery were not estimated.
Separate surgical costs of undertaking TKR in public and private Australian hospitals were derived from the most recently reported AR-DRG cost weights (2;23). The AR-DRG costs differentiate between TKR procedures in patients with and without catastrophic or severe comorbidities or complications (I04A and I04B, respectively). In the base case, we assume the eligible population of nonurgent patients did not have catastrophic or severe comorbidities or complications.
The proportion of patients receiving rehabilitation beyond that received as part of the acute surgical episode of care was informed by two Australian studies. Sheehan et al. assessed 106 discharges in Queensland, Australia (Reference Sheehan, Wilson and Vaz24) and Lingard et al. observed fifty-nine cases in South Australia (Reference Lingard, Berven and Katz25), reported similar proportions of patients receiving additional rehabilitation (64 percent and 68 percent, respectively). The average rehabilitation rate was applied to patients undergoing TKR in both public and private hospitals. AR-DRG rehabilitation costs in public and private hospitals (without catastrophic comorbidities or complications) were applied (2;23).
Public surgery and rehabilitation costs were applied to all patients undergoing TKR under current practice. In the alternative strategies, private costs were applied to patients undergoing surgery in an earlier month to that in which they would undergo TKR under current practice.
A sensitivity analysis assessed the effects of including downstream costs associated with the revision of a proportion of TKR procedures. The National Joint Registry report presents revision rates up to 10 years postprimary TKR (1). The average cost of AR-DRG I29Z (knee reconstruction/revision), discounted at 5 percent per annum, was applied to the reported revision rates to estimate an expected downstream cost of $1,644 associated with revisions.
Utility Weights
Utility weights were mapped to WOMAC function scores to estimate QALY gains. Wailoo et al. modeled the relationship between WOMAC scores and EQ-5D-3L values using data from 7,072 Spanish patients with knee or hip osteoarthritis, which found functional disability and pain to be strong predictors of utility (Reference Wailoo, Alava and Martinez26).
The base case analysis assumes no decline in the estimated postsurgery utility over the remainder of patients’ lifetimes. The effects of assuming an annual decline of 0.005 percentage points per year was applied in a sensitivity analysis. This reduction is slightly higher than the annual reduction in utility in the Australian general population (Reference Clemens, Begum, Harper, Whitty and Scuffham27), where annual reductions of 0.003 and 0.002 are reported between the ages of 60 and 70 years and 70 and 80 years, respectively.
Model Validation
Two sets of validation targets were identified. First, the input data used to predict postsurgery WOMAC function scores were validated using data reported by an independent study. Fleeton et al. reported pre- and postsurgery WOMAC function scores from 390 Australia patients who underwent TKR as part of a clinical trial comparing usual rehabilitation care with an intensive 2–3 months exercise program (Reference Fleeton, Harmer and Nairn28). The reported mean age, the proportion of female, and baseline WOMAC function scores were applied to the predictive model used in the cost-effectiveness model to test whether the estimated postsurgery WOMAC score lay within the 95 percent confidence interval of the reported data.
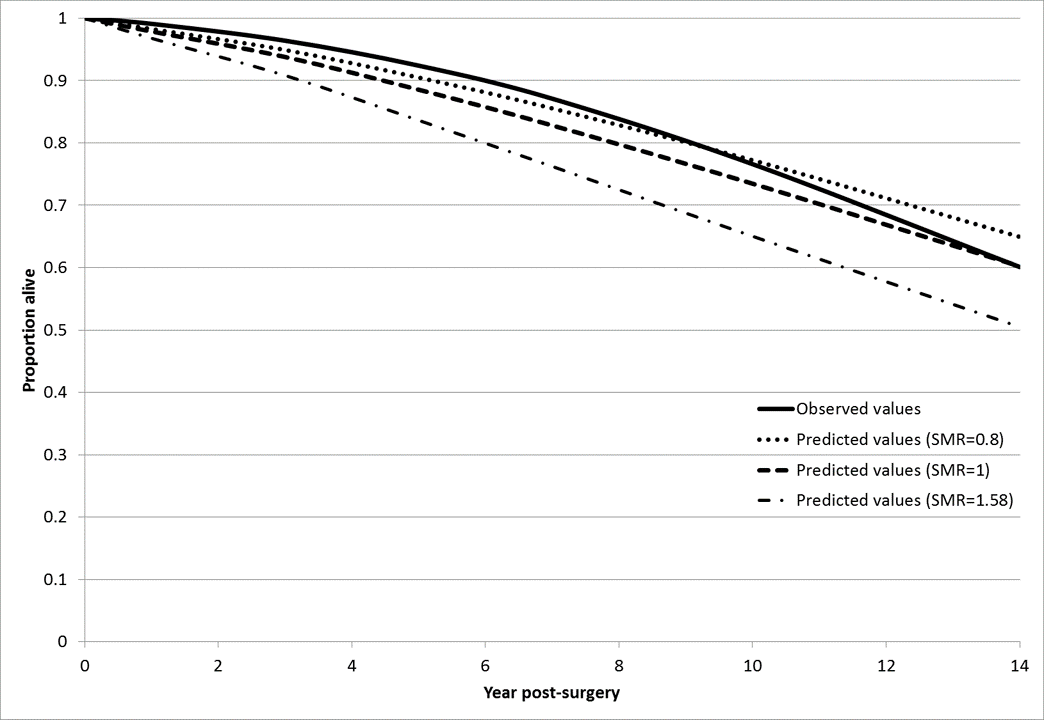
As an external validation target, the Australian National Joint Registry report survival data to 14 years postsurgery for patients undergoing TKR (1). To validate the cost-effectiveness model against these survival data, postsurgery survival outputs were collected from separate analyses of the current practice model for different age groups. The postsurgery survival outputs were weighted to replicate the reported age distribution of the registry population, and compared with the observed registry data.
Analysis
The base case analysis reflected the expected age and gender of TKR patients recorded in the National Joint Registry (age 69 years; 43 percent male) (1). A baseline WOMAC function score of 47 was based on that reported in an Australian cohort (Reference Fleeton, Harmer and Nairn28). A comprehensive set of sensitivity analyses were conducted to assess the sensitivity of the base case results to uncertainty around the true value of the model's input parameters. The parameter ranges tested are described in Table 1.
RESULTS
Validation analysis of the input data used to predict postsurgery WOMAC function scores showed that the model underestimated the validation target: the predicted value, 78.9 was below the lower 95 percent confidence interval of the observed values (95 percent CI: 79.9–85.2). The underestimation is potentially explained by the increased level of rehabilitation in the observed data, restrictive eligibility criteria (an upper age limit of 75 years and a “capacity to be discharged to home”) and the fact that over 3 percent of the population were excluded from the analysis because they developed instability. For these reasons, we suggest the under-prediction of the observed data does not refute the validity of the input data.
Supplementary Figure 2 presents comparisons of observed and predicted survival postsurgery. Using the original model specification with an SMR of 1.58, predicted survival was significantly lower than the observed values reported by the National Joint Registry (1). At year 5, the model predicted survival of under 84 percent, whilst the registry data shows over 92 percent of patients survive to 5 years. The input parameter with the greatest influence on survival is the SMR, which was applied to all patients to account for the underlying increased mortality risk that has been estimated for osteoarthritis patients. An SMR of 1 is applied in the base case analysis. Supplementary Figure S2 shows that if the SMR is set to 1, the model predictions match the observed data in year 14, but underestimates survival in the preceding years. An SMR below 1 is applied in the sensitivity analyses to test the hypothesis that the eligible population are at lower mortality risk than the general population due to the need for a certain level of health to undergo surgery and to support recovery postsurgery. This assumption is supported by evidence that physical activity is a risk factor for TKR (Reference Wang, Simpson and Wluka29).
Table 2 presents the base case results. The expected cost per patient with current practice is $27,840, which would increase to $29,217 if private services were used to meet the current guidance that non-urgent patients should not wait more than 12 months for surgery. The accompanying expected QALY gain per patient of 0.03 QALYs results in an incremental cost per QALY gained of over $50,000. Compared with current practice, a 9-month maximum wait strategy gains 0.09 QALYs at an incremental cost under $33,000 per QALY gained. Compared with the 9-month strategy, a 6-month strategy gains an additional 0.08 QALYs per patient at an incremental cost under $39,000 per QALY gained.
Base Case and Cost Scenario Results
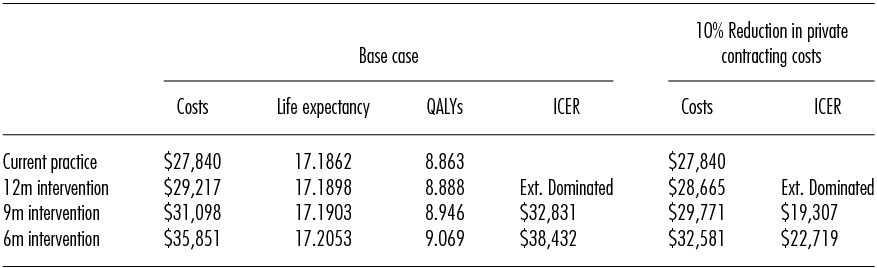
QALYs, quality-adjusted life years; ICER, incremental cost-effectiveness ratio; Ext. Dominated, Extendedly Dominated, the option has a higher ICER than the next most effective option.
Table 2 also presents the results of a scenario analysis, assuming the government can negotiate a 10 percent reduction in the base case estimate of the costs of private contracting for TKR. The results show that the incremental cost per QALY gained of the 6-month waiting time limit reduces to under $23,000 per QALY gained.
Table 3 presents the results of the sensitivity analyses, in which incremental net benefits (INBs) are estimated by applying a monetary equivalent value of $45,000 per QALY gained (in line with the lower bound of the value suggested by recommendations for the funding of new pharmaceuticals in Australia) (30;31). In the base case, the INBs show that the 6-month strategy generates the highest expected INBs. Ordered by expected INBs for the 6-month strategy, the table shows that if the current waiting time target of 12 months could be met within the public sector, the value of the 6-month strategy would be significantly reduced to generate INBs of only $86 per patient. Increased patient age switches the optimal strategy to a 9-month maximum wait though the INB is low at $66 per patient.
Sensitivity Analysis Results
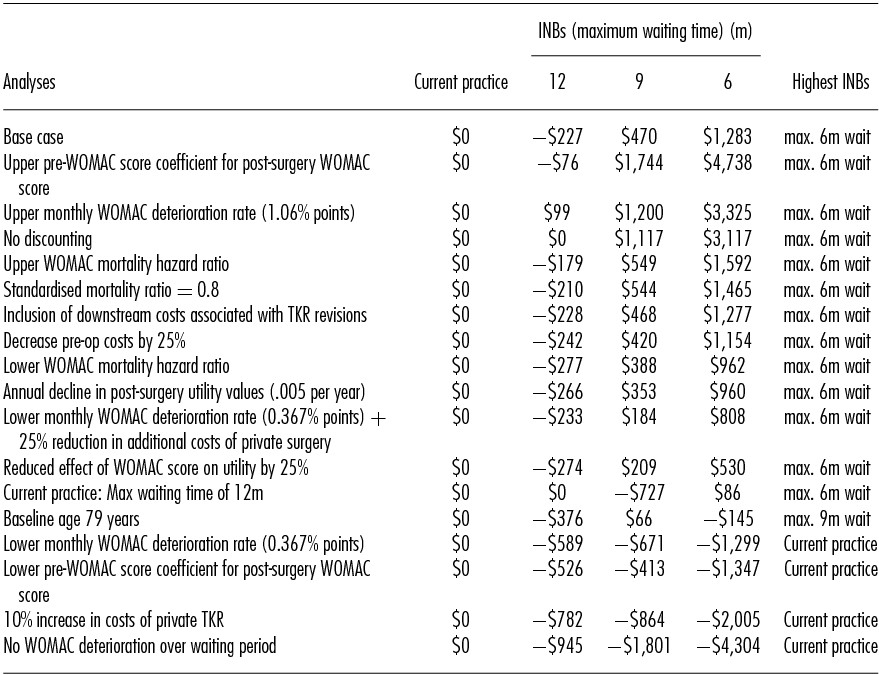
INBs, incremental net benefits assuming a monetary value of a quality-adjusted life-year of $45,000; WOMAC, Western Ontario and McMaster Universities Osteoarthritis Index; TKR, total knee replacement.
Three analyses resulted in significant negative INBs across all of the new strategies: a 10 percent increase in the price of private TKRs, the application of the lower confidence interval value for the effect of presurgery functional status on postsurgery outcomes and a halving of the rate at which functional status deteriorates over the waiting period.
A two-way analysis shows that reducing the additional costs of private surgery offsets the effects of the halving of the deterioration rate.
DISCUSSION
TKR has been shown to be a cost-effective treatment for all patients with arthritis and significant knee symptoms (Reference Dakin, Gray, Fitzpatrick, MaxLennan and Murray32). In Australia, around 10 percent of publicly funded patients wait more than 12 months for TKR from the time at which they are placed on the waiting list (1). This is in addition to the time between first presentation and being formally placed on the waiting list. Significant waiting times mean that knee function can deteriorate while patients wait for surgery, resulting in poorer patient outcomes. This study has estimated that public funding of TKRs in private hospitals to reduce waiting times could generate additional QALYs at a lower incremental cost than achieved by new pharmaceuticals that are recommended for public subsidy (30;31). Value would be further improved if government could negotiate lower private contracting costs, which may be possible given the large potential volume of services contracted. Alternatively, longer-term costs could be reduced by investment to increase capacity in the public sector.
Only one other study of the cost-effectiveness of early compared with late TKR in osteoarthritis patients was identified, in France (Reference Mari, Degieux, Mistretta, Guillemin and Richette33). Mari et al. described the use of a wide range of nonpharmacological and pharmacological treatment options, for which probabilities of improvement in WOMAC pain scores were derived from the literature. Arbitrary values were selected for all other transition probabilities, including the probabilities of surgery within the early and late strategies. The estimated incremental cost per QALY gained for early vs. late TKR was €43,631 (Aus$78,737). The French evaluation and the current evaluation were quite different, with the former estimating that only 4 percent and 14 percent of patients in the early and late groups received TKR.
Another relevant study is a randomized controlled trial of TKR within 3 months and TKR with a nonfixed waiting time (mean waiting time 7.9 months), which reported no significant differences in outcomes between the two groups at 12 months postsurgery (Reference Tuominen, Sintonen and Hirvonen34). The absence of a significant mean effect and more than 20 percent loss to follow-up in both treatment groups may mask significant effects in a sub-group of patients. Kelly et al. reported that 19 percent of patients reported a significant deterioration over the waiting period (Reference Kelly, Voaklander, Johnston, Newman and Suarez-Almazor9).
A limitation of the presented cost-effectiveness analysis is the application of a mean deterioration rate in physical function to all patients waiting for TKR. Clearly, there is variation across patients waiting for TKR, but such variation is only relevant if it is used to inform the prioritization of patients for surgery. A barrier to such prioritization is the frequency with which surgeons see patients who are waiting for TKRs. In the public healthcare system, patients may not see their surgeon between being put on the waiting list and their preoperative visit.
Currently, surgeons categorize patients as urgent, semi-urgent and nonurgent (this study focuses on nonurgent patients). A formal review process for non-urgent patients may be a cost-effective option, although it would likely require investment in additional outpatient capacity to handle extra outpatient appointments and surgical capacity to maintain a politically acceptable maximum waiting time, the prioritization of deteriorating patients will push out waiting times for nondeteriorating patients. Alternatively, the development and validation of deterioration prediction tools may inform improved prioritization of patients at baseline.
Another limitation concerns the potentially dynamic nature of demand for TKR. The current model reflects an assumption that increased public funding for TKR will not generate additional demand for TKR. If the patient population expands to include patients for whom the benefits of TKR are reduced, the value of the increased funding will also be reduced. Additional analyses would be required to inform appropriate eligibility criteria, but such criteria are commonly applied to new technologies and similar processes could be used to monitor and encourage compliance. In the United Kingdom, primary care trusts have used the Oxford Knee Score as an eligibility criterion to limit demand. However, Dakin et al. estimated that the nationwide application of the most commonly selected threshold “would deny a highly cost-effective treatment to >10,000 patients/year” (Reference Dakin, Gray, Fitzpatrick, MaxLennan and Murray32), suggesting that eligibility criteria are not required to maintain the value of increased public funding for TKR.
In conclusion, the reported cost-effectiveness analysis of alternative options for increased government funding of TKR suggests that these options may be more cost-effective than many new pharmaceuticals that are publicly funded in Australia (30;31). Two key areas for further investigation to improve the validity of the analysis include the likely cost of expanding capacity for TKR and current processes for managing waiting lists for non-urgent TKR patients.
This study illustrates a general framework for the analysis of the value of increased capacity for the public funding of elective surgical procedures. More cost-effectiveness analyses of options for expanding capacity should be undertaken. Increased TKR is unlikely to be the only form of elective surgery for which increased public funding may provide a high value option for improving health outcomes. More evidence on the value of such investments would support the development of new funding models to support such investments and reductions in the prices paid for new technologies, leading to a more efficient and sustainable publicly funded healthcare system.
SUPPLEMENTARY MATERIAL
Supplementary Figure 1: https://doi.org/10.1017/S0266462317004524
Supplementary Figure 2: https://doi.org/10.1017/S0266462317004524
CONFLICTS OF INTEREST
The authors have no relevant interests to disclose.