




What does the public want to know about the humanities? At the Humanities Indicators (HI), one measure we use is our own traffic statistics, looking at the questions from various search engines that draw people to particular data on the site (http://humanitiesindicators.org/). After sixteen years of tracking trends in the humanities in areas ranging from education to public life to funding and research, the HI is known for its commitment to providing rigorous and timely information on these trends. As such, the site draws a significant amount of organic traffic, as more than half the visits to the site come from search queries.
Perhaps tellingly, the most popular page on the site is the only one that lacks any data—but does address public confusion about the term “humanities.” The page defining the humanities attracted more than 12,000 people in response to a query about this definition—twice as much traffic as any other page on the HI site. This was not a surprise. During the development work for a national survey of the public about the humanities in 2019, we found that large portions of the public were unfamiliar with the term, sometimes confusing it with humanitarian activities such as giving blood or donating to charity. The relatively high number of queries that led to this page shows that uncertainty about the term persists (Figure 1).
An Overview of Topics Covered by the Humanities Indicators.

2. The humanities and higher education
For most people, the humanities are associated with higher education, and concern over the health of the humanities at colleges and universities has found its way into popular discourse. For users of the HI, the most pressing concerns center on degrees earned and classes taken.
Given the value placed on the number of bachelor’s degrees in the humanities in current discussions over recent department and school closures, understanding and tracking this number tends to serve as an important proxy for the health of the humanities. And the trend there is worrisome by almost any measure. After a period of growth leading to a recent peak in 2012, the number of bachelor’s degree completions in the humanities has been in decline for more than a decade (Figure 2).Footnote 1
Trend in Humanities Bachelor’s Degrees Awarded, 1997 to 2022.

A recent survey of humanities department chairs found a fairly high correlation between high levels of pessimism about the future of a discipline at that institution and recent substantial declines in the number of majors. The five largest disciplines in the field—which recently experienced some of the largest declines in bachelor’s degrees (of 40% or more)—had the highest levels of pessimism—with around 50 percent concerned about their futures (Figure 3).Footnote 2
Share of Department Chairs in Discipline Feeling Pessimistic about the Future of Their Discipline (in 2024) and Change in Bachelor’s Degrees Awarded in Those Disciplines (2014 to 2024).

More than 2,000 people wanted to know about humanities enrollments, as another popular page about the academic humanities offers data on the courses students take. It demonstrates the disproportionate role the humanities play in general education requirements—particularly around writing, history, communication, and languages. The most recent data point is over two decades old now (and it seems unlikely that will be remedied under our current presidential administration; Figure 4).Footnote 3
The Four Most Popular Humanities Courses by Student Enrollment, 2004.

3. Humanities majors and how they fare
The value of a humanities degree has increasingly been questioned in the public forum. Recent discussions appear to have led visitors to the HI website to seek information on who chooses to study the humanities and what they can expect to face in terms of wages and unemployment rates after graduation.
Given the increasing cost of college tuition in the US, many potential students and their parents wonder about the “return on investment” for earning a bachelor’s degree. In 2021, 5.2 percent of humanities majors were unemployed, which was slightly higher than the unemployment rate among all terminal bachelor’s degree holders (4.3%). There was also no measurable difference in the unemployment rates between men and women who majored in the humanities. In comparison, the arts have the highest rates of unemployment (7.5%), while the health and medical sciences have the lowest (2.5%) (Figure 5).Footnote 4
Unemployment Rate by Field of Bachelor’s Degree, 2021.

Visitors to the HI site were just as curious about how much a humanities major could expect to earn after graduation, and how this differs between men and women. In 2021, the median earnings of Americans with bachelor’s degrees in the humanities were modestly below the average for graduates from all fields (which is substantially inflated by the unusually high earnings of engineering and computer science grads), but the gender earnings gap among humanities majors (17.1%) was 8 percentage points smaller than that for bachelor’s degree holders as a whole (25%) (Figure 6).Footnote 5
Gender Gap in Earnings by Field of Bachelor’s Degree, 2021.

Americans also appeared curious about the gender breakdowns in who earned bachelor’s degrees in the humanities. Women have consistently earned more humanities bachelor’s degrees than men, with the share staying relatively stable from 1987 (58%) to 2022 (62%). Women earned the largest share of degrees in ethnic, gender, and cultural studies (81.2%), and the smallest in philosophy (41%). Despite the large share of women among humanities degree recipients, the field represents a shrinking portion of the bachelor’s degrees earned by women. The share of all bachelor’s degrees awarded to women who were in the humanities dropped from 1987 (13.6%) to 2022 (9.4%) (Figure 7).Footnote 6
Humanities as a Share of Bachelor’s Degrees Awarded to Women, 2022.

History is a discipline where women have made gains over the past few decades, though the share of women earning degrees in history has remained below that for the humanities as a whole. From 1966 to 2014, the biggest strides made by women in earning history degrees have been at the doctoral level, rising from 12 percent in 1966 to between 41 percent and 46 percent during 2020–2023 (Figure 8).Footnote 7
Share of PhDs in History Awarded to Women, 1966 to 2023.

4. The humanities beyond higher education
Outside of academia, the humanities play a critical role in equipping people with the tools to engage with and explore language, culture, and history, helping them to find meaning and connecting in everyday life. While information related to academia tends to attract the most traffic to the HI site, some of the more popular pages offer information on other forms of public engagement with the humanities, including reading, writing, museum attendance, and multilingualism.
Reading is a foundational humanities activity, so it is not surprising that it attracted some of the largest interest in the HI site. The data on time spent reading attracted almost 3,000 people, and it shows that the share of Americans who read more than 20 minutes a day outside of work or school has fallen sharply since 2003 (the earliest date for which data are available). As of 2023, less than 15 percent of Americans aged 15 and older read for an average of at least 20 minutes a day (down from 22% two decades earlier). That compares to almost 80 percent who watched TV or played games at a similar rate—a share that barely changed over the same period (Figure 9).Footnote 8
Share of Adults in the U.S. Spending more than 20 Minutes per Day Reading for Pleasure Compared to the Share Spending more than 20 Minutes per Day Watching TV or Playing Video Games, 2003 and 2023.

Even though they might appear to be at the margins of humanities activity, the trend in art museum attendance was also exceptionally popular (the 6th most popular page on the site). Rates of attendance among Americans hit their lowest point in 2012, when only 21 percent had visited an art museum in the previous year, but by 2017, attendance numbers were on the rise at 24 percent and only 3 percentage points below the peak in 2002. It is worth noting that relatively few Americans visited an art museum compared to other arts and humanities activities in the same survey (Figure 10).Footnote 9
Share of the U.S. Population that Visited Art Museums, 2017.

A variety of HI research projects have surfaced the many ways multilingualism can be a vital skill out in the world. In 2021, the majority of multilingual adults spoke Spanish or Spanish Creole in addition to English—far exceeding the share who spoke either an Indo-European language (20%) or an Asian or Pacific Island language (17.3%). The remaining multilingual Americans (6%) spoke indigenous languages of North, Central, and South America; Semitic languages; and languages of Africa (Figure 11).Footnote 10
Share of Multilingual Americans Conversant in Language, 2021.

Concerns over writing proficiency have come from humanities educators at all levels of the American education system, and almost a thousand Americans came to the HI site looking for more information on the subject. Patterns of achievement levels in accordance with the National Assessment of Educational Progress (NAEP) Writing Framework are cause for concern. From 1998 to 2007, fewer than 1 in 4 high school seniors were writing at the proficient level or higher. More current data are very much needed, but the current presidential administration’s priorities leave the future of those NAEP assessments hanging in the balance (Figure 12).Footnote 11
Share of High School Seniors Writing at a Proficient Level or Higher, 2007.

5. Paying out and spending down
Recent actions by the federal government have put humanities funding front and center in the news. However, for the past year, questions about how some of our most well-known humanities organizations—public libraries, colleges and universities, and the National Endowment for the Humanities—have also been of keen interest for visitors to the HI site (attracting around 1,000 visitors to each page).
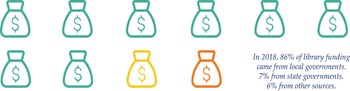
Public libraries are consistently one of the public’s most trusted humanities organizations. For those visiting the HI site, how they receive funding and how they spend it appears to be top of mind. Public libraries receive the majority of their funding from local governments but are also sustained by the federal government, donations, fees, and grants (Figure 13).Footnote 12
Sources of Funding for Public Libraries, 2018.

College and university funding for research and development in the humanities as compared to other fields is particularly salient given current concerns over the loss of once reliable funding sources. And for good reason. The humanities rely much more on their academic institutions to fund research and development, in contrast to STEM subjects, which can rely more heavily on outside sources like funding from the federal government (Figure 14).Footnote 13
Sources of Funding for Academic Research in the Humanities, 2020.

For more than fifty years, the National Endowment for the Humanities was the most important federal funding source for the humanities, but it has been a political battleground since the 1980s. The NEH reached its funding apex in FY 1979, but the inflation-adjusted amount in FY 2024 was a mere 41 percent of this peak. As of this writing, the future of the NEH is uncertain, as the current presidential administration has eliminated large portions of the agency’s staff (Figure 15).Footnote 14
Funding Levels for the National Endowment for Humanities (Adjusted for Inflation), 1966 to 2024.

The HI rely on the continuous release of data from a variety of federal sources. To ensure that they remain true indicators—regularly updated to be able to track trends—it is vital that the agencies charged with compiling and releasing these datasets are well supported. However, many government agencies from the National Endowment for the Humanities to the Department of Education have been stripped of essential staff and are threatened with funding cuts by the current presidential administration. The HI is committed to maintaining information on the humanities that can be used as a resource by humanists across the country, which is only possible with data from trusted sources. Public Humanities readers should stay up-to-date on the changes happening in the federal government, and do all they can to support the agencies and government employees that collect, vet, and share this vital information.
Icon Credits
-
Report card by Hamid Raja
-
Stack of coins by Dario Ferrardo
-
World by Vector Place
-
Diploma by Vandin Icons
-
Briefcase by Google
-
Graduation cap by Hamid Raja
-
Man by Leremy Stick Figures
-
Woman by Google
-
Student in cap by Aficons studio
-
Book by Fluent Emoji for Microsoft
-
Computer by Vincent le moign
-
Team by Unicon labs
-
Student at desk by The Icon Z
-
Money bag by Venus
-
Multilingual person by Syahral Hidayatullah
-
Coin by Andrea Zudip aggasi
-
Dollar bill by Devendra Karkar
-
Art museum person by Github
Author contribution
Conceptualization: R.B.T., S.M.
Conflicts of interests
The authors declare no competing interests.




 Open access

