


Consider Throughout
1. Collaboration: Integrated risk management (IRM) is most effective when Trustees and employers cooperate with one another, given their joint interest in the pension scheme. Cooperation can also avoid duplication of work. Advisors should encourage such cooperation. Advisors should also collaborate with one another to enable their client to develop a joined-up strategy (Figure 1).
The ten commandments for effective integrated risk management
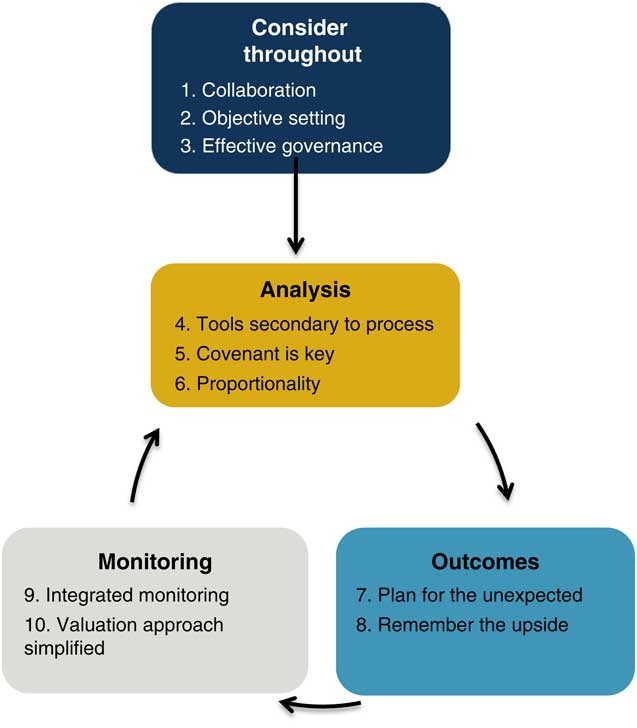
2. Objective setting: Advisors should encourage Trustees and employers to think about their long-term objectives for the pension scheme (e.g. to reach buyout by a particular timeframe, or just to keep contributions at an affordable level). Risk in the scheme should then be viewed in the context of that objective. The objectives should take account of the Trustees’ and employers’ risk capacity and appetites. The objectives should also be kept under review.
3. Effective governance structure: For IRM to work effectively careful thought is needed on the governance structure of the scheme to ensure that advisors’ work is truly joined-up and their work does not overlap unnecessarily.
Analysis
4. Tools secondary to process: The tools used should help to inform the process but the real value is in the process itself and the greater understanding, monitoring capability and enhanced decision making which it enables.
5. Covenant is key: Covenant should be seen as a vital part of any advice on risk or strategy in a pension scheme, rather than an afterthought.
6. Proportionality: IRM does not have to be an expensive exercise; for a well-run scheme much of the analysis should already be being carried out. IRM analysis should be proportionate to the benefit it brings; analysis should only be carried out if it is going to affect decision making in a material way. IRM should be used to allocate time and budget between covenant, investment and funding work in a way which is proportionate to the success of the scheme.
Outcomes
7. Plan for the unexpected: Advice should recognise that investment markets are volatile, and the strength of the employer covenant can change over time. Advisors should encourage Trustees to understand this volatility and to consider what they would do if their strategy does not proceed as expected (either positively or negatively).
8. Remember the upside: Risk management is about the understanding of risk and how it can be best managed to meet a scheme’s goals – it does not necessarily follow that because you are doing a risk management exercise that you should be reducing risk. It is also important for advisors to take into account the potential upside risk.
Monitoring
9. Integrated monitoring: Monitoring of investment performance and funding position should be considered alongside monitoring of the strength of the employer to give a complete picture. For example, the funding position of a scheme could be monitored alongside a measure of affordability such as profit before tax.
10. Valuation approach simplified: Effective IRM involves the setting of sustainable funding and investment strategies and monitoring how these strategies progress. Therefore, if IRM is being done effectively, formal valuations and investment strategy reviews should become less onerous.
1. Introduction
1.1. The Working Party was formed in 2015 with the following objectives.
1.1.1. To identify the needs of actuaries in regard to integrated risk management (IRM) work for defined benefit (DB) pension schemes.
1.1.2. To provide practical ideas to address some of these needs, and extend understanding of solutions among actuaries.
1.1.3. To encourage actuaries (in all roles) to grasp the opportunities presented by enterprise risk management/IRM.
1.2. The background to the work was the publication by the Pensions Regulator (TPR) of their revised code of practice on scheme funding (Code 03) (TPR, 2014), which introduced a formal requirement for IRM as part of the scheme-funding process. This was supplemented by subsequent regulatory guidance issued in December 2015 (TPR, 2015).
1.3. The December 2015 guidance introduces IRM as follows:
IRM is a risk management tool that helps Trustees identify and manage the factors that affect the prospects of meeting the scheme objective, especially those factors that affect risks in more than one area. The overall strategy the Trustees have in place to achieve this objective will be dependent on the scheme’s and employer’s circumstances from time to time (Working Party emphasis added).
1.4. The Working Party has focussed on the issues that arise in ensuring that covenant, funding and investment advice are consistent and joined-up in areas where they interact, thus supporting the delivery of scheme benefits at the appropriate level of risk. This means countering the natural tendency for individual specialist advisers to focus on their own “silos” rather than most effectively contributing to the success of the scheme and its sponsor in the round.
1.5. As part of the needs analysis the Working Party surveyed attendees at the Autumn 2015 CHIPSFootnote 1 seminars as to the issues most deserving attention. This highlighted the following top five topics:
-
∙ Contingency planning.
-
∙ Covenant/funding ratios (metrics which have both covenant and funding elements).
-
∙ Covenant metrics (derived from covenant factors only).
-
∙ Journey planning.
-
∙ Special needs of small/medium schemes.
1.6. This supported anecdotal evidence that TPR’s guidance was in many respects a codification of best practice already adopted by larger schemes, but that few examples of such practices (or TPR’s view of them) existed in the public domain, and extension to small/medium schemes represented a significant industry challenge. TPR adopted the approach of providing generic guidance rather than prescribing a particular model. Further, TPR’s guidance is focussed at Trustees, whereas there was little guidance in the public domain for actuaries.
1.7. The Working Party has therefore focussed on creating some examples of what it believes represent good practice across a range of schemes, along with learnings from creating and discussing these examples within the group and with others. These learnings have been crystallised into “ten commandments” for good IRM practice.
1.8. We are conscious that risk management of a pension scheme is much broader than managing the covenant/funding/investment interaction, and that there are other important risk areas such as operational, legal and political risks. These were outside the scope of the project but this should not be taken to suggest they are unimportant.
1.9. Our work is specifically aimed at UK DB practitioners dealing with the regulatory regime “as it is” for schemes sponsored by commercial enterprises – we have not sought to analyse its strengths or weaknesses or application in other arenas.
1.10. The purpose of Working Party papers is educational and as such the paper represents the views and insights of the authors and does not constitute the official view of the IFoA. We received anonymised and helpful feedback from some individual TPR members on an earlier draft of the paper; however, we have not considered it appropriate to seek any formal endorsement from TPR on the final paper.
1.11. We received feedback and input from many different sources listed in the acknowledgements section. In particular, we would highlight the involvement of Paul Brice, founding chairman of the Employer Covenant Working Group, and Matthew Harrison of Lincoln Pensions Ltd., who commented on the covenant aspects of the paper.
2. The Process
2.1. Whilst the primary focus of an IRM exercise is to identify and implement solutions that lead to the best outcome, the journey towards finding these solutions will also help to enhance the stakeholders’ understanding of the important issues. In particular, much of the value of the IRM framework comes from an open and collaborative discussion between the various stakeholders, so that the views on risk held by each can be expressed by reference to risk appetites, risk tolerances, potential outcomes and their consequences for the Trustees and employer. Some other areas that could contribute towards making the process more efficient and relevant are discussed below.
2.2. From the case studies, it will be apparent that an IRM review, like most management processes, will be an iterative process, involving the refinement of the overall strategy over several stages of analysis, in order to meet the interconnected requirements of the various stakeholders. This is not dissimilar to the iterative nature of the process for reaching agreement between the Trustees and employer for a formal valuation. An effective IRM framework could make this process more efficient by organising outputs at each stage such that they are adding value to the discussions at successive stages. This would help towards the stepped progression of achieving trustee and employer objectives, as well as continual refinement of the overall risk management strategy.
2.3. The holistic approach of IRM enables management decisions to be focussed at all times on the long-term objective of the scheme, with a well-considered strategy to get there over an appropriate period which also retains reasonable flexibility to adapt it as events unfold. Whilst this may appear at first sight to be outside the statutory funding framework and in conflict with it, we do not think that is the case in practice. Many schemes operate on the basis of aligning their technical provisions to a long-term objective, with the IRM framework providing a guide to balance short-term priorities and actions against desired outcomes in the long term. Case study B provides one illustration of how this may happen, and in practice there are many other variations on the theme.
2.4. We sense that the practical application of IRM currently has different levels of “maturity”. For example, when it comes to joining-up the contributions of the various advisers it may be that in some schemes all that can be hoped for initially is that the advisers confer with each other so that they each understand how their advice informs that of the others. In others, we may find each adviser using as specific inputs for his/her advice certain targeted information provided by the other advisers. Finally, in schemes which have progressed to applying an holistic approach we may find that risks are viewed in a fully correlated manner. It is likely that this maturity is a function of scheme size although we do not believe that it needs to be. The guiding principle is that Trustees need to understand how their key risks, and support mechanisms, move relative to each other and in what circumstances. Where budgets are a constraining factor Trustees need to ask whether the value added from this additional insight should be traded against other work which they find less useful for scheme management.
2.5. IRM Lead: A typical IRM review will involve many parties, including representatives of the Trustees and sponsor, as well as advisers (on one or both sides) covering the funding, investment and covenant aspects. The Working Party believes that in many cases the appointment of an “IRM Lead” (who may, e.g. be an in-house person with the right experience and skills or drawn from one of the above parties) will enhance the process by acting as a conduit between the Trustees and employer, coordinating the efforts of the advisers, and ensuring consistency of their outputs to aid the decision-making process. Nonetheless, it is important that potential conflicts of interest (including the incentive for an adviser to generate more work for themselves) should be recognised and addressed.
2.6. Timeline: It is our view that all schemes should view IRM as a means of improving scheme management and governance. Those who do should find that a dynamic process works best, with risk management embedded into the decision-making process, allowing the Trustees to seize opportunities as well as to deal with threats as they arise. In practice this is unlikely to work well unless aligned to the culture of decision making in each scheme and sponsor. We therefore hesitate to suggest any rigid timelines or process requirements for IRM beyond the general principles set out in the ten commandments. How best they are executed in the context of a particular scheme is almost the first task for the IRM Lead. However, the two examples below illustrate the spirit in which this could be done, depending on the circumstances.
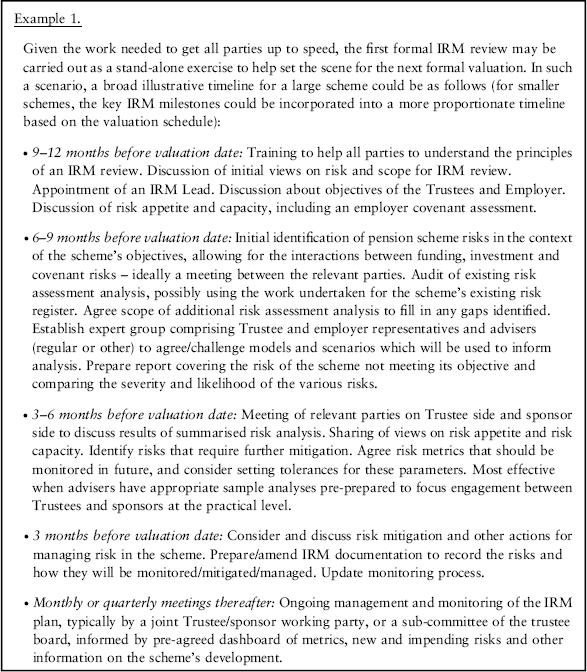
The timeline for both the initial review and subsequent monitoring and updating should be designed to ensure an appropriate response to events. Important corporate events such as restructuring or re-financing may well be drivers for change which create both risks and opportunities. IRM work should be timetabled to capture these.
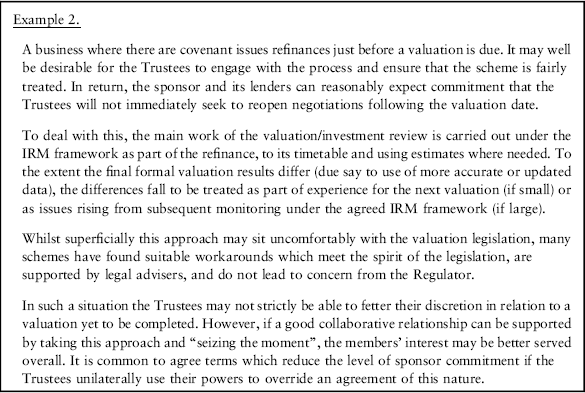
2.7. Collaboration: In discussing the case studies, it was clear to the Working Party that the collaboration of all parties is essential for the success of the project, especially the engagement of the sponsor. The advantages to the Trustees are obvious, and the compelling case for the employer is the additional insight to understand and manage the impact of pension scheme leverage on the business, as well as the opportunity to develop solutions which are more likely to be mutually acceptable.
2.8. Cost and efficiency and proportionality: Although the IRM actions above may suggest a significant additional cost to the scheme, in practice this does not have to be the case because.
2.8.1. For a well-run pension scheme, many of the IRM steps should already be in place, albeit on an informal or stand-alone basis. For example, views on risk appetite may already be reflected in existing contingency plans and triggers, though not otherwise documented. The IRM exercise may therefore consist mainly of addressing any gaps (e.g. consistency of scenario modelling between advisers) and documenting the existing processes and principles more systematically.
2.8.2. A thorough IRM framework should establish the key principles around risk taking, acceptable risk thresholds and agreed actions, which would go a long way towards providing a steer for the formal valuation and investment strategy review, thereby reducing the costs for these subsequent exercises. For example, a clear articulation of a long-term funding and investment plan for the scheme, including appropriate ranges for contributions, target asset risk/return and covenant support, could make subsequent funding and investment discussions much more efficient. In the same spirit, the framework could be extended to incorporate the key management information required regularly by the Trustees and employer to monitor developments and implement the agreed plans.
2.8.3. Whilst setting up an holistic governance process may incur some initial costs, in the long run it is likely to be more efficient, especially where multiple advisers are involved, by allowing all risks to be considered in a single framework, in a format most convenient for decision making by the Trustees and employer, whilst avoiding unnecessary duplication. In some cases, the existing committee structure may also be simplified as a result.
2.8.4. Not all discussions need to involve all parties attending in person. A typical IRM project may consist of regular teleconferences to maintain momentum, and a series of short meetings broadly in line with the above milestones, aligned where possible with other meetings for efficiency.
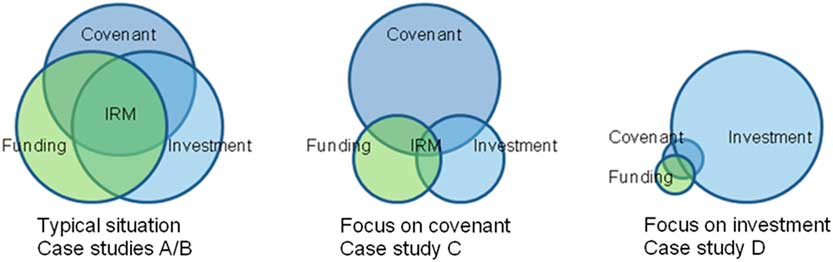
2.8.5. IRM should help identify the relative value of work in the funding, covenant and investment areas and the allocating of budget to each. The balance of work should differ between schemes and it may be desirable to push back against existing high-budget items “because we’ve always spent most there” or “because there are more detailed legislative requirements here”. For example, in the context of the case studies in this paper, the emphasis may be illustrated graphically in Figure 2.
Areas of focus of case studies; IRM, integrated risk management
2.9. Documentation: IRM is synonymous with good management. Documenting essential aspects of the IRM framework should not be viewed as an additional burden and lack of it may be seen by some as a sign of poor governance. The documentation does not have to be onerous, nor does it need to repeat what may already be in other documents of the scheme.
It should ideally serve the dual purpose of providing reference points for all those involved in the management of the scheme, as well as complying with good practice of demonstrating to third parties (when necessary) that a robust and workable process was followed within the limits of practical constraints and available knowledge.
The most useful form of documentation is that which provides practical help to Trustees and others involved in running the scheme. This should be set within the parameters agreed between the Trustees and employer, and demonstrate the quality of the decision making. Among other things it should ideally set out:
-
∙ Protocols for joined-up working between the advisers on both sides.
-
∙ Protocols for collaboration between Trustees and employer.
-
∙ The scheme objectives, the principles which define them at the practical level and the strategies agreed to achieve them.
-
∙ Risk governance guidelines, for example, approval processes for models and assumptions.
-
∙ The key principles around risk taking, acceptable risk thresholds, agreed actions and contingency plans.
-
∙ Management information and analyses to be made available at regular intervals, and responsibilities for producing them.
-
∙ Roles and responsibilities of expert specific groups, for example, investment and risk committees.
2.10. Use of tools and appropriate technology: Use of tools which combine various inputs and metrics to provide a “big picture” view can be very helpful for Trustees when developing, testing and then monitoring their strategy and risk management processes.
Some examples of these tools are given in section 3 and their practical applications are explored in the case studies which form the bulk of this paper.
It is important to recognise, however, that risk means different things to different stakeholders. Risk information in software tools, dashboards and other management information must therefore be adapted to suit the risk language of the stakeholders, and often this may mean that advisers have to present the same information in different ways to suit multiple stakeholders.
3. The Toolkit
3.1. During the course of our work, we identified and considered many tools that could be used by actuaries in order to assist their clients in implementing a successful IRM framework. There are, however, some important considerations to make when deciding on a set of tools to use for this process:
-
– Proportionality: smaller schemes may not have the budget to carry out bespoke modelling using all the tools discussed below. That said, with appropriate use of technology, modelling does not need to be prohibitively expensive and the use of these tools is no longer as costly as it may once have been. Getting IRM right is critical to improving pension scheme management and Trustees would do well to consider areas where they can conserve cost in order that spend might be redirected to designing and implementing a suitable IRM process for their schemes.
-
– Tools are just that and the precise tools or combination of tools used is of secondary importance to the process itself: There is a temptation with IRM to “solve” the funding/investment/covenant equation but this often is not realistic, given the degree of volatility and uncertainty around each of these factors within many DB schemes in the current environment. The tools used should help to inform the process but the real value is in the process itself and the greater understanding, monitoring capability and enhanced decision making which it enables.
3.2. A summary of the tools we have come across and considered in the case studies is set out in the Table 1. This list is, of course, not exhaustive.
Tools Used in Integrated Risk Management (IRM)
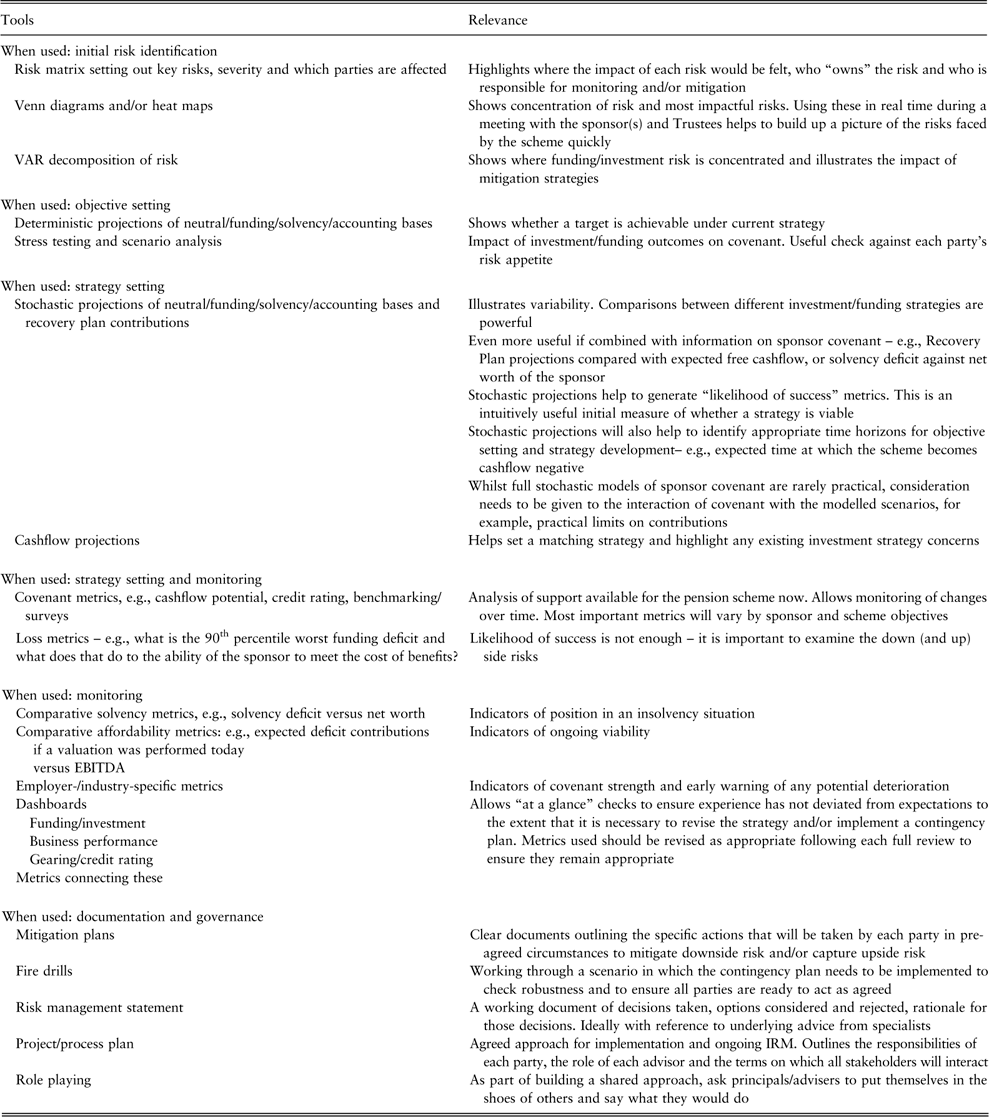
EBITDA, earnings before interest tax depreciation and amortisation.
Different advisors – covenant reviewers, actuaries, investment consultants and legal advisors for example – may need to provide input in order to derive the metrics and tools described in Table 1.
It will be important for Trustees to agree a consistent platform, process and methodology for advisors to share and/or “post” information, in order that it can be collated in a useable form. It is also important to minimise time spent reconciling different models that achieve a similar purpose, in favour of more added value activities.
4. Introduction to Case Studies
4.1. The four case studies address diverse issues using a range of tools, processes, analysis and levels of engagement to provide insights for managing risks in an integrated way.
4.2. The issues addressed and broad conclusions can be summarised in Table 2.
List of case studies
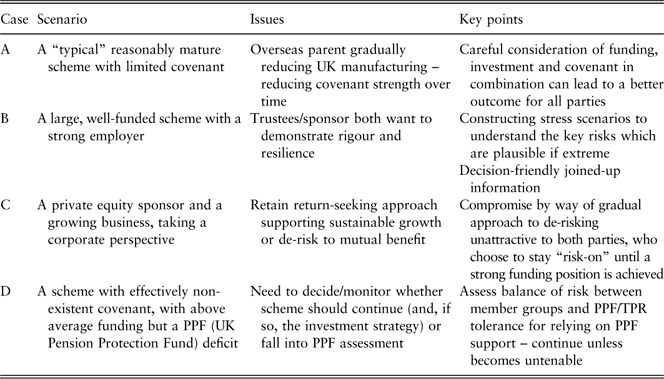
4.3. Our aim is to support actuaries, building on the TPR trustee guidance by providing some worked examples. They are intended to be educational and influential but note they are the Working Party’s views and not “official” TPR/IFoA policy.
4.4. The case studies all have a solution along with consideration of rejected alternatives. We would emphasise that this is not necessarily the best/only solution. However, we thought it important to come up with some sort of solution, even if it is “least bad” rather than in some sense “optimal”.
4.5. We do not pretend the case studies cover all scenarios, although we have tried to cover a wide range. In an individual scheme situation it is likely that a solution would mix and match elements of several case studies, as well as items from the broader toolkit not illustrated here.
4.6. To keep the case studies manageable we have summarised the analysis and process which would be followed at a level of detail appropriate to the paper.
Acknowledgements
The Working Party is grateful to the many individuals and organisations whose comments have helped us in our work.
In particular, the authors would like to thank the following who provided the authors with detailed input in a personal capacity:
-
∙ Deborah Cooper
-
∙ Gareth Connolly
-
∙ Matthew Harrison
-
∙ Patrick Bloomfield
-
∙ Paul Brice
-
∙ Paul Thornton
-
∙ Stuart Faloon
The authors would like to extend especial thanks to Gareth Connolly, who was the original sponsor in his time as Chair of the Pensions Board. He has given us much valuable time and support over the entire length of the project, both in developing the ideas and bringing them to fruition, and also in finding ways to take our work to external audiences in the pensions world.
The authors would also like to thank the staff of the Institute and Faculty of Actuaries, particularly Elvis Gannon, Joanna Robertson and Rebecca Goreham, for their support.
Appendix A: Case Study A
“IRM Basics in Practice”
This first case study considers a pension scheme sponsored by an employer that can afford the contributions it is currently paying, but whose long-term future is in doubt. We see this as fairly typical in the pensions industry today. The case study focusses on the techniques actuaries can use to integrate covenant advice into funding and investment discussions, and deliberately simplifies other aspects.
It is split into two parts – one where the ultimate global parent is not willing to give a guarantee (the main scenario) and one where it is (the alternative scenario). In both scenarios the actuary works with the Trustees on a strategy that takes into account the restrictions of the employer covenant. The alternative scenario provides a better outcome for the Trustees and arguably all parties.
Main scenario
A.1. Situation
Scheme status: Your firm has recently been appointed to provide actuarial, investment and administration advice to the scheme. The scheme is a medium-sized DB pension scheme (assets of £250 million), with an employer in the automotive sector. It closed to new entrants some years ago and to the accrual of new benefits in the last few years.
Long-term viability of sponsor: The Trustees are concerned about the long-term viability of the UK sponsor (UK Ltd.). The wider group is fairly strong, but UK Ltd.’s balance sheet strength and profits have gradually decreased in recent years.
Guarantee requests rejected: The ultimate global parent (Top Co) is a US-based company. It has repeatedly rejected Trustee requests for guarantees in the past. The Trustees have asked UK Ltd. for a secured guarantee, but there are no unencumbered assets available in the UK business.
Relationship with UK Ltd.: The Trustees’ relationship with UK Ltd. is cooperative. Some senior figures from UK Ltd. sit on the Trustee board.
Given their concerns, the Trustees accept your recommendation to appoint a covenant advisor to help them better understand UK Ltd.’s financial position and prospects.
A.2. Covenant advice
The covenant advisor shares the Trustees’ concerns regarding the trend in strength of the employer covenant. In their advice they note:
-
∙ UK Ltd. used to be a highly profitable business in the past, but it has been in decline in recent years. The market that UK Ltd. is in (automotive manufacturing) is mature. Top Co sees the United Kingdom as having a high-cost base and so has moved manufacturing to Eastern European sites. This trend has been in place for some time and shows no sign of reversing.
-
∙ At the moment UK Ltd. is comfortably able to pay its deficit contributions (£5 million pa). Ultimately if required it has the financial flexibility (through ceasing all dividend payments and capital project investment) to increase its contributions to around £12 million pa.
-
∙ However, Top Co has made it clear its intention to relocate the production of UK Ltd.’s most profitable car range in 6 years. Following this, UK Ltd.’s financial flexibility to pay deficit contributions will be significantly reduced, meaning it will have a reduced ability to support investment risk (and other risks) in the scheme.
-
∙ Given the trajectory of UK Ltd. there is a risk that all UK car production of the group could stop in the future.
-
∙ UK Ltd.’s balance sheet is weak – it has a large amount of secured debt – and so the recovery that the pension scheme could expect on insolvency of UK Ltd. would be limited.
Following the covenant advisor’s advice the Trustees conclude that they cannot reasonably rely on the support of UK Ltd. in the long term. For this reason they want to be reasonably sure that they will not require further contributions from UK Ltd. beyond 2030. This date also happens to be around the time when the last deferred member is expected to retire.
A.3. Our brief
In light of the covenant advice, the Trustees have asked us to help them derive a funding and investment strategy designed to get them to a fully de-risked position by 2030. You note that, as the scheme membership is expected to consist of only pensioners by that point, this would put the scheme in a better position to buyout.
A.4. Current position
Current funding position: You have produced a new valuation of the scheme based on the existing investment strategy and Statement of Funding Principles, and shared this with the Trustees. The valuation shows that the scheme is currently 79% funded on the existing scheme-funding basis (i.e. the Trustees’ current target), 97.5% funded on a best estimate basis and 63.5% funded on a solvency basis. The existing investment strategy is to invest 50% of the scheme’s assets in equities and 50% in UK government bonds.
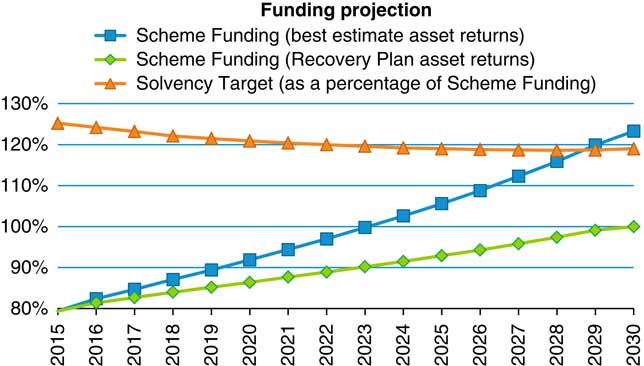
On the existing funding basis, UK Ltd. could keep their contributions at around £5 million pa and still be expected (assuming the prudent investment returns used for the recovery plan) to reach full funding by 2030. You also produced a projection of the scheme’s funding level, shown in Figure A1, which shows that the scheme is expected (assuming best estimate investment returns) to be fully funded on a solvency basis by 2030.
Scheme-funding position over time
A.5. Risk analysis
The Trustees are initially comforted by these results, until you describe the risks that this position entails.
Mismatched investment strategy: The Trustees are significantly invested in equities, which makes their future funding position very volatile. Figure A2 is the same as the one above (rescaled) but also shows the potential variability in funding level over time.
Variability of funding position over time
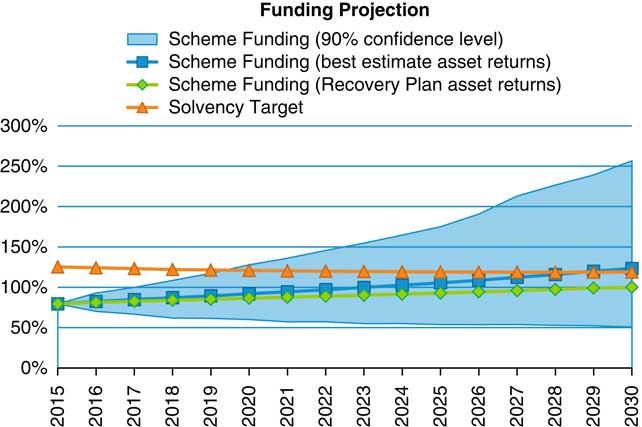
On a best estimate basis the Trustees would expect to reach 104% funded on their solvency basis by 2030 (assuming the contributions required under the illustrated recovery plan are met). However, allowing for the current investment and funding strategy, there is a 5% chance that the funding position could be <42% on the solvency basis by 2030. Further, there is a 20% chance the scheme could be 63% or worse funded on the solvency basis.
Reliance on UK Ltd.: Without additional support from the wider group, there is a good chance of UK Ltd. being unable to fully support the scheme in the future, and potentially become insolvent. Insolvency could happen after 2030, but there is a risk that the covenant deteriorates faster than expected and insolvency occurs before 2030. With the current strategy there is a substantial risk of a large deficit on a solvency basis if insolvency occurs before 2030.
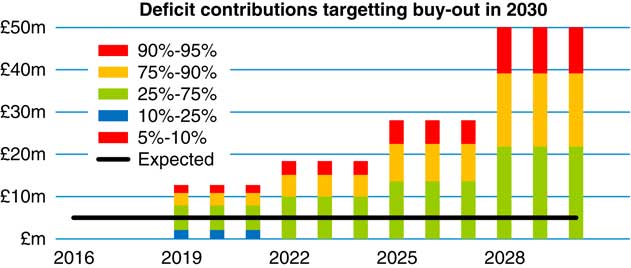
Future deficit contributions: You also, in Figure A3, illustrate future contributions required to achieve full solvency funding by 2030. Whilst you expect £5 million pa to be enough (based on achieving best estimate asset returns), there is a 25% chance that in 6 years contributions will need to double to £10 million pa, which is likely to be unaffordable for UK Ltd.
Deficit contributions targeting buyout in 2030
Scheme maturity: The scheme is a net dis-investor – that is, it is paying out more in benefit payments than it is receiving in contributions from UK Ltd. This is expected to accelerate quite quickly, as can be seen from Figure A4.
Projected cashflows to/from the scheme
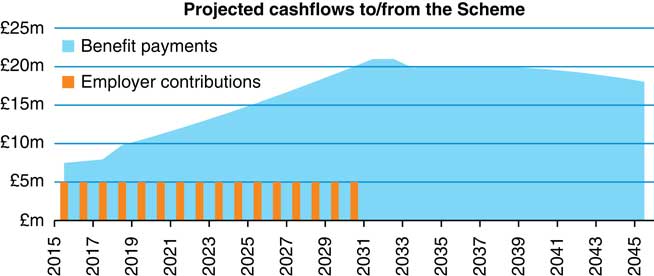
If a scheme is a forced seller of volatile assets (e.g. equities), the timing of any negative equity performance is important. Such a scheme will be in a much better position if this negative performance occurs later in its journey plan compared with sooner. This is because, if that scheme disinvests after poor equity returns, it is crystallising that loss (and there is less time for it to be made up again by future positive returns). This makes the scheme’s financial outcome increasingly sensitive to short-term poor equity performance if the Trustees chose to make disinvestments from equities. The Trustees could make disinvestments from bonds, but this would in effect result in the scheme “re-risking” if this policy was maintained over time, thereby putting more pressure on the covenant.
A.6. Alternative strategies
The Trustees decide that the risks outlined in their current investment/funding strategies are too great, and in light of these decide to consider alternative strategies. They enter into discussions with UK Ltd. about their concerns. UK Ltd. is sympathetic to the Trustees’ views and is keen to ensure that their former employees’ pensions are properly financed. However, UK Ltd. notes that it is under pressure to keep costs down. It acknowledges that it has some scope to increase contributions in the near term, but notes this flexibility is likely to diminish in future.
The Trustees and UK Ltd. ask you to propose some alternative strategies to achieving their objective (of reaching full solvency funding by 2030) with reduced risk, and to compare how effective these strategies are against their existing approach.
Strategy assessment
Based on the Trustees’ objective and the concerns about the future support of UK Ltd., you advise that the following are key metrics that could be used to measure the effectiveness of the investment/funding strategies proposed (Table A1).
Key metrics for Trustees

Options initially considered
You suggest that the Trustees look at the impact of a significant increase in contributions and de-risking on these metrics. You therefore illustrate the following scenarios:
Scenario 1: Increase contributions to £7.5 million pa, which are paid until the scheme is fully funded on the solvency basis.
Scenario 2: Increase contributions to £7.5 million pa and significantly de-risk the scheme’s investments. The Trustees’ current asset allocation is 50% return seeking, 50% risk management, but the Trustees want to look at reducing the return-seeking content to 25% of their assets.
The results of the analysis are presented in Table A2.
Probability of reaching solvency target under different scenarios
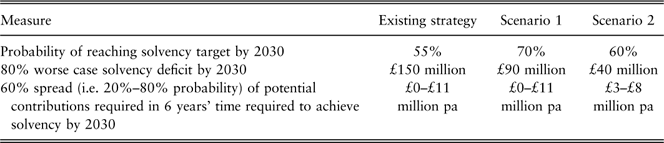
Under the existing strategy there is only a 55% chance that the Trustees will reach their solvency goal by 2030. There is also a one in five chance that the solvency deficit will be at least £150 million by 2030. The alternative strategies both represent improvements on the existing strategies from the Trustees’ perspective due to the increase in contributions, but they each have their downsides and require additional contributions from UK Ltd.
The Trustees need to balance risk with the expectation of better outcomes. For example, scenario 1 may look attractive at first since it has the highest probability of reaching solvency by 2030. However, it is still quite risky – the 80% worst case scenario is that the scheme will still have a large solvency deficit at 2030. Scenario 2 results in a much reduced level of risk, but actually a lower chance of being able to reach full solvency by 2030 (when compared with scenario 1) because of the lower expected returns. Further, both scenarios put pressure on the covenant by increasing contributions to a level that might be unaffordable (in particular after 6 years).
Settlement reached
The Trustees and UK Ltd. discuss the options available at length. UK Ltd. recognises that the existing arrangement is unsustainable – it is particularly concerned about the risk of deficit contributions being much higher in future. As a result it makes a number of concessions to the Trustees – the following settlement is reached.
Step-down contributions: UK Ltd. did not think it would be able to afford the higher level of contributions in the long term. Therefore, an agreement was reached to pay £10 million pa for 6 years and £2 million pa thereafter. This also reduced the risk that the contribution requirements after 6 years would be unaffordable for UK Ltd.
Moderate immediate de-risking plus de-risking triggers: The Trustees decided to de-risk the scheme’s investment strategy to 33% return-seeking assets. In their view this strikes a balance between risk and likelihood of achieving their objective. However, the Trustees also put in place a monitoring framework so that they can de-risk if they find the scheme is ahead of target.
Profit sharing: The schedule of contributions agreed between UK Ltd. and the Trustees included a provision for contributions to increase if dividends were above a specified level.
The Trustees also decide to review their investment strategy more widely to reduce risk without necessarily reducing investment returns. This will consider, for example, diversifying their return-seeking assets further and introducing leveraged liability-driven investment.
Documentation
The Trustees and UK Ltd. document their agreement, and the thought process regarding how it was derived, in a short “integrated strategy document”. This document also includes details of how the Trustees will monitor their position.
A.7. Monitoring framework
Despite the change in strategy, a significant level of risk has been retained, and so you advise the Trustees that they should monitor the progression of their strategy closely. After discussions with the covenant advisor you decide on the following key metrics that the Trustees should monitor (Table A3).
Funding/investment and covenant metrics

Monitoring these metrics over time, and comparing the funding/investment with the covenant metrics will give the Trustees a good idea of how their strategy is progressing. For example, if the expected deficit contributions are increasing at a time when UK Ltd.’s earnings before interest tax depreciation and amortisation (EBITDA) is decreasing then the Trustees should be concerned.
You make the point to the Trustees that these metrics are not perfect measures of ongoing sustainability or what would happen in an insolvency scenario. For example, the net asset measure does not take account of any debt that is superior to the pension scheme. However, they do give the Trustees a good idea of the general trend of how their strategy is progressing.
In producing this framework you also considered a number of other equally valid measures. For measuring ongoing sustainability these included profit before tax or earnings before tax and interest and Technical Provisions deficit or Technical Provision plus a value-at-risk measure.
The Trustees make it clear to UK Ltd. that if these metrics reveal a significant deterioration in circumstances that they may decide to call an emergency valuation and/or request additional funding. After discussions with the Trustees UK Ltd. also agree to the following:
-
∙ Provide semi-annual presentations to the Trustees on the performance of UK Ltd.
-
∙ Requirement to consult with the Trustees on the amount of the dividend paid from UK Ltd. to the wider group, or any other arrangement to remove assets from UK Ltd.
-
∙ Advance notification of any employer-led events that could be of material significance or relevance to the scheme, including redundancy exercises, and decisions on current/future levels of production in the UK.
-
∙ Requirement to discuss any plans to grant additional security over assets of UK Ltd, or any group restructuring that has a significant impact on UK Ltd., with the Trustees before these events happen.
A.8. Conclusion to main scenario
The arrangement reached in this scenario provides a better outcome for the Trustees and potentially for UK Ltd. as well.
Trustees/members: The Trustees have reduced the level of funding and investment risk they are taking whilst maintaining a good chance of meeting their long-term objective. Whilst they have reduced the potential upside of investing in equities, overall this results in better outcomes for the members as UK Ltd. is not able to underwrite the risk of investing such a large amount of assets in equites.
UK Ltd: Although UK Ltd. has increased its immediate cash requirements to the scheme, it has reduced the chance in future of being required to pay deficit contributions that are unaffordable.
Alternative scenario
The following is an alternative scenario where Top Co is willing to provide an unsecured guarantee for the full solvency deficit in exchange for the Trustees retaining a high allocation to risky assets.
A.9. Trustee proposal to Top Co
On your advice the Trustees approach Top Co with an alternative proposal. The Trustees offer to maintain a higher risk investment strategy, and require lower deficit contributions from UK Ltd. in exchange for Top Co providing a guarantee. Top Co considers the proposal and agrees in principle, but they would like the Trustees to come back with a full proposal.
A.10. Revised covenant assessment
You discuss the potential guarantee with the covenant advisor. With the guarantee the covenant is principally from Top Co. The covenant advisor therefore advises the Trustees on the strength of Top Co and makes the following observations:
-
∙ Top Co is at the top of the group structure, and so the Trustees will effectively have access to the assets of the full corporate group.
-
∙ Top Co’s long-term prospects are much better than UK Ltd.’s due to its much wider geographical presence. Whilst the UK automotive manufacturing sector is in decline, Top Co’s businesses elsewhere have been performing well. Having a wide geographical spread also reduces the risk for the Trustees in future through diversification.
-
∙ The covenant advisor produces an estimated outcome statement. This shows that in the event of insolvency of UK Ltd., Top Co would likely be able to afford to pay up to £200 million to the scheme, which comfortably exceeds the current solvency deficit (of £144 million). This analysis takes into account Top Co’s other creditors (both secured and unsecured) and the likely recovery from Top Co’s intangible assets.
-
∙ Although UK Ltd. will continue to pay the deficit contributions, Top Co comfortably has the financial flexibility to do so if required.
In conclusion, the covenant advisor states that he thinks the risk of Top Co going insolvent in the foreseeable future is low. Further, the Trustees can reasonably rely on Top Co meeting the guarantee if it was called upon in the near future. However, given the need for the Trustees to be prudent, he would recommend that the Trustees try to keep the reliance on Top Co to below £180 million.
A.11. Our brief: alternative scenario
The Trustees discuss the covenant advice. They decide they want to maintain a target of being fully de-risked by 2030, but with the guarantee they would be happy to maintain a higher level of investment risk and lower deficit contributions so long as they were reasonably confident that the solvency deficit would stay <£180 million. The Trustees ask you to reconsider your earlier advice in light of this change.
A.12. Revised risk analysis and strategy
Figure A5 shows a projected solvency surplus/deficit under the existing investment strategy and assuming the employer contributions remain at £5 million pa. Based on this chart you advise the Trustees that in the next 15 years it is fairly unlikely that the solvency deficit will exceed £180 million.
Revised solvency surplus/deficit
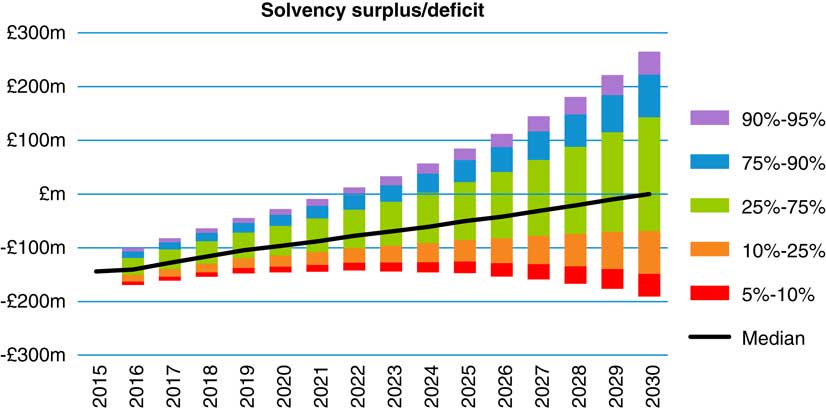
On the basis of this analysis the Trustees are happy to keep the existing investment strategy and contribution structure unchanged for the moment in exchange for a full buyout guarantee from Top Co.
However, the Trustees are concerned that maintaining the current level of investment risk in the long term could result in the solvency deficit increasing substantially. They are also concerned about relying too heavily on the covenant of Top Co, given the potential for this to deteriorate. The Trustees therefore propose the following to Top Co:
-
∙ The allocation to return-seeking investments is maintained for the moment, but the Trustees will de-risk the scheme’s investments if they are ahead of a target to reach full solvency by 2030.
-
∙ The existing £5 million pa contributions from UK Ltd. will be maintained until the solvency deficit is cleared.
The Trustees also require the following conditions be put in place for the guarantee:
-
∙ The guarantee is for the full solvency deficit in the scheme without any cap.
-
∙ It is time unlimited and irrevocable (except at the consent of the Trustee).
-
∙ Top Co must discuss any plans it has that could materially reduce the security provided by the guarantee with the Trustees in a timely manner. For example, a large disposal or increase in dividend, or a significant increase in the amount of its secured debt.
Top Co agreed to the Trustees’ proposal, recognising that whilst the new guarantee does increase their legal exposure to the pension scheme, the quid pro quo is that more cash stays in the business, which should (hopefully) lead to a more successful business.
A.13. Revised monitoring framework
You also reconsider the monitoring framework that you advised the Trustees adopt in light of this new situation.
The Trustees have maintained a strategy of de-risking their investments in line with a target to reach full solvency by 2030, and so this metric can be maintained. The Trustees should also still monitor the ongoing sustainability of the deficit contributions payable by UK Ltd. However, the Trustees should now monitor both the ability of UK Ltd. and Top Co to pay the full solvency debt.
A.14. Conclusion
The arrangement reached in the alternative scenario is potentially beneficial to all parties:
Trustees/members: The Trustees may be taking more risk in their funding and in their investment strategy, but they have significantly improved the security of members’ benefits though the guarantee.
UK Ltd.: UK Ltd. is able to maintain its current cash requirements to the scheme, which may allow additional capital project investment. The riskier investment strategy increases the risk of greater contributions in future, but if investment returns are in line with expectations then the total amount of deficit contributions will be less than under the more cautious strategy.
Top Co: Top Co now has a more profitable UK business. It has agreed to underwrite the pension scheme’s deficit, which could be seen as a detrimental move for shareholders. However, in reality it may have come under pressure to bail out the UK pension scheme in the event of UK Ltd. failing anyway in order to avoid damage to its brand, which enjoys success in the UK market. In the event that UK Ltd. is more profitable then the shareholders will reap the rewards. The guarantee also generates a reduction in Pension Protection Fund levy, which could become more significant as the UK operation declines.
Appendix B: Case Study B
“Big and Strong Co Pension Scheme”
B.1. Introduction
In this case study, a large, well-funded scheme is backed by a strong sponsor in the utility sector. The scheme is currently fully funded on the technical provisions basis, but the sponsor and Trustees have agreed a plan to reach a higher secondary funding target (SFT) which, over the medium term (10 years), aims to accumulate enough assets in the scheme to meet a self-sufficiency target based on a discount rate of 0.25% pa above gilt yields. Currently the funding level on the SFT is 80%. The risks associated with the funding and investment strategies are considered by the Trustees, sponsors and advisers to be within the sponsor’s capacity to support, and the scheme is considered to be well on its way to achieving its target.
Sufficient budget is available for the Trustees to obtain comprehensive advice across actuarial, investment and covenant areas. Collaboration between Trustees and sponsor is good, all advisers appear to work well with each other, the funding level is strong, and the deficit reduction plan is considered reasonable by both parties.
With the next formal valuation 6 months away, and following TPR’s publication of the guidance on IRM, the Trustees and sponsor are anxious to demonstrate the rigour and resilience of their funding strategy. They have therefore appointed an independent actuary to assess whether the scheme’s risks are being addressed holistically, and whether there is any scope to enhance their decision-making framework and associated governance.
A summary of the key data for the scheme and sponsor, and the analysis of risks from the reports prepared by the scheme’s advisers are set out in sections B.3 and B.4.
Sections B.5 and B.6 set out the main considerations from the IRM assessment by the independent actuary. Note that the actual results of the existing analysis have been largely omitted in this case study, in order to focus on the new insights gleaned from the IRM process.
B.2. Principal findings/suggested actions
This section summarises the principal findings of the independent actuary, and the key actions the Trustees and the sponsor could take to add rigour, resilience and transparency to their decision making.
Even in this somewhat idealised scenario, applying the principles of IRM led to additional insights which should enable Trustees and sponsor to consider their funding and investment strategy decisions in a more robust framework.
The key conclusions from this assessment were that:
-
∙ The existing risk framework and advisory process appear to address funding and investment issues in a comprehensive and robust manner. However, it lacked the specific risk context of the sponsor and its knock-on effects on funding and investment strategies.
-
∙ A robust IRM process should add value via a consideration of the circumstances in which the covenant support dries up, or becomes constrained. It should consider what this does to the pension scheme and its likelihood of achieving its long-term strategic objective within an acceptable timeframe (which of course is further constrained by the maturing scheme demographics and other factors).
-
∙ This would involve considerations of the plausible risks to the business and how the IRM process could capture them, including the knock-on effects on the journey plan and monitoring mechanisms, as well as the role of advisers in informing the process.
-
∙ There were areas where transparency could be improved, and contingency plans to deal with downside scenarios were lacking – an effective IRM process would expect the action to go beyond “a discussion between the trustees and sponsor”.
Some of the specific suggestions to emerge were as follows:
-
∙ The long-term objective to be made more transparent through better documentation and more explicit contingency plans.
-
∙ More transparency around the timeframe to reach the long-term objective.
-
∙ To aid engagement with the sponsor, use of sponsor’s declared key business risks for stress testing the covenant.
-
∙ Some ideas for greater integration between pension scheme risks and the sponsor’s business risks.
-
∙ Recognition in IRM framework that longevity risk will become more significant as scheme matures further and market risks are controlled.
-
∙ Some ideas for more dynamic monitoring mechanisms.
-
∙ Suggestions for directions to advisers for more joined-up advice, with results communicated in a decision-friendly manner.
-
∙ Appointing an IRM Lead to coordinate engagement between the various parties, manage the efforts of the various advisers, join up their output and manage the monitoring process and documentation.
B.3. Sponsor and scheme details
The above is based on the most recent updates of the scheme’s funding position and the sponsor’s financial performance. Also note that the sponsor’s corporate structure has deliberately been kept simple in this example, in order to draw out the other salient features of the case study. See guidance from the Pensions Regulator and the Employer Covenant Working Group on the types of complications to be expected in practice; SFT, secondary funding target
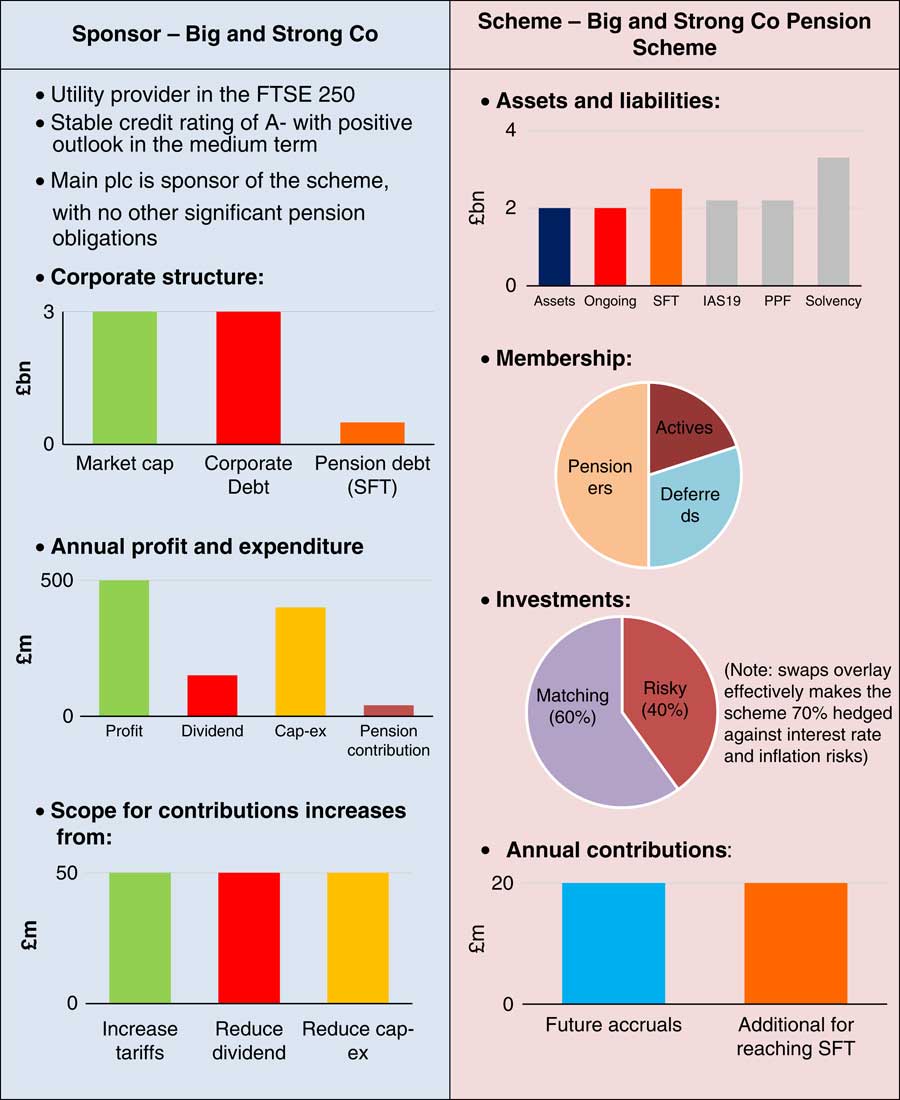
B.4. Existing risk analysis
The Trustees have appointed separate actuarial, investment and covenant advisers. A high-level summary of the risks considered, analysis received and actions taken is set out in Table B1.
Risk analysis
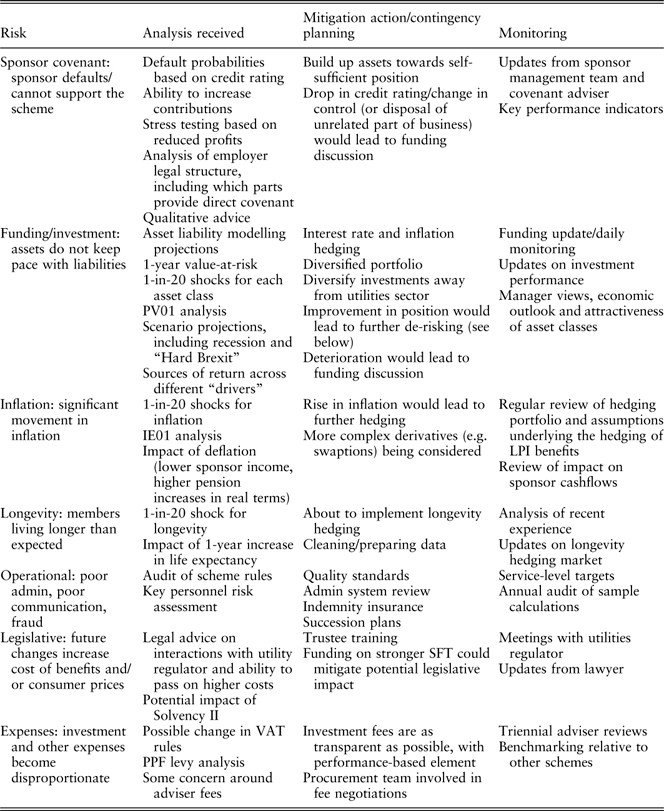
A summary of the main conclusions of the IRM assessment is set out in the following sections.
B.5. Clarity of long-term objective and strategy for achieving it
The scheme is currently fully funded on the technical provisions basis, but the sponsor and Trustees have a joint aim of funding beyond this to a SFT. Over the medium term (10 years), this aims to accumulate enough assets in the scheme to meet a self- sufficiency target based on a discount rate of 0.25% pa above gilt yields. It is accepted that achievement of this target would fall short of the funds required for a full buyout, and implies residual reliance on the employer covenant with which the sponsor and Trustees are comfortable.
The funding level on the SFT basis is currently 80% and the plan is to reach the SFT over 10 years via a combination of contributions at £20 million pa and expected investment returns at 1.75% pa above gilts. (An alternative interpretation is that a little under half of the deficit is proposed to be financed from new contributions, and the remainder from expected investment returns.) The ongoing cost of future accrual is met by further contributions of £20 million each year.
The investment strategy is broadly 60% matching assets and 40% growth assets, with a swaps overlay which effectively hedges 70% of the inflation and interest rate risks. The expected progression of the funding level, as modelled by the scheme actuary, is shown in Figure B2, as well as an analysis of the key risks implicit in the funding plan.
Projection of funding level (secondary funding target basis)
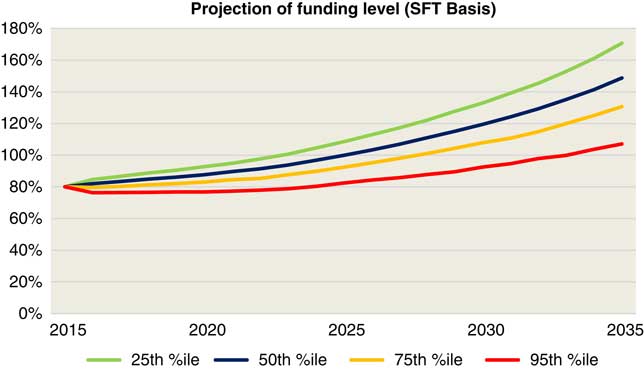
Projection of funding level (SFT basis)
Analysis of key risks to the scheme
An analysis of the main risks to which the scheme is exposed, as illustrated by a 1-in-20 annual shock applied to each of the key parameters in isolation and an overall value-at-risk, is presented in (Table B2).
Key risks to the scheme

In general, the risks associated with the funding and investment strategies are considered by the Trustees, sponsors and advisers to be within the risk capacity and risk appetite of the sponsor, even after allowing for a possible deterioration in the sponsor’s business.
De-risking triggers
In addition, the Trustees monitor the funding level on the SFT measure on a regular basis (daily access to the latest position, with a brief monthly note summarising the key statistics, as well as a detailed quarterly report). A framework is in place setting out the pre-agreed actions (subject to trustee ratification at the time) if the SFT funding level breaches pre-specified triggers as in Table B3.
Funding level triggers
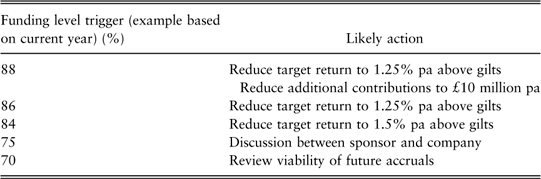
Our assessment of the SFT framework:
-
a. The SFT does not form part of the statutory requirements, and the employer retains flexibility to fall back on technical provisions following adverse experience. This does not appear to be documented anywhere, and so external transparency of such an arrangement may not be as good as expected by third parties. In particular, it is not clear whether the de-risking triggers would be overridden by this proviso and in what circumstances.
-
b. A key factor beyond the commitment of the additional funding is the timeframe for reaching the SFT, as this determines the target investment return and hence the level of investment risk taken each year. The sponsor and Trustees should explicitly consider its preferred course of action in the event that the scheme does not make the expected progress, in particular whether the timeframe should be extended. Any limits on such an extension should also be considered – this should depend, among other things, on the scheme’s demographic maturity and the respective risk appetites of the Trustees and the sponsor, as well as other factors such as the company’s debt re-financing and asset management periods.
The overall conclusion is that the objective is sensible and achievable. However:
-
∙ The analysis of downside risks is on the whole generic, and lacks the specific risk context of the sponsor.
-
∙ There appears to be little explicit contingency planning for downside events other than for “discussions between the employer and trustees to take place”.
-
∙ The analysis does not consider how much flexibility there may be around the 10-year timeframe for reaching the SFT.
-
∙ Longevity risk, whilst slow burning, will become increasingly important as hedging increases and funding improves. Consider an IRM trigger whereby the focus on managing longevity risk is proportionately increased once interest rate hedging exceeds 80%.
The documentation does not provide sufficient clarity to a third party on the circumstances in which SFT would be overridden, and whether and what steps would subsequently be taken to put the scheme back on course again.
B.6. Integrated risk assessment
Although the scheme already receives extensive analysis on its exposure to various risks, the IRM assessment identified a number of further areas for attention, including the need to consider other exposures, to improve engagement between Trustees and sponsor on the significance of the risks, and to make it easier to assess the joined-up impact and set up appropriate monitoring mechanisms.
A. Principal risks to the employer
The risks to the employer had so far been encapsulated in a single stress test which reduced profits by 20%. The correspondence indicated some difficulty in engaging with the employer who considered this level of stress to be harsh given the company’s position in this industry, its recent history of strong and stable profits and in-built protections of being able to operate in a regulated industry. Given that this is key to understanding the employer’s risk capacity and risk appetite, we recommend a different approach based on plausible business scenarios, with which the employer can more readily engage. We notice that, as part of the new FRC risk reporting requirements, the sponsor has already considered a number of such scenarios and identified the following five key risks to its business in its formal reporting:
-
∙ Regulatory change: The Group operates in a regulated market, and a review of pricing and competitiveness is currently being undertaken by the Office of Regulated Industries. The potential outcome and impact on the Group’s profitability and cashflows is not yet clear.
Trustee action: Model reduction in output price in 5 years’ time and potential impact on EBITDA.
-
∙ Input prices: Awayland, a country that is the main supplier of “boson” (a raw material needed for the employer’s business) is currently undergoing a period of political unrest, including a recent attempted military coup. It is unclear what impact this may have on the supply and pricing of boson.
Trustee action: Model impact of higher input prices on the business. Further assume that the Government restricts the ability of the employer to pass on higher costs (either from the higher price of boson and higher pension costs) onto customers, that is, the “natural inflation hedge” within the employer’s business (via the ability to raise prices) is broken.
-
∙ Infrastructure failure: The Group produces its end products through four key strategic plants in the United Kingdom, each operating with hazardous substances. One of the plants was recently subject to attempted terrorist action. The Group has been unable to obtain insurance against terrorist activity for these plants.
Trustee action: Model impact of the failure of one or two of these plants.
-
∙ Industry transformation: The retail market in which the Group operates is subject to significant transformation characterised by fast-growing consumer needs, new technology and competition from agile small-scale distributors. Failure of the Group to achieve better efficiencies and customer service could lead to a loss of market share and increased pressure on overheads.
Trustee action: Refine existing modelling of reduced revenue/profitability to allow for this trend.
-
∙ Funding shortfall: The Group funds re-financing and borrowing by issuing senior bonds and other placements. If these sources of funding become unavailable this could lead to a curtailment of the capital programme, adversely affect the credit rating and ultimately limit the Group’s ability to trade.
Trustee action: refine existing modelling of reduced revenue/profitability to allow for this trend. Note that this scenario is likely to coincide with a rise in interest rates, and an improvement in the funding position, making this less of a problem.
We would suggest that the covenant adviser should be directed to engage with the employer more specifically on these risks, with a view to further prioritise them and to develop appropriate stresses which encapsulate the potential impacts in the long term on the company’s profits and other indicators of its risk appetite.
Following the suggested analysis above, and a consideration by the scheme actuary and investment consultant of any inter-related impact on the funding and investment strategies, the Trustees could further engage with the company. This would be with a view to understanding the extent to which the company’s risk capacity and risk appetite can absorb the potential calls on its business, and the risk management strategy that should be put in place including monitoring systems, triggers/alerts for action and contingency plans.
B. Correlations between pension scheme risks and the sponsor’s business
The analysis from the scheme actuary and investment consultant shows that the key risks to the pension scheme are from economic events, the financial markets and scheme demographics. The existing analysis shows well the potential impacts of the key risks in isolation and relative to each other. However, from an IRM perspective, it is important to recognise that some of these risks also have an impact on the sponsor which needs to be assessed simultaneously. For example:
i. Impact of deflation
The scheme is particularly vulnerable to a deflationary scenario. This is due to a combination of the floor on pension increases within the scheme rules (i.e. pensions cannot be reduced) and a strong inflationary link in the sponsor’s own revenues. The Trustees should therefore consider adding a deflationary environment to its scenario testing analysis, as well as asking the covenant adviser to analyse its possible economic impact on the sponsor’s business. Further analysis to assist with potential mitigating actions against deflation will need to be considered in tandem with actions taken (or proposed) to provide protection against increased inflation.
ii. Impact of increase in interest rates
Likewise, the scheme is not fully hedged against changes in interest rates. In particular, the position would improve if interest rates rise substantially and deteriorate if they fall even further. Although the size of the exposure appears within the tolerance limits of the sponsor, would this necessarily be the case once the impact of the economic event has filtered through to the sponsor’s business – for example, an increase in borrowing costs associated with a rise in interest rates? We therefore recommend that the sponsor consider the impact of both higher and lower yields on their business, including the action they may take to address an increase in scheme deficit should yields remain low or deteriorate further.
iii. Joint scenarios
The earlier analysis shows that, given the strength of the sponsor and the strong funding position, the impact of reasonable stresses in isolation on the key risks is likely to be manageable without endangering the sponsor’s business and the security of members’ benefits. However, a more extreme event, or combination of two or more (correlated or uncorrelated) downside events may lead to more significant problems. A useful exercise would be for the advisers to be directed to consider jointly scenarios that would put the covenant under strain at the same time as affecting adversely the scheme’s funding position. Illustrative examples may be:
-
∙ Yields remaining low or falling further, members living three years longer than expected, and new technology making a significant part of the sponsor’s business obsolete.
-
∙ A rapid reversion of gilt yields accompanied by an increase in inflation, at a time when a large proportion of the sponsor’s debt needs re-financing and the utilities regulator has applied a cap on increases in customer tariffs.
-
∙ A material financial market movement, such as a yield fall, coupled with a material revision to longevity projection models or changes to the market price for longevity risk transfer.
The aim is not to go through each possible extreme event or combination of events – the sponsor’s risk register and/or viability statement should provide suitable focus to test the robustness of the long-term strategy and highlight the need for further contingency planning.
C. Monitoring mechanisms
The principal monitoring mechanisms which lead to specific funding-related actions are the existing de-risking triggers. These are designed on the principle of the sharing of risks (both on the upside and downside) between the sponsor and Trustees, such that a significant improvement in the funding level would lead to further de-risking as well as a partial reduction in contributions. This principle is consistent with an integrated risk framework in that:
-
∙ The sharing of upside enables the sponsor to commit to the framework.
-
∙ In the event that good progress is made towards the path to full SFT funding, some of the upside is retained within the scheme to provide a cushion against future adverse outcomes.
-
∙ Further support is provided in downside scenarios, to alleviate trustee concerns.
However, the existing triggers, being linked to funding levels alone, could have unintended consequences when other factors not directly linked to funding levels also change. We therefore suggest making the triggers more dynamic through the inclusion of additional monitoring mechanisms for covenant and investment risks and opportunities. The value of these triggers would be in the management discipline they provide as observed trends get progressively worse (or better).
Some ideas for the Trustees and sponsor to consider, consistently with the risk-sharing principle of the current triggers, and within a wider dashboard of health indicators to monitor are as follows:
i. Triggers linked directly to market conditions
-
∙ Based on movements in gilt yield levels (or similar), such that a significant rise in yields would result in further de-risking and/or a partial reduction in the additional contributions paid by the sponsor.
-
∙ Based on market opportunities and relative attractiveness of suitable asset classes.
ii. Triggers related to the sponsor covenant
In the short term, there is a very low risk of the sponsor being unable to meaningfully support the scheme. The pension scheme has some protection in the event of a corporate restructure and/or sale of parts of the business, and the SFT deficit is underwritten by stable sponsor cashflows (equating to less than 2 years’ profits). The Trustees and sponsor have a collaborative relationship, and there is a regular flow of information to enable the monitoring of the sponsor covenant.
Given that the SFT relies on £20 million pa of contributions in excess of those necessary to satisfy the statutory funding objective, we recommend that the Trustees clarify with the sponsor the circumstances in which these may cease and consider incorporating further metrics to provide an early warning. Possible metrics may include total scheme contributions as a percentage of free cashflow or other measures of company performance.
iii. Triggers related to the sponsor covenant and benefit security
The current “downside” funding level triggers recognise that the likely solutions to address a worsening in the funding position would depend on the circumstances behind the deterioration and how the sponsor’s business has been affected at the same time.
An extension of this would be to focus more directly on the scenario of greatest concern in the context of protecting benefit security, namely a simultaneous deterioration for the scheme and sponsor. For example, the covenant adviser has indicated further contributions of £150 million pa may be available through a combination of increasing tariffs and reducing dividends/capital expenditure. This would be capable of eliminating the additional deficit from, for example, a one in 20 VaR event over 3–5 years – something which the Trustees and employer recognise as being implicit in their current plans. Annual monitoring of this ratio could form the basis of further affordability triggers. The result would be that, ultimately, an increase beyond (say) 8–10 years would call for a more fundamental review of the scheme objectives, funding and investment strategies. It would also lead to considerations about the changing financial dynamics of the scheme due to its demographic maturity at the time, and a re-consideration of priorities regarding the application of available covenant towards the creation of new pension liabilities or payment of existing liabilities.
D. Communication of risk information
Much of the risk information coming from the advisers is based on the output from models which may not be transparent, expressed as absolute numbers or couched in technical language. From the correspondence made available to us, it appeared that this made it more difficult for Trustees and the employer to follow through the impacts in the language of their own decision frameworks. We therefore have the following advice for the Trustees and sponsor in relation to the instructions they might give to their advisers to present their outputs in a more decision-friendly manner and liaise with each other as necessary.
i. In relation to models and assumptions used by advisers
We note that the actuarial and investment advisers rely on their respective economic models in preparing their individual pieces of advice, and that the covenant adviser’s stress tests incorporate an element of stress from changes in economic conditions. The Trustees should question the extent to which the use of multiple models may result in inconsistent output and duplication of work. At the least, advisers should be asked to liaise with each other to ensure consistency between the key model assumptions and the assumptions driving particular scenarios, in order to enable a consistent joining-up of their respective output. (Note that this is not an argument against multiple advisers, but in favour of efficiency and ease of decision making.)
ii. In relation to the value-at-risk analysis:
-
∙ Ask the advisers to jointly work out a way of making an explicit link between the value-at-risk and the sponsor’s ability to withstand that level of risk. For example, by reference to the sponsor’s ability to pay additional contributions given that the economic stresses implicit in the VaR scenarios may also have a simultaneous impact on the sponsor’s business.
-
∙ Consider whether the value-at-risk assessed over a longer time period (given the long-term nature of the scheme’s liabilities and objective), or at a different security level, would lead to the same conclusion.
-
∙ Would other measures of downside risk, such as expected loss, lead to similar conclusions?
iii. More generally, express the risk metrics in the context of the scheme’s objectives.
For example, the value-at-risk or the increase in deficit following a 1-in-20 shock can be put in the context of the following:
-
∙ A delay of n years in the time to reaching full SFT funding.
-
∙ An increase in contributions of £X million pa or Y% of the sponsor’s profits.
E. Documentation
As a matter of good practice we would recommend some form of documentation to record the process followed, the decisions and actions taken by the Trustees and the sponsor, the analysis and advice which supported such decisions, the judgements made and how the agreed strategy is to be implemented.
Our suggestion is for a document (most likely one linked to other key documents of the scheme) which will serve as a practical management tool for both Trustees and sponsor. It would set out a clear overview of the agreed strategy, the agreed parameters within which it should be implemented in practice, the monitoring mechanisms and metrics, and the frequency of monitoring. It would also discuss the actions that can be expected, including implementation of contingency plans, and the protocols for engagement between advisers on both sides (including conflict management).
F. Governance
Finally, we would suggest the sponsor and Trustees should consider appointing an IRM Lead to coordinate engagement between the various parties, to manage the efforts of the various advisers and to join up their advice, and manage the monitoring process and documentation. Possible candidates to carry out this role effectively are likely to have a finance and/or risk management background, and could include the pension manager, treasurer, a trustee or an external adviser.
Appendix C: Case Study C
“Vigorous Co Pension Scheme”
C.1. Summary
The third case study concerns a medium-sized frozen scheme sponsored by a successful business in the hi-tech aerospace engineering sector. The sponsor has been through multiple changes of ownership and is now owned by a private equity (PE) group seeking to exploit its growth prospects.
It highlights a common situation where the employer is strong and well able to support the scheme, and indeed could fully fund and de-risk it if so required. However, it chooses not to do so, preferring instead to use its negotiating position and the arguments for “sustainable growth” to the full.
The key tension is around the extent to which investment returns continue to be sought in lieu of higher cash contributions so as to free up cash for investment in the business and meet the investors’ expectations for return.
The current approach has been driven by acquisition advice received by the sponsor’s owner and focusses on achieving full funding through minimised cash contributions and favourable investment performance.
The case study is set in March 2016, and looks at the IRM issues from the perspective of a sponsor wishing to respond in a constructive way to the IRM requirements whilst retaining its strong negotiating position, recognising that the Trustees have some concern that they may need to take a more active approach at the upcoming 2016 valuation, but also that it would prefer to manage risk rather than reduce it per se.
The principles of IRM are used to develop a more sophisticated approach to objectives and develop a practical, sponsor-led way forward.
The key conclusions are:
-
1. If the Trustees are to allow a risk-on position to continue, they will need to have some comfort that the company would support them in subsequent de-risking if the current safety margins were threatened, before it is too late.
-
2. The sponsor needs to be comfortable that the benefits from this strategy outweigh the risks associated with the scheme being a barrier to exit on attractive terms since a poor exit outcome could more than offset any gain from a high dividend flow.
-
3. In doing so both parties will have to be persuaded to accept that support for the sustainable growth of the business is a reasonable price to pay for the residual risk that the position could not be recovered in time in the event of adverse experience.
-
4. Most adverse scenarios would be driven by adverse sponsor commercial experience. In such circumstances, increased underfunding could be an exacerbating factor and there is a role for investment strategies which mitigate, at least to an extent, this risk.
-
5. These issues are addressed by staying “risk-on” and cancelling a future DRC (deficit reduction contributions) step-up, but with limitations on covenant leakage in downside scenarios so that the current risk-on strategy can be maintained and the necessary monitoring to ensure this happens.
-
6. Both parties would benefit from a clear idea of when de-risking would occur if the investment and/or business strategy was successful ahead of plan – if “painless” de-risking becomes possible it would be inexcusable not to take it.
-
7. A classic compromise by way of a planned gradual approach to de-risking is unlikely to be attractive to either party – it makes more sense either to de-risk substantially in the short term or define future conditions where this would be attractive and stay “risk-on” until then.
-
8. Liability management on fair terms could be beneficial to all parties.
-
9. The advisers need to support efficient integration and governance rather than work in silos.
It is recognised that from a trustee perspective the solution is quite weak, and the protections they have gained are limited and may not hold in all circumstances. This should be seen as a balance to the other case studies where a more “trustee-friendly” solution evolves, reflecting the range of solutions found in practice.
C.2. Introducing the sponsor and scheme
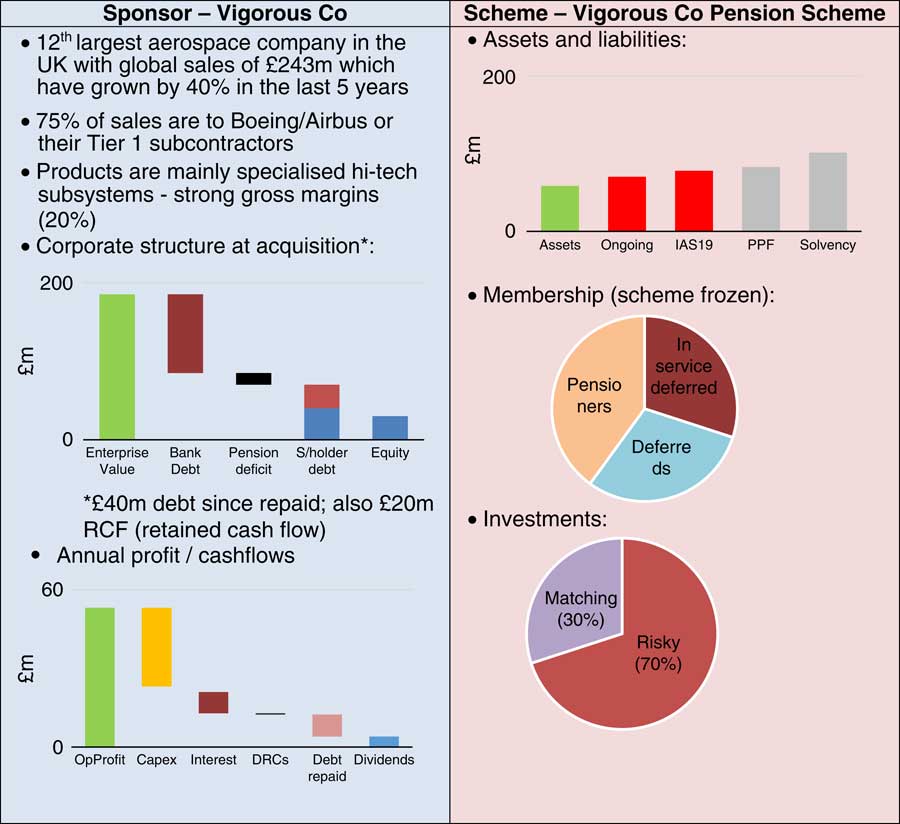
Key financial metrics are summarised in Figure C1.
Financial metrics
C.3. The sponsor’s review process
The sponsor applies the following process to develop its IRM policy:
-
1. Develop an appropriate process for the review which meets the advice and governance needs of sponsor and TrusteesFootnote 2 as well as being efficient in time and cost terms.
-
2. Understand the issues which are likely to drive the Trustees’ approach to the issue, in order to be proactive rather than reactive to their requirements, starting from an analysis of key financial ratios for the scheme, the sponsor and the relationship between the two.
-
3. Identify (from other work) the key risks to the health of the sponsorFootnote 3 and assess the consequences for the pension scheme and in turn the demands it makes on the sponsor.
-
4. Articulate the current objectives of the pension scheme’s finances in IRM terms.
-
5. Conduct an assessment of the current objectives in light of the appropriate risk assessment techniques.
-
6. Modify and/or increment the objectives in the light of the analysis.
-
7. Develop contingency planning with a level of detail and commitment appropriate to the risks and the approach being taken.
-
8. Document the broad rationale for the decisions taken.
-
9. Identify appropriate monitoring metrics and develop a joint process with the Trustees to carry out monitoring and respond to unanticipated developments.
-
10. Adjust governance arrangements as necessary in light of the review.
The case study follows broadly this sequence, but the process is to some extent iterative and should be adjusted as necessary to achieve a satisfactory outcome.
C.4. Assessment of likely trustee concerns
The sponsor’s advisers have sought to understand the Trustees’ likely perspective through considering some preliminary directional covenant metrics based on the generic tool in Figure C2. This has three key elements:
-
1. Derive some standard ratios for the business.
-
2. Look at how sensitive the conclusions are to the inputs, and what stresses might lead to different high-level conclusions.
-
3. Sense check against “softer” considerations and the specifics of the business.
Initial covenant metrics; EBITDA, earnings before interest tax depreciation and amortisation. The latter two stages are key – experience suggest that evidence will often emerge that the result of a “rule of thumb” analysis by reference to standard metrics only will be at best incomplete and at worst downright misleading. However, the process of establishing whether the metrics are helpful and, if not, why not, is very illuminating

These metrics are applicable to any covenant, with analysis for this scheme shown by way of example. The latter two stages are key – experience suggest that evidence will often emerge that the result of a “rule of thumb” analysis by reference to standard metrics only will be at best incomplete and at worst downright misleading. However, the process of establishing whether the metrics are helpful and, if not, why not, is very illuminating.
The conclusions for this scheme are:
-
∙ Indicative sponsor value – £250 million.
-
∙ Scheme/sponsor size ratio – ~0.3.
-
o This a favourable score highlighting that the scheme should not be a major issue for the sponsor (but the reverse may not be true).
-
-
∙ Net debt/EBITDA – ~2.0.
-
o This is a material debt loading but not one which would be considered heavy, especially for a private firm.
-
-
∙ Likely direction of covenant assessment.
-
o These parameters would suggest a medium-to-strong covenant rating.
-
o No contraindications to this conclusion have emerged (although more work would be needed to be sure).
-
o It would take significant changes in the parameters to change this rating.
-
-
∙ Indication of a covenant stress event.
-
o 20% fall in turnover with only 10% fall in costs illustrated as an example of a stress scenario. Note that still within banking covenant at this point.
The Trustees are of course likely to obtain their own more detailed and deeper covenant advice which may not reach the same conclusion and/or may raise different issues. For example, their analysis may include further analysis of the risks set out in section C.5 below:
-
-
∙ Forward looking assessment of the industry.
-
∙ Identification of the legal obligations.
-
∙ Consideration of the employer’s ability to generate cash:
-
o Immediately (availability of liquid assets/finance);
-
o in the short–to-medium term (trading/cashflow analysis);
-
o in the longer term (market analysis); and
-
o in the event of distress (structural priority and/or insolvency analysis).
-
-
∙ Sensitivity analysis around the business plans.
A full list of issues to be considered in a covenant analysis is provided in the paper “Principles of covenant assessment for scheme valuations” published by the Employer Covenant Working Group (2016).
The Trustees consider that the PPF levy can provide them with downside protection at a cost below that which the market would require, and are content for the employer to benefit provided:
-
∙ It pays the levy.
-
∙ Actions taken are within the bounds of what appears to be generally accepted by TPR (which their legal advisers agree is a reasonable test).
In doing so they choose to reject the risks associated with the potential for the PPF to become insolvent or to reduce benefits in future. They take the view that given the substantial gap between promised benefits and typical PPF compensation it would not be politically tenable for benefits to further reduce and government support would be provided in extremis.
C.5. Current risk analysis – corporate
Figures C3–C7 provide more detailed analyses of the finances of sponsor and scheme, as well as the impact of standardised stresses for both parties on the results. In line with PE practice vigorous cost control is important to the business, even for relatively small amounts (such as the DRCs).
Sponsor key data – balance sheet. The stresses have been chosen to be meaningful for this particular situation, not as generic tests
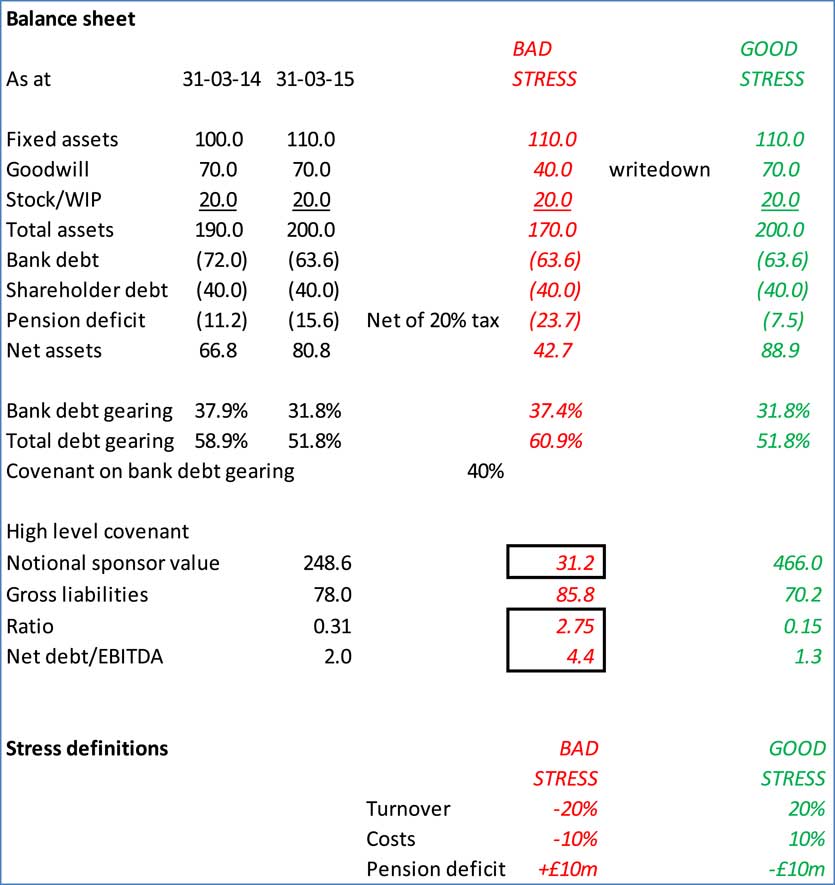
Sponsor key data – profit and loss/cashflow
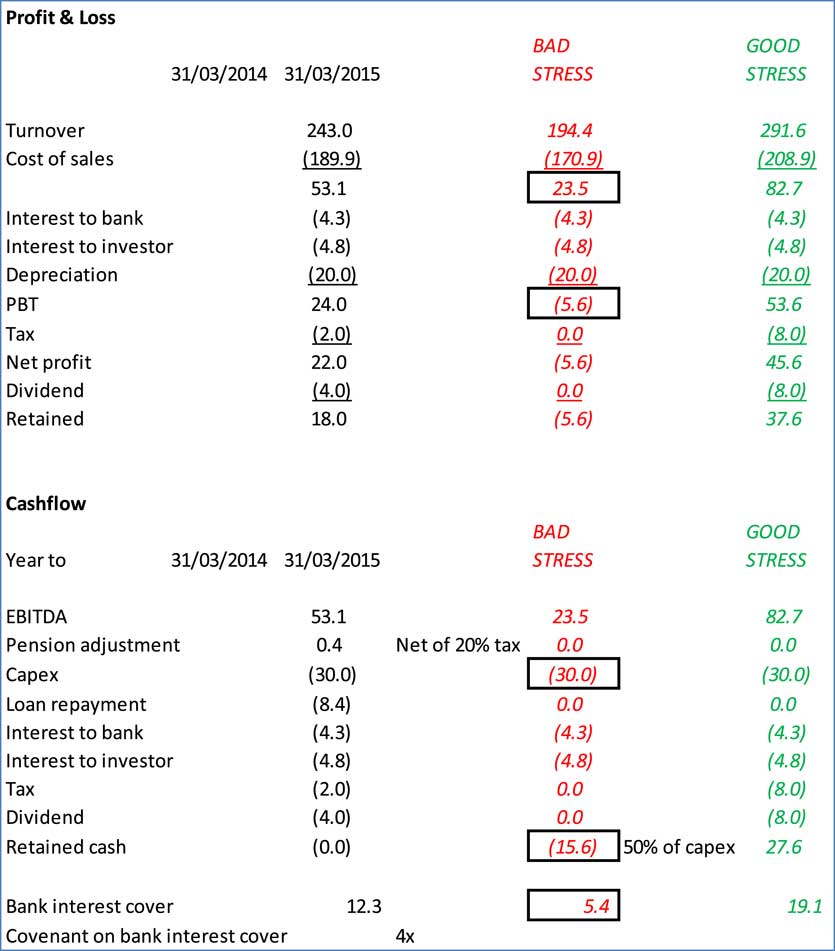
scheme key data – funding balance sheets. The 2013 valuation disclosed a deficit of £10 million (equating to 83% funding) to be addressed by contributions of £500,000 per year increasing to £750,000 per year from 2017 and expected returns of 1% per year above the discount rate (best estimate)
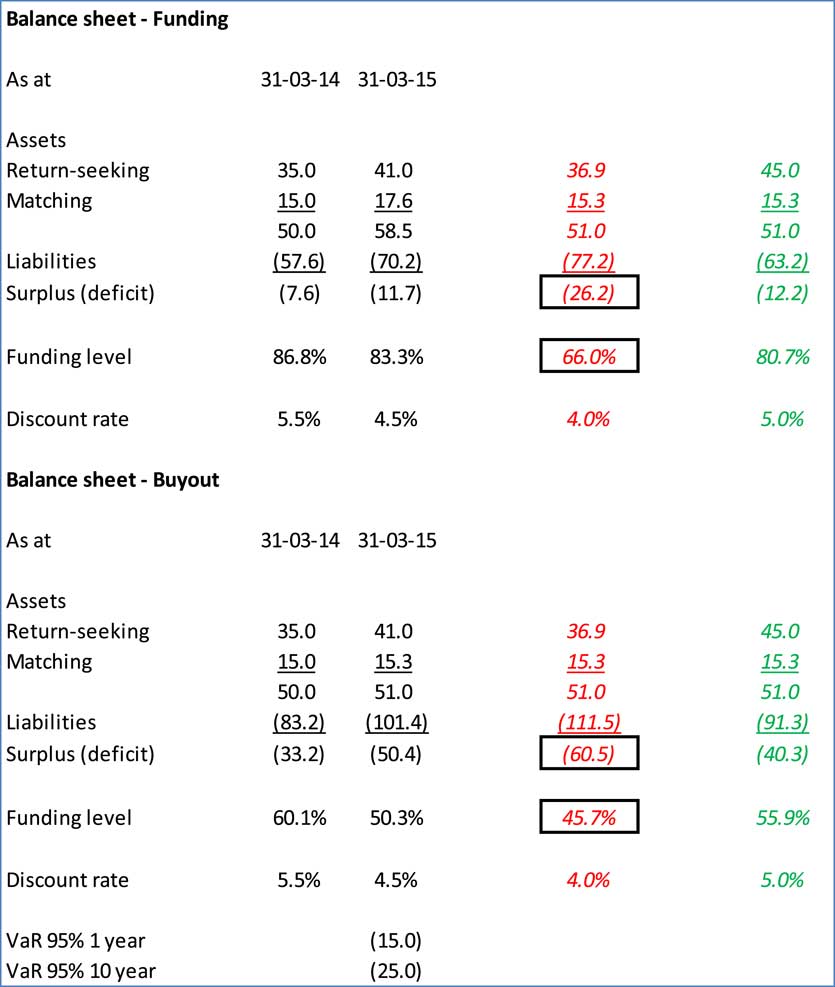
Scheme key data – accounting balance sheets/cashflow/experience
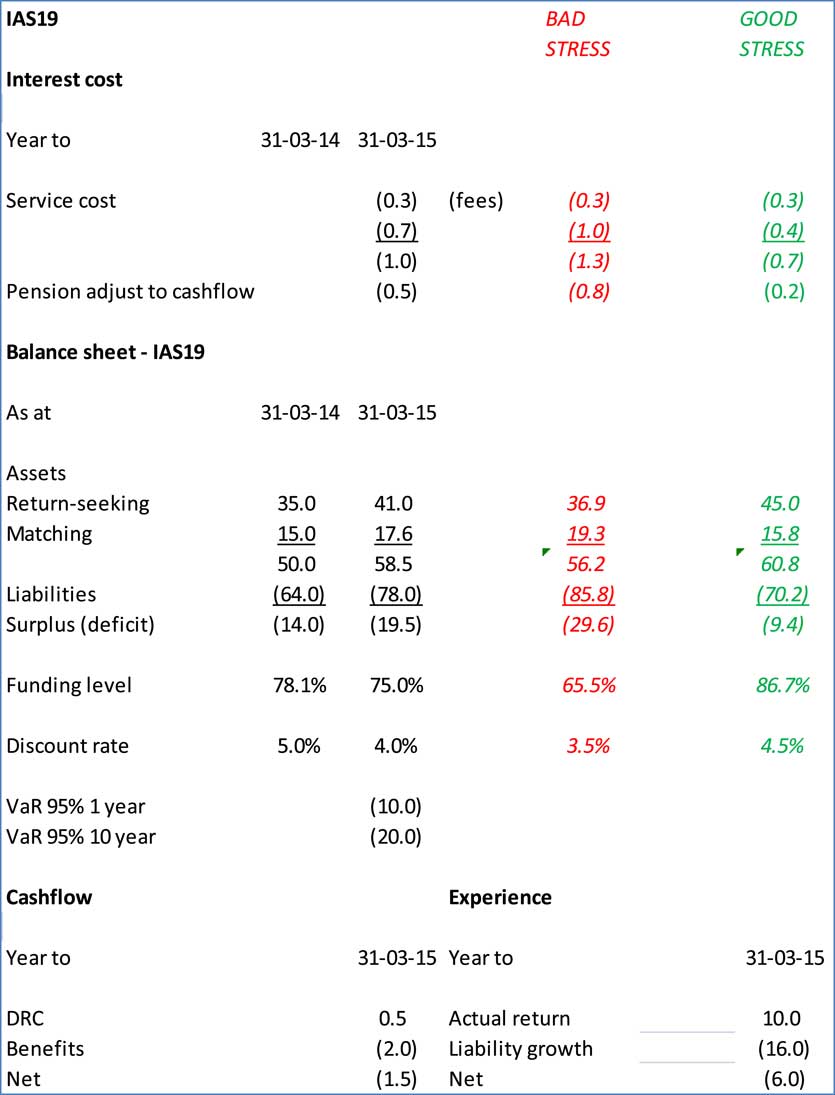
Consolidated balance sheet and metrics
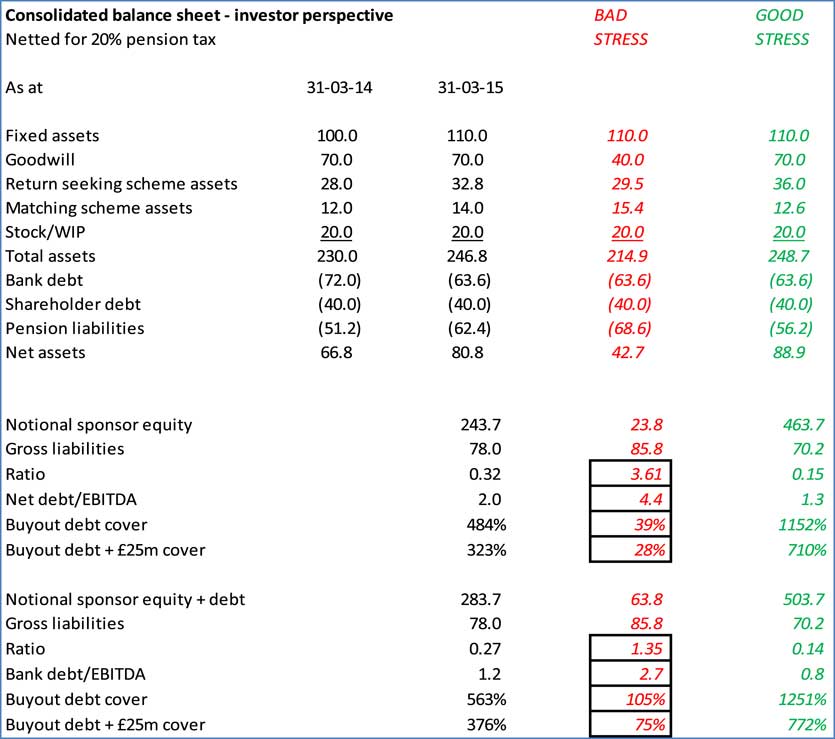
A high-level analysis of the corporate risk issues and pension linkages flowing from this is set out below, in a broadly decreasing order of importance from a business perspective (Table C1).
Analysis of corporate risks and pension linkages

C.6. Conclusions from integrated risk analysis
Given this situation the sponsor’s advisers recommend the following approach be adopted and then put to the Trustees’ advisers for validation and agreement. For the sake of this paper an appropriate compromise outcome is proposed which is compatible with the issues raised in the analysis but is not fully demonstrated from the high-level analysis. In practice this would arise from a significant negotiation with appropriately detailed analysis of each item.
C.7. Scheme objective
Does the scheme’s current objective make sense?
The current approach focusses on minimising cash contributions and delivering full funding through favourable investment performance.
This could be more fully articulated as:
1. Maintain DRCs at the lowest level possible to facilitate capex for sustainable growth and adequate shareholder returns. This is taken to be maintaining current £500,000 pa as long as possible.
2. Seek to close the funding gap by favourable investment performance at the current level of risk, that is, 70% return seeking/£20 million 10-year VaR.
Is the strategy to achieve the objective sound?
Probably, but:
-
∙ The alternative of a much lower pension scheme risk approach should be considered by both sponsor and scheme from time to time.
-
∙ Contingency planning is absent.
Based on the risk assessment, improve by adding the following:
3. Require de-risking substantially (IAS19 matching) in any of the following scenarios:
-
o Covenant cover falls to unacceptable level (equity as calculated <2× buyout debt +£25 million).
-
o Full funding with current level of DRC commitment becomes achievable without increase in DRCs/excessive RP length (IAS19 funding reaches 90%).
-
o EBITDA exceeds current planning by >25% on a sustainable basis.
4. Develop and maintain an efficient governance/management/advice/monitoring regime:
-
o Budget/management time/time to completion of project metrics.
5. Act to de-risk 20% of liabilities on an IAS19-neutral basis through liability management exercise with active support of the Trustees.
Justification for the approach adopted
Continuation of the status quo with no commitments from the sponsor in the event of adverse contingencies would be unacceptable to the Trustees and invite regulatory challenge. Given the scheme is relatively small from the sponsor perspective, regulatory risk in this area is not attractive.
The alternative of more fully funding the scheme and substantially de-risking it would tie up a lot of capital in low return investments without providing a commensurate gain in member security given the existence of the PPF. This is perceived by the sponsor as introducing additional business risks from the need to seek capital to fund sustainable growth of the business from other sources.
Maintenance of some of the legacy benefit complexities is considered to be of dubious value to the members affected. A liability management exercise can address this. However, this must be worthwhile and have significant take-up to justify the costs. The Trustees’ active support should also be sought on the premise that they can be satisfied those accepting the offer are being treated fairly as well as there being a benefit to the sponsor and the security of those members who are excluded from the exercise.
C.8. Integrated risk assessment
The impact of possible investment strategy changes
-
∙ Any reduction in investment risk would almost certainly lead to increased up-front DRCs because of the level of reliance on investment performance embedded in the current recovery plan.
-
∙ However, there appears to be little benefit to either Trustees or sponsor in marginal changes to DRCs/investment strategy:
-
– Negative implications for short-term shareholder return and perception, with little impact on the level of deficit/risk any time soon.
-
– It does not materially change trustee risk, adjusted for PPF protection, unless accompanied by a substantial cash injection or secured commitment.
-
-
∙ A worthwhile strategic change would involve a substantial increase in funding in the near term and de-risking:
-
– The Trustees would gain reliable protection above PPF levels.
-
– The sponsor company would gain realistic reduction in risk/distraction factor; this may allow more risk to be taken elsewhere.
-
Trustees’ likely views
This is a broadly favourable covenant assessment in terms of where it lies in the range of covenant results.
Based on this analysis and sensitivity checking, the Trustees’ key issues are likely to be as follows:
The main risks to the scheme are sponsor experience/behaviour, not the scheme’s own approach to risk
Thus, the trustee will want to understand the sponsor capital structure and drivers for this. In particular, they will want to pay particular attention to credit provided by the PE sponsor and subordination status:
-
∙ More than 50% of purchase funding was in the form of a loan from an offshore entity on which 12% interest payable (compared to 6% on bank finance), rather than equity funding.
-
∙ Tax reasons drove formulating this as debt rather than equity, but from a covenant perspective it can be seen as effectively a minimum £4.8 million dividend.
-
∙ Could expect more flexibility on DRCs if shareholder debt is subordinated to scheme.
The Trustees and their advisers will no doubt raise other issues as part of the process, and these will need to be addressed, but the assessment is that the above are the points on which substantive work will be needed.
Benefit design
There are significant numbers of small deferred pensions and/or benefits structured with complex capped/collared increases. A liability management exercise with terms sufficiently generous to get significant take-up could reduce overall risk/complexity.
Impact of future scheme/business maturity changes
The scheme is actually maturing quite slowly – and will probably not be much more mature in 10 years’ time, whereas at that time the business will likely be under new ownership/unrecognisable.
Correlation risk
The sponsor is in an industry which is very highly exposed to the economic cycles, with the ultimate airline customers having a tendency to fail in times of recession, or at least reduce exposures by cancelling new aircraft orders. This means that falls in equity markets generally are very likely to be associated with covenant problems. Return-seeking assets with lower economic correlations should be preferred.
Mitigating trustee risk if the investment strategy remains unchanged
The Trustees are likely to look for constraints on shareholder return and/or restructuring to cover business downsides unless they are given substantial funding/de-risking up-front:
-
– Ideally offer them commitments to action which might take place anyway, for example, defer shareholder interest if cashflow is poor.
-
– Providing a security structure may offer an alternative to cash/de-risking.
Example contingency plan
-
∙ Contractual agreement to implement the plan in default of agreed alternatives.
-
∙ Trigger at equity value 2× (buyout debt+£25 million).
-
– Current ratio 3.23× (counting shareholder debt as debt).
-
– Current ratio 3.78× (counting shareholder debt as equity).
-
-
∙ Default action on ratio falling to 2×:
-
– Cease dividends.
-
– Restrict shareholder debt service to 0 at 1.5× cover and prorate in between.
-
– Divert balance of debt service to scheme and de-risk on a prorated basis.
-
– The above would mean funding to self-sufficiency in around 6 years’ time based on the current position.
-
– It is also functionally equivalent to the owner funding £5 million of capex – Trustees should support maintenance of capex in this scenario.
-
-
∙ Protections on change of control/restructuring leading to substantial increase in leverage.
A particularly delicate issue in the negotiation would be whether the trigger mechanism is to be contractual, taking into account the following:
-
∙ The trigger would probably apply at a bad time for the sponsor when there are other demands on cash.
-
∙ The Trustees may be de facto unable to implement this, even if contractual, if the consequences were to make the residual risks to the members even worse.
-
∙ A contractual arrangement guarantees the Trustees a place at the negotiating table, but tends to make agreements with other parties (e.g. banks) harder/more complex.
-
∙ “Gentlemen’s agreements” do not tend to survive adversity or a change of owner, but they can influence behaviour in advance and manage expectations.
-
∙ It needs to be accepted that such agreements do not offer full protection against a rapid deterioration of the position leading to a response being implemented “too little too late”, but they do help with a gradual decline scenario where the Trustees are able to say “thus far but no further”.
A helpful incentive for the Trustees to support continued substantial investment in return-seeking assets would be a share of the business upside. If the business performs well, an equity value increase above plan of £100 million+ is entirely possible in a few years. £10–20 million to the Trustees to support de-risking would seem entirely fair as well as allowing the owner to de-risk and crystallise the gain made. In many such scenarios this will correlate to favourable scheme performance anyway so no further contributions will be required.
C.9. Models for assessing risk
Sponsor risk
-
∙ Business performance measurements and plans.
-
∙ Order book analysis.
-
∙ “PESTEL”Footnote 4 analysis – especially review of technological and regulatory issues.
Investment risk assessment
-
∙ Focus on approximate VaR over 10 years in money terms to understand the overall level of investment risk relative to the sponsor capacity.
-
∙ An accurate calculation/debate over the model choice is unnecessary.
-
∙ Important to assess impact of interest/inflation risk from unfunded liabilities as well as impact of investment choice given low funding is likely to be maintained.
-
∙ Consider growth asset investments with low correlation to economic cycles.
Maturity assessment
-
∙ Advisers to estimate the proportion of pensioner liabilities at 5 year future intervals:
-
∙ Best estimate projection of when benefit outgo will exceed:
-
o [Contribution income] (already passed).
-
o Contributions + debt asset income.
-
o Contributions + all asset income.
-
C.10. Triggers and monitoring metrics
A set of monitoring metrics has been developed from the analytic work. The aim of this is:
-
∙ To identify material divergences from plan which may indicate a need for review
-
∙ More specifically, to identify whether conditions have changed such that the contingency plan either has been triggered or seems likely to be triggered before the next planned review.
The metrics should flow naturally from the analysis underlying the strategy and material produced for other purposes, for example, the updates provided to the banks. Five to six “focus” metrics are selected, with others reported at the same time on the basis that they may help give colour to the focus metrics and are likely outputs from the process of creating them.
Ideally focus metrics should capture the interactions between underlying risks so that they avoid attention to events which are benign in aggregate but of concern individually, whilst capturing adverse events which combine to give an overall concern. Most of these affect the relativity between sponsor and scheme, rather than effects on one or the other.
Warning levels are designed to trigger further work before the contingency plan is actually triggered. Generally they should be set not to trigger until a significant change relative to expectations has occurred but in good time to take considered action if the changes are of a gradual rather than “emergency” nature. It is not generally appropriate to be highly scientific about this, since it is the interaction of multiple metrics on a “balanced scorecard” basis which should drive action.
Part of the monitoring process should be to consider whether the warning levels and/or responses to events remain fit for purpose – IRM is a dynamic process and even the best plan does not survive contact with reality without amendment from time to time. A particular focus should be on the intended exit strategy for the sponsor as it develops and whether this is compatible with the approach for managing the pension scheme (Table C2).
Monitoring metrics
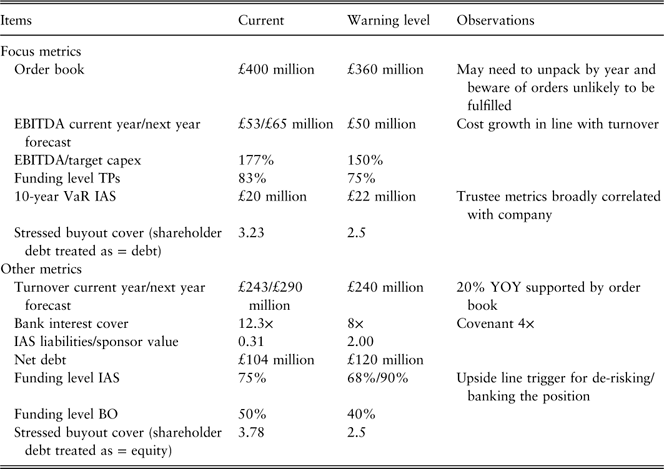
C.11. Other actions: process/hygiene
Professional trusteeship
A part of the previous sale an independent chair was appointed. This should be continued as it provides the sponsor with:
-
∙ The knowledge that it can have an informed and professional discussion.
-
∙ Insurance against possible criticism of unmanaged conflicts from members or regulators.
-
∙ A trustee board positioned to efficiently conduct negotiations which may be needed when the business is sold.
Joint scenario planning/exploration
-
∙ It is essential for a collaborative approach to be developed amongst the various advisers (including between advisers to each party, not just sponsor versus trustee).
-
∙ The sponsor should arrange a joint session with the Trustees and all advisers to go through various “what-if” scenarios for scheme and sponsor to explore what might happen/what would be reasonable expectations of each other.
-
∙ This could, for example, be done via role play, with the two parties swapping roles?
Ensure Trustees operate efficient investment strategies and maintain good control over advice costs
-
∙ The sponsor should ask the Trustees to explicitly instruct their advisers to use the corporate approach as a base on the premise it is likely better developed/funded and less likely to lead to disputes.
-
∙ The sponsor and Trustees should also drive better cost effectiveness of their analysis and monitoring.
-
∙ In this context, “effectiveness” should mean a focus on key issues – it is common for a lot of analysis to produce more heat than light, which is not helpful.
-
∙ A possible solution is for the Trustees to ask their existing advisers to pitch for IRM work on the basis that one of them will have their appointment re-scoped to include this activity whilst the others will be input providers.
-
∙ The scope for the IRM review should be to review the corporate proposal rather than develop the Trustees’ own, but this can include the Trustees’ changes/additions.
Appendix D: Case Study D
“No Sponsor Support Pension Scheme”
D.1. Executive summary
A small but well-funded scheme is sponsored by a company which has ceased trading and where all assets have been disposed of to fund debts – there is therefore no expectation of any further support for the scheme. Cost versus benefit considerations of any advisory work are key, given the size of the scheme and the lack of sponsor support.
-
∙ The Trustees use an IRM framework to clarify the universe of options available to them, set objectives, determine their risk appetite and analyse the risks to which the scheme is exposed.
-
∙ The case study looks at the considerations which need to be made in these somewhat unusual circumstances to set and test an appropriate strategy. This is not intended as a “model” process or as a guide to the “right” outcome in these circumstances – each scheme will be different and therefore the intention is to highlight the issues which would need to be addressed by Trustees and their advisors where there is no expectation of further support from the sponsor.
-
∙ Legal considerations will be important, and there is an addendum which sets out the input received from pensions lawyers whom we consulted during the course of drafting this case study.
D.2. Background
In this case study, a relatively well-funded scheme with c. £20 million of assets is backed by a company which has ceased trading. The expectation is that there is very little chance of any future contributions from the sponsor as all assets have been disposed of to fund debts.
We have assumed that it is possible for the Trustees to continue the scheme on an ongoing basis, and to call in the S75 debt at a time of their choosing (which would trigger the start of a PPF Assessment Period).
D.3. Introducing the sponsor and scheme
The sponsor and the scheme
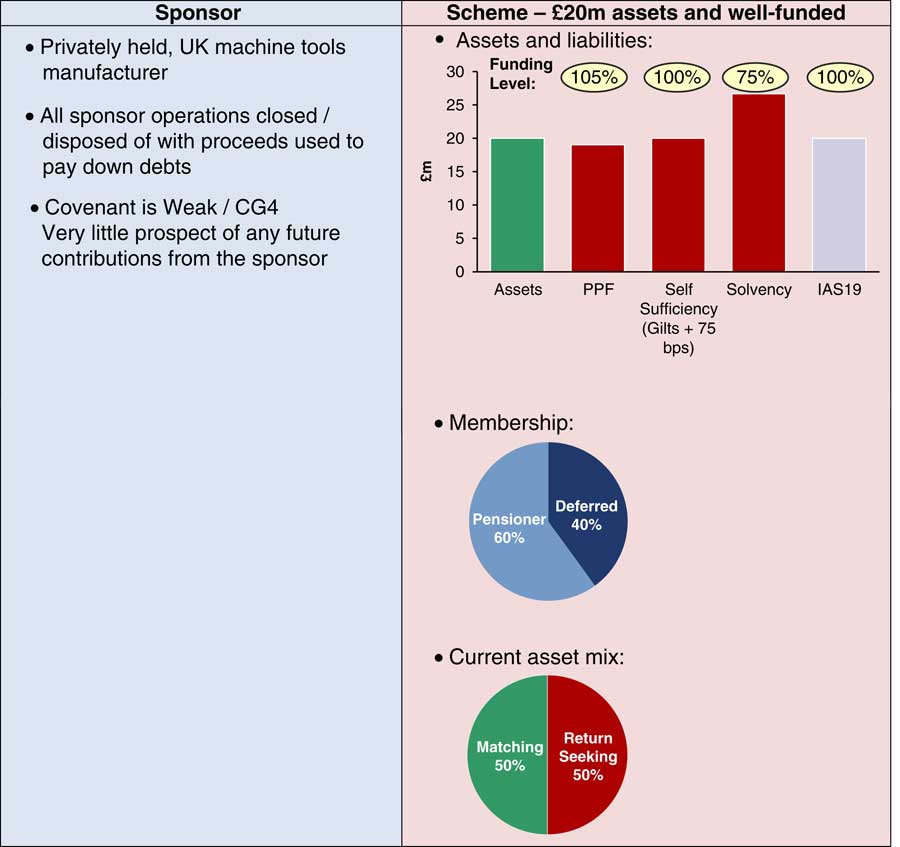
D.4. IRM implementation
Universe of available options
Under an IRM framework, it is important to document not only the decisions which have been taken but also those actions which were considered but decided against. This serves to inform future decisions, as well as the monitoring and reporting process.
In the case of this “No Sponsor Support Pension Scheme”, this step is particularly important because the actions taken by the Trustees may turn out to be favourable or unfavourable to members (and/or the PPF) depending on future experience. It is therefore crucial that the Trustees are able to demonstrate that they considered all options available to them and took appropriate advice before making a decision which was reasonable, given the available information at the time. The Trustees will also need to revisit the approach taken at regular intervals to determine whether circumstances are such that their objectives need to change.
IRM framework
The Trustees obtain legal advice that confirms that the specifics of the scheme rules and relationship with the participating employer means that for practical purposes they have the ability to determine whether to trigger a PPF Assessment Period or continue the scheme outside of the PPF with no employer support. The advice further confirms that continuing to run the scheme outside of the PPF would not compromise the compensation payable to members if the debt is triggered at a later date or raise undue concerns from TPR. They decide to implement the IRM framework in Figure D2 to set and monitor an appropriate strategy.
Integrated risk management framework
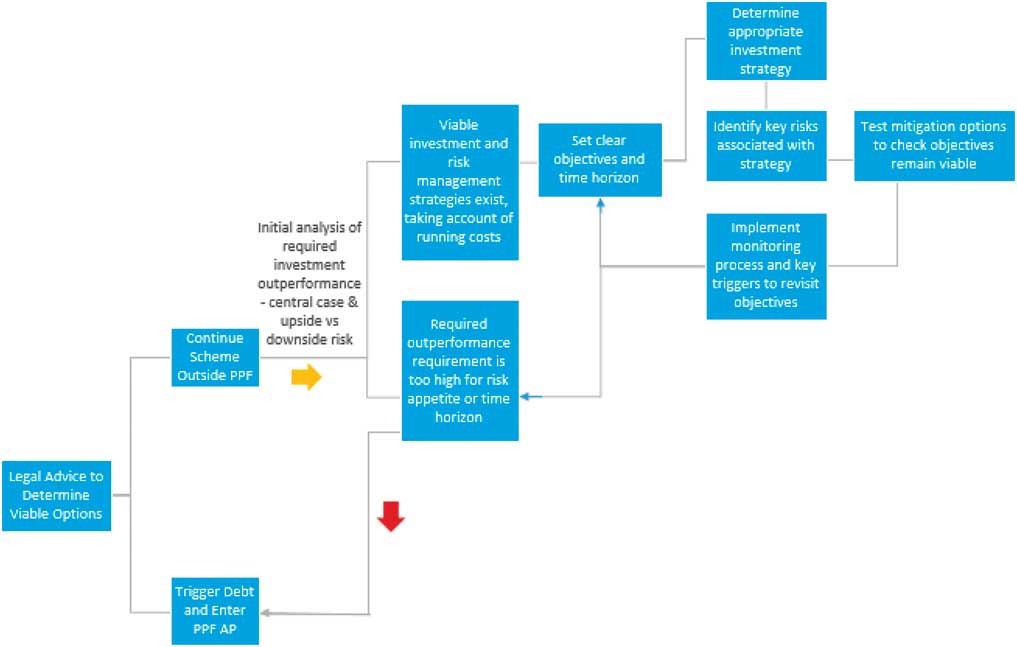
D.5. Initial analysis and development of objectives
Consideration to call in Section 75 debt immediately and enter a PPF Assessment Period
The Trustees obtain analysis from the scheme actuary regarding the level of benefits available to members in this scenario. Results show that members’ benefits would be broadly capped at PPF levels (105% funded on PPF basis but only 75% on buyout basis).
Consideration to continue as an ongoing scheme with no employer support
Return requirement
Initial analysis shows that a return of Gilts +0.75% over the duration of the scheme would be sufficient to secure full benefits for members. The Trustees conclude that it would be reasonable to conduct a review of potential investment strategies which could deliver this return and consider which, if any, would be within an acceptable risk budget.
Consideration is given to the cost of this analysis and agreement reached that the investment strategy represents by far the greatest determinant of success or otherwise if the scheme continues on an ongoing basis. A relatively streamlined asset liability modelling (ALM) process is expected to provide the analysis required, without incurring significant cost.
Legal position
The Trustees also take legal advice to determine the viability of remaining outside the PPF and any constraints to avoid being seen as “gaming” the PPF. The key consideration will be to ensure that the Trustees are not exercising their powers improperly or seeking to take an inappropriate level of risk which they would be unlikely to take if the PPF did not exist.
Acting in the interests of all members
The scheme advisors provide the Trustees with a simple table, setting out the scheme benefits available to a representative member in each key membership category, as well as the benefits that member would receive on entry to the PPF. This illustrates the impact of immediate PPF entry for each different class of member.
It is noted that, for pensioners over NRA with significant pre-1997 benefits, the downside risk is minimal, as is the upside potential.
The advisors also point out that the percentage of benefits that different members receive if they fall into PPF changes through time due to:
-
– Members reaching NRA, meaning their benefits are no longer reduced by 10% and the compensation cap.
-
– Retired members continuing to be paid full increases to their benefits as long as the scheme remains outside of the PPF.
The advisors shared the analysis in Figure D3 illustrating this point for a simplified case where the scheme pension increases are the same as PPF increases.
Percentage of full benefits received
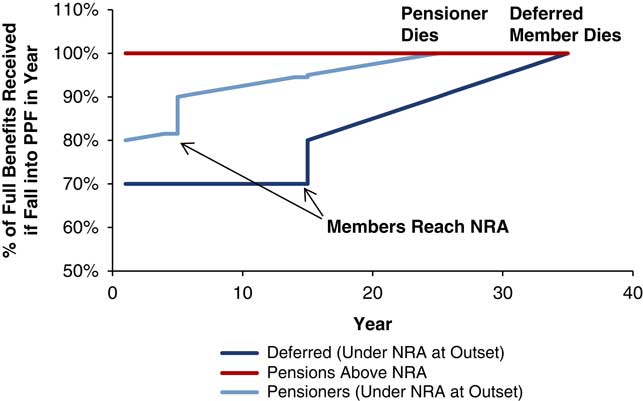
The Trustees are cognisant of the need to act in the interests of all members and not to treat any members favourably at the expense of any other group. They consider an approach whereby they contact members to offer them the option of an immediate individual insurance policy to cover their PPF-level benefits or to retain their benefits in the scheme. However, it is noted that pensioner members could select against the scheme and secure close to full benefits which would reduce the pool of assets available to invest and hence the probability of securing full benefits for other members.
Assessment of scheme viability
On balance, the Trustees decide to continue the scheme on an ongoing basis, provided an investment strategy can be found which is expected to achieve the required outperformance (including the expected costs of running the scheme).
Objectives
Based on the initial analysis, the Trustees set the following objectives:
-
– Maximise the probability of achieving full benefits for members over an agreed time horizon.
-
– Minimise downside risk (i.e. entry into the PPF) by aiming to continue the scheme outside of PPF for as long as possible and thus maximising the PPF compensation for the majority of members.
-
– Retain flexibility to buyout should it ever become affordable (i.e. buyout funding level reaches 100%).
In addition, the Trustee set the following constraints to avoid being seen as “gaming” the PPF in a manner which is likely to be judged abusive:
-
– The funding level on a PPF basis should not fall below 100% for an extended period of time.
-
– Expected returns required to achieve full funding must be reasonably achievable:
-
o Required return may become unachievable either because of adverse experience or because the term of the scheme becomes such that the asset base is too low and/or the time horizon is too short to achieve the required outperformance with any reasonable probability of success.
-
o A useful reference is if the required level of outperformance implies a risk budget significantly in excess of that of the PPF’s own investment strategy, that is, 1.8% per annum above the liabilities measured on a gilts-flat basis (PPF 2014). Whilst this is not strictly relevant given the PPF’s different situation and covenant, it is often viewed by legal advisers and Trustees as a credibility test.
-
The Trustees agree to revisit the validity of these objectives to test whether they are achievable, once the risk analysis has been completed.
Time horizon
As noted above, there could be a “tipping point” where the required investment returns become unachievable, due to the reduced duration of the scheme and the reducing asset base. In light of this constraint, the actuary suggests that an appropriate initial time horizon over which investment strategies should be assessed is 18 years.
D.6. Strategy development
All advisory fees are paid from scheme assets so cost control is crucial. However, as there is no employer support, the viability of the scheme will be determined by the performance of the assets relative to the value of the liabilities. The investment strategy to be adopted is therefore identified as the key area on which to spend advisory budget. The Trustees ask their advisors to conduct an investment strategy review and provide them with options which are expected to be relatively cost effective to implement and monitor.
When considering different strategies, the fundamental question is when the scheme should take risk, and in particular whether the scheme takes risk:
-
∙ Evenly through time.
-
∙ More at outset and less in future.
-
∙ Less at outset and more in future.
As the impact on members of entry to the PPF reduces through time, it may be better to adopt a strategy which takes less risk at the outset and more risk in the future.
The Trustees would also need to consider the impact of different investment strategies on the PPF levy, and how this could affect the viability of any investment strategy.
The Trustees recognise that it will be crucial to obtain legal advice specifically on any investment strategy adopted, in order to ensure that this would not be viewed as “gaming” the PPF.
Expected central case: The scheme actuary advises that the scheme is fully funded under a discount rate of Gilts +0.75%. Therefore, if the assets can generate these returns (net of all expenses), then the scheme should be able to pay full benefits. Based on this analysis, the advisors consider the following approaches to investment strategy:
(a) Maintain same investment strategy through time: Determine a portfolio of return-seeking assets which is expected to generate a return sufficient to outperform the liabilities by 1.25% pa Protection against future changes in gilt yields could be achieved by investing in gilts and/or swaps with longer duration than the scheme liabilities, subject to acceptable leverage multiples. This is considered as a base case against which to evaluate alternatives.
(b) Traditional de-risk of investment strategy through time: Under this approach, the scheme takes more investment risk at outset to generate additional investment returns and then gradually de-risks through time. The strategy would be constructed to achieve an average investment return of Gilts +0.75% through time (i.e. consistent with base strategy).
-
– The approach has been adopted by many other pension schemes. It is often an appropriate strategy for the typical pension scheme, which has a sponsor supporting them. This is because schemes are typically less confident of the sponsor covenant persisting through time. In addition, as member benefits mature, a scheme would have less time to recover if things go wrong. Therefore, schemes seek to take less investment risk through time to reduce the potential reliance on the sponsor.
-
– However, the risk to members in this case reduces through time, as set out in the initial analysis section. In other words, the longer the scheme remains outside the PPF, the better it is for the scheme’s members.
-
– Relative to the base strategy this strategy has a greater risk of falling into the PPF earlier and therefore does not maximise the expected value of member benefits.
(c) Re-risk through time: Under this approach, the investment strategy is low risk at the outset (i.e. a higher proportion invested in bonds) and then gradually increases towards a portfolio with higher investment risk through time. The strategy is constructed to achieve an average investment return of Gilts +0.75% through time (i.e. consistent with base strategy). Where the leverage ratio permits it, the duration of gilts held is expected to be kept at the current scheme duration so that the interest rate hedge is not significantly reduced whilst a greater proportion of the assets is allocated to growth assets.
-
∙ This strategy has less investment risk in the early years (when the scheme’s potential downside could be greater) and more investment risk taken later on (when the potential downside is lower). Therefore, the strategy could be better than the base case, and the de-risk strategy in terms of maximising the expected value of member benefits.
-
∙ It will be important to ensure that the performance expectation is kept high enough to ensure that the “PPF drift” is covered, that is, scheme’s funding level on a PPF basis does not fall significantly below 100% as the scheme continues to pay full member pension increases through time.
-
∙ The Trustees will also need to ensure that any re-risking is carried out over a time period which gives sufficient duration for future outperformance to be achieved. The expectation is, therefore, that re-risking will start almost immediately, albeit that it will be a gradual process. The Trustees will be aware that the asset base is reducing over time and therefore the rate of return required to maintain the expectation of meeting full benefits may well increase.
D.7. Risk identification and analysis
The Trustees use a small firm to provide funding and investment advice. They have had no formal covenant advice but the Trustees feel that, as all sponsor operations and tangible assets have been closed/disposed of with a negative net asset position, the possibility of future support from the sponsor can be ignored for the purposes of risk analysis.
(a) The first step under the IRM process is to analyse and rank the key risk areas separately
Risk analysis

Non-key risks and reasons for not monitoring these
Some risks identified, such as the potential of Solvency II or more stringent legislative funding requirements, were ignored for the purposes of this analysis. The Trustees and their advisors felt that, in this scenario, they would have no choice but to enter the PPF and therefore it did not represent a manageable risk which merited the cost of further analysis. This should be periodically revisited as and when the assets held reach levels significantly greater than PPF levels.
(b) Assess key risks together
Covenant and investment + covenant and funding
-
∙ No interaction with covenant/funding risks at present as there is no covenant or funding.
-
∙ However, it is noted that the difference between full scheme benefits and PPF compensation reduces through time and this could impact suitable investment strategies.
Funding level and investment
-
∙ The scheme is in a very unusual position, where the downside risk to members is greater at the outset than it is in the future, unless the funding level improves such that benefits materially in excess of PPF levels could be secured.
-
∙ Investment portfolios and strategies should be designed to maximise the expected value of member benefits. This favours portfolios which minimise the risk of the scheme entering the PPF, subject to maintaining sufficient expected returns to pay full member benefits and retaining sufficient upside to achieve buyout.
-
∙ ALM results give a view of the progression of the funding level over time, against both PPF-level benefits and full scheme benefits. Extreme scenarios are also considered.
-
∙ Investment portfolios are considered which give sufficient returns to pay full member benefits through time, that is, achieving average returns of Gilts +0.75% net of scheme expenses.
(c) Assess risk capacity
-
∙ The scheme is constrained by the need to adopt a strategy which does not require investment in return-seeking assets materially in excess of the PPF’s own investment strategy. It is also necessary to avoid a sustained fall in the funding position below PPF levels.
-
∙ Where the funding position reaches levels significantly in excess of PPF-level benefits, the impact on members’ benefits as a result of a future funding deterioration and eventual entry to the PPF increases. The Trustees agree to review their objectives if the funding level reaches 120% of PPF-level benefits.
-
∙ If the returns required to pay full member benefits become unachievable, assessed by the probability that full benefits will be met falling below 50%, then the Trustees agree to call in the deficit which would trigger the insolvency of the sponsor and a PPF assessment period.
(d) Mitigate risk and contingency plan
Risk monitoring and contingency planning
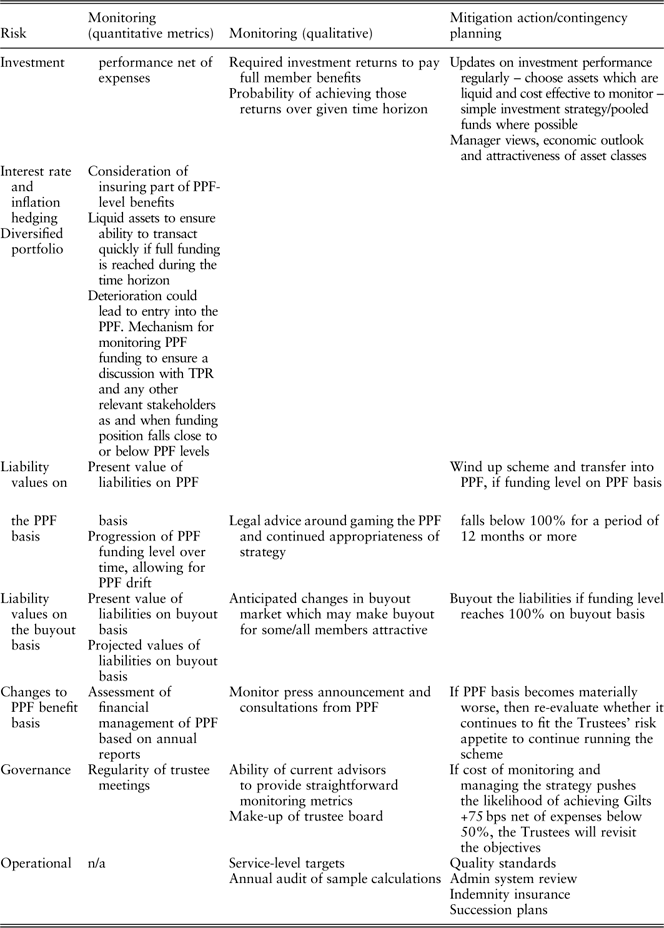
D.8. Revisit viability of objectives following risk analysis
-
∙ The objectives are still considered viable after the further risk analysis has been undertaken. This is, however, subject to the following checks:
-
o Legal advice indicates that, subject to protection of the downside risk, an investment strategy does not constitute “gaming” the PPF.
-
o The actuarial and investment advisors are able to provide the monitoring metrics described above cost efficiently.
-
D.9. Document and communicate decisions
-
∙ Member communications to explain approach and decisions to members.
-
∙ Monitoring metrics will be added to existing reports to help minimise the additional burden of documenting decisions.
-
∙ Strategy capable of clear communication to TPR if needed. Having clear documentation around the approach taken when submitting the results of the analysis should help with these discussions.
D.10. Addendum: legal commentary
As part of the process of drafting this case study, we received valuable input from two pensions lawyers. The key points they made were as follows (recognising that every case is different and needs to be considered on its own merits):
-
– The key question which Trustees need to answer is “Would this course of action be an improper exercise of trustee powers?”.
-
– To some extent this depends on the level of risk being taken and whether the Trustees are behaving in a cynical way. In this case study, the Trustees are not seeking to take excessive risk and “dump” the liabilities on the PPF overnight if experience does not work in their favour. The timeline and downside risk management are relevant.
-
– Justice Henderson said that Trustees should view the PPF’s existence as irrelevant but that was in the context of a case where Trustees were “overtly” gaming the PPF. It appears here that Trustees are taking a considered, reasonable approach in relation to scheme funding. They are not making any changes to increase PPF liabilities.
-
– As long as the Trustees are not giving disproportionate thought to circumstances of the deferred members, other than to recognise the drift – the existence of the PPF is not an improper consideration.
-
– In this case, the Trustees are reflecting the circumstances of the scheme and the employer in developing their investment and funding strategy, rather than seeking to engineer those circumstances.
-
– The Trustees are not to consider the PPF as an asset but can reasonably use the PPF funding position and likely impact on members under a range of different scenarios to drive their risk management strategy.
-
– Short-term experience will be important – the Trustees will want to demonstrate that the strategy is “working” in the short term and therefore a strategy which delivers a high likelihood of covering the PPF drift to start with, where more risk is taken later in the investment plan will be desirable.
-
– The Trustees will need to monitor the funding position and document the rationale behind any decisions taken to secure “PPF plus” benefits or continue to run the scheme at each monitoring point.
-
– It is very difficult, without hindsight, to say whether the Trustees have acted improperly in continuing to run the scheme. This will depend on the outcome that they are able to deliver to members. It is therefore critically important to document the rationale for any decisions taken and to maintain a clear audit trail of advice received and all analysis carried out.


 Open access

