

Introduction
Antimicrobials are essential to effectively treat infections; however, up to 50% is unnecessary or inappropriate. 1 Antimicrobial stewardship teams optimize antimicrobial prescribing with the goal to improve patient outcomes and prevent harm (eg, adverse events, drug-resistant infections).
In addition to enhancing patient safety and healthcare quality, implementation of an Antimicrobial Stewardship Program (ASP) can offer substantial return on investment. However, capturing the total value of an ASP can be challenging given many confounding factors and complexities of health care processes, including contract pricing and drug shortages which can influence expenses. Additionally, there is uncertainty related to charge data (eg, medications, supplies, room and board, staff time) compared to actual reimbursement. Few institutions have attempted to quantify antimicrobial stewardship return on investment, mostly focusing only on drug costs.
We sought to expand on prior reports by determining direct and indirect hospital-related cost savings (focusing on hospital supply and personnel cost, rather than patient charges) resulting from various antimicrobial and diagnostic stewardship interventions implemented by our ASP.
Program site information
Our ASP was implemented in 2012. Our practice site is a 304 bed, free-standing, children’s hospital located in Milwaukee, Wisconsin. Initially, we focused on guideline development and hospitalwide interventions. In 2018, we shifted our methodology to prospective audit and feedback (“Handshake Stewardship”), focusing on individual antimicrobial usage, as well as continuing our hospitalwide efforts. In 2022, we expanded to include diagnostic stewardship and strengthened our collaboration with the microbiology laboratory. In 2023, we began incorporating sustainability efforts.
Direct drug cost savings
Previously published reports related to antimicrobial stewardship return on investment mostly focus on direct drug cost savings. The results of a University of Maryland Medical Center study demonstrated implementation of an ASP saved $17 million over 8 years. Reference Standiford, Chan, Tripoli, Weekes and Forrest2 However, once the program was discontinued, antibiotic costs increased by more than $1 million in the first year (a 23% increase), with additional increases the following year. Reference Standiford, Chan, Tripoli, Weekes and Forrest2 This highlights the importance of sustained ASP interventions. Another program evaluated financial impact over 11 years (calculated by reduction in antimicrobial expenditures minus labor costs) and identified an average cost savings of $1–2 million per year. Reference Beardsley, Williamson, Johnson, Luther, Wrenn and Ohl3
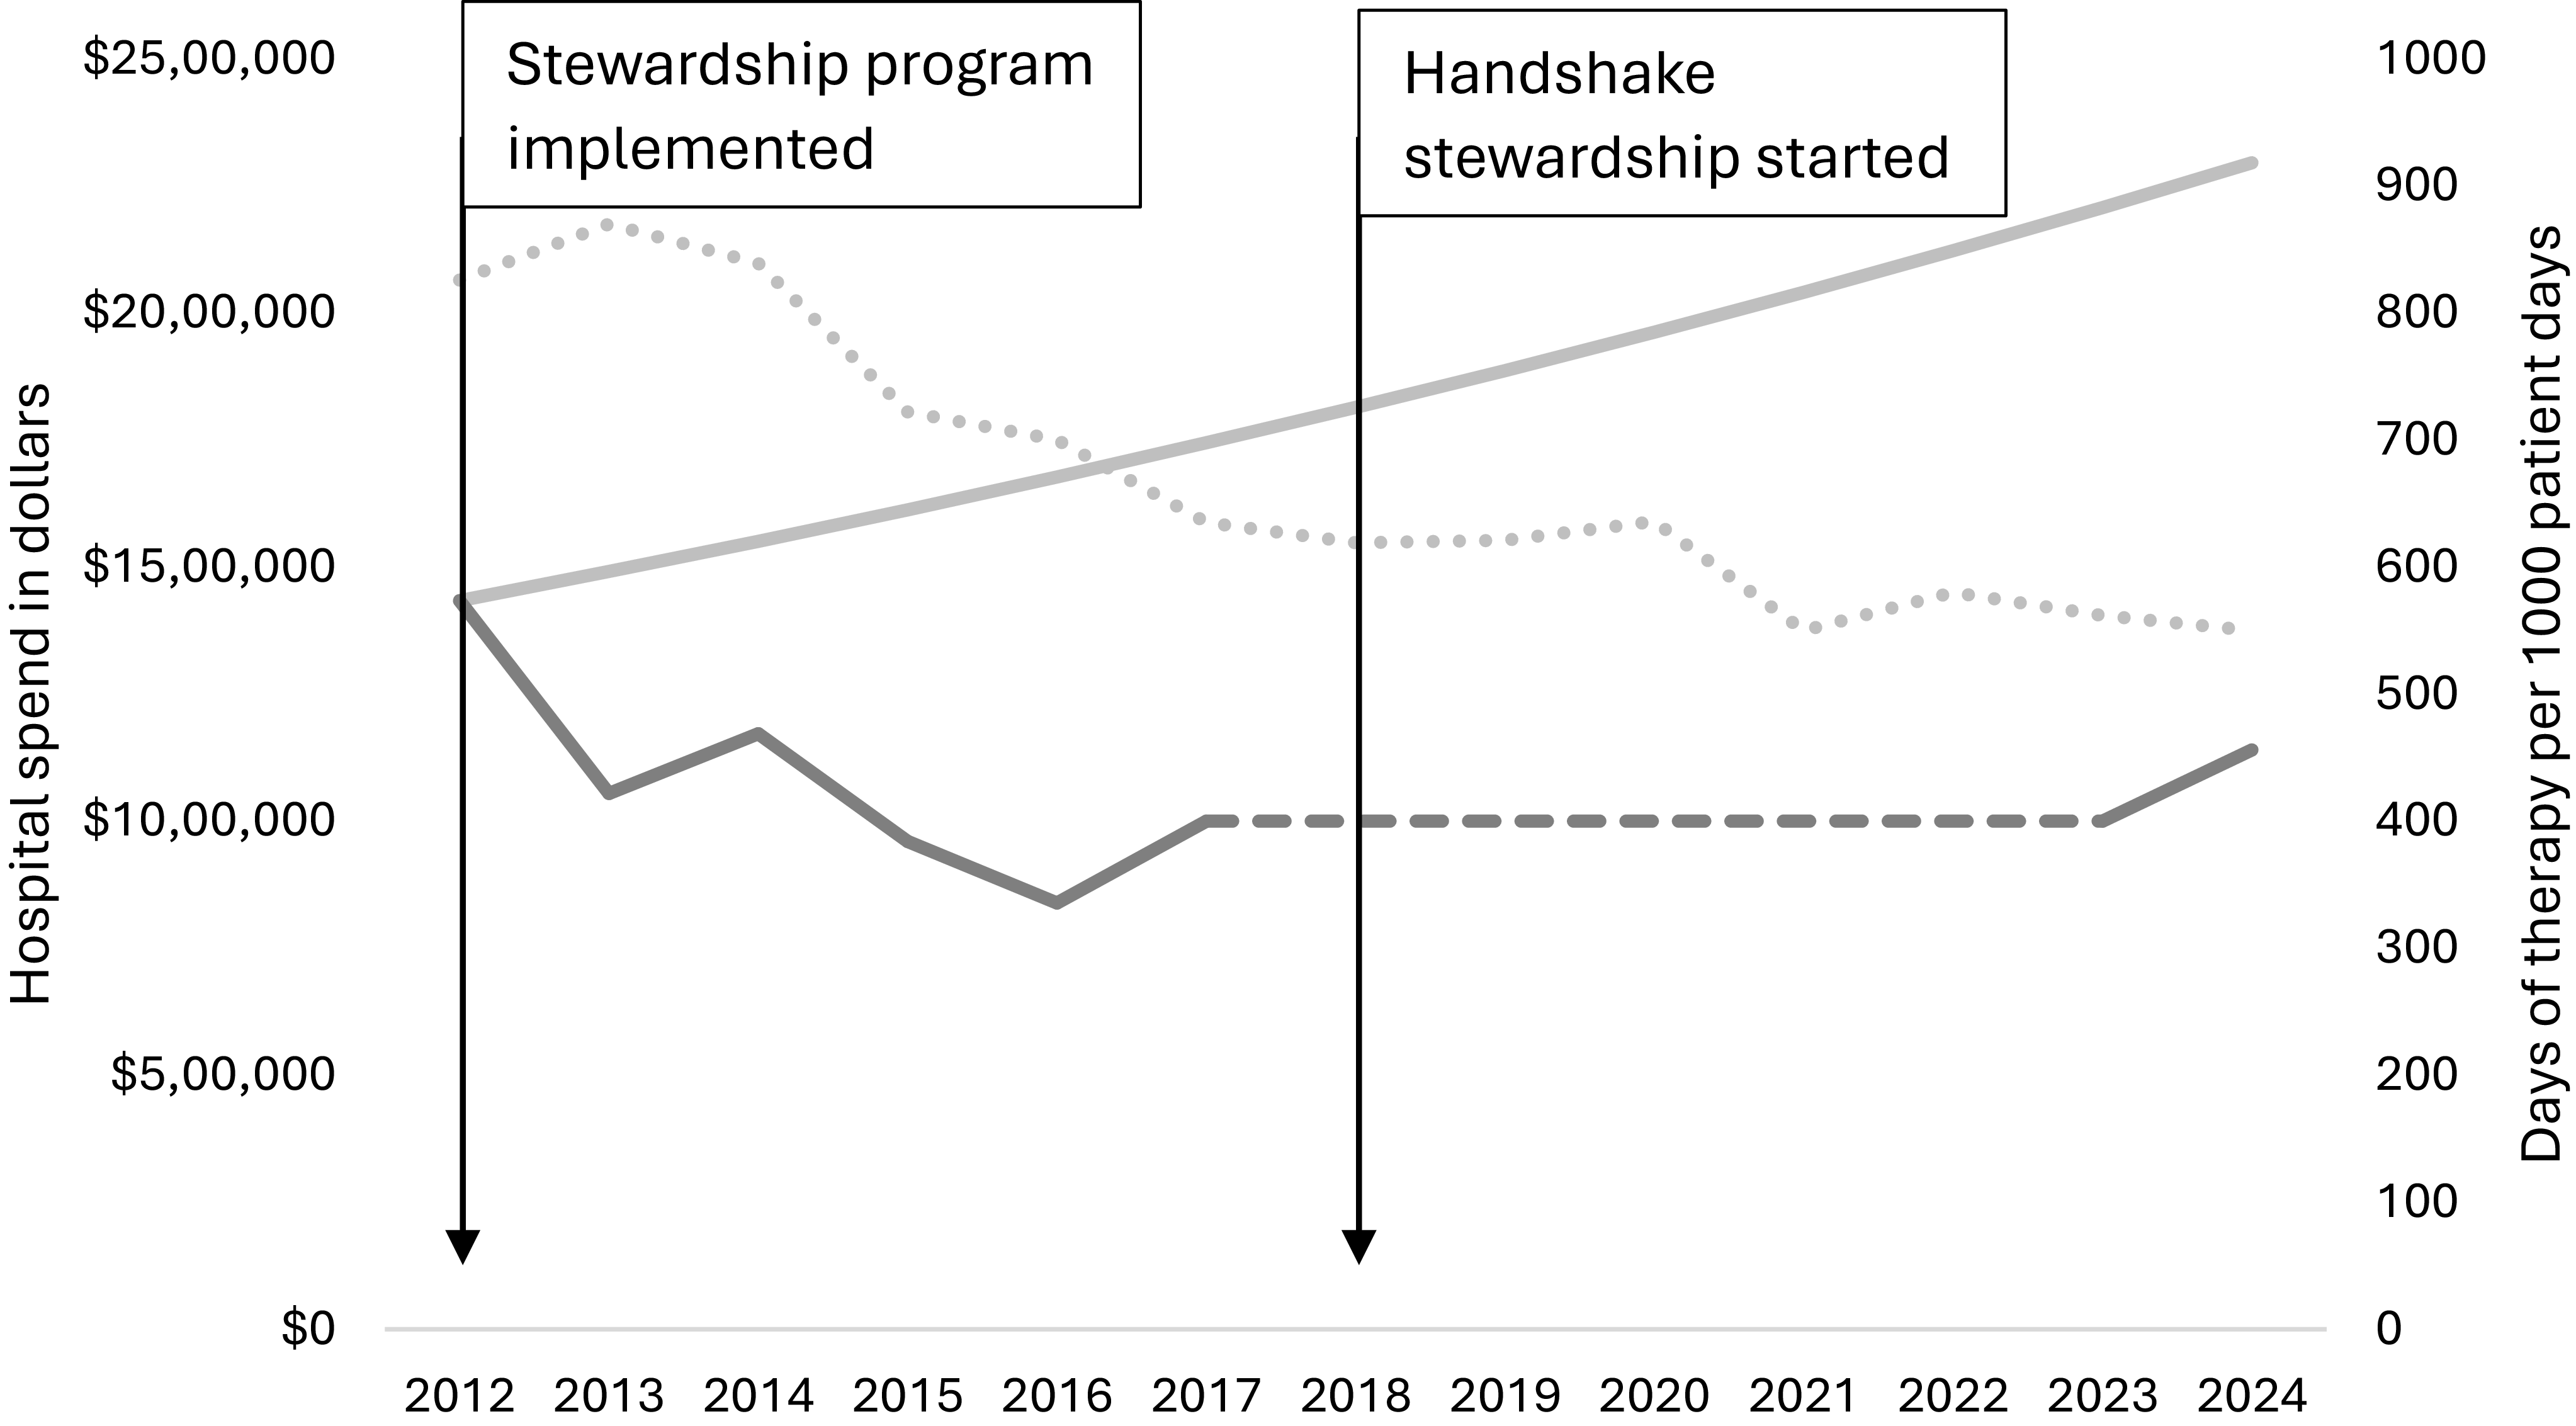
We extrapolated our direct drug cost savings from actual antimicrobial expenditures using purchasing databases at our institution with a model projecting estimated rise without antimicrobial stewardship efforts. We projected a 4% yearly increase, which incorporated prior spending trends, inflation rates, and rising drug prices. 4 Our projection was similar to a pharmacy market outlook provided by our distributor. Reference Slinde5 We included antibiotics and antifungals (excluding antivirals), as these are the drugs routinely monitored by our ASP.
A review of antimicrobial expenditures before Handshake Stewardship (2012–2017) were $610,184 less per year (average) compared to projected costs without stewardship (Figure 1). A review after implementing handshake stewardship (2024) revealed additional savings, totaling $1,155,405 less than projected. Correlating days of therapy per 1,000 patient days demonstrated a concurrent declining trend (Figure 1). These savings (just over $1 million per year) were similar to those reported by others. Reference Standiford, Chan, Tripoli, Weekes and Forrest2–Reference Beardsley, Williamson, Johnson, Luther, Wrenn and Ohl3 Some key ASP efforts (in addition to Handshake Stewardship) contributing to cost savings are highlighted below.
Annual antimicrobial expenditures and usage (2012–2024). Legend. Light gray solid line depicts projected antimicrobial expenditures without antimicrobial stewardship, assuming average increases were to continue and accounting for inflation rate and drug cost increases (4%) over time. Dark gray solid line depicts actual antimicrobial expenditures. The dotted dark gray line depicts unknown expenditures 2017–2023 with $1,000,000 input for display purposes. The light gray dotted line depicts drug usage over time in days of therapy per 1,000 patient days. Expenditure and usage data includes antibiotics and antifungals; antivirals excluded.

Figure 1. Long description
A line graph displays antimicrobial expenditures and usage from 2012 to 2024. The x-axis represents the years from 2012 to 2024. The left y-axis represents hospital spend in dollars, ranging from $0 to $25,000,000. The right y-axis represents days of therapy per 1,000 patient days, ranging from 0 to 1,000. The light gray solid line shows projected antimicrobial expenditures without antimicrobial stewardship, assuming average increases and accounting for inflation and drug cost increases over time. The dark gray solid line shows actual antimicrobial expenditures. The dotted dark gray line represents unknown expenditures from 2017 to 2023 with a $1,000,000 input for display purposes. The light gray dotted line depicts drug usage over time in days of therapy per 1,000 patient days. The graph indicates a stewardship program implemented in 2013 and handshake stewardship started in 2018. All values are approximated.
Development of guidelines/pathways
Development of institutional guidelines for treating common infections is a key function of ASPs. Though the primary goal that drives development of guidelines is improved patient care, reduction in health care costs is also a factor. Promoting use of the most narrow, effective antibiotic for the shortest, effective duration is expected to deliver savings in drugs costs and resource utilization. Limited data exists on the cost effectiveness of guideline-driven care, as studies often focus on improved outcomes.
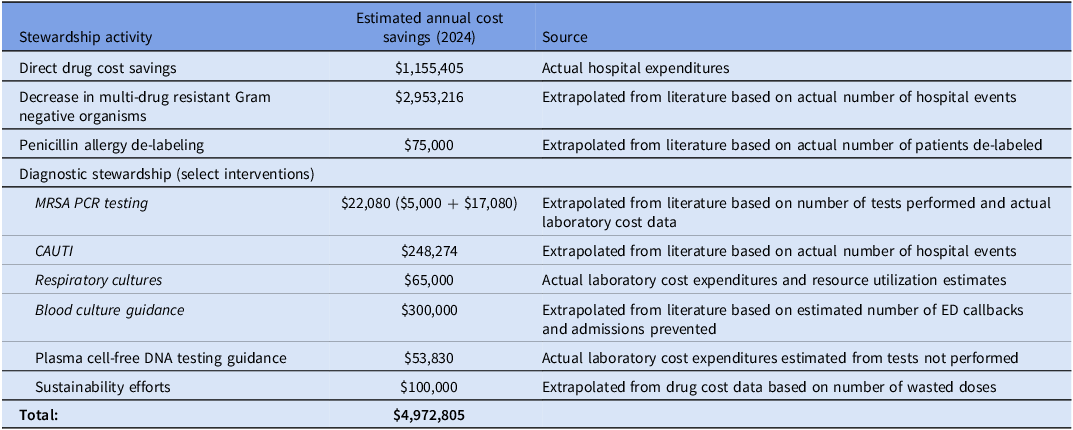
We implemented a systemwide pathway for diagnosis and treatment of community-acquired pneumonia, where ampicillin is recommended as first-line therapy and guidance on duration of treatment reduced from 10 days to 5–7 days. Following educational interventions, use of alternative antibiotics (namely ceftriaxone) declined from 36% to 6% and proportion of patients receiving 5-day durations increased from 20% to 50% (internal data, not published). We also implemented a systemwide pathway for diagnosis and treatment of urinary tract infection with cephalexin recommended as first-line therapy. After release of the pathway, cephalexin prescribing improved from 34% to 66%. Reference Baumer-Mouradian, Bradley and Ansari6 Many other guidelines exist at our institution and presumably positively impact patient care. Though we are unable to directly evaluate the financial impact of all our guidelines, we can anticipate some direct drug cost savings due to use of less expensive, first-line antibiotics and reduced durations of therapy (Table 1). Guideline-directed care may also lead to decreased adverse events (and associated costs with those) as well as reduced development of resistant infections from decreasing antibiotic pressure, which can be difficult to quantify in dollars and are not captured in this report.
Cost saving estimates for select interventions

Table 1. Long description
The table presents cost savings estimates for various stewardship activities and diagnostic interventions. It includes three columns: Stewardship activity, Estimated annual cost savings (2024), and Source. The rows detail specific activities such as direct drug cost savings, decrease in multi-drug resistant Gram negative organisms, penicillin allergy de-labeling, MRSA PCR testing, CAUTI, respiratory cultures, blood culture guidance, plasma cell-free DNA testing guidance, and sustainability efforts. Each row lists the estimated annual cost savings and the source of the data, which includes actual hospital expenditures, extrapolated data from literature, and actual laboratory cost data.
Intravenous to enteral conversions
Encouraging transition to enteral antibiotics, when initially on IV therapy, can offer cost savings in healthcare settings. Direct savings include lower drug acquisition costs (oral medications are generally less expensive than IV) and reduced drug wastage (unused oral tablets/capsules can be re-used whereas individually prepared IV doses are discarded). Other direct savings include reduction in administration costs (eg, nursing time and supply costs). Indirect costs may be attributed to shorter hospital stays and improved resource utilization. A study of 4 costly IV medications with highly bioavailable enteral equivalents identified use of the expensive IV version rather than enteral equivalents in eligible patients added more than $1 million to the yearly cost of care. Reference Lau, Pinto, Thiemann and Lehmann7 Another study evaluated use of a clinical decision support tool to identify IV-to-enteral conversion opportunities. Using the tool resulted in medication cost savings of 9% over a 6-month period. Reference Carver, Burgess, Cooper, Elders and Kramer8 Our hospital has a pharmacist-driven IV to enteral protocol, with antimicrobials included on the approved list of medications. We could not quantify actual savings due to limitations with documentation of formulation changes, though implementation of the protocol presumably resulted in at least some direct drug cost savings (Table 1).
Prevention of resistance
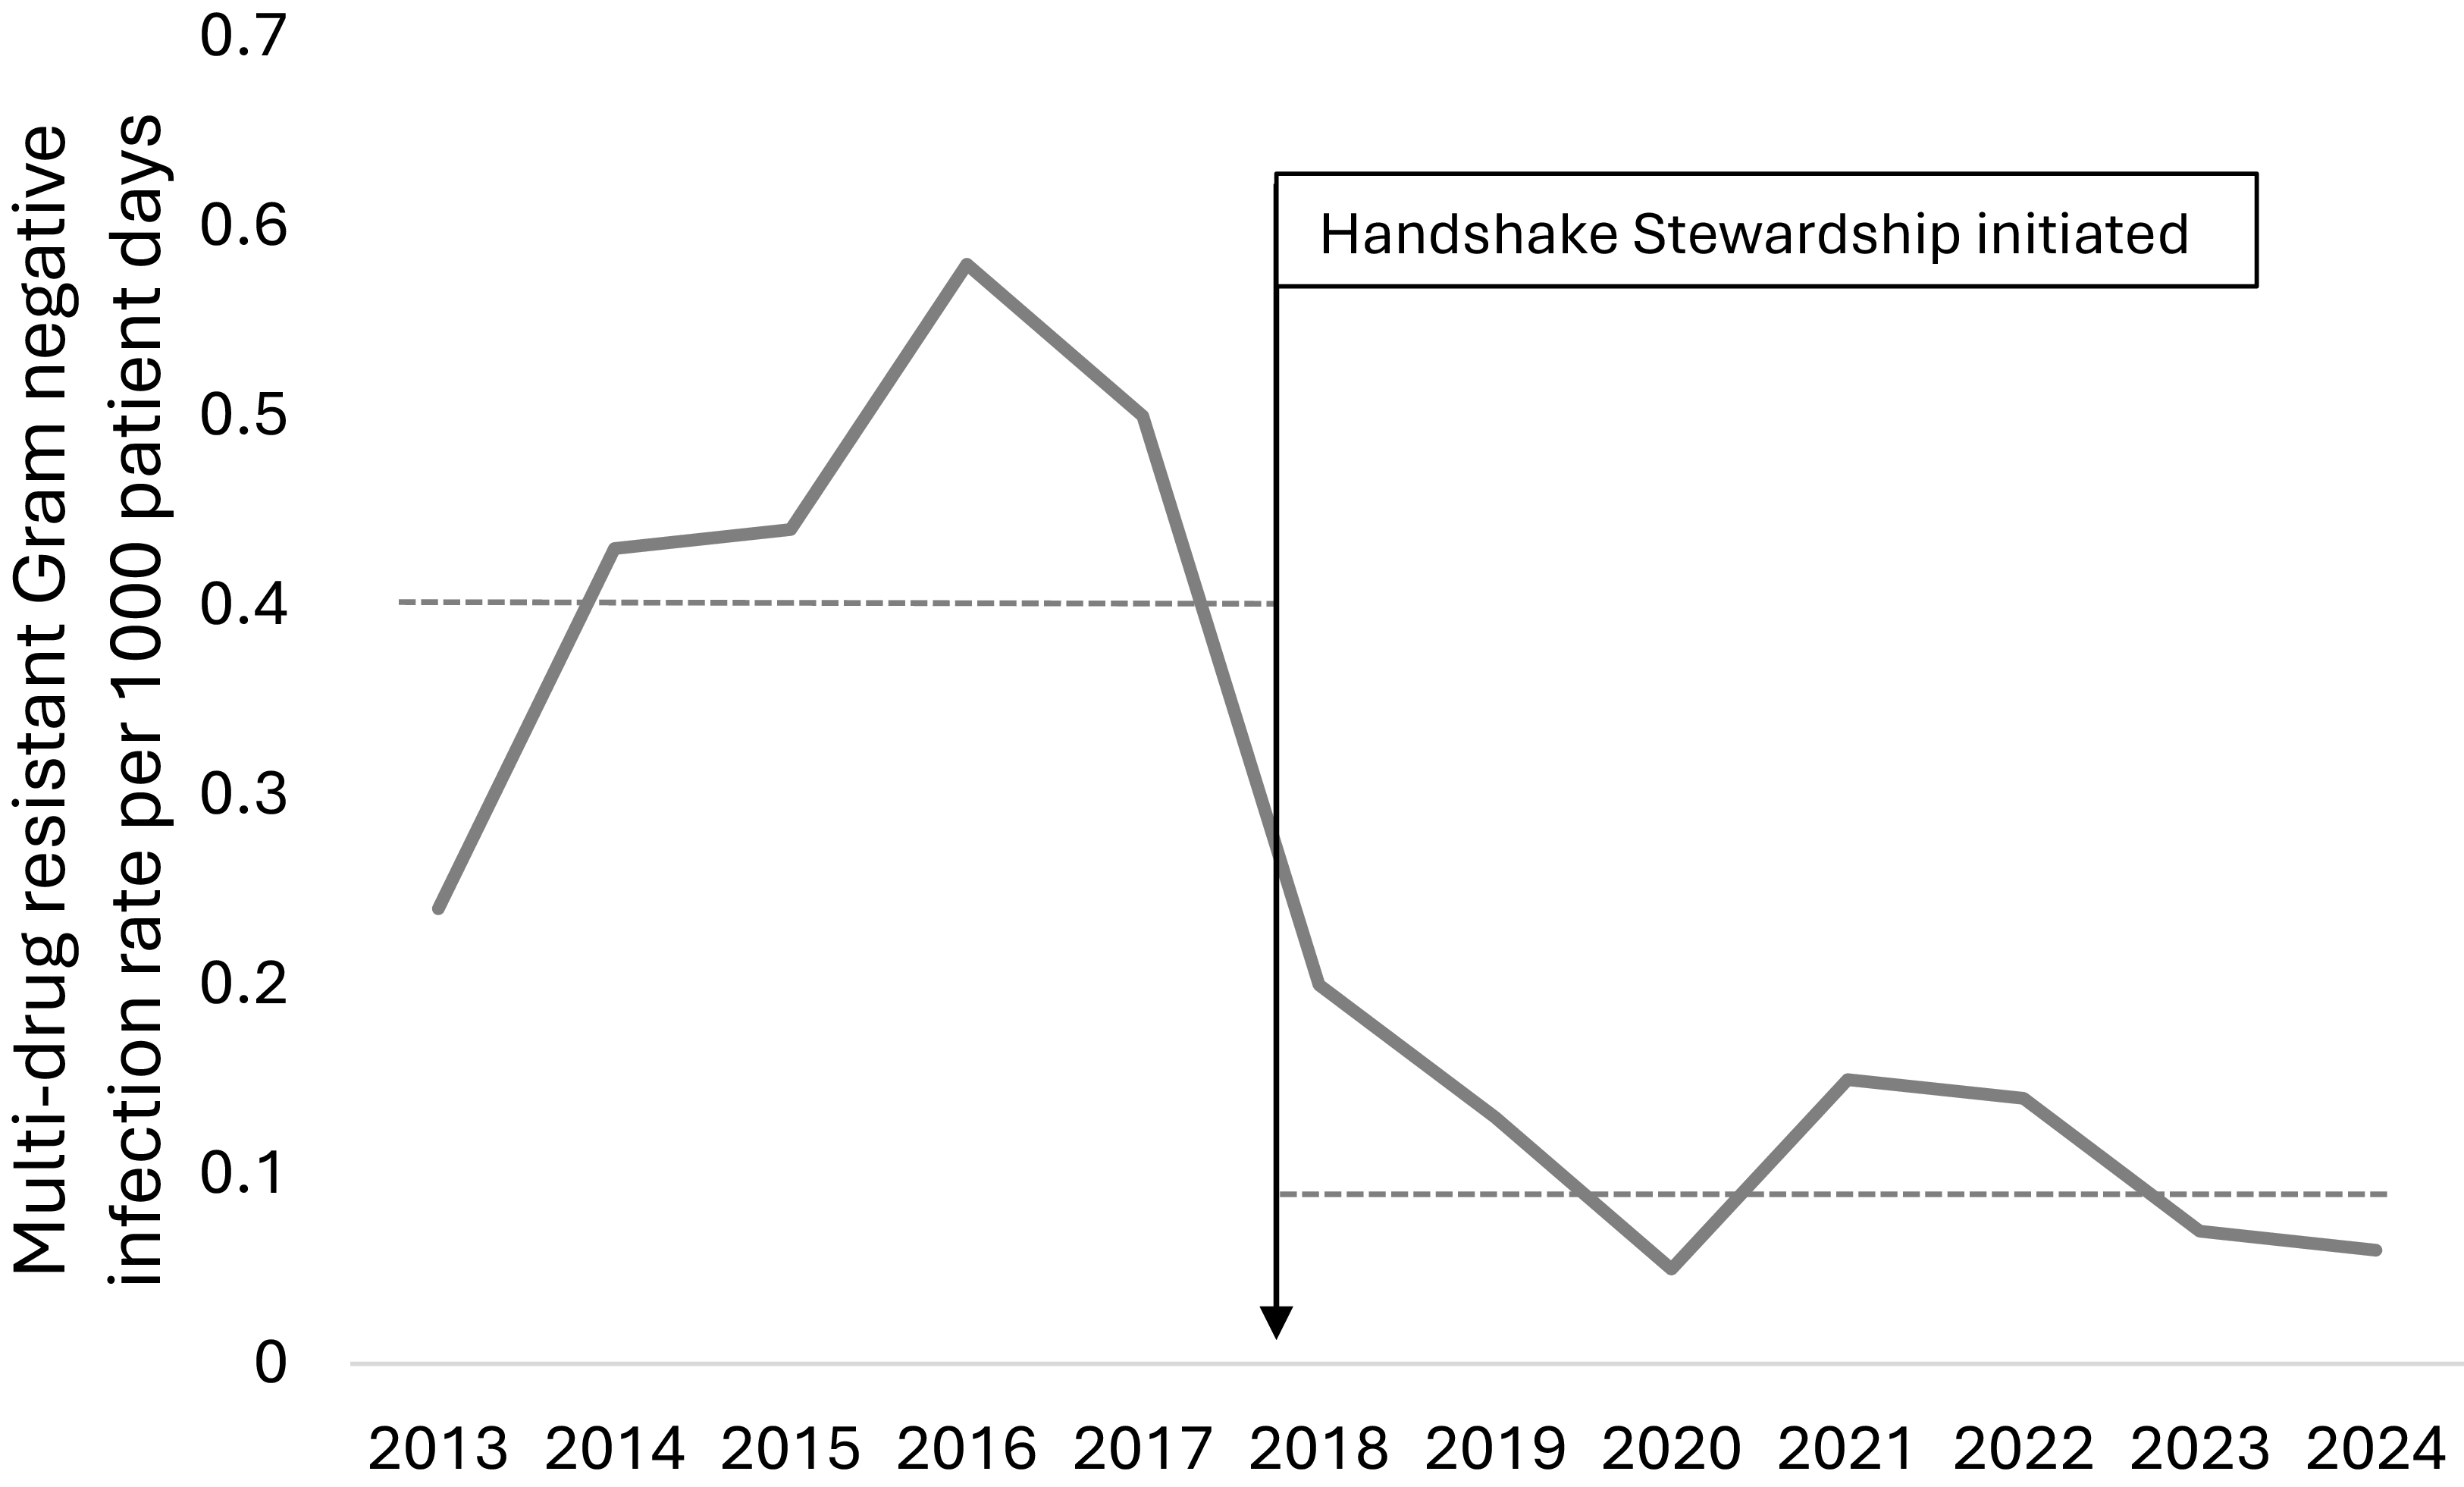
For prevention of antimicrobial resistance, we reviewed the reduction in total number of multi-drug resistant (MDR) Gram-negative organisms at our institution over time, as defined by institution-specific protocols based on National Health and Safety Network criteria. 9 Robust estimates of costs related to MDR infections are challenging because events are relatively rare and therefore require large databases of information. The Department of Veterans Affairs was tasked with generating estimates of attributable cost due to antibiotic-resistant infections for the Centers for Disease Control and Prevention Antibiotic Resistant Threats in the United States 2019 report. 10 This study estimated national costs associated with 6 multi-drug resistant infections (methicillin-resistant Staphylococcus Aureus, vancomycin-resistant Enterococcus, extended-spectrum beta-lactamase, carbapenem-resistant Enterobacteriaceae, carbapenem-resistant Acinetobacter, and MDR Pseudomonas) to be more than $4.6 billion annually. We identified a reduction in hospital-acquired MDR Gram-negative infections from a mean rate of .4 infections per 1,000 patient days (mean 37 infections per year) before Handshake Stewardship to .1 (mean 9 infections per year) after implementation of Handshake Stewardship (Figure 2). Using the Department of Veterans Affairs report of the lowest unadjusted hospital cost by a pathogen in a non-sterile site ($105,472), this resulted in an estimated annual cost savings of $2,953,216 (Table 1). 10
Hospital-acquired multi-drug resistant Gram-negative infection rate per 1,000 patient days. Legend. The solid dark gray line depicts the annual rate of hospital-acquired multi-drug resistant Gram-negative infections per 1,000 patient days. The dotted gray line represents the mean rate before and after Handshake Stewardship.

Figure 2. Long description
The line graph illustrates the hospital-acquired multi-drug resistant Gram-negative infection rate per 1,000 patient days over the period from 2013 to 2024. The solid dark gray line represents the annual rate of these infections. The dotted gray line indicates the mean rate before and after the initiation of Handshake Stewardship. The x-axis spans from the year 2013 to 2024, while the y-axis ranges from 0 to 0.7. The graph shows a peak in infection rates around 2016, followed by a significant decline after the initiation of Handshake Stewardship in 2018. The infection rate continues to decrease, with minor fluctuations, through 2024. All values are approximated.
Antimicrobial stewardship programs can offer significant cost avoidance and savings by promoting the appropriate use of the narrowest antibiotics and preventing acquisition of MDR organisms, resulting in ability to use lower-cost, first-line antibiotic therapy and reduced hospital length of stay. Further cost savings may be realized from decreased use of personal protective equipment and other isolation-associated costs (eg, cleaning protocols). The reduction in MDRs over time is likely multifactorial; however, some of the decrease can be attributed to our team’s efforts at optimizing use of antimicrobials and decreasing selective antibiotic pressure. Return on investment calculations can be difficult to assess for prevention strategies, as these are likely future costs not incurred and may result in lower reimbursement (eg, shorter hospital stays) and savings extended to insurers or private payors.
Penicillin allergy de-labeling
Implementation of a penicillin allergy de-labeling program can result in significant savings for both patients and health systems. We de-labeled nearly 100 patients with a reported penicillin allergy from January 2021 through June 2023 with a success rate of 97%. Our de-labeling program has continued to grow since then, offering de-labeling opportunities in the ED, inpatient, and outpatient settings. We previously reported on potential cost savings of a penicillin allergy de-labeling program in our pediatric emergency department (ED). Reference Dong, Zembles, Nimmer, Brousseau and Vyles11 Cost savings were determined by evaluating the difference in the sum of all visit-level cost differences between non-penicillin prescription(s) and a counterfactual penicillin prescription, generating a potential $618,653 in cost savings over the 8-year period. Based on this data, we estimated annual savings of approximately $75,000 from our penicillin allergy de-labeling program.
Our estimate is in range with another economic evaluation of de-labeling penicillin allergy among inpatients and outpatients in the US and Europe that identified an incremental net benefit ranging between $256 and $6745 per patient. Reference Sousa-Pinto, Blumenthal and Macy12 Allergy de-labeling is an important antimicrobial stewardship initiative, as this intervention increases opportunities to utilize first line antibiotics for infections, which may have reduced adverse effects (and costs associated with those), in addition to drug cost savings. Other positive outcomes, not accounted for, include decreased surgical site infections, risk of acquiring a resistant organism, and mortality. Savings described in this report only account for immediate savings and do not take into account future savings after de-labeling.
Diagnostic stewardship
Rapid diagnostic tests have emerged to improve patient outcomes by delivering microbiologic results more quickly and informing diagnosis and therapy decisions. Some cost savings exist from reductions in tests not performed and antimicrobials not prescribed. Other cost savings result from ability to rule out infection or narrow antimicrobial therapy. Our program works closely with the microbiology director to improve efficiency and implement new tests when appropriate. Using actual laboratory expenditure data for supplies, estimates of tests not performed, personnel time/salary, and extrapolating from the literature, we identified a total of $689,184 from diagnostic stewardship interventions saved in the last year. Key interventions are highlighted below.
MRSA PCR
We converted our methicillin-resistant Staphylococcus aureus (MRSA) polymerase chain reaction (PCR) test from a send-out to an on-demand in-house test. This resulted in $61 savings (laboratory cost) per test and $17,080 in annual cost savings. Additionally, the in-house test provided a faster turnaround time (from 1–2 days to 4 hours), which reduced vancomycin length of therapy and subsequent need for therapeutic drug monitoring (TDM). Based on the average number of admissions for pneumonia or orbital cellulitis (approved indications for MRSA PCR), this results in 20–25 patients per year able to discontinue vancomycin earlier than with the send-out test. Vancomycin TDM costs to the hospital are $250 each (plus pharmacist time to interpret). If even one serum drug concentration were saved per person, that would result in approximately $5,000 in supply cost savings per year.
A study evaluating the use of MRSA PCR nasal swab among critically ill patients with nosocomial pneumonia reported a cost avoidance of $108 per patient based on de-escalating vancomycin in patients with negative results. Reference Melanie, Michael, Jason, Petra and Christopher13 Likewise, we estimated supply cost from incorporating the test in-house compared to a send-out, with additional savings realized from quicker results. The reduction in vancomycin use is likely reflected in the direct drug cost savings. Additional cost savings are realized in vancomycin serum trough concentrations not drawn when vancomycin durations are shortened.
Reflex urine cultures
The overall number of catheter-associated urinary tract infections (CAUTI) was steadily rising from 2019 to 2022. In 2023 we implemented a change to perform urine culture only when urinalysis (UA) was positive (neonates and immunocompromised patients excluded). This reduces false diagnosis of urinary tract infection and subsequent ordering of unnecessary antibiotics. Following this intervention, the total number declined (27 CAUTI events in 2022 preintervention and 9 events each in 2023 and 2024 postintervention), presumably resulting in cost savings related to antibiotic expenditures and supplies (from cultures not performed when UA is negative). Estimating savings from CAUTIs can be difficult given overall low rates per hospital and the multifactorial nature of the event (eg, extra hospital days, supplies, antibiotics). For this reason, we utilized the Agency for Healthcare Research and Quality (AHRQ) estimates for incremental costs to the hospital for an inpatient stay attributable to a CAUTI of $13,793 (95% CI $5,019–22,568). 14 The reduction in events translates to $248,274 in annual cost savings (Table 1). Though reductions were likely multifactorial, the change in practice (UA with reflex to culture) would have contributed to the improvement.
Tracheal aspirate reporting
We collaborated with microbiology to create rules for working up endotracheal tube and tracheal aspirate cultures in the laboratory. Samples without neutrophils or organisms seen on Gram stain are no longer worked up for identification and susceptibility. This change resulted in a 40% reduction in progression from Gram stain to culture post-implementation of the protocol (raw, unpublished data). As a result, laboratory supplies and technician time were reduced by an estimated $65,000 per year (Table 1). Additionally, the new process reduces false diagnosis of tracheitis and subsequent ordering of unnecessary antibiotics, which was not calculated directly but is likely reflected in our drug cost saving estimate. Prinzi et al retrospectively evaluated endotracheal aspirate culture reporting in mechanically ventilated children and identified a >2-fold higher rate of antimicrobial therapy with organism overreporting. Reference Prinzi, Wattier and Curtis15 Selective reporting can be used to support antimicrobial stewardship efforts. Reference Tebano, Mouelhi and Zanichelli16
Blood culture guidance
Most (90%) of our blood cultures do not grow an organism. Overutilization of blood cultures may result in excess antibiotic use (eg, treatment of contaminants). A blood culture bottle shortage in 2024 created an opportunity to improve rational use. 17 We created guidance regarding low-risk conditions where blood cultures are low yield (eg, isolated fever, non-severe cellulitis) and now require an indication on the blood culture order. Furthermore, we sought to reduce surveillance cultures in patients without clinical signs and symptoms of infection and capped recurring blood cultures at 3 days. Capturing cost savings related to this intervention is difficult, as blood culture bottles are relatively inexpensive, and savings are more likely reflected by tests not performed, antibiotics not prescribed, and potentially shortened hospital length of stay (or an ED visit not resulting in an inpatient admission). Additionally, we created a guideline for blood culture result callbacks from the ED, which prevents patients with likely contamination who are well at home from being called back to the ED and/or admitted. Pediatric studies suggest a baseline rate of 50% unnecessary ED callbacks and 30% unnecessary admissions with an average stay ranging from 2–7 days for contaminated blood cultures prior to stewardship interventions. Reference Segal and Chamberlain18–Reference Messacar, Hurst and Child19 AHRQ data estimates roughly $750 per treat-and-release ED visit and $13,400 per average pediatric non-ICU admission. 20–21 We extrapolated this data to estimate our cost savings related to ED callbacks. The new guideline resulted in avoidance of estimated 30 ED callbacks and 20 inpatient admissions yearly, translating to about $300,000 in cost savings (Table 1).
Plasma cell-free deoxyribonucleic acid (DNA) testing guidance
We created guidance for appropriate ordering of plasma cell-free deoxyribonucleic acid (DNA) tests. Tests now require consensus approval by Infectious Diseases and the Director of Microbiology. We estimated cost savings using the number of tests declined for not meeting criteria, however, this value is likely higher, as tests not ordered are not captured in these denials. The guidance resulted in cancellation of 14 tests that did not meet predetermined utilization criteria in 2024. At a cost to the hospital of $3,845 each, this resulted in annual cost savings of $53,830 (Table 1).
Sustainability
Our stewardship program has primarily focused on sustainability efforts during our Handshake Rounds, where we promote the addition of stop dates to antibiotic orders when feasible. Inclusion of stop dates on antibiotic orders serves to improve communication and avoid waste. Our pharmacy batches drug preparation, preparing medications 12–24 hours in advance of the due date/time. When a provider plans to stop a drug the following day, but a stop date is not present on the order, the drug is prepared and subsequently discarded, theoretically resulting in drug waste and cost. Plattner et al summarized the published literature related to antimicrobial waste in pediatric hospitals and identified many causes of waste including limited dosing formulations, drug shortages, and modifications to therapy after drug preparation or near time of discharge. Reference Plattner, Davidge, Schweiger and MacBrayne22 They suggest increased number of batches, improved communication, and/or implementation of automatic stop dates are potential interventions.
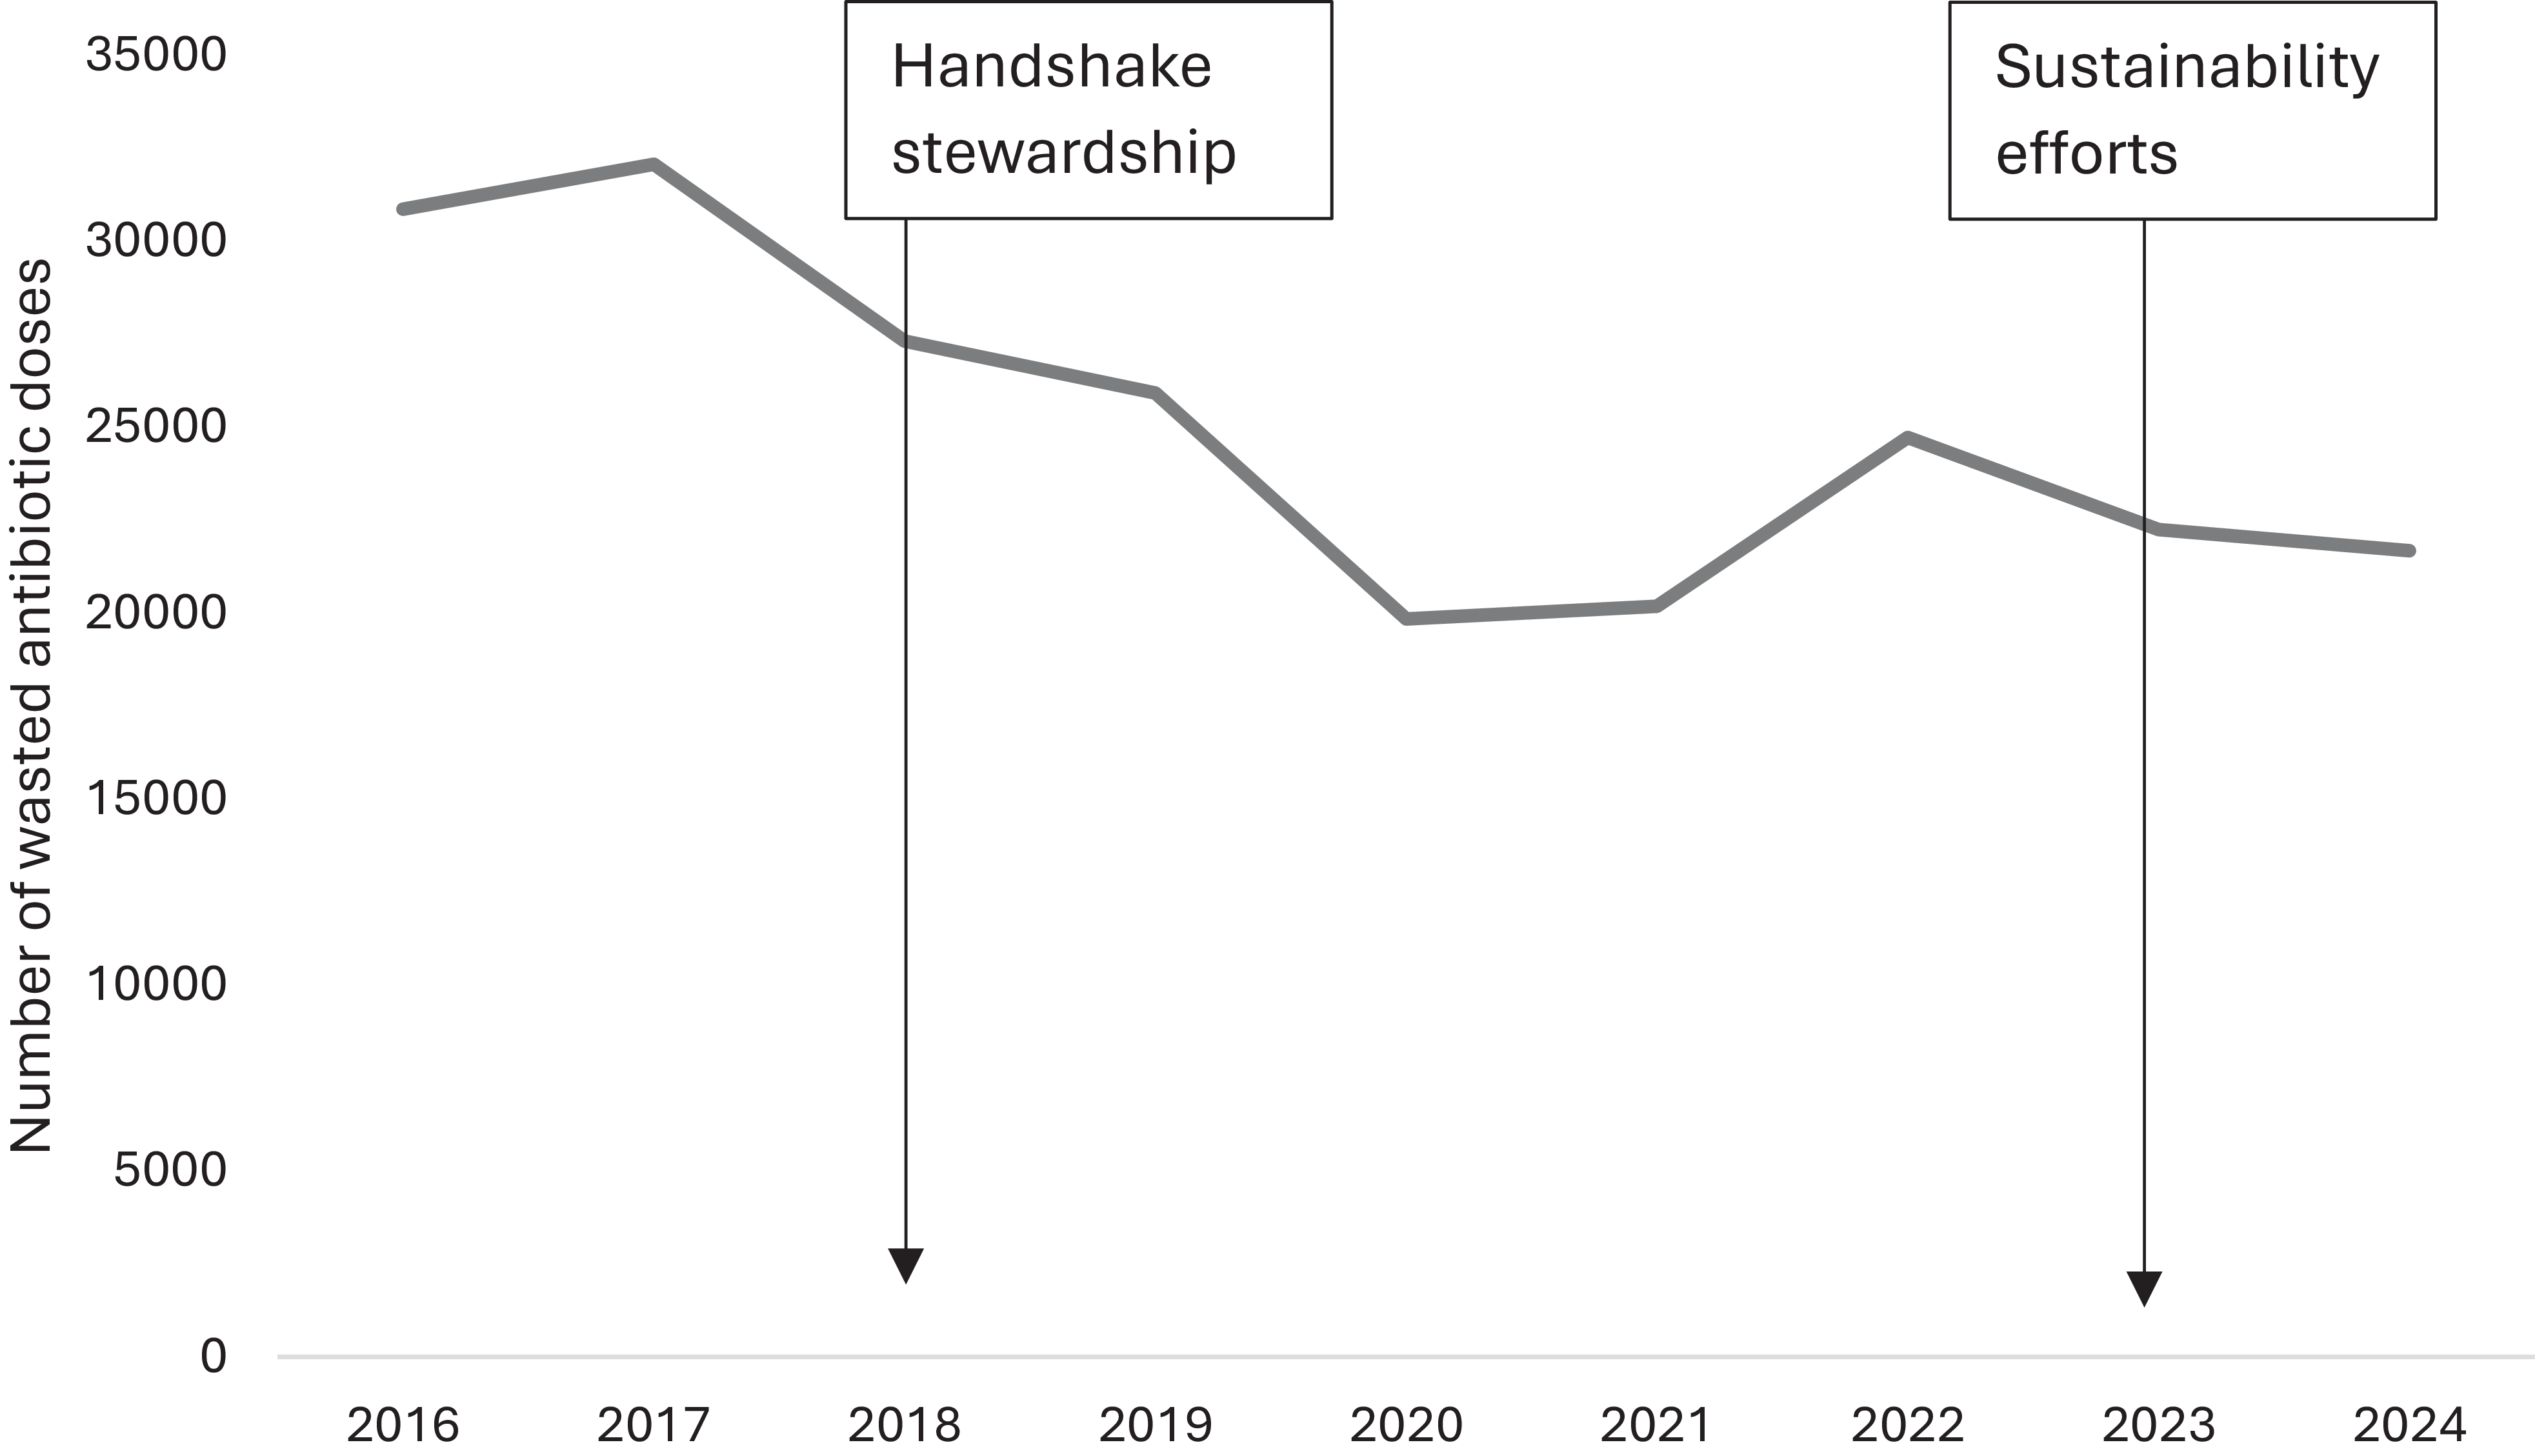
Since inception of our Handshake Rounds in 2018, we have decreased the annual number of wasted antibiotic doses from over 30,000 doses per year to an average of 23,000 doses per year (Figure 3). Wasted doses were calculated by comparing number of doses prepared to administered doses. Using prior internal waste evaluation data, this reduction results in at least $100,000 in savings (Table 1). Similarly, MacBrayne et al estimated an annual financial cost of > $100,000 due to wasted antimicrobials and medical supplies. Reference MacBrayne, Williams and Obermeier23 Our estimates of cost savings are related to hospital drug costs only and do not account for fees paid by the institution to eliminate the drug (typically paying per pound of waste); costs of IV fluids, syringes, or tubing to make the product; or impacts to our environment (eg, increased global warming, increased environmental antimicrobial resistance). Furthermore, drug waste impacts resource utilization, costing time and effort of pharmacy staff to prepare and check drug products, as well as delivery to patient care units, all of which are not captured in this report.
Number of wasted antibiotic doses per year. Legend. The solid dark gray line represents the total number of antibiotic doses wasted each year.

Figure 3. Long description
The line graph illustrates the number of wasted antibiotic doses per year from 2016 to 2024. The x-axis represents the years, ranging from 2016 to 2024, while the y-axis represents the number of wasted antibiotic doses, ranging from 0 to 35000. The solid dark gray line indicates the total number of antibiotic doses wasted each year. The graph shows a peak in 2017, followed by a decline until 2020. There is a slight increase in 2021, followed by another decline. Two significant events are marked: Handshake stewardship in 2018 and Sustainability efforts in 2023. All values are approximated.
Limitations
This work has limitations, though it represents a very pragmatic approach to assessing return on investment for antimicrobial stewardship programs. Hospital spend data was used as a proxy for drug costs, though this method could be problematic due to inclusion of unused or wasted drug and drug purchased but not administered. However, usage trends are monitored (influenced by antimicrobial stewardship efforts) and adjustments to par levels are made. We could not utilize actual drug administration for calculating costs as this was not available for the full time of the evaluation. Additionally, there were changes in purchasing databases during the evaluation that limited granularity of the data. For historical data and projections related to drug expenditures, we attempted to utilize past spending, inflation rates, and rising drug costs to predict expenditures without stewardship, but these are simply projections and actual expenditures in the setting without stewardship efforts are unknown. Additionally, some drugs may have converted to generic during the time frame, which may have influenced drug costs. We recognize some interventions (eg, guidelines and reducing durations of therapy) may result in downstream effects such as reduction in length of stay or hospital admissions, which may decrease hospital revenue, which is complicated, and we do not address here. However, we acknowledge that is what is best for the overall healthcare system and patients.
Conclusion
Hospitals are required by The Joint Commission to have an Antimicrobial Stewardship Program. The main purpose is to improve patient outcomes and safety. However, antimicrobial stewardship programs are well positioned to produce significant cost savings and provide a return on investment for hospitals. Though this summary has not accounted for all work and interventions that contribute to cost savings, it is a snapshot of key measurable interventions, and therefore a conservative estimate. Based on the activities described, our cost savings impact is nearly $5 million annually. Collaboration with others, including provider champions, pharmacy, microbiology, and infection prevention is essential to optimize success.
Acknowledgements
We acknowledge Megan Ose, Director of Pharmacy, for help summarizing annual drug cost expenditures.
We acknowledge Cheryl Singer, Infection Preventionist, for collaboration on obtaining infection data.
Author contribution
Tracy Zembles was responsible for conceptualization of the manuscript, data curation and analysis, methodology, validation and visualization of the data, writing the original draft, and editing of the final version.
Blake Buchan was responsible for conceptualization of the manuscript, data curation and analysis, contribution of resources, and editing of the final version.
Katie Ray was responsible for contribution of resources and editing the final version.
Michelle Mitchell was responsible for conceptualization of the manuscript.
Kelly Graff was responsible for conceptualization of the manuscript, data curation and analysis, methodology, validation of the data, and editing of the final version.
Financial support
None reported.
Competing interests
All authors report no conflicts of interest relevant to this article.
Research transparency and reproducibility.
Authors will consider reasonable requests to share de-identified data.

 Open access

