

1 Introduction
Uncertain risks often pose cognitive and practical challenges, several of which are the focus of this article. Many potentially severe risk outcomes involve small probabilities. Making sensible decisions when dealing with small probabilities of threatening outcomes are difficult for people to assess and complicate regulation. Low-probability events can be reasonably associated with a lack of information about the risk, simply because precise estimates of low probabilities require large samples. This problem is particularly acute for novel risks, such as the fatal risk of terrorist attacks following 9/11, or for nonfatal risks such as lead poisoning for which outcomes become evident long after exposure. The ambiguity of both the risk and understanding of the negative outcomes destabilizes individual decisions and raises the potential for behavioral miscalculations. That people err when making decisions involving such risks may be uncontroversial, but what is important and more controversial is assessing the systematic biases associated with such ambiguous risks. Do people overreact or underreact to these hazards? What are the implications of such biases related to private market failures or pressures for government action?
We demonstrate the challenges posed by ambiguous risks based on original survey results regarding household willingness to pay (WTP) to reduce three publicized risks to drinking water. The three risks considered in Section 2 are the hazards posed by trace amounts of prescription drugs in drinking water, plastic bottles made with the chemical bisphenol-A (BPA), and the crop herbicide atrazine in water supplies. The findings indicate high WTP amounts for reducing these risks as well as substantial WTP values for people who are merely unsure of whether a particular hazard poses a risk to them.
The WTP estimates reflect the public values for reducing these risks. However, whether these values should serve to monetize the benefits of reducing these risks depends on the assessment of whether those values are the same as what the public would express with full knowledge of the risks. Our results show that overresponse to a novel threat is real and could have strong policy implications. However, being guided by immediate reactions can lead to policies that could be inefficient, misdirecting resources that could remediate larger known risks. The overreaction to small risks in the presence of outcome and probabilistic ambiguity may create inordinate pressures for intervention. As discussed in Section 3, risk ambiguity has led to seemingly sensible but ultimately misguided policy prescriptions. Such prescriptions argue it is better to be safe than sorry, that it is safer to be conservative when dealing with ambiguous threats, and that the best policies are ones where we will have no regrets. We propose that these prescriptions are sometimes the opposite of what policymakers should seek. Further, the future aspect of the risks makes the discounting of remote effects of substantial consequence an integral part of a responsible assessment of benefits and costs. Section 4 examines the importance of discounting policies even for temporally remote impacts resulting from uncertain risks. Section 5 concludes.
2 Public pressures to regulate small or uncertain risks
2.1 Behavioral underpinnings of alarmist responses to low probabilities
Much of the impetus for risk regulation stems from public pressures generated by responses to publicized future threats, many of which involve low probabilities.Footnote 2 These risks often have three important dimensions. First, as the risks may pertain to new hazards that impose unexpected losses, the psychological biases involving loss aversion are relevant. The previously accustomed risk level rises, which the public views as a greater risk change than altering the risk of a comparable amount, if from a different, more familiar baseline (Kahneman & Tversky, Reference Kahneman and Tversky1979; Viscusi et al., Reference Viscusi, Magat and Huber1987). Second, small-probability risks called to public attention tend to be overestimated (Fischhoff et al., Reference Fischhoff, Lichtenstein, Slovic, Derby and Keeney1981). Third, if small risks are coupled with potentially severe consequences, people may focus on the adverse outcome and lack the context to incorporate the small probabilities into a sound assessment of expected losses (Kahneman & Tversky, Reference Kahneman and Tversky1979). These concerns with respect to the level of the risk all come into play in driving public support for risk regulation, which in turn creates pressures for government agencies to intervene.
These concerns are illustrated by reactions to publicized risks shown in three previously unpublished surveys. We present an overview of the principal findings here, focusing on measures of household WTP to eliminate three low probability risks with ambiguous probabilities. The risks come from trace amounts of prescription drugs in drinking water, chemicals from water bottles made of BPA, and the presence of the herbicide atrazine in drinking water. For each of these, we will give evidence that the amount people are willing to pay to remove the risks are unreasonably large, and that bias is greatest where there is the most ambiguity about the risks.
2.2 Prescription drug risks
The presence of trace amounts of prescription drugs in drinking water received substantial media attention around the time of the surveys, and has also been the focus of more recent media coverage with respect to the presence of opioids in musselsFootnote 3 as well as cocaine in shrimp.Footnote 4 The survey questions informed respondents the following: “Recent tests conducted by a national news organization found small amounts of prescription drugs in drinking water used by over 40 million Americans. These drugs included painkillers, birth control hormones, and antibiotics. Scientists do not know whether the small doses of these chemicals could cause serious health risks.” The survey offered groups of the 4462 survey respondents who considered this risk a single referendum choice, involving different annual costs to eliminate the risks ranging from $50 to $250. The mean WTP to eliminate the risk among respondents was $157.Footnote 5
Because the survey had four survey administrations between May 2008 and October 2009, respondents had different levels of information available as this story was publicized increasingly in the press. We quantified this press coverage using a Dow Jones research service called Factiva, which can be used to measure news stories by topic. There were 109 national stories on this risk as of May 2008, 220 stories as of August 2008, 258 stories as of December 2008, and 296 stories as of October 2009. We expected increasing news coverage to decrease ambiguity about the risk as it gets additional press coverage without strong evidence of specific harms to identified individuals.
To illustrate the impact of the cumulative news coverage, figure 1 divides the news periods into the early survey period of May and August 2008, and the latter period of December 2008 to October 2009. The vertical axis indicates the percentage of respondents who are willing to pay each of the presented amounts during the different survey time periods indicated in figure 1. At the $50 WTP amount, there is no difference in the percentage of those who are willing to pay that amount to eliminate the risk, which is at 69 % for each group. However, there is an increasing difference in the WTP amounts at later time periods for higher costs of treatment. Those surveyed later have a consistently lower percentage of those who are willing to pay the specified amount. The difference between the percentages of those who have an expressed WTP the survey amount in the two different time periods is four percentage points at $100, five at $150, and six at $200. This effect of additional publicity in reducing WTP values is borne out in multiple regression analyses based on these data.
More press leads to lower WTP to avoid drugs in drinking water.
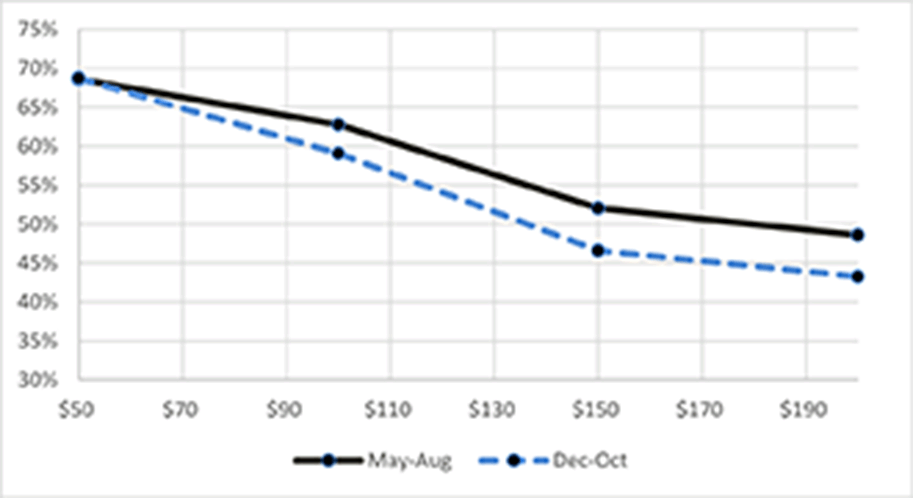
Exposure to more information about a minor hazard reduces the novelty and thus the emotional reaction to the risk described in the survey. That lessened ambiguity or alarm due to greater press coverage has decreased the WTP to remove this risk. Apparently, the press coverage served to put the minor nature of the risk in a better perspective. Depending on its content, press coverage potentially could have the opposite effect of bolstering the degree of the public’s alarm.
2.3 BPA risks
A sample of 2797 respondents considered the risks posed by plastic water bottles containing BPA. The survey informed respondents: “The United States and Canadian governments may declare some plastic water bottles as toxic. These bottles can release a chemical called bisphenol-a into the water inside. This chemical has been shown to cause urinary tract problems and affect hormone levels in laboratory animals even at low levels of exposure.” Respondents considered one of the following annualized WTP amounts: $12, $60, $120, $180, and $240.
Figure 2 indicates the percentage of respondents for each of the risk belief groups who are willing to pay the specified WTP amounts. Those who believe that they are not exposed to the risk are least likely to be willing to pay any of the stated preference amounts.
Risk perceptions increase willingness to contribute for safe water bottles.
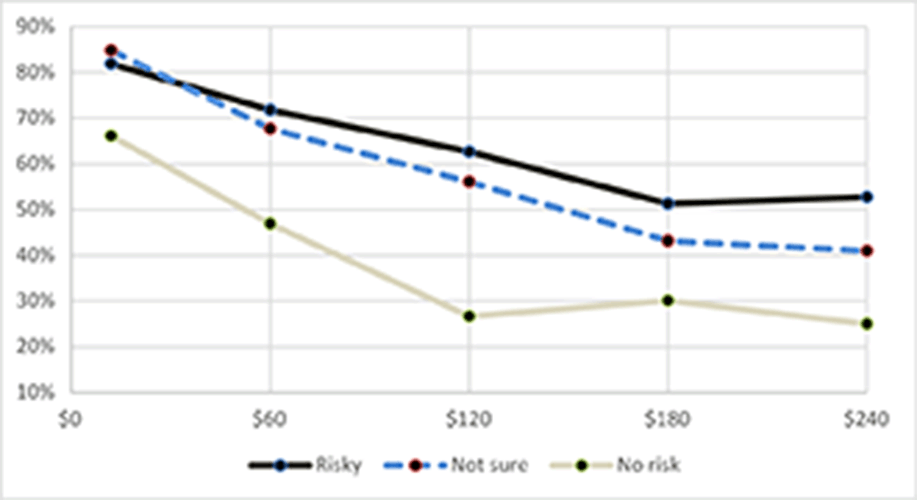
The respondents who are either not sure or who believe that they are exposed to the risk have very similar WTP percentages throughout, with respondents who are not sure if they are exposed to the risk having an even higher percentage who are willing to spend $1 to eliminate the risk, with 85 % of those who are not sure being willing to pay this amount as compared to 82 % who believe that they are exposed to the risk. While the respondents who perceive a risk from BPA have higher percentages that indicate a WTP value at all higher dollar amounts, the patterns for those who perceive a risk and who are not sure if they are exposed to a risk are consistently much closer to each other than the respondents who do not perceive a risk.
The mean estimated risk beliefs follow a similar relative pattern. Despite the low level of risk awareness, the mean annual valuation of elimination of the risk was $159. The annual WTP levels range from $205 for those who believe the chemical affects them and $174 for those who are not sure if they are affected to a low value of $60 for those who do not believe that they are affected by the risk. There is only a modest difference between being uncertain about the risk exposure and believing that there is a risk exposure, compared with those believing they are not exposed.
2.4 Atrazine risks
A different sample of 812 adult respondents considered similar valuations of the risks posed by the herbicide atrazine in drinking water. The survey text noted the following: “Between 2003 and 2008, tests in Illinois, Indiana, Kansas, and Ohio found high concentrations of the weed killer atrazine in drinking water. Atrazine is believed to interfere with the body’s natural production of hormones, and has caused birth defects in laboratory tests on animals.” The survey asked respondents if they were willing to pay $25, $50, $75, or $100 annually to eliminate the atrazine risk. The survey included an additional question for whether they thought the chemical posed risks to them. Only 15 % of the sample indicated “Yes” regarding their personal risk exposure, and the most common responses were that 48 % of the sample indicated that they were not sure if the chemical posed risks to them, and the 37 % who did not think atrazine posed a risk to them.
Figure 3 presents the percentage of respondents who indicate that they are willing to pay each of the treatment amounts for the three different respondent groups: those who believe that atrazine poses a risk to them, those who are not sure if they face a risk, and those who indicate that they do not face a risk from atrazine in drinking water. For each of the valuation amounts, there is a consistent ordering of the amounts that respondents are willing to pay to eliminate the risk. As figure 3 illustrates, the highest WTP values are for those who believe that they are exposed to the risk, the lowest values are for those who do not believe that they are exposed to the risk, and those who are not sure if they are exposed are an intermediate group. The difference in the percentage of those who express a WTP narrows a bit at the $100 payment amount, as 76 % of those who believe that they are exposed to the risk are willing to pay this amount, as compared to 67 % of those who are not sure if they are exposed to the risk and 59 % for those who do not believe that they are exposed to the risk.
Risk perceptions increase WTP to avoid atrazine contamination.
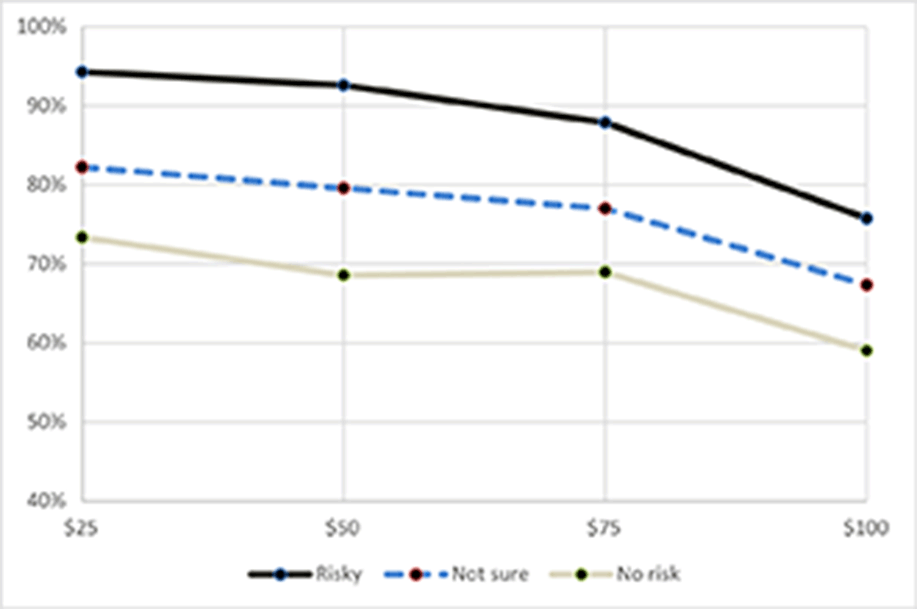
Based on responses to a referendum question involving annual costs from $25 to $100 per year, the mean estimated annual household WTP for a filter that would ensure that this chemical was not in their drinking water was $147. The estimated mean WTP for those who believe that they are exposed to the risk is $229. The WTP of those who are not sure if they are exposed to the risk is $168, or 73 % of the WTP value for those who believe that they are exposed to the risk. Those who do not believe that the risk affects them nevertheless have a positive WTP of $83, which is less than half of the value for those who are not sure if they are affected and nearly one-third of the WTP value for those who do believe that they are at risk. Being unsure of the risk leads to substantial WTP amounts, far greater than the levels expressed by respondents who do not believe that they are exposed.
2.5 Do such small risks warrant policy action?
We do not believe these high respondent estimates are in error. That is, they reflect a natural human response to a new threat about which there is great uncertainty, and even a willingness to incur costs in the face of a claim that they are not personally at risk. That response, even if guided by emotion, is real and is likely to be reflected in attitudes toward regulatory agencies, voting for candidates, or in voter referendums. However, it is likely to result in inefficient policy because it does not consider actual risks or the opportunity cost of instead putting regulatory resources toward projects with higher benefit-to-cost potential. There is a reason that regulatory agencies spend substantial resources getting better information on both the extent of risk and its cost.
To put these WTP values in perspective, a useful metric is to calculate what risk of death would warrant comparable WTP amounts if people had consistent valuations. If we assume that the value of a statistical life (VSL) is $10 million (Viscusi, Reference Viscusi2018), then these WTP levels for the three drinking water risks would be warranted for a fatality risk of 1.57 × 10⁻⁵ for the prescription drug risk, 1.59 × 10⁻⁵ for the BPA risk, and 1.47 × 10⁻⁵ for the atrazine risks. In each instance, the underlying implied risk level is over 1/100,000 annual risk of death for these valuations to be consistent with VSL estimates. Fatality risks of 1/100,000 would imply an annual U.S. death toll from each of these risks equal to 3272. To put this death toll in perspective, 5147 died from all work-related injuries in the USA in 2017. But the implied risk levels associated with the WTP amounts are even greater than the 1/100,000 amount used in this example. The death rate equivalent for prescription drugs would be 5137, the total for BPA would be 5202, and the total for atrazine would be 4810. In effect, each of these risks must be about as deadly as the annual death toll from all job-related fatalities combined based on the level of WTP the respondents express. Such adverse health impacts for each of these drinking water risks appear to be substantially out of line with current risk estimates.
Available evidence regarding these dimly understood risks suggests that the actual death risks are very low. As a result, it is difficult for the public to conceptualize a meaningful risk-money tradeoff. Although media coverage has sounded the alarm for prescription drugs in drinking water,Footnote 6 the comprehensive review by the World Health Organization (2011) found no compelling rationale for additional treatment measures. Pharmaceuticals are sometimes present in drinking water, but the dosages are typically less than a thousandth of the minimum therapeutic dose. Chlorination and other common drinking water treatment methods remove about half of the drugs, but achieving removal rates beyond that requires advanced water treatment processes such as oxidation technologies that are much more expensive. Given the unlikelihood of exposures posing significant risks, the substantial costs of more aggressive removal efforts, and the presence of other waterborne hazards that merit policy attention, the World Health Organization did not recommend policy action to reduce risks from prescription drugs in drinking water nor has there been any Environmental Protection Agency (EPA) policy to regulate these risks to date.
The regulation of plastic bottles and other products also has been more selective. In the year of the survey, Canada became the first country to ban the use of BPA in baby bottles.Footnote 7 In 2012, the Food and Drug Administration (FDA) banned the use of BPA in baby bottles and toddler sippy cups, and eleven states have banned the use of BPA in specified food and drink containers such as pacifiers and reusable food and drink containers.Footnote 8 Given the absence of evidence from reliable studies indicating risks for low-dose exposures to BPA, EPA indicated that even the risks for infants and young children are below the potential health effects level, but Canada undertook its ban on BPA “as a precautionary measure.”Footnote 9 In this situation of risk ambiguity coupled with belief that the magnitude of the risk is low, the FDA, U.S. state governments, and Canada have chosen to regulate the risk based on the possible presence of limited risk evidence rather than making a more substantial investment to determine the magnitude of the risk. This ambiguity-averse policymaking may impose fewer deadweight losses than ambiguity-averse regulation of other hazards, as non-BPA plastics are readily available as substitutes.
Atrazine also has been the subject of media coverageFootnote 10 and analysis by the World Health Organization (2003). EPA has undertaken an ongoing registration review of atrazine and has implemented an ecological exposure-monitoring program.Footnote 11 The efforts monitor about 150 drinking water systems, with the intensity varying seasonally and based on history of atrazine use in the area. Potential policy actions include expansion of the intensive monitoring program, implementation of a mitigation plan, and banning the use of atrazine in the system’s watershed. Thus far, the policy response has been limited and highly targeted.
Consequently, there have been policy initiatives for two of the three low-probability drinking water risks addressed in the survey and even less action against the risks posed by pharmaceuticals in drinking water. In that case, where the assessed risks are quite small and the costs of the additional policy remedies are extremely high, there has been no policy initiative to decrease drug-based exposures. There are also no public analyses that have demonstrated that the benefits exceed the costs for the atrazine and BPA policy actions. However, in those two instances, the policy remedies are more both more certain and less costly than for prescription drugs.
The absence of more substantial policy initiatives for the three drinking water hazards that we considered indicates that despite potential public pressures for eliminating risks, aggressive policy action may not follow. With over 100 million U.S. households with an estimated WTP of about $100 to eliminate each of these risks, there would be public WTP of over $100 million if there were feasible policy options. However, the limits on potentially effective policy responses or high costs associated with them have prevented potential interventions. Nevertheless, in many situations, over-reaction to negligible risks could lead to policies for which there is an inappropriate benefit-cost balance.
For example, consider the median cost per case of cancer prevented for a sample of 99 EPA Superfund sites. Hazardous waste sites usually rank near the top of the public’s environmental concerns. Even using EPA’s conservative upper-bound risk assumptions, the expected cost per cancer case at this set of sites is $10.9 billion (2017$) (Hamilton & Viscusi, Reference Hamilton and Viscusi1999), or roughly 1000 times the pertinent economic value of preventing an expected case of cancer. The public’s ability to overreact to small identified risks can create pressures for policy actions, particularly if they are not required to pass a benefit-cost test.
3 Sensible strategies for dealing with risk ambiguity
3.1 Dealing with the absence of accurate risk assessments
Many risks have magnitudes that are highly uncertain, which is often referred to as risk ambiguity. This ambiguity is common for very small probabilities, such as the drinking water risks, since it takes a large informational base to identify these risks with precision. But there also may be substantial ambiguity with respect to more substantial risks simply because there is less familiarity. After the 9/11 attack, the assessed probability of future terrorist attacks rose, but how high should the assessment of the subsequent risk be? While press coverage dampened the risk beliefs for prescription drug risks in drinking water in a survey context in which people were informed of the risk, media attention often leads to overestimation of small risks (Fischhoff et al., Reference Fischhoff, Lichtenstein, Slovic, Derby and Keeney1981), which may be the case for terrorism risks as well. Government policymakers ideally should not be based on public reactions but on risk assessments that make it feasible to assess the expected net benefits of different policy actions.
These types of risk assessment issues may pose practical problems for government agencies that must make policy decisions in many policy situations in which they may not have precise understanding of the magnitude of the risk or the incremental effect of the policy.
Consider first homeland security. If we relax the Transportation Security Administration (TSA) airport screening requirements, what will be the effect on safety? Homeland security risks pose challenges because the Department of Homeland Security does not believe that it can provide objective assessments of the safety impact of policies as, in the agency’s view, historical data on terrorist attacks cannot be used to reliably estimate current risks or to estimate the marginal impact of proposed regulations such as document requirements.Footnote 12
With respect to food safety, the USDA did not provide a quantitative assessment of the risk reduction effects of regulating beef products to reduce the human risks of mad cow disease because the USDA did not know how BSE causes disease in humans.Footnote 13 Similarly, the FDA did not venture risk assessment with respect to the regulation of selenium in infant formula.Footnote 14 For the risk communication regulation for sunscreen, the FDA similarly did not estimate the magnitude of the risk, but claimed that the regulation “should contribute to reduced exposure to UVB [ultraviolet B] and UVA [ultraviolet A] radiation and thereby reduce the incidence of skin cancer.”Footnote 15
3.2 Problems with assessed risk ranges
Even in situations in which agencies are able to provide a concrete estimate of the risk, the risk range may be daunting and open to irrational responses. The Intergovernmental Panel on Climate Change (2014) estimates that there is a broad range of possible temperature increases between now and the end of the century.Footnote 16 Any such estimates are, of course, complicated by uncertainties regarding future policy and behavioral responses. But even nearer-term air pollution risks may be highly uncertain. Krutilla et al. (Reference Krutilla, Good and Graham2015) document the substantial range of uncertainty in the benefits from a large set of federal air quality regulations. Recent regulatory analyses also indicate broad ranges as in EPA’s estimated reduction in premature mortality from controlling emissions from medium-and heavy-duty engines and vehicles.Footnote 17
Given that there are often substantial risk ambiguities in the underlying scientific evidence, one would also expect the public to have highly uncertain risk beliefs. For example, after the 9/11 attack, surveys of Harvard and Wharton students assessed the number of deaths in the coming year that would result from foreign terrorist attacks involving airplanes or other threats (Viscusi & Zeckhauser, Reference Viscusi and Zeckhauser2005). Their lower-bound estimate at the 5th percentile of the distribution had a median value of 5 deaths and mean value of 80 deaths. Their upper-bound values at the 95th percentile had a median value of 3000 deaths and a mean value of 28,762 deaths. The 50th percentile values had a median of 100 and mean of 396. These broad ranges understate the diffuseness of individual judgments because they exclude the 2.4 % of the sample who envisioned a death toll in excess of 1 million. Even if the government seeks to stabilize risk beliefs around official risk estimates, in the presence of the risk debate involving conflicting experts, there will be a tendency for beliefs to be highly imprecise and to gravitate to the worst-case scenario (Viscusi, Reference Viscusi1997). Risk ambiguity can generate pressures for inefficient policy choices.
The policy ramifications of uncertainty take on additional importance if the adverse policy outcomes are potentially catastrophic. Many outcomes are in line with past patterns of behavior and the potential use of normal distributions to characterize such behavior, as in the case of annual motor-vehicle fatality rates. However, in some instances, there may be extreme events such as black swans or loss outliers that can only be accounted for if the distribution of outcomes is a fat-tailed distribution rather than a less skewed normal distribution (Taleb, Reference Taleb2007; Weitzman, Reference Weitzman2011; Dudley et al., Reference Dudley, Mannix, Perez and Carrigan2019). The possibility of extreme events that can be characterized using fat-tailed distributions is not mere conjecture. The distribution of financial damages stemming from oil spills, such as BP’s Deepwater Horizon spill, has a fat-tailed distribution (Viscusi & Zeckhauser, Reference Viscusi and Zeckhauser2011). Similarly, the distribution of large punitive damages awards is best estimated by fitting a fat-tailed distribution to these awards in order to account for the infrequent possibilities of multibillion dollar awards (McMichael & Viscusi, Reference McMichael and Viscusi2014).
3.3 The policy impact of ambiguity aversion
How the public and government officials react to situations of ambiguity is likely to be governed by the well-established behavioral economics phenomenon known as ambiguity aversion (Ellsberg, Reference Ellsberg1961; Machina & Siniscalchi, Reference Machina, Siniscalchi, Machina and Kip Viscusi2014). Suppose that there are two possible gambles involving the chance of winning some prize. With the certainty option 1, there is a precisely known 0.5 probability of winning the prize. With the uncertain option 2, the player has a subjective probability belief that the chance of winning the prize is also 0.5, but the probability is highly uncertain and could be higher or lower than 0.5. If the game is played only a single time, the player should be indifferent to the options 1 and 2, treating a subjective probability and equivalent objective probability as equivalent. However, a large literature has documented a preference for the precisely known probability. Indeed, even some certain chances of success below 0.5 are preferred to the subjective probability of success of 0.5. This ambiguity aversion for the chance of winning a prize also carries over in many situations to losses as well (Machina & Siniscalchi, Reference Machina, Siniscalchi, Machina and Kip Viscusi2014).
This avoidance of uncertain probabilities carries over to situations in which there is the potential for learning. When dealing with uncertain risks, ambiguous probabilities offer the greatest justification for learning and adaptive behavior. Consider the following two-period example. Suppose that a successful outcome has a payoff of 1 and that there are two periods. If the player chooses the certain probability option 1 in both periods, the total expected payoff is 0.5 + 0.5 = 1. Now consider the uncertain option 2 in the situation in which there is the opportunity to switch if experiences are unfavorable. Let the assessed probability for the uncertain option 2 be governed by a uniform beta distribution. The expected initial expected payoff is 0.5. If the outcome is unsuccessful in the first period, the probability of success in round 2 is reduced to 0.33, making it desirable to switch to the certain option 1. If, however, the first round is successful, the assessed probability of success on option 2 rises to 0.67, making it desirable to stick with the uncertain option 2. The expected payoff over both periods for the uncertain option 2 coupled with adaptive behavior that switches to option 1 after an unfavorable outcome consequently is 0.5 + [0.5 × 0.5 + 0.5 × 0.67] = 1.09.
The underlying principle in this example carries over to policy contexts. In situations of uncertainty about the level of the risk, the optimal strategy often involves holding off from expensive or irreversible actions and instead learning about the risk based on experience, and considering adaptive behavior that involves switching to other policies if the outcomes with the uncertain choice are sufficiently unfavorable (Yakowitz, Reference Yakowitz1969; Dudley et al., Reference Dudley, Mannix, Perez and Carrigan2019). The gains are particularly great for highly ambiguous risks in these multiperiod contexts so that there should be a willingness to adjust to ambiguity in the near term.
Multistage contexts modify ambiguity aversion even in the case of irreversible outcomes. Consider the extreme situation in which an unsuccessful outcome is terminal, as is the case for lotteries involving life and death or some catastrophic environmental calamity. In effect, this termination of the multiperiod decision is an extreme form of irreversibility. Since there is no opportunity to switch after an adverse outcome, is there still a rationale for preferring the uncertain choice? The certain option 1 offers expected rewards over the two periods of 0.5 + 0.5 × 0.5 = 0.75. However, the uncertain option 2 offers expected rewards of 0.5 + 0.5 × 0.67 = 0.84. Increased ambiguity of the risk probability boosts the chance for long-term survival because the uncertain probabilities are revised upward after a success, and the game ends after an unsuccessful outcome. Even if the learning process is costly and in the extreme case in which there is no opportunity for adaptive behavior and switching choices after acquiring adverse risk information, risk ambiguity is a desirable feature in multiperiod choice situations such as those likely to involve deep uncertainty (Viscusi, Reference Viscusi1979). Incentivized experiments demonstrate that people generally fail to exploit the potential gains from exploiting risk ambiguity for sequential lotteries for which the game ends after an unsuccessful outcome (Viscusi & DeAngelis, Reference Viscusi and DeAngelis2018).
If risk ambiguity may be negative in single-period choice situations but can be a desirable feature in multiperiod situations. A frequently advocated policy approach is that of risk conservatism or precautionary principles in which the risk assessment utilizes measures of the upper bound of the risk distribution such as the 95th percentile or the highest concentration level of a chemical.Footnote 18 Although adherents to this approach may provide intuitively appealing rationales, such as that “it is better to be safe than sorry,” there is no analytic justification for these kinds of biases (Cameron & Abouchar, Reference Cameron and Abouchar1991; Sunstein, Reference Sunstein2003).
Further, there are frequent examples of such ambiguity-averse practices in governmental analyses. The pivotal dose-response relationships for inhalation risk exposures at Superfund sites are based on “the upper bound excess lifetime cancer risk estimated to result from continuous exposure to an agent at a concentration of 1 μg/m3 in air.”Footnote 19 Even setting aside the upper-bound aspect of dose-response relationships, Hamilton and Viscusi (Reference Hamilton and Viscusi1999) found that assessment of the risks posed by Superfund sites often rely on upper-bound parameters or exposure amounts as part of the risk assessment. In assessing risks of contaminated fish, EPA recommends a focus on “high-end values” and analyses “designed to provide maximum protection against underestimating risk.”Footnote 20 A similar approach was adopted in an analysis prepared for the FDA to assess the risks of contamination of fish after the BP Deepwater Horizon oil spill. The study also focused on “conservative estimates,” “upper bound consumer lifetime cancer risk,” and a “[b]ias toward safety” (Dickey, Reference Dickey2012). In its assessment of the social cost of carbon, the Interagency Working Group on Social Cost of Greenhouse Gases (2016), prepared estimates using discount rates of 2.5, 3, and 5 %, but only did a sensitivity analysis for differences in risk levels at the upper tail without showing the counterpart results for the lower tail of the risk distribution. For example, in the year 2050, at a 3 % discount rate the social cost of carbon (in 2007$) would be $69, but at the 95th percentile it would be $212. The report did not provide the values at the 5th percentile.
3.4 Does “no regrets” make sense?
Just as some policy advocates recommend the “better to be safe than sorry” approach to risk ambiguity, there also is a similar concern for conservative policies with respect to what might be termed the “no-regrets” approach (Adler et al., Reference Adler, Crews, Georgia, Lieberman, Melugin and Seivert2000; Siegel & Jorgensen, Reference Siegel and Jorgensen2013). Unlike the ambiguity aversion guidance, there are some circumstances in which the “no-regrets” procedure is economically warranted when dealing with economic irreversibilities. It should be noted that the discussion thus far has not excluded the role of irreversible effects because the termination of the sequential decisions after an unsuccessful outcome is an extreme form of irreversibility.
The basic model underlying the “no-regrets” approach was developed by Arrow and Fisher (Reference Arrow and Fisher1974). Consider a development situation in which the benefits of future environmental preservation might have either a high or low value in the future. Erring on the side of underdevelopment relative to what one would do based on the average predicted future value of preservation is desirable because it preserves future options. One can undertake additional development in the future if the benefit of preservation is low, and if the benefit of preservation is high, then having not undertaken substantial development will have proven to be a value-maximizing decision.
While this result is correct, it would be erroneous to conclude that the presence of possible irreversibilities always makes underinvestment desirable. Whether underinvestment is appropriate or not depends on the structure of the irreversibility, how costly it is to alter the investment, and how these costs affect future decisions to decrease or increase the policy investment (Viscusi, Reference Viscusi1988). If there are fixed costs associated with altering the investment in the future, then it may be desirable to invest more now, rather than less. For example, we may want to build larger bridges over interstate highways to accommodate the potential addition of another lane of traffic. Another situation in which overinvestment is warranted is when current policy investments are irreversible and there are rising benefits over time rather than declining benefits. In that situation, it is desirable to undertake a more ambitious policy investment at the present time than would be warranted based on the current benefit levels. Depending on the nature of the irreversibility and the temporal pattern of costs and benefits, erring on the side of caution when dealing with situations involving irreversibilities may be the opposite of the policy prescription that will maximize net social benefits.
4 Proper discounting of future costs and benefits
4.1 Discounting fundamentals
Policies involving uncertain futures necessarily will involve future benefits and/or future costs that must be made comparable to current resource allocations using discounting methods. If r is the rate of discount, then policy impacts in year n are divided by (1 + r) n to convert them into present values. Based on the principal discount rate used in U.S. policy assessments of 3 %, the present value of $1 in benefits occurring next year is $0.97. The present value drops to $0.55 if the benefit is in 20 years, $0.23 if the benefit is in 50 years, $0.05 if the benefit is in 100 years, and $1.45 × 10⁻¹³ if the benefit is in 1000 years. There is an inexorable shrinking of the present value of future benefits as the time period extends farther into the future. Simply not liking the answer that is generated by discounting properly is not a sound rationale for abandoning conventional discounting practices.
Even with proper discounting of distant impacts, benefit levels need not shrink as dramatically as this discount factor trajectory. Underlying the existence of discount rates is that there is capital and labor productivity, making society wealthier over time. If there is a positive income elasticity with respect to the benefit component, the unit benefit values will also be increasing over time at some growth rate g. Because benefits are also increasing, the pertinent net discount rate that accounts for the effect of the rising level of incomes on policy benefits is approximately (1 + r − g) n. An annual growth rate g in benefit values of 2 % would consequently lead to a net discount rate of 1 % so that policy impacts in 100 years would have a weight of 0.37 rather than 0.05.
4.2 The hazards of manipulating discount rates
Such adjustments for rising benefit values reduce but do not eliminate the effect of discounting on future benefits. Advocates of policies with distant benefits may seek a lower discount rate such as zero, or a figure very close to zero. Stern (Reference Stern2007) used a discount rate of 0.1 % in the analysis of the economics of climate change, though other climate change policy advocates have recommended higher discount rates.Footnote 21
Failure to discount at all by using a zero discount rate generates a variety of undesirable effects. First is the consequence that we refer to as the “permanent cost slam dunk.” In a world with no discounting, a $1 loss forever will have an infinite present value, swamping any finite amount of benefits and leading to policy paralysis. Second, if the discount rate is zero and policy options remain unchanged over time, it will always be desirable to defer policies and never take action in the current time period. Not spending the money now will make it possible to invest the money now, earn a rate of return on that investment, and still be able to obtain the same value of benefits and costs at some future date while reaping the rewards of the investment. Third, zero discounting places inordinate weight on providing benefits to future generations, who may be more affluent than current generations if real income continues to increase over time. Zero discounting consequently could increase intergenerational income inequality.
Instead of adopting a zero discount rate, perhaps one might use the standard discount rate r for the current generation and a discount rate r′ for effects on future generations, where r < r′. Suppose that within their generations, both the current and the future generations have a discount rate of r rather than r′. Then our use of a lower discount rate r′ for future generations will place inordinate weight on very distant impacts relative to the value that the future generations themselves place on such effects. The subsequent policy distortions will lead to policy outcomes that are not consistent with the within-generation intertemporal preferences that future generations would have with respect to impacts on their generation.
Concern with distant future generations is not a philosophical abstraction. In its analysis of the merits of storing nuclear wastes in Yucca Mountain, Nevada, EPA used a time frame of 10,000 years, which is longer than the entire period of recorded human history. The U.S. Court of Appeals for the D.C. circuit ruled against the agency, concluding that 10,000 years was too short a period to consider.Footnote 22 At a 3 % interest rate, the pertinent discount factor in 10,000 years is 4.2 × 10−129, so that even very catastrophic effects would drop out of any benefit-cost analysis. Technological advances over the next 100 centuries that enhance our ability to limit any harms from nuclear waste also highlight the unreasonableness of the Court’s approach of insisting on a radiation exposure limit that is less than half of the natural radiation exposure in high altitude cities such as Denver (Viscusi, Reference Viscusi2018).
5 Conclusion
Despite substantial advances in benefit-cost practices for risk and environmental regulations, uncertain future risks continue to pose considerable policy hurdles. Public overreactions to low probability risks may create pressures for agencies to devote resources to less consequential hazards. The substantial ambiguity that often accompanies temporally remote risks justifies opportunities for learning and reaping possible benefits from potentially favorable probabilities that are encompassed in the range of possible risk levels. Policy guidance can exploit this potential, but simple rules of thumb, such as conservatism biases and “no-regrets” policies, tilt decisions in ways that are opposite of the welfare-maximizing approach.
Experimentation with ambiguous risks is often desirable even in situations in which the adverse risk outcome is catastrophic because ambiguous risks can offer the greatest opportunity for long-term survival. Decisions with respect to risks that are both uncertain and may extend far into the future are intrinsically difficult. Continued adherence to sound analytic approaches, such as the use of mean probability estimates and proper application of discounting, provides the best framework for promoting social welfare.


 Open access