


1. INTRODUCTION
During the period 1982–2014, 186 new chemical entities (NCEs) for treating cancer were launched worldwide: about 5.6 new cancer drugs per year.Footnote 1 Moreover, the annual number of new cancer drug launches has been increasing: as shown in Figure 1, the number of new cancer drugs launched during 2005–2014 (76) was 77% larger than the number launched during 1985–1994 (43). In contrast, the number of new drugs for other diseases (e.g. cardiovascular and infectious diseases) launched during 2005–2014 (242) was 42% lower than the number launched during 1985–1994 (417). The acceleration in cancer drug innovation has contributed to sharply increasing cancer drug expenditure: costs of oncology therapeutics and supportive care drugs were $107 billion globally in 2015, an increase of 11.5% over 2014 (on a constant dollar basis) and up from $84 billion in 2010, as measured at invoice price levels. These costs are expected to reach $150 billion globally by 2020 [IMS Institute for Healthcare Informatics (2016, p. 4)].
Number of new cancer drugs and other new drugs launched worldwide, 1985–1994 and 2005–2014. Source: Author's calculations based on IMS Health New Product Focus database “Cancer NMEs” are NMEs in EphMRA/PBIRG Anatomical Classification L (ANTINEOPLASTIC AND IMMUNOMODULATING AGENTS).

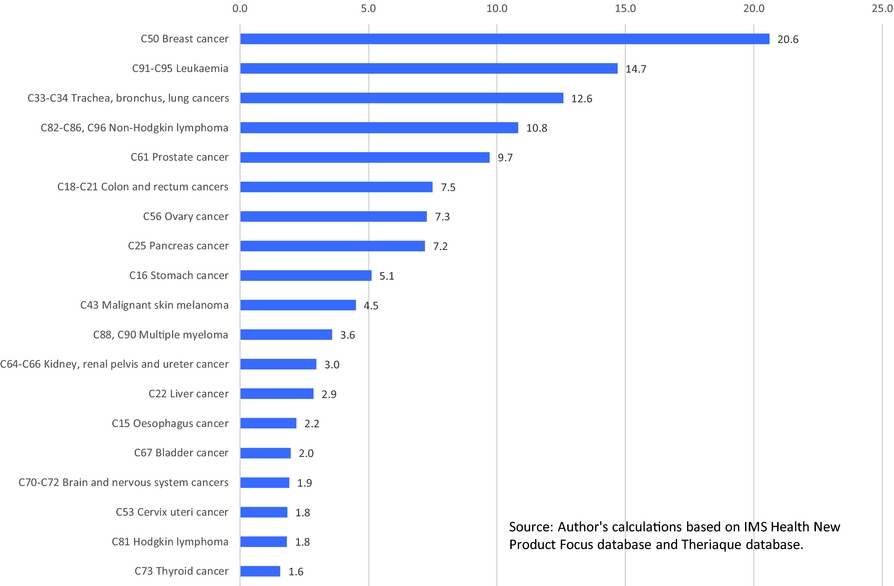
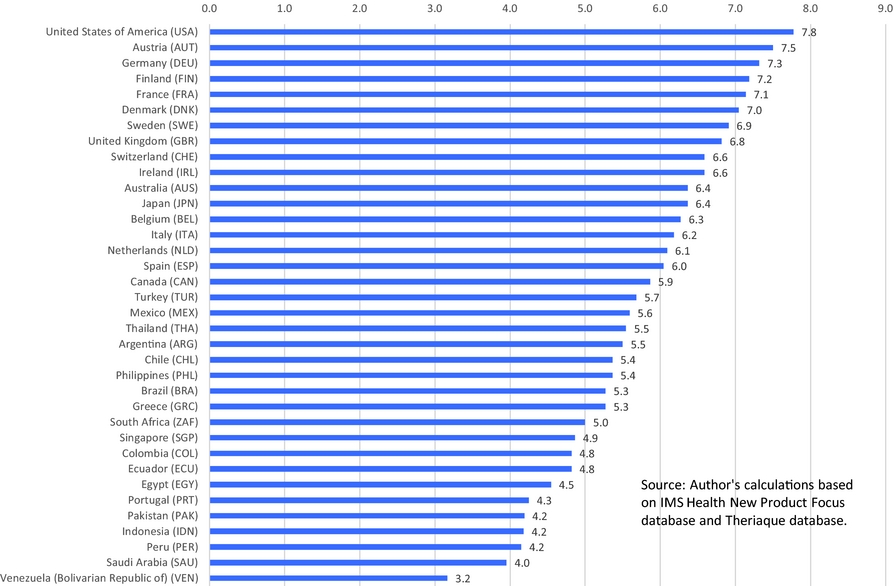
The number of cancer drug launches has varied across cancer sites (breast, lung, colon, etc.). Figure 2 shows the average (across 36 countries) number of drug launches during 1982–2015 for 19 cancer sites.Footnote 2 The average number of launches was greater than 10 for 4 cancer sites (e.g. breast cancer and non-Hodgkin lymphoma), and lower than two for four cancer sites (e.g. thyroid cancer and Hodgkin lymphoma). The number of cancer drug launches has also varied across countries. Figure 3 shows the average (across the 19 cancer sites) number of drug launches during 1982–2015 for 36 countries. The mean number of cancer drugs launched in Canada (5.9) was 24% lower than the mean number of cancer drugs launched in the USA (7.8).
Mean (across 36 countries) number of drug launches, 1982–2015, by cancer site. Source: Author's calculations based on IMS Health New Product Focus database and Theriaque database.
Mean (across 19 cancer sites) number of drug launches, 1982–2015, by country. Source: Author's calculations based on IMS Health New Product Focus database and Theriaque database.
This study seeks to determine the extent to which the number of years of life lost (YLL) due to cancerFootnote 3 in 36 countries in 2015 was reduced by previous launches of new cancer drugs, and to measure the average cost-effectiveness of (cost per life-year gained from) those drugs. Several previous studies [Lichtenberg (Reference Lichtenberg2015, Reference Lichtenberg2016a, Reference Lichtenberg2016b, Reference Lichtenberg2017)] have provided evidence about the mortality impact and cost-effectiveness of new cancer drugs in single (mostly small) countries (Canada, Belgium, Switzerland, and Mexico). These studies employed a difference-in-differences research design: They analyzed, within each country, the correlation across cancer sites between long-run increases in the number of drugs ever launched and mortality changes. All four studies found that new cancer drug launches had a significant negative impact on cancer mortality, and that new cancer drugs were highly cost-effective, according to a standard (based on per capita GDP) endorsed by the World Health Organization (WHO).
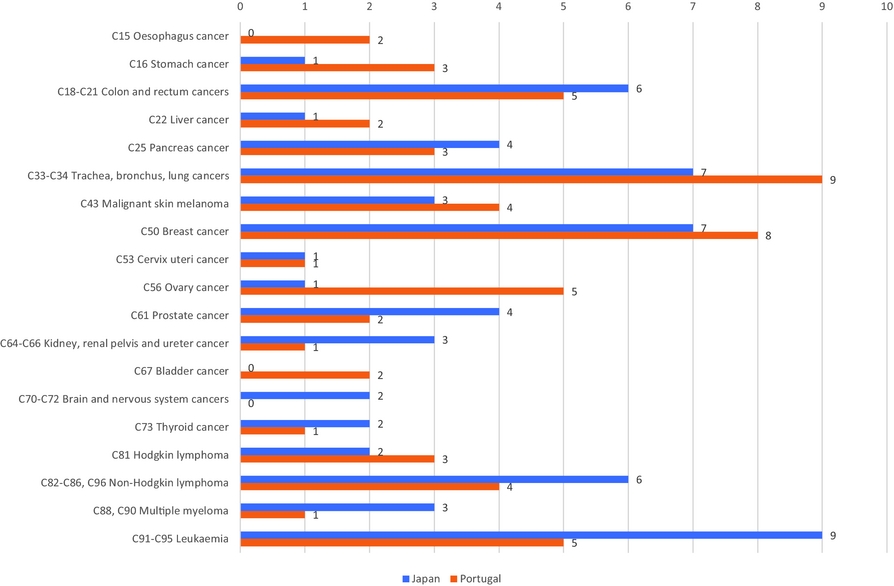
The present study will employ a two-way fixed effects research design [Somaini and Wolak (Reference Somaini and Wolak2016)]: In effect, I will analyze the correlation across countries between relative mortality from each type of cancer in 2015 and the relative number of drugs previously launched in that country to treat that type of cancer, controlling for relative incidence.Footnote 4 The mortality models I will estimate will include both country fixed effects, which control for the average (across cancer sites) level of cancer mortality in each country, and cancer-site fixed effects, which control for the average (across countries) level of mortality from each cancer site. This approach is feasible because the relative number of drugs launched for different types of cancer has varied considerably across the countries. This is illustrated by Figure 4, which shows the number of drugs launched during 2006–2015 in Japan and Portugal for 19 types of cancer.Footnote 5 The mean (across cancer sites) number of drugs launched during 2006–2015 was almost identical in Japan and Portugal (3.3 and 3.2, respectively), but Japan launched four more drugs for leukemia and four fewer drugs for ovary cancer. I will test the hypothesis that a relatively large number of drugs tend to be launched for a cancer site in a country when the relative incidence of cancer at that site in that country is high.
Number of drugs launched during 2006–2015 in Japan and Portugal for 19 types of cancer.
In addition to providing a means of triangulatingFootnote 6 the results of earlier studies, the approach pursued in this study has a number of advantages. First, the sample size (both in terms of number of observations and population covered) of this study is considerably larger. Some of the previous studies were based on about 38 observations (19 cancer sites * 2 years [e.g. 2000 and 2011)]; this study is based on 684 observations (19 cancer sites * 36 countries). The size of the population covered in this study (2,322 million) is almost 13 times as large as the sum of the populations covered by the four previous studies (181 million). Second, a new and improved method of analyzing the lag structure of the relationship between drug launches and life-years lost will be used.Footnote 7 Third, a larger set of measures of the burden of cancer will be analyzed: The number of disability-adjusted life-years (DALYs), the number of years of healthy life lost due to disability, and the number of life-years lost based on the three different age thresholds.
In the next section, I provide background and motivation for the econometric model of life-years lost from cancer, which is developed in Section III. Data sources are discussed in Section IV. Section V provides evidence about the effect of incidence on the number of new drug launches. Cancer mortality model estimates are presented in Section VI. Implications of the results are discussed in Section VII. Section VIII concludes.
2. BACKGROUND AND MOTIVATION
Before describing the econometric model I will use to estimate the effect of new drug launches on life-years lost from cancer, I will provide some theoretical and empirical background and motivation for the model, which can be summarized by the following figure:
Starting on the right of this figure, longevity increase is a very important part of economic growth, broadly defined. Nordhaus (Reference Nordhaus2005) argued that “improvements in health status have been a major contributor to economic welfare over the twentieth century. To a first approximation, the economic value of increases in longevity in the last hundred years is about as large as the value of measured growth in non-health goods and services.” Murphy and Topel (Reference Murphy and Topel2006) estimated that cumulative gains in life expectancy after 1900 were worth over $1.2 million to the representative American in 2000, whereas post-1970 gains added about $3.2 trillion per year to national wealth, equal to about half of GDP. The United Nations’ Human Development Index, which is used to rank countries into four tiers of human development, is a composite statistic of life expectancy, income per capita, and education [United Nations (2017)].
There is a consensus among macroeconomists that technological progress is the principal source of GDP growth. Romer (Reference Romer1990) argued that “growth. . .is driven by technological change that arises from intentional investment decisions made by profit-maximizing agents” (S71). Jones argued that “long-run growth is driven by the discovery of new ideas throughout the world.”Footnote 8 And Chien (Reference Chien2015) said that “it has been shown, both theoretically and empirically, that technological progress is the main driver of long-run growth.”
Since technological progress, or the discovery of new ideas, is the fundamental source of one of the major components—GDP growth—of “human development,” or economic growth, broadly defined, it is quite plausible that the discovery of new ideas has also played a major role in longevity growth. Some previous authors have suggested that this is the case. Fuchs (Reference Fuchs2010) said that “since World War II. . .biomedical innovations (new drugs, devices, and procedures) have been the primary source of increases in longevity,” although he did not provide evidence to support this claim. Cutler et al. (Reference Cutler, Deaton and Lleras-Muney2006) performed a survey of a large and diverse literature on the determinants of mortality, and “tentatively identif[ied] the application of scientific advance and technical progress (some of which is induced by income and facilitated by education) as the ultimate determinant of health.” They concluded that “knowledge, science, and technology are the keys to any coherent explanation” of mortality.
In general, measuring the number of ideas is challenging. One potential measure is the number of patents, but Patterson (Reference Patterson2012, p. 8) noted that only 1% of patent applications made by Bell Labs “generated [commercial] value.” Fortunately, measuring pharmaceutical “ideas” is considerably easier than measuring ideas in general. The measure of pharmaceutical ideas I will use is the number of new molecular entities used to treat a disease launched in a country. Since we have precise information about when those ideas reached the market and the diseases to which they apply, we can assess the impact of those ideas on longevity in a two-way fixed effects framework.
Technological change may be either disembodied or embodied. Suppose firm X invests in R&D, and that this investment results in a valuable discovery. If the technological advance is disembodied, consumers and other firms could benefit from the discovery without purchasing firm X's goods or services; they could benefit just by reading or hearing about the discovery. However, if the technological advance is embodied, consumers and other firms must purchase firm X's goods or services to benefit from its discovery. Solow (Reference Solow, Arrow, Karlin and Suppes1960) argued that “many if not most innovations need to be embodied in new kinds of durable equipment before they can be made effective. Improvements in technology affect output only to the extent that they are carried into practice either by net capital formation or by the replacement of old-fashioned equipment by the latest models. . .”Footnote 9 Romer (Reference Romer1990) also assumed that technological progress is embodied in new goods: “new knowledge is translated into goods with practical value,” and “a firm incurs fixed design or research and development (R&D) costs when it creates a new good. It recovers those costs by selling the new good for a price that is higher than its constant cost of production.” Hercowitz (Reference Hercowitz1998, p. 223) concluded that “‘embodiment’ is the main transmission mechanism of technological progress to economic growth.”
Most scholars agree with Jones’ (1998, pp. 89–90) statement that “technological progress is driven by R&D in the advanced world.” In 1997, the medical substances and devices sector was the most R&D-intensiveFootnote 10 major industrial sector: almost twice as R&D-intensive as the next-highest sector (information and electronics), and three times as R&D-intensive as the average for all major sectors. [National Science Foundation (2017)]. In 2007, 89% of private biomedical research expenditure was funded by pharmaceutical and biotechnology firms, the remaining 11% was funded by medical device firms [Dorsey et al (Reference Dorsey, de Roulet, Thompson, Reminick, Thai, White-Stellato, Beck, George and Moses2010)].
A U.S. government institute (the National Cancer Institute (NCI)) has also played an important role in cancer drug discovery and development.Footnote 11 Frequently, NCI's drug development efforts focus on the unmet needs that are not being adequately addressed by the private sector. NCI's cancer drug discovery and development activities originated from a congressionally mandated initiative known as the Cancer Chemotherapy National Service Center (CCNSC), which, in 1955, established a national resource to facilitate the evaluation of potential anticancer agents. In 1976, the CCNSC's functions were incorporated into the Developmental Therapeutics Program (DTP) in NCI's Division of Cancer Treatment and Diagnosis [National Cancer Institute (2017)].
3. ECONOMETRIC MODEL OF LIFE-YEARS LOST FROM CANCER
To investigate the impact that new drugs launched during 1982–2015 had on the number of YLL from cancer in 2015, conditional on incidence in 2012, I will estimate the following two-way fixed effects model:
 $$\begin{equation}
\begin{array}{@{}l@{}} {\rm{ln}}({Y_{{\rm{sc}}}}) = {\beta _{0 - 4}}{\rm{LAUNCHES}}\_2011\_{2015_{sc}} + {\beta _{5 - 9}}{\rm{LAUNCHES}}\_2006\_{2010_{sc}}\\ \quad \quad \quad \quad \quad + {\beta _{10 - 14}}{\rm{LAUNCHES}}\_2001\_{2005_{sc}}\\ \quad \quad \quad \quad \quad +\, {\beta _{15 - 33}}{\rm{LAUNCHES}}\_1982\_{2000_{sc}}\\ \quad \quad \quad \quad \quad +\, \gamma \;{\rm{ln}}({\rm{CASES}}\_{2012_{sc}}) + {\alpha _s} + {\pi _c} + {\varepsilon _{sc}} \end{array}
\end{equation}$$
$$\begin{equation}
\begin{array}{@{}l@{}} {\rm{ln}}({Y_{{\rm{sc}}}}) = {\beta _{0 - 4}}{\rm{LAUNCHES}}\_2011\_{2015_{sc}} + {\beta _{5 - 9}}{\rm{LAUNCHES}}\_2006\_{2010_{sc}}\\ \quad \quad \quad \quad \quad + {\beta _{10 - 14}}{\rm{LAUNCHES}}\_2001\_{2005_{sc}}\\ \quad \quad \quad \quad \quad +\, {\beta _{15 - 33}}{\rm{LAUNCHES}}\_1982\_{2000_{sc}}\\ \quad \quad \quad \quad \quad +\, \gamma \;{\rm{ln}}({\rm{CASES}}\_{2012_{sc}}) + {\alpha _s} + {\pi _c} + {\varepsilon _{sc}} \end{array}
\end{equation}$$
where Y sc is one of the following variables:
DALYS_2015sc = the number of DALYsFootnote 12 lost due to cancer at site s in country c in 2015.
YLL_2015sc = the number of years of life lost (as measured in the WHO Global Burden of Disease Estimates) due to cancer at site s in country c in 2015.
YLD_2015sc = the number of years lost to disability due to cancer at site s in country c in 2015.
YLL75_2015sc = the number of years of life lost before age 75 due to cancer at site s in country c in 2015.
YLL65_2015sc = the number of years of life lost before age 65 due to cancer at site s in country c in 2015
and
LAUNCHES_2011_2015sc = the number of post-1981Footnote 13 new chemical entities used to treat cancer at site s launched in country c during 2011–2015.
LAUNCHES_2006_2010sc = the number of post-1981 new chemical entities used to treat cancer at site s launched in country c during 2006–2010.
LAUNCHES_2001_2005sc = the number of post-1981 new chemical entities used to treat cancer at site s launched in country c during 2001–2005.
LAUNCHES_1982_2000sc = the number of post-1981 new chemical entities used to treat cancer at site s launched in country c during 1982–2000.
CASES_2012sc = the number of people diagnosed with cancer at site s in country c in 2012.
αs = a fixed effect for cancer at site s.
πc = a fixed effect for country c.
Equation (1) will be estimated by weighted least squares, weighting by Ysc.Footnote 14 The disturbances of equation (1) will be clustered within countries or within cancer sites.
In equation (1), drugs launched in four different periods (0–4 years, 5–9 years, 10–14 years, and 15–33 years before 2015) are permitted to have different effects on mortality or disability in 2015. The model is specified in this way because the effect of a drug's launch on mortality is hypothesized to depend on both the quantity and the quality (or effectiveness) of the drug. Indeed, it is likely to depend on the interaction between quantity and quality: A quality improvement will have a greater impact on mortality if drug utilization (quantity) is high. Drugs launched in the four different periods are likely to vary (in opposite ways) with respect to both quantity (in 2015) and quality. Newer drugs are likely to be of higher quality than older drugs.Footnote 15 On the other hand, utilization of new drugs tends to be much lower than utilization of old drugs.
To provide evidence about the process of diffusion of new medicines, I estimated the following model, using annual data for the period 2010–2014 on global utilization of 80 cancer drugs (molecules):
 $$\begin{equation}
{\rm{ln}}({\rm{N}}\_{\rm{S}}{{\rm{U}}_{mn}}) = {\rho _m} + {\pi _n} + {\varepsilon _{mn}}
\end{equation}$$
$$\begin{equation}
{\rm{ln}}({\rm{N}}\_{\rm{S}}{{\rm{U}}_{mn}}) = {\rho _m} + {\pi _n} + {\varepsilon _{mn}}
\end{equation}$$
where
N_SUmn = the number of standard units of molecule m sold worldwide n years after it was first launched (n = 0, 1,. . ., 17).
ρm = a fixed effect for molecule m.
πn = a fixed effect for age n.
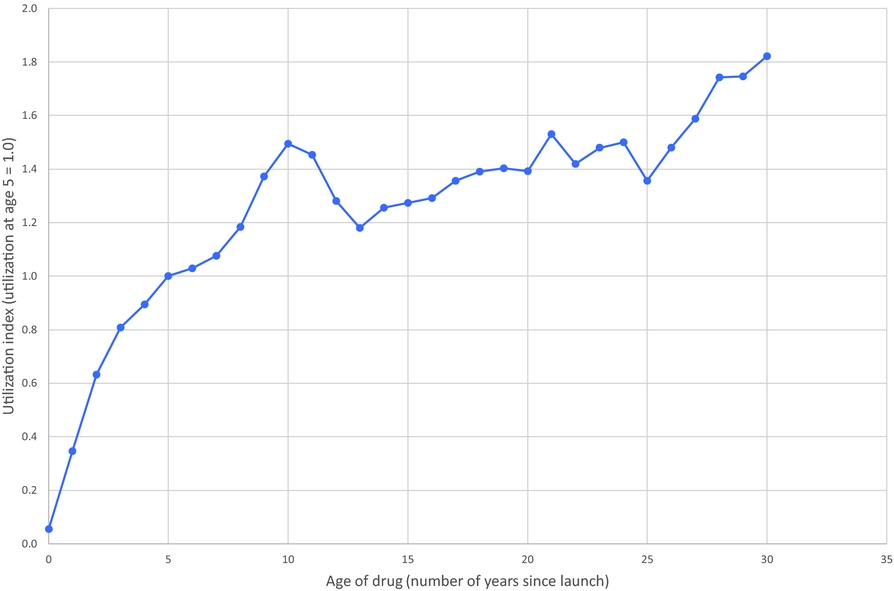
Data on the world launch year of molecule m were obtained from the IMS Health New Product Focus database. Data on the annual number of standard units of molecule m sold worldwide during 2010–2014 were obtained from the IMS Health MIDAS database. The expression exp(πn– π5) is a “relative utilization index”: It is the mean ratio of the quantity of a cancer drug sold n years after it was launched to the quantity of the same drug sold 5 years after it was launched.
Estimates of the “relative utilization index” are shown in Figure 5. These estimates indicate that utilization of a cancer drug is generally increasing, at a decreasing rate, with respect to time since launch. As shown in the following table, mean utilization of a drug is about twice as high 5–9 years after launch as it was 0–4 years after launch:
Cancer drug age-utilization profile.
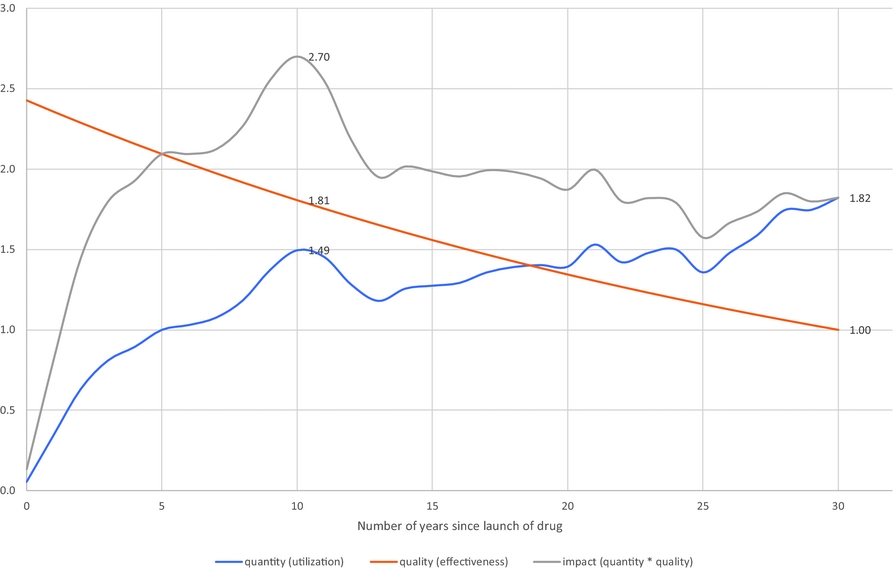
If the quality of later vintage drugs is greater than the quality of earlier vintage drugs, the relationship between the age of a drug (number of years since launch) and its impact on mortality (which depends on quality * quantity) may have an inverted-U shape.Footnote 16 This is illustrated by Figure 6, which is based on the assumption that drug quality increases at a constant 3% annual rate with respect to vintage (e.g. a drug launched in 2018 is 3% better than a drug launched in 2017). Under this assumption, the drugs that have the largest impact on mortality are those that were launched 10 years before. Their impact would be 48% larger than that of drugs that were launched 30 years before, despite the fact that their utilization is 18% lower, because their quality is 81% higher.Footnote 17
Hypothetical quantity, quality, and impact (= quantity * quality) of a drug when quality increases at a 3% annual rate with respect to launch year.
4. DATA AND DESCRIPTIVE STATISTICS
Data on DALYs, YLL, and years lost due to disability (YLD) were obtained from the WHO Global Health Estimates 2015: Disease burden by Cause database [World Health Organization (2016a)].Footnote 18 Data on years of potential life lost before ages 75 and 65 were constructed using the data obtained from the WHO Global Health Estimates 2015: Deaths by Cause database [World Health Organization (2016b)].
That source provides data on the number of deaths by 5-year age group, cancer site, country, and year. I assume that all the deaths in an age group occur at the midpoint of the age group, e.g. deaths in age group 65–69 occur at age 67.5. Data on the number of patients diagnosed, by cancer site, country, and year, were obtained from GLOBOCAN 2002 [Ferlay et al. (Reference Ferlay, Bray, Pisani and Parkin2004), a computer software package] and GLOBOCAN 2012 [International Agency for Research on Cancer (2017b)].
Summary statistics for the 19 major cancer sites in the 36 countries we analyzeFootnote 19 are shown in Table 1. In 2015, 76.6 million DALYs were lost. Ninety-five percent of this loss was due to premature mortality, rather than to disability. The number of DALYs increased by 12% between 2005 and 2015. However, the number of patients diagnosed 3 years earlier increased by 28%.Footnote 20 Therefore, the number of DALYs per patient diagnosed declined by 16% (= 28%–12%). The number of years of potential life lost before age 65 per patient diagnosed declined by even more: 25% (= 28%–3%).
Summary Statistics, 19 Major Cancer Sites in 36 Countries
Source: Author's calculations based on WHO Global Health Estimates 2015: Disease burden by Cause database [World Health Organization (2016a)]; WHO Global Health Estimates 2015: Deaths by Cause database [World Health Organization (2016b)]; GLOBOCAN 2002 [Ferlay et al (Reference Ferlay, Bray, Pisani and Parkin2004)]; and GLOBOCAN 2012 [International Agency for Research on Cancer (2017b)].
Data on drugs with indications for different types of cancer were obtained from the Thériaque database [Centre National Hospitalier d'Information sur le Médicament (2017)]. These data are shown in Appendix Table A.2.
Data on drug launch years, by molecule and country, were obtained from the IMS Health New Product Focus database. These data are shown in Appendix Table A.3. A blank cell indicates that the drug had not been launched in that country by the end of 2015.
Data on the annual number of standard units of cancer drugs sold worldwide during the period 2010–1014, by molecule, were obtained from the IMS Health MIDAS database.
5. THE EFFECT OF INCIDENCE ON THE NUMBER OF NEW DRUG LAUNCHES
As discussed in the introduction, estimation of the two-way fixed effects model of life-years lost [equation (1)] is feasible because the relative number of drugs launched for different types of cancer varies across countries, as illustrated by Figure 4. Why did Japan have more leukemia drug launches, but fewer ovary cancer drug launches, than Portugal? Previous studies have shown that both innovation (the number of drugs developed) and diffusion (the number of drugs launched in a country) depend on market size. Acemoglu and Linn (Reference Acemoglu and Linn2004) found “economically significant and relatively robust effects of market size on innovation.” Danzon et al (Reference Danzon, Richard Wang and Wang2005) found that “countries with lower expected prices or smaller expected market size experience longer delays in new drug access, controlling for per capita income and other country and firm characteristics” (emphasis added).
The hypothesis that the number of drug launches is influenced by market size can be investigated in a two-way fixed effects framework by estimating the following equation:
 $$\begin{equation}
{\rm{N}}\_{\rm{LAUNCHES}}\_2003\_{2012_{sc}} = \sigma {\rm{ln}}({\rm{CASES}}\_{2002_{sc}}) + {\alpha _s} + {\delta _c} + {\varepsilon _{sc}}
\end{equation}$$
$$\begin{equation}
{\rm{N}}\_{\rm{LAUNCHES}}\_2003\_{2012_{sc}} = \sigma {\rm{ln}}({\rm{CASES}}\_{2002_{sc}}) + {\alpha _s} + {\delta _c} + {\varepsilon _{sc}}
\end{equation}$$
where
N_LAUNCHES_2003_2012sc = the number of drugs to treat cancer at site s launched in country c during 2003–2012.
CASES_2002sc = the number of patients diagnosed with cancer at site s in country c in 2002.
The estimate of σ is positive and significant: estimate = 0.1872; standard error = 0.0662; Z = 2.83; p-value = 0.0047. This signifies that larger relative market size (number of patients diagnosed) increases the relative number of drugs launched.
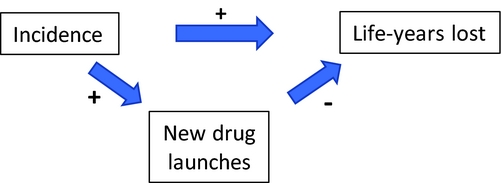
These findings are broadly consistent with the notion that “misery loves company” [Lichtenberg and Waldfogel (Reference Lichtenberg and Joel2009)]: The relative number of drugs launched for a cancer site in a country is higher when the relative incidence of that cancer is greater. As illustrated by Figure 7, the direct positive effect of incidence on mortality may be partially offset by an indirect negative effect, via increased drug launches.
Direct and indirect effects of incidence on life-years lost.
6. CANCER MORTALITY MODEL ESTIMATES
Estimates of parameters of equation (1) are presented in Table 2; to conserve space, estimates of 19 cancer-site fixed-effects (αs) and 36 country fixed effects (πc) are not shown. Rows 1–5 show estimates of equation (1) when the dependent variable is ln(DALYS_2015sc).Footnote 21 The estimate (in row 1) of β0–4 is not statistically significant. This indicates that new drugs launched during 2011–2015 did not have a significant impact on the number of DALYs in 2015. This is not surprising since, as shown in Figure 5, utilization of a drug tends to be quite low during the first few years after it was launched. Moreover, there is likely to be a lag of several years between the utilization of a drug and its impact on mortality. The estimate (in row 2) of β5–9 is negative and highly significant (p-value < 0.0001). This indicates that new drugs launched during 2006–2010 had a highly significant negative impact on the number of DALYs in 2015. One additional drug for a cancer site launched during 2006–2010 is estimated to have reduced the number of 2015 DALYs due to cancer at that site by 5.8%. The estimates (in rows 3 and 4) of β10–14 and β15+ are also negative and highly significant (p-value < 0.0187), but their magnitudes are about 45% of the magnitude of β5–9.Footnote 22 One additional drug for a cancer site launched during 1982–2005 is estimated to have reduced the number of 2015 DALYs due to cancer at that site by about 2.6%. The smaller magnitudes of β10–14 and β15+ may be due to lower quality (or effectiveness) of earlier-vintage drugs, and to left-censoring of the drug launch data. Panel A of Figure 8 is a graph of the point estimates and 95% confidence intervals of the estimates in rows 1–4. Row 5 of Table 2 shows the estimate of the coefficient γ on the incidence variable, ln(CASES_2012sc). As expected, this coefficient is positive and highly significant (p-value < 0.0001); the fact that it is significantly less than 1 may be partly attributable to errors in the measurement of incidence.Footnote 23,Footnote 24
Estimates of two-way fixed effects Model of life-years lost [equation (1)]
N ≈ 684 (36 countries * 19 cancer sites).
Estimates in bold are statistically significant (p-value < 0.05).
Disturbances are clustered within cancer sites.
Estimated effects of new drug launches on DALYs and YLL65 in 2015. Vertical scale is inverted. Solid markers indicate significant (p-value < 0.05) estimates, hollow markers indicate insignificant estimates.
When we include the log of the number of cases in 2002 (ln(CASES_2002sc)) as well as the log of the number of cases in 2012 in the model, the coefficient on ln(CASES_2002sc) is not statistically significant (estimate = 0.064; Z = 1.35; p-value = 0.177); the sum of the incidence coefficients is almost identical to the coefficient in row 5 of Table 2; and the estimates of the drug launch coefficients are virtually unchanged. Incidence is highly serially correlated: the estimate of κ from the weighted (by CASES_2012sc) regression ln(CASES_2012sc) = κ ln(CASES_2002sc) + αs + πc + εsc is 0.778 (Z = 15.58; p-value < 0.0001). When we include both ln(CASES_2002sc) and ln(CASES_2012sc) in the model, and exclude both LAUNCHES_2001_2005sc and LAUNCHES_1982_2000sc, the estimate of β0–4 is far from significant, and the estimate of β5–9 remains highly significant (p-value = 0.0013) and is slightly smaller than the estimate in row 2 of Table 2 (estimate = −0.051; Z = 3.22).
Rows 6–10 of Table 2 show estimates of equation (1) when the dependent variable is ln(YLL_2015sc). The estimates of this equation are very similar to the estimates of the ln(DALYS_2015sc) equation in rows 1–5. This is not surprising since, as noted above, 95% of DALYs were due to premature mortality, rather than to disability. Rows 11–15 of Table 2 show estimates of equation (1) when the dependent variable is ln(YLD_2015sc). The only drug launch coefficient that is statistically significant (p-value = 0.0254) is β15+, it implies that one additional drug for a cancer site launched during 1982–2000 reduced the number of years lost to disability due to cancer at that site in 2015 by 2.4%.
Rows 16–20 and 21–25 of Table 2 show estimates of equation (1) when the dependent variable is ln(YLL75_2015sc) and ln(YLL65_2015sc), respectively. The estimates are qualitatively similar to those in rows 1–5 and 6–10: The estimate of β0–4 is insignificant, the estimates of the other launch coefficients are all negative and significant, and the magnitudes of β10–14 and β15+ are significantly smaller than the magnitude of β5–9. But the magnitudes of β5–9, β10–14, and β15+ are larger in rows 16–20 and 21–25 than they are in rows 1–5 and 6–10. For example, as shown in row 22, one additional drug for a cancer site launched during 2006–2010 is estimated to have reduced the number of years of potential life lost before age 65 due to cancer at that site in 2015 by 10.0%. Panel B of Figure 8 is a graph of the point estimates and 95% confidence intervals of the estimates in rows 21–24.
The estimates in Table 2 are based on data for 36 countries, including the United States. I estimated similar models using data for 35 countries, i.e. excluding the United States. These estimates are shown in Table A.5. The magnitude of the point estimates based on the U.S.-excluded sample are generally about 15% smaller than the magnitude of the point estimates based on the full sample (although some are larger), and the U.S.-excluded estimates are somewhat less significant. However, most of the estimates continue to be highly significant (p-value < 0.04), and the basic pattern of the estimates remains: DALYs and life-years lost are unrelated to drug launches 0–4 years earlier, and inversely related to drug launches at least 5 years earlier, especially to drug launches 5–9 years earlier.
7. DISCUSSION
By combining the estimates in Table 2 with other data, we can estimate the number of life-years gained (i.e. the reduction in life-years lost) in 2015 attributable to previous new drug launches. We can also estimate expenditure in 2015 on these drugs, so we can obtain estimates of an important indicator of cost-effectiveness: pharmaceutical expenditure per life-year gained.
Due to limitations of the available data, we can estimate (under reasonable assumptions) expenditure in 2015 on drugs launched during 2006–2010, but we cannot estimate expenditure in 2015 on drugs launched during earlier periods. Therefore, although the estimates in Table 2 indicate that drugs launched before 2006 as well as those launched during 2006–2010 reduced the number of life-years lost in 2015, I will only provide estimates of the cost-effectiveness in 2015 of drugs launched during 2006–2010.Footnote 25
Calculations of the number of life-years gained in 2015 from, and of the cost-effectiveness of, drugs launched during 2006–2010 are shown in Table 3. The first column shows the calculations for the first disease burden measure: DALYs. Row 1 shows the point estimates of the β5–9 coefficients from Table 2. Row 2 of Table 3 shows the weighted mean value of LAUNCHES_2006_2010, weighted by the corresponding disease burden measure. The average number of drugs launched during 2006–2010 for a cancer site was about 1.5. Row 3 shows the log-change in 2015 life-years lost due to LAUNCHES_2006_2010 [=β5–9 * mean(LAUNCHES_2006_2010)]. The estimates imply that drugs launched during 2006–2010 reduced the number of cancer DALYs by about 8.4% [=−(exp(−0.087) – 1)]. As shown in row 4, there were 88.1 million DALYs from all types of cancer in the 36 countries in 2015. The estimates imply that, in the absence of new drug launches during 2006–2010, there would have been 8.04 million additional DALYs. Similar calculations in columns 2–4 imply that, in the absence of new drug launches during 2006–2010, there would have been 8.28 million additional YLL (YLL at all ages), 4.51 million additional YLL75 (YLL before age 75), and 2.52 million additional YLL65 (YLL before age 65).
Calculation of pharmaceutical expenditure per life-year gained
Additional calculations indicate that drugs launched during the entire 1982–2010 period reduced the number of cancer DALYs in 2015 by about 23.0%, and that, in the absence of new drug launches during 1982–2010, there would have been 26.3 million additional DALYs in 2015. Also, the nine countries with the largest number of drug launches during 1982–2010 (weighted by the coefficients in rows 2–4 of Table 2) are estimated to have had 14% fewer cancer DALYs (controlling for incidence) in 2015 than the nine countries with the smallest number of drug launches during 1982–2010.
Calculations of 2015 expenditure on drugs launched during 2006–2010 are shown in rows 6–13. As shown in row 6, according to the IMS Institute for Healthcare Informatics (2016, p. 4), “the total [global] cost of oncology therapeutics and supportive care drugs rose from $90 billion in 2011 to $107 billion in 2015, measured at invoice price levels.”Footnote 26 The 36 countries in our sample accounted for 78% of world pharmaceutical expenditure in 2014 (row 7); I assume that they also accounted for 78% of world oncology drug expenditure in 2015, so I estimate the 36-country cost of oncology therapeutics and supportive care drugs in 2015 to be $83.1 billion (= 78% * $107 billion; row 8). This is an estimate of expenditure in the 36 countries in 2015 on all cancer drugs, i.e. drugs launched in all previous years. To estimate expenditure on cancer drugs launched during 2006–2010, we should multiply this estimate by the fraction of 2015 expenditure that was on drugs launched 5–9 years earlier. Data on expenditure in 2015, by molecule and country, are not available, but data on expenditure in 2010, by molecule and country, are available for 31 of the 36 countries from the IMS MIDAS database. As shown in row 9, those data indicate that about one-sixth (16%) of 2010 pharmaceutical expenditure was on drugs launched in the respective country 5–9 years earlier (i.e. during 2001–2005).Footnote 27 Assuming that the same fraction applies to 2015 cancer drug expenditure, 2015 expenditure in the 36 countries on cancer drugs launched during 2006–2010 was $13.5 billion (=16% * $83.1 billion; row 10). This is an estimate of expenditure by, or on behalf of, all cancer patients, i.e. patients of all ages. To calculate cost per-life year gained before ages 75 and 65, we require estimates of the fractions of cancer drug expenditure by, or on behalf of, cancer patients below ages 75 and 65. According to GLOBOCAN 2012, globally 76% of cancer patients are diagnosed before age 75, and 52% are diagnosed before age 65 [International Agency for Research on Cancer (2017b); row 11]. I therefore assume that 76% of cancer drug expenditure was on patients below age 75, and 52% of cancer drug expenditure was on patients below age 65 (row 12). These estimates may be conservative (i.e. overestimates), because some drug expenditure on a patient diagnosed before age x may occur after the patient is older than age x.
Estimates of the cost-effectiveness measure—the ratio of estimated 2015 expenditure on drugs launched during 2006–2010 (row 12) to the reduction in 2015 life-years lost due to those drugs (row 5)—are shown in row 13. The estimated cost per life-year gained ranges between $1,635 (life-years gained at all ages) and $2,820 (life-years gained before age 65). These estimates are similar to those obtained in three previous country-specific studies (Belgium: €1,311 [Lichtenberg (Reference Lichtenberg2016a)]; Mexico $2,146 [Lichtenberg (Reference Lichtenberg2017)]; Canada: $2,730 [Lichtenberg (Reference Lichtenberg2015)]), it is well below the estimate obtained in one country-specific study (Switzerland: $21,228–$28,673 [Lichtenberg (Reference Lichtenberg2016b)]).
As noted by Bertram et al (Reference Bertram, Lauer, De Joncheere, Edejer, Hutubessy, Kieny and Hill2016), authors writing on behalf of the WHO's Choosing Interventions that are cost-effective project (WHO-CHOICE) suggested in 2005 that “interventions that avert one DALY for less than average per capita income for a given country or region are considered very cost–effective; interventions that cost less than three times average per capita income per DALY averted are still considered cost–effective.” Population-weighted average per capita income (GDP) in the 36 countries in 2015 was $US 21,359, so these estimates indicate that the new drugs launched during 2006–2010 were very cost-effective, overall.
Two considerations suggest that the figures in row 13 of Table 3 may overestimate the true net cost per life-year gained. First, those estimates are based on drug cost measured at invoice price levels, but “cancer medicines are subject to different types of off-invoice discounts, rebates and price concessions based on how the medicines are reimbursed or administered to patients” [IMS Institute for Healthcare Informatics (2016, p. 26)].Footnote 28 Second, a previous study based on U.S. data [Lichtenberg (Reference Lichtenberg2014)] showed that about 25% of the cost of new drugs (for all diseases) is offset by reduced expenditure on old drugs.Footnote 29
8. SUMMARY
Several previous studies have provided evidence about the mortality impact and cost-effectiveness of new cancer drugs in single (mostly small) countries, by employing one kind of two-way fixed effects research design: they analyzed, within each country, the correlation across cancer sites between long-run increases in the number of drugs ever launched and mortality changes. This study has employed a different kind of two-way fixed effects research design to measure the mortality impact and cost-effectiveness of cancer drugs: it analyzed the correlation across 36 countries between relative mortality from 19 types of cancer in 2015 and the relative number of drugs previously launched in that country to treat that type of cancer, controlling for relative incidence. The sample size (both in terms of the number of observations and the population covered) of this study was considerably larger than the sample sizes of previous studies; a new and improved method of analyzing the lag structure of the relationship between drug launches and life-years lost was used; and a larger set of measures of the burden of cancer was analyzed. We showed that the relative number of drugs launched for a cancer site in a country is positively related to relative market size (number of patients diagnosed).
DALYs and life-years lost are unrelated to drug launches 0–4 years earlier. This is not surprising, since utilization of a drug tends to be quite low during the first few post-launch years. Moreover, there is likely to be a lag of several years between utilization of a drug and its impact on mortality. However, mortality is significantly inversely related to the number of drug launches at least 5 years earlier, especially to drug launches 5–9 years earlier. One additional drug for a cancer site launched during 2006–2010 is estimated to have reduced the number of 2015 DALYs due to cancer at that site by 5.8%; one additional drug launched during 1982–2005 is estimated to have reduced the number of 2015 DALYs by about 2.6%. Lower quality (or effectiveness) of earlier vintage drugs may account for their smaller estimated effect.
When the United States is excluded from the sample, the magnitude of the point estimates is generally about 15% smaller than the magnitude of the point estimates based on the full sample (although some are larger), and the U.S.-excluded estimates are somewhat less significant. However, most of the estimates continue to be highly significant (p-value < 0.04), and the basic pattern of the estimates remains.
The estimates implied that drugs launched during 2006–2010 reduced the number of cancer DALYs in 2015 by about 8.7% and that, in the absence of new drug launches during 2006–2010, there would have been 8.04 million additional DALYs lost due to cancer in the 36 countries. The estimates also implied that, in the absence of new drug launches during 2006–2010, there would have been 4.51 million additional YLL before age 75, and 2.52 million additional YLL before age 65.
We also estimated that drugs launched during the entire 1982–2010 period reduced the number of cancer DALYs in 2015 by about 23.0%, and that, in the absence of new drug launches during 1982–2010, there would have been 26.3 million additional DALYs lost in 2015. Also, the nine countries with the largest number of drug launches during 1982–2010 are estimated to have had 14% fewer cancer DALYs (controlling for incidence) in 2015 than the nine countries with the smallest number of drug launches during 1982–2010.
Estimates of the cost per life-year gained in 2015 from drugs launched during 2006–2010 ranged between $1,635 (life-years gained at all ages) and $2,820 (life-years gained before age 65). These estimates are similar to those obtained in previous country-specific studies of Belgium, Canada, and Mexico, and are well below the estimate obtained in one study of Switzerland.
Mortality in 2015 is strongly inversely related to the number of drug launches in 2006–2010. If the relationship between mortality in 2020 and the number of drug launches in 2011–2015 is similar, drug launches 5–9 years earlier will reduce mortality even more (by 9.9%) between 2015 and 2020 than they did (by 8.4%) between 2010 and 2015.
Appendix
Number of drugs launched during 2006–2015, by country and cancer site
Post-1981 drugs indicated for different types of cancer
Drug launch years
Complete estimates of ln(DALYS_2015) model
Estimates of two-way fixed effects model of life-years lost [equation (1)] based on sample excluding the USA


 Open access