


Introduction
Parties’ policy positions are germane to voting behaviour. They help citizens to distinguish the different alternatives available on the ballot and base their voting decision on these grounds. However, the importance of policy for vote choice significantly varies across countries. When parties offer clear ideological platforms, they become more consequential for voters, who can easily identify the closest alternative to their interests. In contrast, when party platforms become diluted, voters are less likely to find ideological differences across options and, as a result, to cast a ballot based on policy positions.
Previous studies considering the impact of electoral systems on ideological voting point to interparty dimension dynamics, whereby the permissiveness of the electoral rules determines the number and position of the pool of parties that voters must choose from. Whereas proportional representation (PR) systems foster the presence of small political forces dispersed throughout the ideological space, majoritarian electoral rules are generally associated with two parties positioned at the centre of the voter distribution (Cox, Reference Cox1997; Calvo and Hellwig, Reference Calvo and Hellwig2011). The expected impact of the electoral system on the number, placement, and dynamics of the parties affects the importance of policy positions for voters’ choice (Norris, Reference Norris2004; Kedar, Reference Kedar2005; Lachat, Reference Lachat2008, Reference Lachat2011; Singh, Reference Singh2010).
An important, related, and yet less explored question is whether the intraparty dimension of electoral systems has any noteworthy effect on ideological voting. Drawing on Carey and Shugart’s (Reference Carey and Shugart1995) insights, we develop a new account of this phenomenon that focuses on the incentives to cultivate a personal vote created by electoral rules. We argue that ballot structure and district magnitude influence the incentives for voters to weigh on policy positions. In candidate-centred systems, voters can consider not only parties’ ideological platforms but also politicians’ valence. In contrast, party-centred systems hinder the importance of candidates’ characteristics for vote choice, giving more weight to parties’ ideological positions. The number of candidates on the ballot reinforces these effects.
By examining how the intraparty dimension of electoral systems has an impact on ideological voting, we aim to bridge three strands of literature that have not been sufficiently connected in the past. First, we speak to the comparative electoral systems research that has mostly concentrated on the supply-side elements of non-ideological voting, such as candidates’ attributes (Shugart et al., Reference Shugart, Valdini and Suominen2005; Dahlgaard, Reference Dahlgaard2016) or legislators’ style (Bowler and Farrell, Reference Bowler and Farrell1993; Pilet et al., Reference Pilet, Freire and Costa2012; André et al., Reference André, Depauw and Deschouwer2016). We turn our attention to the less explored demand side and focus on voters’ reactions to these elements. In this stream of research, the closest to ours is von Schoultz and Papageorgiou (Reference Von Schoultz and Papageorgiou2021), who show the importance of policy positions for Finnish candidates to attract personal votes. Second, we contribute to the voting behaviour studies that find that macro-level factors such as ideological polarization condition the impact of left-right party placements on vote choice (Pardos-Prado and Dinas, Reference Pardos-Prado and Dinas2010; Fazekas and Méder, Reference Fazekas and Méder2013). Much of this literature examines these patterns controlling for the role of the electoral system, but few works explicitly investigate the impact of aspects like the provision of incentives to cultivate a personal vote. Finally, we provide a parsimonious explanation for the cross-national variation in ideological voting across democratic elections. In contrast with previous research focussed on one particular country (e.g., Blumenau et al., Reference Blumenau, Eggers, Hangartner and Hix2017), our work tests the consistency of the effect of ballot structure on ideological voting across countries and how it depends in turn on the number of candidates on the ballot.
To pursue the goal of the article, we turn to the five waves of the Comparative Study of Electoral Systems (CSES [https://cses.org/]) and show that there is a link between the intraparty dimension of electoral systems and the impact of ideological identifications on vote choice within the context of democratic elections. We confirm an important, yet unaddressed, implication of Carey and Shugart’s personal vs. party vote-seeking theory by providing evidence that voters weigh policy less heavily in candidate-centred than in party-centred systems.
The rest of the article proceeds as follows. The ‘Left-right ideology and electoral rules’ section and ‘The impact of the intraparty dimension on ideological voting’ section discuss the relevant literature and develop our theoretical argument. The ‘Data and methods’ section describes the data and methods employed in the empirical analyses, and the ‘Empirical results’ section assesses the explanatory power of our hypotheses. The ‘Conclusions’ section concludes.
Left-right ideology and electoral rules
According to spatial models of politics, the policy preferences of voters and parties can be represented by points within an ideological space (Hinich and Munger, Reference Hinich and Munger1994). This space can be characterized by a left-right continuum, which captures the different preferences over taxes, social welfare policies, and state intervention in the economy. The left-right dimension does not represent the entire ideological space for political competition, and it leaves out some relevant issues that parties may exploit during campaigns. However, this metric helps us conceptualize how parties organize and voters behave on the ballot in most contexts. In the original formulation of the theory, citizens evaluate parties relying entirely on their policy platform and choose the closest alternative to their ideological position (Downs, Reference Downs1957). In this case, voters deterministically maximize their utility by considering only a long-term factor such as party ideology.
Alternative, and sometimes complementary, explanations of electoral behaviour relax the assumption of party ideology as the only determinant of vote choice. Some scholars consider that voters’ decisions can be perturbed by short-term factors that make them not always pick the closest party to their ideological position (Hinich, Reference Hinich1977; Adams, Reference Adams1999). Within this framework, voters’ decisions are not exclusively based on a systematic comparison of parties’ policy platforms, but they also consider other factors such as candidates’ valence or non-policy endowments (Stokes, Reference Stokes1963; Schofield, Reference Schofield2003; Lachat, Reference Lachat2011; Calvo and Murillo, Reference Calvo and Murillo2019). The more important these factors become, the more likely voters are to adopt a ‘fast and frugal’ decision (Lau and Redlawsk, Reference Lau and Redlawsk2006) based on factors such as name recognition, incumbency, charisma, or perceptions of competence (Groseclose, Reference Groseclose2001; Stone and Simas, Reference Stone and Simas2010).
Previous studies considering the impact of electoral systems on ideological voting point to the concentration or dispersion of authority across parties. Within this framework, conventional wisdom suggests that policy positions weigh more on voters’ choices under PR rules than in majoritarian systems (Dalton, Reference Dalton1985; Huber and Powell, Reference Huber and Powell1994). Political competition in majoritarian systems is expected to happen between two parties that appeal to as many citizens as possible and move their platforms towards the median voter’s position (Duverger, Reference Duverger1951; Downs, Reference Downs1957; Cox, Reference Cox1997). By contrast, PR systems often have multiple parties which disperse themselves along the policy space. Past studies have shown that voters rely more on policy orientations in systems with a low threshold of representation, which tends to produce multiple, ideologically distinguishable parties (Lachat, Reference Lachat2011; Belchior, Reference Belchior2013). A different group of works suggests that the importance of party platforms and the number of parties in PR systems make voters behave strategically and weigh more heavily on their coalition preferences rather than their party preferences (Kedar, Reference Kedar2005).
In this article, we rather explore how ideological voting depends on the concentration or dispersion of power within parties (Shugart, Reference Shugart, Gallagher and Mitchell2005). Previous studies on the intraparty dimension focus on the incentives that electoral systems create to cultivate a personal vote, or ‘that portion of a candidate’s electoral support which originates in his or her personal qualities, qualifications, activities, and record’ (Cain et al., Reference Cain, Ferejohn and Fiorina1987: 9). The incentives to cultivate a personal vote are present throughout the whole electoral process. First, at the nomination stage, the probability that a legislator will display personal vote-earning attributes (PVEAs) increases the higher (lower) the average district magnitude is in the case of open (closed) lists (Shugart et al., Reference Shugart, Valdini and Suominen2005). Second, at the polling booth, local profiles are effective PVEAs to mobilize votes in cases of candidate-centred rules, while they do not matter when party-centred rules are employed (Nemoto and Shugart, Reference Nemoto and Shugart2013).
Despite the growing interest in the intraparty dimension, previous research has largely neglected its potential impact on citizens’ reliance on ideological criteria when voting. We expect that the intraparty dimension of electoral systems affects the relevance of candidates’ attributes vis-à-vis the importance of party policy as a driving force of vote choice. Our theoretical expectations, described below, focus on the two main components of the electoral system that define the incentives to cultivate a personal vote: ballot structure and district magnitude (Carey and Shugart, Reference Carey and Shugart1995).
The impact of the intraparty dimension on ideological voting
The idea that citizens’ political attitudes and behaviour may largely depend on contextual features has gained importance in recent times (e.g., Pardos-Prado and Dinas, Reference Pardos-Prado and Dinas2010). Among these features, scholars traditionally assume voting behaviour to be strongly affected by the institutional context in which elections take place (Kedar, Reference Kedar2005; Dassonneville et al., Reference Dassonneville, Hooghe and Lewis-Beck2017). Building on these works, our main argument is that party-centred electoral rules prime citizens to decide their vote based on perceptions of parties’ ideology at the national level. In contrast, candidate-centred electoral rules lead voters to focus on issue positions or personal characteristics of the politicians that run for office at the district level. These considerations are interdependent and can be conceived as a network of voters’ predispositions that connect them with future agents of representation.
Our hypotheses build on two ideas that are in our view consensual in the electoral systems literature. First, we argue that parties’ ideology is more important for vote choice in party-centred than in candidate-centred electoral systems. The latter type is characterized by nominal voting (i.e., votes are for individual candidates) and intraparty competition (i.e., co-partisans contend for being among the most voted candidates from their party). Second, these divergent effects across systems depend on the number of candidates at the district level. More local candidates are thought to amplify (further decrease) how widely voters recognize their names and the level of intraparty competition between them in candidate-centred (party-centred) systems, lowering (increasing) the electoral relevance of the ideology of their party.
In party-centred systems such as closed-list PR, leaders present a fixed list of names that constituents may not disturb, laying stress on parties’ ideological positions while relegating the characteristics of district-level candidates to a minor role (Carey and Shugart, Reference Carey and Shugart1995). Since the chances of being selected in the first place depend almost exclusively on party leaders, the internal ideological cohesion and discipline of parties are expected to be higher in these systems (Hix, Reference Hix2004; Carey, Reference Carey2007). Voters also know that candidates in these contexts are more likely to ideologically align themselves with their party and, even in case of potential discrepancies, toe the party line in parliament (Galasso and Nannicini, Reference Galasso and Nannicini2015). The combination of these facts makes voters choose among groups of candidates whose legislative behaviour, provided they are elected, will be guided most likely by some shared ideological principles. As a result, they are most likely to support the party that minimizes the distance between their ideological position and the array of offered policy platforms.
In contrast, under candidate-centred rules, politicians that run for office try to distinguish themselves from their co-partisans by highlighting personal attributes other than party ideology (Bowler and Farrell, Reference Bowler and Farrell1993). Even when the policy positions of the parties are still relevant under these rules (von Schoultz and Papageorgiou Reference Von Schoultz and Papageorgiou2021), they are weaker predictors of legislative behaviour than in party-centred rules (Kitschelt and Smyth, Reference Kitschelt and Smyth2002). Since politicians’ re-election in candidate-centred systems does not depend exclusively on the leaders’ decision to re-select them, there are fewer incentives to keep a high level of party unity in parliaments than under party-centred electoral systems (Crisp et al., Reference Crisp, Escobar-Lemmon, Jones, Jones and Taylor-Robinson2004). Voters are aware of these legislative patterns and adjust their electoral choice accordingly. Hence, our main hypothesis is that party ideology is more likely to influence voting behaviour under party-centred than under candidate-centred electoral rules (H1).
Next, we turn to a second factor that is expected to modify voters’ ideological connection with parties: the number of candidates in each constituency. Here again, we provide an intraparty reasoning that could justify the differences observed across electoral systems. In party-centred systems, voters have limited influence at the ballot box insofar as they lack institutional mechanisms to reward or punish individual legislators. Only candidates at the top of the lists can arguably become the focal point in voters’ minds, and the importance of the characteristics of district-level candidates decreases markedly as we go further down on the list. The relevance of candidates’ personal characteristics in party-centred systems is a function of the district size for two main reasons. First, the number of parties that run increases when the number of seats at stake goes up (Cox, Reference Cox1997). Second, in party-centred systems, the number of non-salient candidates per list increases with district size, and a large group of candidates will be eventually elected despite being practically unknown by the bulk of the electorate. The only piece of information about them that is readily available for the average voter is their party’s ideology. Hence, we would expect the effect of parties’ ideology on vote choice in party-centred systems to be greater in large rather than in small districts.
The expected effect of district size in candidate-centred systems comes from two opposing forces. On the one hand, as district magnitude increases, parties tend to nominate more candidates (Shugart and Taagepera, Reference Shugart and Taagepera2017), and politicians need to differentiate themselves from a higher number of rival parties and co-partisans by emphasizing their personal characteristics rather than the party label (Carey and Shugart, Reference Carey and Shugart1995). The lack of ideological cohesion in party delegations composed of a large number of candidates leads voters to support partisan alternatives that do not represent a coherent set of political interests. If this is the case, the opportunities to vote for a candidate that does not necessarily follow the ideological position of her party will increase.
On the other hand, candidates running in open-list PR and single transferable vote (STV) systems also have incentives to campaign around the party’s ideology. Large districts dilute the personal connection between voters and candidates, increasing the value of the party label as a heuristic cue to voters (Katz, Reference Katz1980). STV rules induce collaboration among co-partisans to exhort their supporters to express subsequent preferences for other candidates in the party (Marsh, Reference Marsh, Bowler and Grofman2000). Similarly, in an open-list PR system, the votes of all the candidates in the list are pooled, increasing the benefits of the collective efforts made by the co-partisans (Nemoto and Shugart, Reference Nemoto and Shugart2013). Taking all this into account, the incentives for intraparty coordination may cancel out the temptation for candidates to deviate from the party’s ideology in large districts. Moreover, previous evidence has shown that voters in non-closed list PR systems first select which party they will vote for and then select among the candidates of that party (Marsh, Reference Marsh2007; Van Holsteyn and Andeweg, Reference Van Holsteyn and Andeweg2010). Finally, high district magnitude drives up, not only the number of candidates, but also the number of parties. If we apply an interparty logic (e.g., Lachat, Reference Lachat2008; Singh, Reference Singh2010), the expected effect of an increasing number of candidates at the district level under candidate-centred rules could be concealed by the existence of a higher number of parties.
To sum up, we argue that the effect of a high number of candidates on the importance of party ideology for vote choice differs across electoral systems. In closed-list PR systems, voters should be even less likely to choose a party further away from their ideological position as the number of candidates increases. By contrast, the negative relationship between the number of candidates and ideological voting should be weaker under candidate-centred electoral rules, where candidates have competing incentives to cultivate a personal vote and promote the party brand. Therefore, we hypothesize that under party-centred electoral rules, the effect of party ideology on voting behaviour increases with the number of alternatives on the ballot (H2a) and that under candidate-centred rules, ideological voting decreases with the number of alternatives on the ballot (H2b). The size of the former effect is expected to be stronger than the latter.
Data and methods
Case selection and operationalization
Our analysis uses information from the five waves of the Comparative Study of Electoral Systems (CSES) program. This project includes a battery of comparable questions made after national elections in more than 50 countries and a considerable variation in terms of electoral systems. To make the cases comparable, we examine legislative elections that take place in democratic countries according to Przeworski et al.’s (Reference Przeworski2000) criteria. This leaves us with the responses of 204,404 individuals across 164 elections in 51 countries. Figure A1 in the online Appendix provides further information about the elections and countries considered in this article. In our sample of different electoral systems, the country-election mean district magnitude ranges between 1 and 250, and the grand average and standard deviation are 26.46 and 39.14, respectively. Excluding single-member district systems, the two party-centred and candidate-centred systems with the lowest average district magnitude in our sample are Norway and Chile respectively, while the two countries with the highest averages in this regard are Serbia and Brazil.Footnote 1
The dependent variable builds on a survey question asking respondents for the party they supported in the last Lower House elections.Footnote 2 In line with existing literature on vote choice, we stack our data to obtain a structure defined at the level stemming from the interaction of individual ideological distance to each party and electoral system (Van der Eijk et al., Reference van der Eijk, van der Brug, Kroh and Franklin2006). Therefore, vote ij takes value 1 if respondent i declares having voted for alternative j and 0 otherwise. Respondents who either did not participate in the elections or cast an invalid or a blank ballot are coded as missing. Moreover, we can only consider a recorded vote for one of the nine main parties according to CSES data because we lack information on the left-right placement of other parties.
Our main independent variable, distance ij, measures the linear distance between the respondent’s ideological position and the correspondent party placement on a 0 (left) through 10 (right) scale in absolute terms. One limitation of the analysis is the reliance on a single dimension to conclude the extent to which voters make choices that are driven by ideology and utility maximization. Moreover, if the importance of non-left-right dimensions was correlated with the use of candidate-centred rules, it might be that the effect of the intraparty electoral rules on the level of ideological voting was overestimated. For these reasons, we replicate all main analyses by using the information on alternative dimensions of competition provided by the CSES dataset.
To evaluate whether the strength of ideological voting varies across electoral systems, we interact our main independent variable with two institutional features. First, party-centred is a dichotomous variable that takes value 1 whether parties present an ordered list of candidates, that is, in case of either closed- or flexible- list PR (albeit in the case of the latter voters have some room to change the ranking provided by the party), and 0 otherwise (i.e., in the case of open-list PR, STV, the alternative vote, two-rounds majority, First-Past-the-Post, and mixed systems). The main data sources for this variable are Bormann and Golder (Reference Bormann and Golder2013) and Passarelli (Reference Passarelli2020).
Alternatively, we use Shugart’s (Reference Shugart2001) and Farrell and McAllister’s (Reference Farrell and McAllister2006) indices as continuous scorings of electoral systems on the intraparty dimension (for a summary, see Söderlund Reference Söderlund2016). These scorings also interact with left-right distance. Since higher values of these indices mean an increasing level of candidate-centredness in the electoral system in question, we expect the sign of the coefficient of the interactions to be positive.
Second, we consider the number of potential representative agents that run in each district for a given election, that is, the total number of candidates on the ballot at the district level. We do so by combining the degree of fragmentation of the party system with the potential number of candidates nominated in every list. In other words, our indicator multiplies the number of district-level lists times the district magnitude. We expect marginal changes in this variable to be more relevant when the number of candidates is small than when it is large. Therefore, to account for this potential non-linearity in the effect, we take the natural logarithm of this variable.
Furthermore, to properly test the role of the number of candidates, we need to include a triple interaction between this variable, the ballot structure variable, and the left-right distance. The estimated coefficient should be negative because we expect the impact of ideological distance on vote choice to be the highest in the case of a high number of candidates at the district level and party-centred systems (H2a). In contrast, the estimated coefficient for the interaction between the (logged) number of candidates at the district level and left-right distance should be positive because it captures how the former modifies the effect of the latter on vote under candidate-centred rules (H2b). Apart from most mixed systems and all single-member districts countries, in 14 election studies of the sample, magnitude does not vary across districts. Since according to our operationalization, the size of lists is constant across districts in those cases, we are unable to distinguish the effect of the number of candidates from other election-specific features. As a result, we keep these country-years out of the main analyses concerning H2.
In the main models, we decide to opt for a parsimonious strategy, and we leave out of the main estimations all control variables. However, we further assess the robustness of our results by conducting several additional analyses that involve the introduction of multiple control variables at the micro (female, age, education, and evaluation of national leaders), the meso (party family), and the macro (presidentialism, ethnic fragmentation, party system fractionalization, democratic age and level, economic growth, and national income) levels.Footnote 3
Estimation technique
To test our hypotheses, we rely on two alternative econometric models. The first estimates the respondent’s utility for each party as a function of the characteristics of each alternative. Then we transform those utilities as choice probabilities following the conditional logit framework (McFadden, Reference McFadden1973). All our specifications include standard errors clustered by election to account for the correlation of the errors within country-year. Online Appendix D describes in detail the intuition behind this technique.
Our second approach uses three-level hierarchical linear models with random intercepts by respondent and election. While the results from this method are very similar to those produced by our conditional logits, the mixed linear models have the advantage of being more flexible in the estimation of the relevant interaction effects.
Empirical results
Figure 1 displays the average marginal effects from an alternative-specific conditional logistic specification (dichotomous operationalization) and two hierarchical linear models (continuous scorings) to test our first theoretical expectation.Footnote 4 Consistent with the proximity voting model, respondents’ left-right distance to one party always decreases the probability of voting for it. However, this pattern is seriously conditioned by the intraparty dimension of the electoral system (Hypothesis 1). According to the evidence displayed in the first panel, the marginal effect of left-right distance declines from .049 to .044 when we move from closed or flexible list-PR systems to any other type of electoral rule. Likewise, the two other panels indicate that, when we pass from closed to open lists or the STV, the effect of left-right distance decreases by .01 and .005 points, respectively. Open-list PR and the STV are the two most candidate-centred systems according to Shugart (Reference Shugart2001) and Farrell and McAllister (Reference Farrell and McAllister2006), respectively.
Average Marginal Effects of Left-right Party-respondent Absolute Linear Distance by Type of Ballot Structure on Vote Choice, Alternative Specific Conditional Logit and Hierarchical Linear Models
Note: Figure 1 displays the average marginal effects with 95% confidence intervals of left-right party-respondent absolute linear distance on vote choice across different types of ballot structure. In the first dichotomous operationalization of the core electoral system variable, candidate-centred include all electoral systems but closed- and flexible-list PR; this is a conditional logistic model with fixed effects by respondent and cluster standard errors by election. For the exact coding of cases in the second and third operationalizations, see Table A2 in the Appendix; these are three-level hierarchical linear models with random intercepts by election and respondent. The simulations are based on the estimates from Tables B1 and B2 in the Appendix. When provided, the histogram in the background summarizes the distribution of respondents across the different categories of the electoral systems variables.

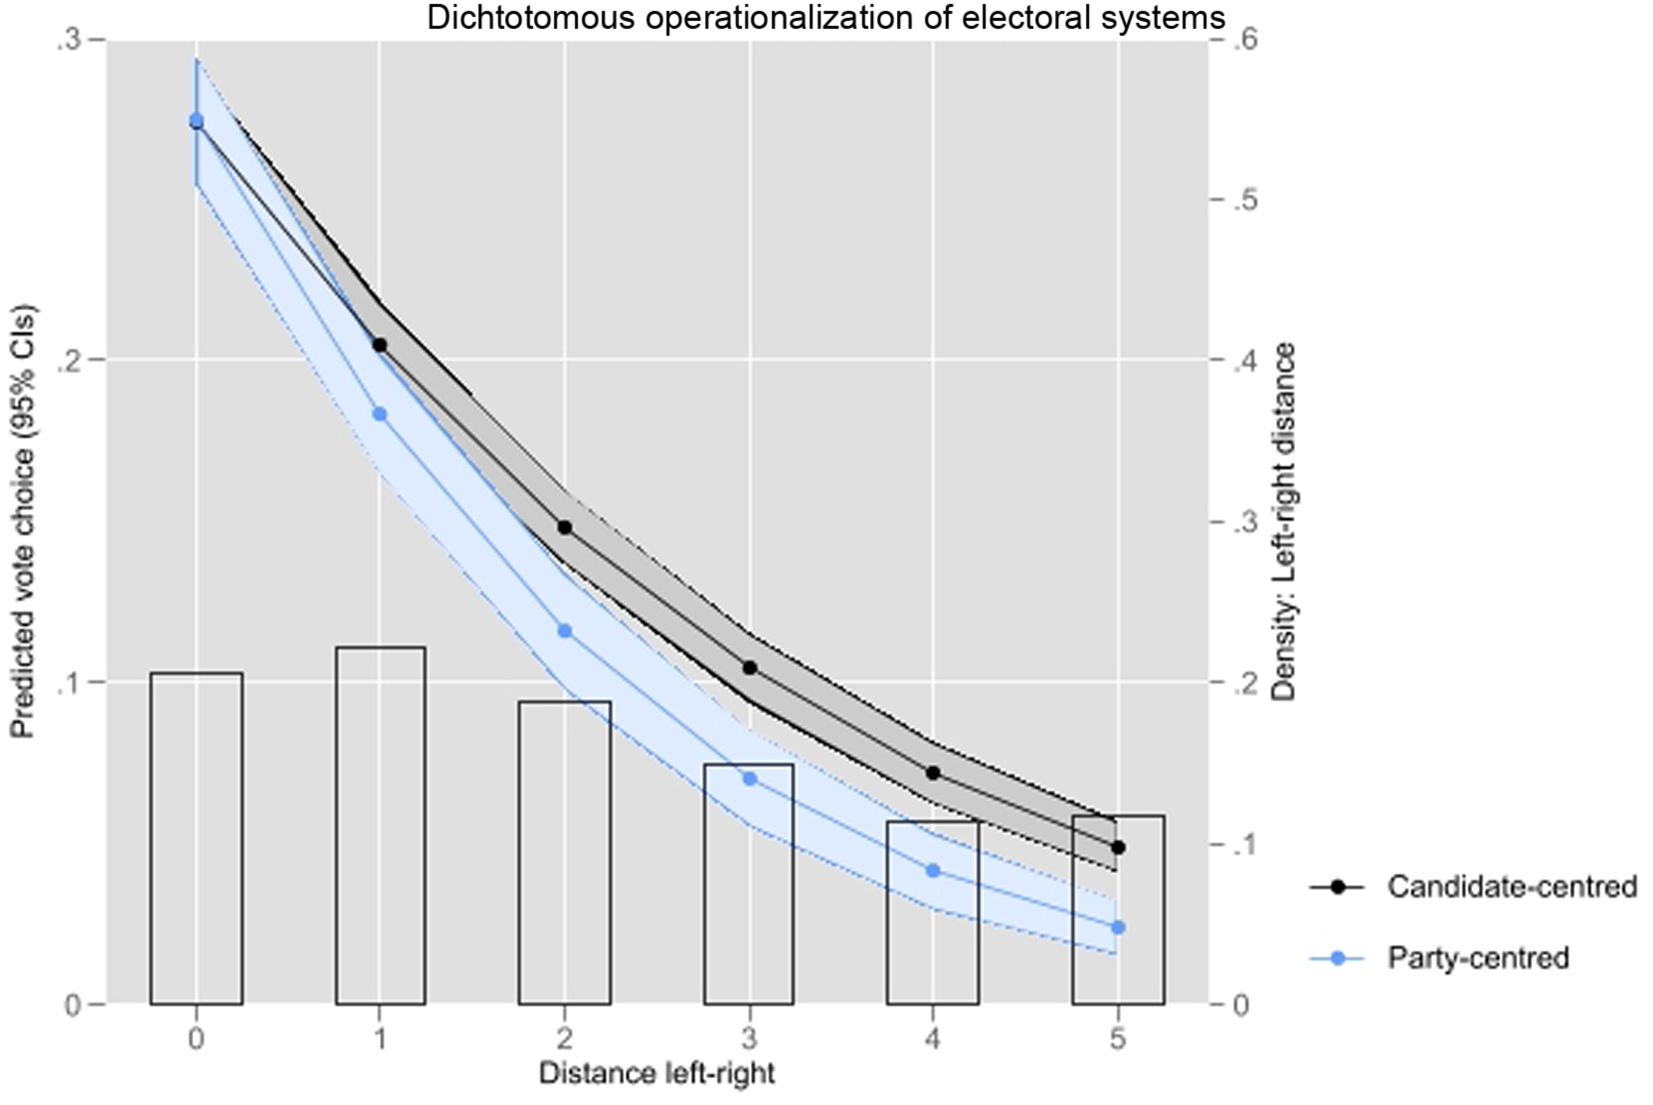
To further help us interpret the results, Figure 2 plots the predicted probabilities of voting for a given party depending on the respondent’s left-right distance to it and the type of ballot structure. These probabilities are calculated according to an alternative-specific conditional logit model. Drawing on existing models of proximity voting, the graph shows that, as the left-right distance to the party increases, the probability of voting for it decreases for all electoral systems under consideration. However, this effect is stronger for party-centred systems than for electoral rules where parties do not provide an ordered list of candidates. Even though the differences across types of electoral systems are not statistically significant for a 0 distance (i.e., when the party and the voter occupy the same ideological position), the slope of Distance is slightly steeper for party-centred systems reaching a difference across types of electoral rules of about 2% when party and respondent are separated by 5 points on the left-right scale. Taken together, these results support the notion that the extent to which voters assess parties’ utility in terms of left-right proximity depends on the electoral system in use.
Predicted Probabilities of Vote Choice by Left-right Party-respondent Absolute Linear Distance and Type of Ballot Structure, Alternative Specific Conditional Logit Models
Note: Figure 2 displays the predicted probabilities with 95% confidence intervals for a respondent to declare having voted for a party located at a given left-right absolute linear distance from her own position across different types of ballot structure. Candidate-centred include all electoral systems but closed- and flexible-list PR; this is a conditional logistic model with fixed effects by respondent and cluster standard errors by election. The simulations are based on the estimates from Table B1 in the Appendix. The histogram in the background summarizes the distribution of the variable measuring the number of respondents placed at each distance.
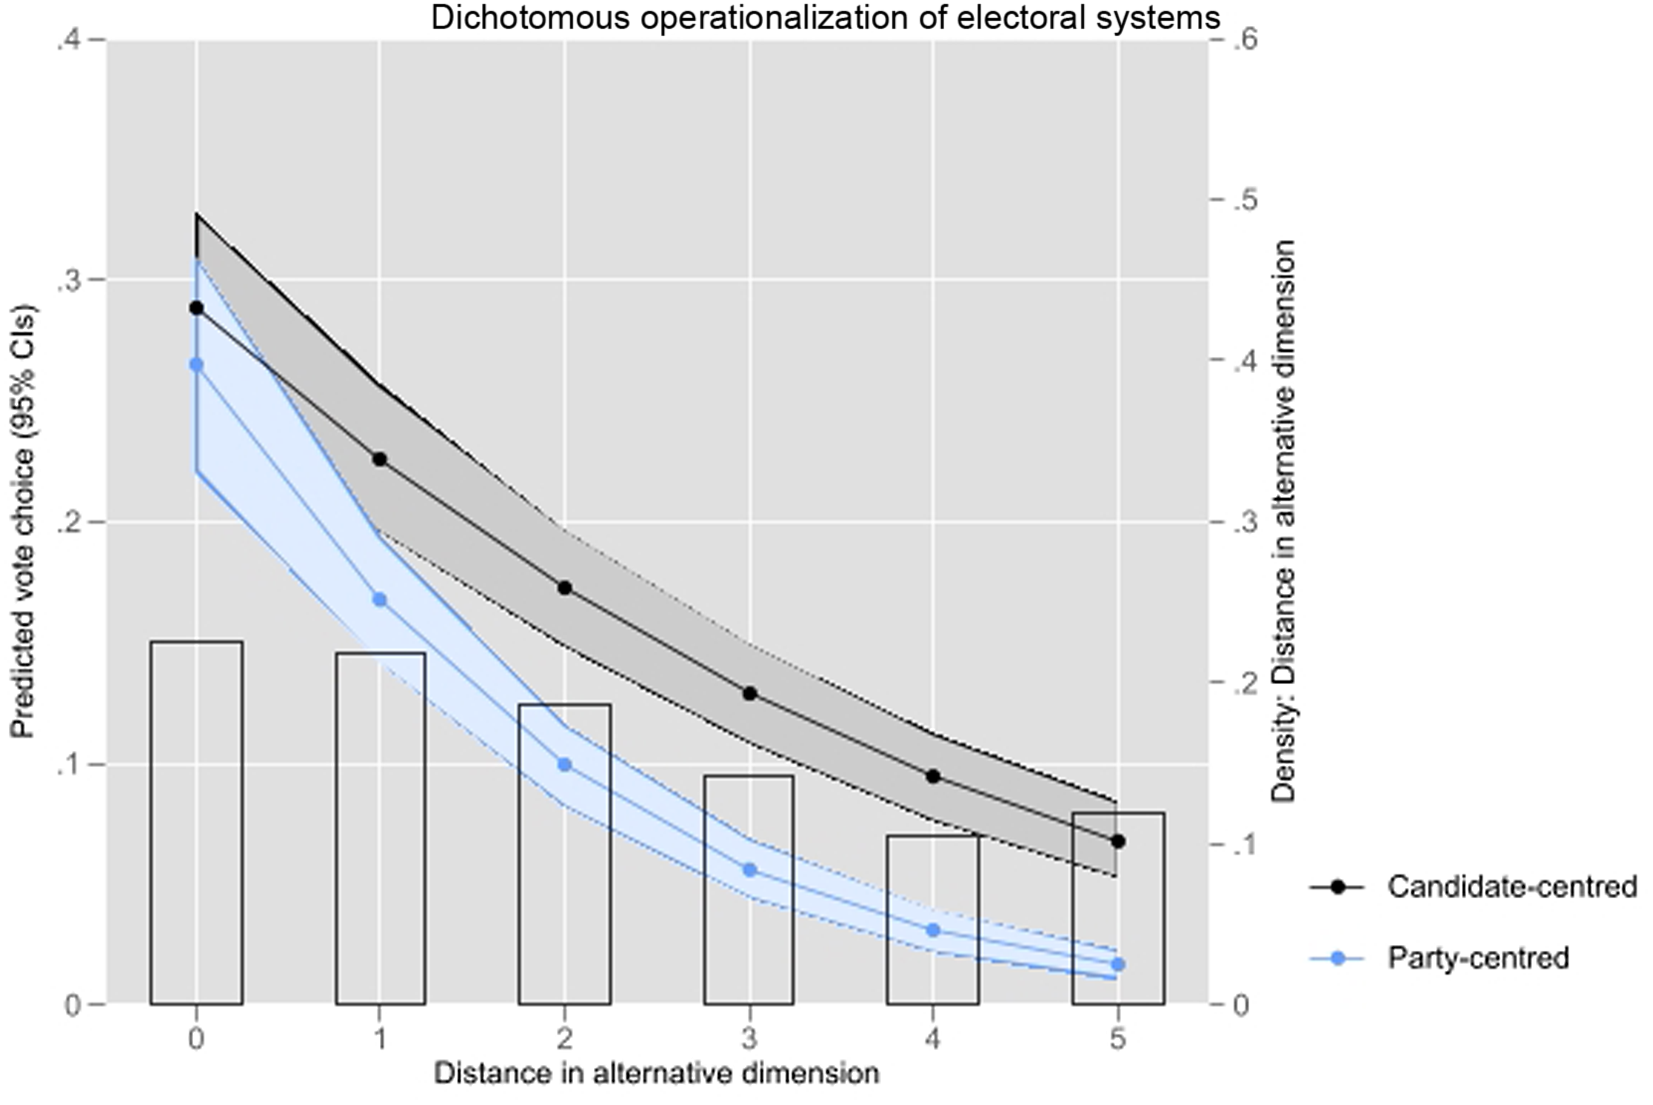
To assess whether the previous findings regarding H1 might be driven by the particularities of the left-right scale, in Figures 3 and 4, we replicate the previous models using instead distance on an alternative dimension of competition.Footnote 5 Despite the lower number of available observations, the dichotomous operationalization and both Shugart’s and Farrell-McAllister’s indices provide us with the same answer: when the electoral system becomes more candidate-centred, the role of ideological voting declines. According to the second and third panels, the effect of distance ranges from .033 or .025, when the lists are closed, to .016 or .018, when the lists are open or the STV is used, respectively. Likewise, Figure 4 plots the predicted probabilities of vote choice as a function of the distance between the respondent and the party on these alternative dimensions. The figure reveals that we find a similar probability for the respondent to vote for a party when they occupy the same ideological position across electoral systems. However, this effect is not linear: whereas the sharpest decrease in the probability of voting for a party that is five points away from the voter occurs in party-centred systems, there is a smaller reduction in the probability of voting for a party in the case of other electoral systems.
Marginal Effects of Party-respondent Absolute Linear Distance in Alternative Dimensions by Type of Ballot Structure on Vote Choice, Alternative Specific Conditional Logit and Hierarchical Linear Models
Note: Figure 3 displays the average marginal effects with 95% confidence intervals of left-right party-respondent absolute linear distance on vote choice across different types of ballot structure. In the first dichotomous operationalization of the core electoral system variable, candidate-centred include all electoral systems but closed- and flexible-list PR; this is a conditional logistic model with fixed effects by respondent and cluster standard errors by election. For the exact coding of cases in the second and third operationalizations, see Table A2 in the Appendix; these are three-level hierarchical linear models with random intercepts by election and respondent. The simulations are based on the estimates from Tables B3 and B4 in the Appendix. When provided, the histogram in the background summarizes the distribution of respondents across the different categories of the electoral systems variables.

Predicted Probabilities of Vote Choice by Party-respondent Absolute Linear Distance in Alternative Dimensions and Type of Ballot Structure, Alternative Specific Logit Models
Note: Figure 4 displays the predicted probabilities with 95% confidence intervals for a respondent to declare having voted for a party located at a given left-right absolute linear distance from her own position across different types of ballot structure. Candidate-centred include all electoral systems but closed- and flexible-list PR; this is a conditional logistic model with fixed effects by respondent and cluster standard errors by election. The simulations are based on the estimates from Table B3 in the Appendix. The histogram in the background summarizes the distribution of the variable measuring the number of respondents placed at each distance.
The second hypothesis tests the heterogeneous effects of local candidates’ crowdedness on the importance of left-right ideology for vote choice across electoral systems. Recall that we anticipate that increases in the number of candidates at the district level will amplify (diminish) the degree of ideological voting in party-centred (candidate-centred) systems. Figure 5 evaluates the validity of these theoretical expectations by showing the effect of left-right distance on vote choice as the number of candidates at the district level increases, distinguishing between party-centred systems and other electoral rules.Footnote 6 First of all, the graphs show that there is a negative relationship between party-citizen left-right distance and vote choice, again, irrespective of the electoral system in use. However, the number of candidates and, above all, the type of ballot structure modify this pattern. If we split the sample into candidate-centred and party-centred systems, it becomes clear that the results are in line albeit partially with our expectations: A high number of local candidates weakens the negative effect of moving away from the left-right position of the party on the likelihood of voting for it in candidate-centred systems (left panel), whereas it is close to irrelevant in this regard in party-centred systems (right panel). The average marginal effect of left-right distance in candidate-centred systems shrinks from 4% in a district with only 2 candidates to 1% in a district with more than 2,000 candidates. In contrast, there are no considerable differences in the level of ideological voting when we compare districts with small and large numbers of alternatives on the ballot in party-centred systems.
Marginal Effects of Left-right Party-respondent Absolute Linear Distance by Type of Ballot Structure and Number of Candidates at the District Level on Vote Choice, Hierarchical Linear Models
Note: Figure 5 displays the average marginal effects with 95% confidence intervals of left-right party-respondent absolute linear distance on vote choice across different types of ballot structure and number of candidates at the district level. Candidate-centred include open-list PR and STV. These are three-level hierarchical linear models with random intercepts by election and respondent. The simulations are based on the estimates from Table B5 in the Appendix.

Thus, the type of electoral system not only creates differences in what proximity models suggest is a linear effect, it also qualifies the impact of candidates’ crowdedness at the local level on vote choice. The performed analyses suggest that vote decisions become less ideological when lists are open and long at the same time. In contrast, contrary to expectations, we cannot safely conclude that the effect of left-right proximity increases when local races become more party-centred as a consequence of a high number of alternatives in closed- or flexible-list systems. Hence, ballots that are full of long ‘lists’ of ranked candidates do not lead to, comparatively speaking, more ideological vote choice.
Examining the mechanisms
We attempt to unpack the mechanism driving the main effects of electoral systems on the importance of ideology for vote choice by running some further analyses in which, on the one hand, we distinguish between systems with nominal voting (i.e., STV, alternative vote, majority two rounds, and first past the post)Footnote 7 and systems with lists (all the others), and, on the other, we differentiate between systems where intraparty competition takes place (i.e., open lists and STV) and systems where it does not (i.e., all the others). The odds ratios from alternative-specific conditional logits displayed in Figure 6 show that left-right voting is less relevant in systems where members of Parliament are elected based on candidates’ votes and where candidates from the same party electorally compete against each other at the district level. Hence, we cannot conclude whether the reduction in the amount of left-right voting in non-ranked-list systems is due either to nominal voting or to intraparty competition.Footnote 8
Alternative Specific Conditional Logit Estimates for the Effect of Left-right Party-respondent Absolute Linear Distance on Vote Choice by Type of Ballot Structure (and Number of Candidates at the District Level), Mechanisms
Note: Odds ratios from conditional logistic models with fixed effects by respondent and cluster standard errors by election in parentheses; Nominal voting systems include STV, alternative vote, two-rounds majority and first-past-the-post, whereas intraparty competition systems include open-list PR and STV (in the nominal voting variable, mixed systems receive 0.5). The plots are based on the estimates from Table B6 in the Appendix. Horizontal bars represent 95% confidence intervals.

Moving now to the second hypothesis, we specify an OLS model in which whether the respondent has cast a preference vote in an open-list system is regressed on the number of candidates running in her district.Footnote 9 In line with our expectations, the results displayed in Figure 7 indicate that respondents are more likely to vote for a particular candidate in open-list systems when the number of available candidates increases, suggesting electoral competition is less ideological and more personalistic in this context.Footnote 10
Determinants of Casting a Preference Vote in Open-List Systems, OLS Regressions
Note: Figure 7 summarizes the results from an OLS model included in the Appendix (Table B7). The model is estimated with cluster standard errors at the election-year level and includes 14 open-list elections and 14,332 individuals. Horizontal bars represent 95% confidence intervals.

Considering endogeneity concerns
Another legitimate concern with our analysis is the potential endogeneity between the electoral system and patterns of voter behaviour. To address this issue, we focus on two specific episodes of electoral system change in Greece, which offer an unusual opportunity to compare voters’ choices of one country under two different ballot structures.
On the 6th of May 2012, 238 out of the 300 seats in the Greek parliament were allocated to parties via OLPR across the 56 electoral districts of the country. This election was held amid economic collapse and political turmoil, resulting in one of the most fragmented and polarized results observed in a European established democracy by that time (Dinas, Reference Dinas, Featherstone and Sotiropoulos2020). The lack of agreement between parties to form a new government forced the president to call a new election on the 17th of June of that year. A second electoral repetition occurred in 2015. On that occasion, the Greek Prime Minister, Alexis Tsipras (Radical Left Coalition, SYRIZA), lost his legislative majority as a result of the parliamentary adoption of the country’s 9th austerity plan and was forced to call an early election on the 20th of September of 2015. The immediately previous elections had taken place on the 25th of January of that year.
Following a particularity of the Greek electoral law, parties are obliged to compete under a closed-list rather than the usual open-list system if elections are called less than 18 months after the previous ones (Vassilakis, Reference Vassilakis2013). These shifts from OLPR to CLPR allow us to compare the strength of the ideological component in the vote across different ballot structures in quite similar contexts. Here, our analysis hinges on the assumption that those interviewed after an election when the lists are open (October 2009 and January 2015 in the third and fourth CSES waves, respectively) are comparable to those interviewed after an election when the lists are closed (June 2012 and September 2015 in the fourth and fifth CSES waves, respectively). Moreover, the district magnitude in the country ranges from 1 to 42, which allows us to observe whether the effects we find across ballot structure types also depend on the number of candidates competing at the district level. With the exception of Vassilakis (Reference Vassilakis2013), we are unaware of any other study exploring the Greek case to examine the effects of the ballot structure on voting behaviour.
Moving now to the results, odds ratios from alternative-specific conditional logit models displayed in Figure 8 show that left-right party-respondent distance always decreases considerably the likelihood of voting for one party in Greece as well. However, citizens that vote in a closed-list setting are slightly more driven by ideological motivations than citizens that do so when lists are open.Footnote 11 Moreover, although the differences across Greek elections displayed in the second panel are in line with our second hypothesis, the coefficient of the triple interaction fails to reach statistical significance, suggesting that the effect of the number of candidates competing in the district does not depend on the type of employed ballot structure.
Alternative Specific Conditional Logit Estimates for the Effect of Left-right Party-respondent Absolute Linear Distance on Vote Choice by Type of Ballot Structure (and Number of Candidates at the District Level), Greece
Note: Odds ratios from conditional logistic models with fixed effects by respondent and cluster standard errors by election in parentheses; Lists are open in October 2009 and January 2015, whereas they are closed in June 2012 and September 2015. The plots are based on the estimates from Table B8 in the Appendix. Horizontal bars represent 95% confidence intervals.

Robustness checks
Our results are robust to the implementation of a long series of sensitivity checks included in the Appendix.Footnote 12 First, we test the robustness of the findings using different operationalizations of left-right voting. Tables C1-C2 in the Appendix display the results of a battery of specifications that measure parties’ ideological positions as how experts place them, or, alternatively, respondents’ feeling of closeness towards each party. Likewise, Tables C3-C4 use alternative operationalizations of the left-right distance to parties, either by using a squared function or by considering the relative position from the centre of respondents and parties (Rabinowitz and Macdonald, Reference Rabinowitz and Macdonald1989). While the results are practically identical across operationalizations for H1, most of the alternative tests fail to support H2.
To mitigate any concern that our results are conditional on including flexible-list systems or adding countries with single-member districts, Tables C5-C6 replicate the main analyses considering sequentially as missing data cases of first-past-the-post, two-rounds majority, alternative vote, mixed systems, flexible-list PR, and STV. Except for the specifications concerning flexible-list systems in case of the second hypothesis, the results are substantively similar to those reported earlier, which implies that the institutional differences in the importance of ideological voting could narrow down to the strict world of closed and open-list systems. The expected effect for H1 is also quite robust to slight changes in the sample of examined countries, as summarized in Tables C7-C8 in the Appendix. Footnote 13 Again, the effects vanish for H2 when we do not consider countries with national electoral districts or, above all, include nations whose district magnitude does not vary.
To gain further insight into the interactive effect of ideological distance and the intraparty dimension, we replicate the main analyses by excluding the last three alternatives for each respondent and the cases where legislative and presidential elections take place at the same time. Table C9 displays the results of these additional analyses and further corroborates the robustness of the results regarding H1. In contrast, these tests fail to support H2. We move further and revisit H2 to compare the effect of left-right distance between, on the one hand, first-past-the-post systems and, on the other, low-magnitude PR with either open lists/STV or closed lists. The results of this exercise are displayed in Figure C2 of Appendix C. According to our expectations, ideological voting plays a middle-ground role in FPP systems compared to open-list systems/STV and closed-list systems with small districts and, hence, a low number of candidates.
Also, it is worth assessing the robustness of our results considering the control variables we use. One potential concern is that our findings are confounded by respondents’ age, gender, and education. However, the robustness checks included in the second columns of Tables C10-C11 in the Appendix guard against this possible confounding effect.Footnote 14 Another alternative explanation is that the relationship between ideology and electoral rules weakens after considering the party family. However, at least key findings regarding H1 are robust to the inclusion of the party family as an independent variable (see third column of Tables C10-C11, Appendix C). Another issue could arise from the omission of country-level control variables. We address this concern by including additional explanatory factors variables such as presidentialism, ethnic fragmentation, party system fractionalization and polarization, democratic age, and GDP per capita and growth. The estimates are reported in the last two columns of Tables C10-C11 in the Appendix. Except for the polarization specifications regarding H2, these tests confirm previous results.Footnote 15 Above all, our main findings remain practically identical holding constant the number of parties, suggesting that the potential multi-dimensionality of party competition does not confound the hypothesized effect of the intraparty dimension of the electoral system.Footnote 16
We also test the impact of the evaluation of national leaders on vote choice. The bottom line of these additional specifications, summarized in Table C12 of Appendix C, is that the interactive effect between party-respondent ideological distance and the electoral system shrinks when accounting for the influence of the evaluation of national leaders. Model 2 indicates that the positive impact of the evaluation of national leaders on vote choice is slightly larger in party-centred systems, suggesting that part of the modifying effect of the intraparty dimension is channelled through the evaluation of national leaders. However, it appears that these last estimates are less reliable because this variable is missing for a considerable number of election studies.
Finally, we assess whether our findings might be driven by a few observations in our data. We do so by replicating the main models and excluding one country at a time. The results of these robustness checks indicate that the findings are not driven by any particular observation. Regarding H1, the increase of the effect of ideological distance in the case of party-centred systems is at the minimum level when all Norwegian elections are excluded, and it reaches its maximum level when Belgium is excluded (see Figure C3, Appendix C). Regarding H2, the effect of the number of candidates on ideological voting in party-centred systems fails to reach statistical significance at the 95% level when we exclude most countries, but, above all, Brazil (see Figure C4, Appendix C).
In sum, our additional tests show the robustness of our findings regarding the role of the party-centred systems for ideological voting vis-à-vis candidate-centred systems (Hypothesis 1). The robustness checks, on the other hand, do not confirm the heterogeneous effects of candidates’ crowdedness on the importance of ideological voting across electoral systems (Hypothesis 2). Below, we provide a few interpretations for the lack of strength of this second relationship.
Conclusions
This article examines the effect of electoral rules on the ideological vote of the citizens. In a nutshell, the fact that left-right distance to parties affects vote choice is true irrespective of the electoral system under consideration. However, by using the CSES data, this article has presented the first comparative test of how the intraparty dimension of electoral rules influences the explanatory power of voters’ ideology in a representative sample of democracies all over the world.
Interestingly, results demonstrate that the type of ballot structure (i.e., party-centred versus candidate-centred) alters the weight that citizens assign to ideology in their vote choices. To be more specific, our findings suggest that closed/flexible-list systems foster ideologically driven electoral competition. Throughout the world, party systems are becoming more polarized. Accordingly, how ideology intervenes in individuals’ voting decision-making appears as one of the most relevant puzzles in contemporary research.
Our findings are less conclusive for the effect of the number of candidates on the ballot. The ambiguous results concur with recent works in the literature on electoral systems questioning the intraparty effect of ballot type and size. For the specific case of candidate-centred systems, party leaders anticipate the degree of intraparty competition and ideological dispersion by controlling access to the list (Carroll and Nalepa, Reference Carroll and Nalepa2020; Buisseret and Prato, Reference Buisseret and Prato2022). Such entry barriers to ideological heterogeneity dilute the within-list variation of ideological voting across districts. At the same time, and as described in ‘The impact of the intraparty dimension on ideological voting’ section, candidates face competing incentives for emphasizing ideological voting in candidate-centred systems: the promotion of their personal characteristics and the dependence on the party brand. What our results suggest is that the latter motivation could be stronger in large districts.
This article has also contributed to uncovering a potentially negative consequence of the elimination of closed lists. Previous findings show that candidate-centred rules positively correlate with higher levels of satisfaction with democracy (Farrell and McAllister, Reference Farrell and McAllister2006). However, our results confirm that these patterns can come at the cost of creating lower ideological congruence between parties and voters. In the context of a PR system, adopting open lists or the STV may still make a majority of voters better off. But the benefit of this reform is smaller than suggested if we abstract from the congruence dimension of representation (Becher and Menéndez, Reference Becher and Menéndez2019). Similarly, this article sheds light on why some low-quality politicians that run in closed-list systems might become elected even in the absence of good personal characteristics by simply belonging to the party that maximizes ideological congruence with voters. The evidence from a wide range of indicators all points toward the idea that pervades this research endeavour: we must also acknowledge the behavioural consequences at the voters’ level of the intraparty dimension of electoral rules.
Future research might examine the compatibility and tensions between party-citizens ideological congruence and personal representation when shaping voting behaviour, as well as a third level of variation accounting for ideological congruence at the candidates’ level. More relevantly, future research should evaluate the extent to which the findings of this article influence patterns of candidate-centred voting at the district level. Recent efforts in the literature underscore the relevance of deepening our understanding of personal vote dynamics by combining empirical evidence from a heterogeneous sample of electoral systems (Colomer, Reference Colomer2011). Finally, it would be interesting to examine the relevance of other macro-level moderators of ideological voting such as party system nationalization more in depth.
Supplementary material
To view supplementary material for this article, please visit https://doi.org/10.1017/S1755773922000248.
Acknowledgments
The authors are grateful for comments by three anonymous reviewers, the editors of this journal, Professor Christopher Anderson, the participants of the European Political Institutions Conference (EPIC) at University Carlos III of Madrid, 4−5 October 2018, and the attendants to the SPARC Seminar at Institute of Social Sciences of the University of Lisbon, 30 April 2020, and the Political Science Department’s Speaker Series at Washington University in St. Louis, 4 September 2018. The usual disclaimer applies. This research was supported by a “Beca Leonardo a Investigadores y Creadores Culturales” of the BBVA Foundation (2019 edition).


 Open access