


Introduction
An adequate knowledge of species’ breeding success and causes of reproductive failure is critical in assessing the health of their populations and determining their conservation status (e.g. Sutherland Reference Streich, Pitra, Litzbarski and Quaisser2000). In precocial birds, estimating breeding success is difficult because chicks leave the nest soon after hatching. In some cases, chick survival can be calculated using capture and release techniques and statistical models (McGowan et al. Reference Martín2009). However, this is not always feasible and parameters of nesting performance (i.e. number of nests, clutch size, hatching success) are often used. Additionally, most of these species are ground nesters and are therefore particularly sensitive to changes in land use intensity (i.e. cultivation and grazing intensity in farmland habitats; Báldi et al. Reference Báldi, Batáry and Erdős2005, Guerrero et al. Reference Guerrero, Morales, Oñate, Aavik, Bengtsson, Berendse, Clement, Dennis, Eggers, Emmerson, Fischer, Flohre, Geiger, Hawro, Inchausti, Kalamees, Kinks, Liira, Meléndez, Pärt, Thies, Tscharntke, Olszewski and Weisser2011). Consequently, knowledge of their nesting habitat preferences is a prerequisite to assess and minimise the impact of such changes on bird breeding performance.
The Great Bustard Otis tarda is a ground-nesting, precocial bird inhabiting natural steppes and cereal-cultivated areas of the Palearctic Region (Del Hoyo et al. Reference Del Hoyo, Elliot and Sargatal1996). The species is globally threatened, listed as “Vulnerable” (BirdLife International 2000), and classified as SPEC 1 in Europe (Tucker and Heath Reference Traba, Morales, García de la Morena, Delgado and Kristin1994). During the 20th century, the Great Bustard suffered a steep decline throughout its range and went extinct in many countries, mainly due to agricultural habitat loss and degradation (Cramp and Simmons Reference Cramp and Simmons1980, Morales and Martín Reference McGowan, Millspaugh, Ryan, Kruse and Pavelka2002, Lopes-Jamar et al. Reference Zar2011). The population stronghold is in the Iberian Peninsula, with nearly 30,000 birds in Spain (Palacín and Alonso Reference Onrubia, Andrés, Bota, Morales, Mañosa and Camprodon2008) and 1,400 in Portugal (Pinto et al. Reference Pinto, Rocha, Leitão, Jolivet, Rodriguez and Tavares2005).
Population viability analyses have identified female breeding performance as a key parameter in the persistence of Great Bustard populations (Streich et al. Reference Sterbetz, Goriup and Harsh1996, Lane and Alonso Reference Lane and Alonso2001, Alonso et al. Reference Alonso, Martin, Alonso, Palacin, Magaña and Lane2004). This result is consistent with the breeding biology of the Great Bustard in which incubation and chick rearing are exclusively undertaken by females (Cramp and Simmons Reference Cramp and Simmons1980), as described in other lekking birds.
However, information on breeding parameters and female reproductive performance is lacking for many Great Bustard populations. Data on clutch size have been reported from north-west Spain (Ena et al. Reference Ena, Martínez and Thomas1987), Hungary (Faragó Reference Faragó1992), south Portugal (Morgado and Moreira Reference Moreno, Morales and Traba2000) and the Saratov region of Russia (Shlyakhtin et al. Reference Sandersson, Donald, Burfield, Bota, Morales, Mañosa and Camprodon2004), while long term patterns in female reproductive success at the population and individual levels have been provided for north-west Spain (Morales et al. Reference Morales, Traba, Dopazo and Navarro2002). However, information on hatching success and causes of nesting failure is much scarcer (but see Ena et al. Reference Ena, Martínez and Thomas1987 and Magaña Reference Lopez-Jamar, Casas, Diaz and Morales2007).
Finally, reports on nest site habitat use or selection are also rare, although results from a few studies have been published on this issue during the last decade (Morgado and Moreira Reference Moreno, Morales and Traba2000, Shlyakhtin et al. Reference Sandersson, Donald, Burfield, Bota, Morales, Mañosa and Camprodon2004, Magaña et al. Reference Magaña2010).
In this paper, we present results on Great Bustard breeding parameters, nesting performance and nesting habitat selection in the Castro Verde Special Protection Area (SPA), in southern Portugal. This area holds around 80% of the Portuguese population of the species, which is almost entirely concentrated in the Alentejo region (Pinto et al. Reference Pinto, Rocha, Leitão, Jolivet, Rodriguez and Tavares2005). Although some data on Great Bustard clutch size and nesting habitat use have already been provided for this area (Morgado and Moreira Reference Moreno, Morales and Traba2000), results presented here correspond to a much larger and systematically gathered sample obtained over three years, and thus they can be considered the most representative results on nesting performance and habitat selection for the main Great Bustard population of Portugal. Moreover, they provide the first complete description of the nesting process, from nesting habitat selection to nesting success, in a population of this species. These results will provide cues to the assessment of practical management measures for steppe bird conservation currently being applied at the Castro Verde SPA, with a focus on the specific agri-environmental scheme ongoing in the area since 1995.
Methods
Study area
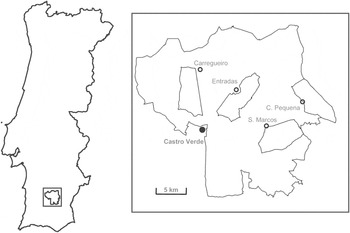
The study was carried out in the cereal steppe of Castro Verde (37º43’N, 7º57’W; 90.5 ha; Figure 1), an SPA considered the most important area for steppe birds in Portugal (Grimmet and Jones Reference Grimmet and Jones1989), holding around 1,100 Great Bustards (Pinto and Rocha Reference Petrick2006). This area is located in the Meso-Mediterranean bioclimatic stage (Rivas-Martínez Reference Ripley1981). Altitude ranges from 150 to 240 m asl, annual average temperatures range from 11.0 to 16.0ºC, and annual rainfall from 350 to 650 mm. The landscape is an open farmland mosaic resulting from rotational dry cereal cultivation, dominated by cereal crops (mainly wheat Triticum aestivum and oats Avena sativa), fallow land, pastures, and ploughed fields. The traditional agricultural system used in this region is as follows: each farm is divided into parcels, each of which lies under cereal cultivation for two years (1st year wheat, 2nd year oats), after which the land is left fallow for 2–3 or more years. The parcel is then ploughed to re-initiate the rotation cycle. Fallow land is generally used as pasture for sheep and cattle. Tree cover is restricted to some plantations of olive trees Olea europaea and peripheral cleared oak Quercus rotundifolia and Q. suber woodland (or montados). Increasing areas of scrub (mainly Cistus ladanifer) occur on rocky outcrops and abandoned cropland.
Map of the study area showing its location in Southern Portugal and the limits of the four study sub-areas.
Nest data collection
Data were collected during the nesting seasons (March–June) of 2002, 2003, and 2004 throughout the entire study area (Figure 1). Nests were detected by means of (i) field surveys (either following females that exhibited nesting behaviour, or systematic search transects), and (ii) directed searches based on information about nest locations from inquiries to farmers, shepherds and ornithologists. Search effort was homogeneous across the study area and between different habitat types (see below). Although nests may be harder to find in cereal fields, and a larger number of nests may have been overlooked in that habitat type during surveys, they are easily detected by farmers while harvesting. Therefore the potential bias in nest detection between habitats can be considered small. In all cases, searches were performed so as to minimise disturbance of incubating females and human influence on breeding success. After they were located, nests were visited only once and always after hatching. In order to guarantee this, nests were visited 28 days after finding, which corresponds to the maximum length of the incubation period in the species (Cramp and Simmons Reference Cramp and Simmons1980). On each visit, vegetation around the nest was rearranged, and visit length was kept under one minute.
The nesting habitat assigned to each nest corresponded to the habitat existing on the estimated laying date (it might have changed when the visit was carried out, e.g. cereal fields that were harvested). For each nest, the following data were recorded or estimated, based on egg shell remains present in the nest and following recommendations by Sutherland et al. (Reference Sutherland2004):
- Nest finding date. Date on which any given nest with incubating female was found.
- Incubation period. An estimate of the incubation period was obtained for nests of known hatching date, taking the preceding 25 days as the incubation period.
- Clutch size. Number of eggs per complete clutch. Predated or abandoned clutches were not considered (predation frequently prevents the correct assessment of clutch size from shell remains, and abandonment may occur before clutch completion).
- Hatching date. Determined by direct observation of females with hatchlings (chicks leave the nest a few hours after hatching; Cramp and Simmons Reference Cramp and Simmons1980).
- Hatching percentage. Defined as the proportion of eggs per clutch that produced a chick. Only clutches in which the total number of eggs laid could be obtained from the egg shell remains were considered (hatched eggs are easily identified from shell remains; in some cases this was confirmed by direct observation of the family). Again, clutches predated (evaluated from shell remains) or abandoned due to human disturbance (when no sign of incubation was detected after human contact) were excluded.
- Nesting success. A nesting attempt was considered successful whenever one or more eggs hatched in the corresponding nest.
Nesting habitat availability
The nest site habitat selection analysis was restricted to four sub-areas within the SPA for which habitat information was available in the three years of study (Figure 1). Aerial photographs and their corresponding field checks were used to assess the agricultural substrate of every parcel in these sub-areas, along with all non-agricultural land covers. This information was incorporated in a Geographical Information System (GIS). The area covered by the different agricultural habitats was calculated using the xtools extension of Arcview 3.2 (ESRI 1999). The habitat categories considered are described in Table 1.
Description of habitat types present in the study area.

Habitat availability changed during the study period, due to agricultural activities such as ploughing or cereal harvesting. Thus, habitat availability was mapped at the beginning of the study (February/March) and updated at least three times during the breeding period, by travelling through the areas and registering changes in the different field parcels.
Data analyses
Potential between-year differences in clutch size were tested by means of non-parametric Kruskal-Wallis ANOVA (Zar Reference Yanes and Suárez1996). The relationship between clutch size and the date of nest finding was explored by means of a General Linear Model (GLM), in which nest finding date was the response variable, and clutch size and year were used as categorical factors. The interaction between those factors was also tested. The normal distribution of the response variable residuals was verified by means of the Kolmogorov-Smirnov test (Zar Reference Yanes and Suárez1996). The spatial distribution pattern of nests in the study area was examined by means of Ripley’s K function (Wiegand and Moloney Reference Watzke2004). This function allows second order spatial analysis, taking into account the variance in the distance between points where nests were found. Unlike other methods, this function also allows the detection of changes in nest location patterns as a function of spatial scale. Ripley’s L function is a transformation of the K function that is more often used since it eliminates the effect of scale in the case of independent patterns and stabilises the variance (Ripley Reference Pinto, Rocha and Moreira1981), which assists the interpretation of the results. In order to establish whether the L function obtained differed significantly from a random null model, 95% confidence intervals were calculated by means of Monte Carlo permutations of the null model. The spatial pattern is considered random if the obtained function is delimited by the confidence intervals, uniform if it is above these intervals, and aggregated if it is below the confidence band. In order to maximise sample sizes, this analysis was performed only for years 2003 and 2004 using the Passage software (Rosenberg Reference Rocha2009).
Between-year differences in nesting habitat use were examined by means of the non-parametric G-test (Zar Reference Yanes and Suárez1996). Selection ratios (Manly et al. Reference Magaña, Alonso, Alonso, Martin, Martin and Palacin1993, Arthur et al. Reference Arthur, Manly, McDonald and Garner1996) were used to assess habitat selection patterns by nesting females. These habitat selection analyses were limited to the 53 nests located in the four sub-areas for which habitat cartography was available. Because habitat availability changed between nesting areas, years and within season (due to agricultural works), we calculated the ratios using a modification of Arthur et al.’s (Reference Arthur, Manly, McDonald and Garner1996) method (see Moreira et al. Reference Morales, Traba, Carriles, Delgado and García de la Morena2004). The sampling unit was the nest location. For each nest, we calculated a set of selection ratios as 1/(% availability) for the habitat type that was used for nesting and for the remaining available types. Observations of located nests were then used to derive maximum likelihood estimates of selection ratios (conceptually equivalent to the mean ratio of use to availability) by an iteration procedure (for further details, see Moreira et al. Reference Morales, Traba, Carriles, Delgado and García de la Morena2004). Estimating selection ratios required that the selection ratio for one habitat be set equal to 1.0, and selection for other habitat types estimated in relation to this reference habitat. The magnitudes of the selection ratios indicate the intensity of selection for each type, relative to the reference type. Old fallows were used as the reference habitat, because they were common and used in all areas over the three years of study. Thus, selection ratios > 1 indicate habitats with greater use (relative to availability) than old fallow fields, whereas ratios < 1 indicate habitats with less use.
To determine if habitat use differed (relative to availability), a likelihood-ratio test (Manly et al. Reference Magaña, Alonso, Alonso, Martin, Martin and Palacin1993, Arthur et al. Reference Arthur, Manly, McDonald and Garner1996) was used to compare a null model that assumed equal use of all habitats and a model that allowed habitat use to differ. If the test suggested that the selection model provided a better fit to the data, then we concluded that habitat use was selective (i.e. non-random). A similar approach was used to determine if patterns of selection differed between years (only 2003 and 2004, as for 2002 sample size was too small). The likelihood-ratio was used to determine if a better fit was obtained by modelling each year separately, versus a model that pooled all data (Arthur et al. Reference Arthur, Manly, McDonald and Garner1996). To determine which habitat types were selected differently, we calculated the variance/covariance matrix for each set of selection ratios and tested the significance of differences between pairs of selection ratios using a z-test. Selection ratios for habitats that were not used (ratio = 0) were assumed to differ from ratios for which the 95% confidence interval (CI) excluded 0, but not from habitats for which the 95% CI included 0 (for further details, see Moreira et al. Reference Morales, Traba, Carriles, Delgado and García de la Morena2004). Finally, in order to assess the existence of spatial association between Great Bustard nests and preferred habitats identified by habitat selection analysis, the degree of spatial aggregation between nests and fields with those habitat types was tested by means of a bivariate Ripley’s L function analysis (Wiegand and Moloney Reference Watzke2004) between nest site locations and the centroids of fields covered by selected habitat types present in the study area. This analysis is a variant of the univariate Ripley’s L function in which the spatial relationship between two different types of events is based on the distribution of distances of type 1 events (in this case nest locations) with respect to type 2 events (centroids of fields with favourable habitat types). In order to maximise its robustness, this analysis was performed with data from 2003, which was the year with the largest sample size. Again, statistical significance of the patterns detected was tested using Passage (Rosenberg Reference Rocha2009). All other statistical analyses were performed using SPSS (SPSS 1999) and an EXCEL spreadsheet. Significance level of all tests was set at P < 0.05.
Results
Nesting performance
A total of 107 nests were located in the whole study area over the three years of study (17 nests in 2002, 53 nests in 2003, and 37 nests in 2004). Only for eight nests was it possible to precisely determine the onset of laying, which occurred, on average, on 22 April (± SD = 12 days). Incubating females were detected between 1 April and 12 June. Most incubating females (95.0%) were detected between 6 April and 31 May.
Clutch size could be reliably assessed in 86 nests. The mean clutch size found was 2.12 (SD = 0.69, n = 86), with no between-year differences found (Kruskall-Wallis, χ22 = 2.28, P > 0.05). The GLM analysis found no significant relationship between nest finding date and clutch size (F2, 61 = 1.58, P = 0.22). However, the effect of both year and the interaction between year and clutch size were statistically significant (F2, 61 = 5.96, P < 0.005 and F4, 61 = 2.76, P < 0.05, respectively). The average date of nest finding was later from year to year, that is, earliest in 2002 and latest in 2004. Additionally, the average finding date of nests with one egg was delayed from year to year so that, in 2004, the average finding date of one egg clutches was significantly later than those of two- and three-egg clutches.
Hatching occurred between 18 April and 26 June. For the eight nests of known laying onset, the mean hatching date was 17 May. Global nesting success for the three years was 71%, calculated for a sample of 74 located nests. Hatching percentage was 87.5% (n = 8), 64.0% (n = 33) and 75.8% (n = 33) for 2002, 2003 and 2004, respectively. The main cause of nesting failure was agricultural activity (11 nests in the sample of 21 failed clutches). Among these activities, ploughing and harvesting caused six and two losses (plus one clutch destroyed by one farmer walking in a cereal field) respectively, while livestock trampling destroyed two clutches. Four nests were predated by corvids (confirmed by the presence of typical holes in shells) and six others were abandoned by females.
Nesting habitat use and selection
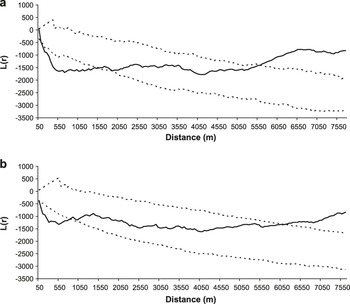
Great Bustard nesting territories in the study area occupied a minimum area of 44.1 ha, calculated from a minimum convex polygon (MCP, see Hooge and Eichenlaub Reference Hooge and Eichenlaub1997) built on a sample of 96 precisely located nests (not only the field where the female was nesting, but the exact nest location within the field were known). The highest nest density was observed in 2003, with 53 nests located in 36,700 ha (1.4 nests/100 ha), locally reaching up to 8.0 nests/100 ha across a 2,500 ha area). The minimum distance between neighbour nests was 60–70 m. Nests were spatially aggregated in the two years considered, although the degree of aggregation varied as the scale increased. The aggregation pattern was statistically significant, indicating nest clustering up to c.1,500 m in 2003 and c.800 m in 2004, being maximal at c.700 m in both years (Figure 2). At larger scales, the spatial distribution of nests can be considered random up to c.5,500 m in both years, and uniform thereafter.
Results of the analyses of Ripley’s function L(r) (solid line) of the spatial distribution of Great Bustard nests in Castro Verde in 2003 (a) and 2004 (b). The dashed lines represent 95% confidence limits resulting from the randomization of the distribution pattern (999 simulations). L(r) values within the 95% confidence limits indicate a random distribution, values below the interval indicate spatial aggregation and values above the interval indicate uniform distribution.
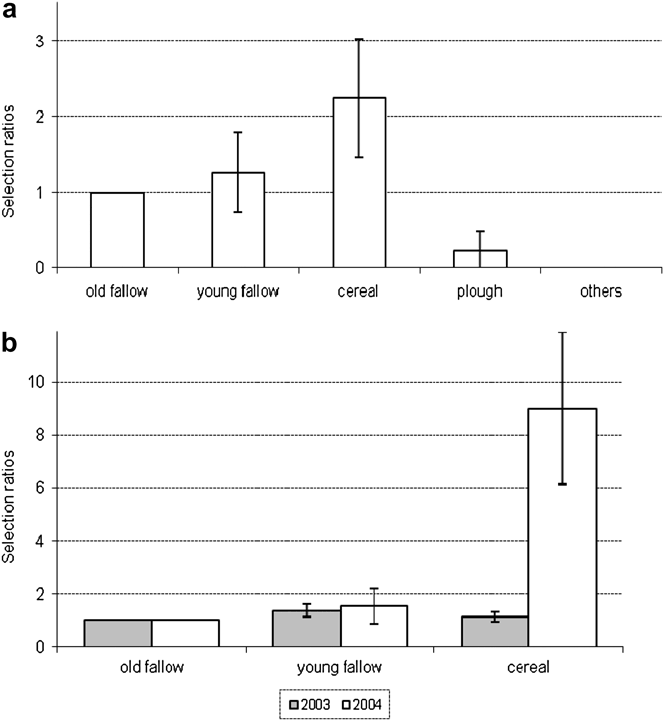
Nesting habitat was clearly determined for 101 nests. Nesting Great Bustards prefer fallows and cereal fields, and occasionally use ploughed fields and recent afforestation (Table 2). However, habitat type preferences changed from 2002 to 2004 (Table 2), particularly the use of fallows (G = 37.4, P < 0.01) and cereal fields (G = 10.1, P < 0.05). Over the three years of study, 53 nests were located in the four sub-areas for which a habitat map was available. The choice of nesting habitat by females was not random (Likelihood test, P < 0.05). Preferred habitats were cereal fields, followed by young fallows, and old fallows, all three being significantly more selected than ploughed fields and others (pairwise z-tests, P < 0.05) (Figure 3). Differences between years in the selection of habitats used common to both areas were significant (Figure 3b; likelihood test, P < 0.05). Cereal fields were more selected in 2004 compared to 2003.
Nesting habitat selection by Great Bustard females in Castro Verde. (a) Overall selection pattern. (b) Between year differences for young fallow and cereal.
Number and percentage of Great Bustard nests found in different habitat types of the study area in each of the study years.

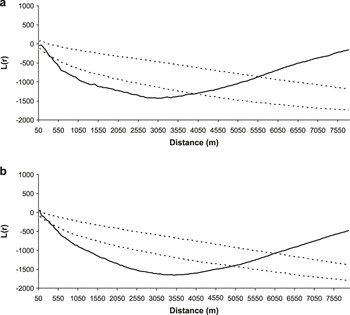
Great Bustard nests were spatially associated to both cereals and fallows (both young and old ones) at intermediate scales. This spatial association disappears beyond a distance of 3,800 m for cereals and 4,800 for fallows (Figure 4).
Results of the analyses of Ripley’s bivariate function L(r) (solid line) of the distribution of Great Bustard nests in Castro Verde in relation to the centroids of cereal fields (a) and fallow fields (b), which are the habitat types preferred by Great Bustard females for nesting. All data correspond to year 2003. The dashed lines represent 95% confidence limits resulting from the randomisation of the distribution pattern (999 simulations). L(r) values within the 95% confidence limits indicate a random distribution, values below the interval indicate spatial aggregation and values above the interval indicate uniform distribution.
Discussion
Our results from the Great Bustard population of Castro Verde help to complete the picture of the nesting process in this species, providing new information on phenology, reproductive parameters, nesting success, spatial distribution and nest-site habitat selection.
Nesting phenology
The nesting phenology described in this study basically coincides with the general pattern of the species in other areas of Iberia (Morales and Martín Reference McGowan, Millspaugh, Ryan, Kruse and Pavelka2002). Nevertheless, the observation of incubating females as early as 1 April suggests that the onset of incubation in the study area may occur at least in late March. At the opposite extreme, the presence of incubating females as late as 12 June suggests that the last nests may be left in the second half of June. In any case, this breeding phenology seems to be around one month earlier than that reported by Shlyakhtin et al. (Reference Sandersson, Donald, Burfield, Bota, Morales, Mañosa and Camprodon2004) for the Russian populations in the Saratov administrative region, where the earliest onset of laying described is around 25 April, although those authors provide no details on how that date was estimated, and thus comparisons should be made with caution. Nevertheless, these differences are expected for two populations in opposite extremes of the species distribution range in the Western Palearctic: ours under mild Mediterranean climate conditions, and the Russian one, in a harsh-winter and extremely continental region.
Clutch size
The average clutch size of 2.12 (SD = 0.69) estimated in the current study is not substantially different from that found in other populations across the species distribution range. Faragó (Reference Faragó1992) found an average clutch size of 1.93 (SD = 0.58) in a sample of 850 clutches located in different Hungarian populations over 16 years, whereas Flint and Mishchenko (Reference Flint, Mishchencko, Goriup, Batten and Norton1991) and Shlyakhtin et al. (Reference Sandersson, Donald, Burfield, Bota, Morales, Mañosa and Camprodon2004) estimated average clutch sizes of 1.93 (n = 155) and 2.10 (SD = 0.06), respectively, in nests detected over several years in the Saratov region, Russia. Nevertheless, some studies have reported clearly larger average clutch sizes. Ena et al. (Reference Ena, Martínez and Thomas1987) found an average of 2.47 eggs per clutch for a sample of 30 nests in north-west Spain, and Morgado and Moreira (Reference Moreno, Morales and Traba2000) calculated an average clutch size of 2.6 (range 2–3 eggs per clutch) for a sample of 16 nests in the same area of the current study. However, the small sample sizes of these latter studies do not allow reliable comparisons or the identification of consistent temporal or geographical trends.
On the other hand, the lack of a relationship between clutch size and nest finding date in our study reveals no clear seasonal trend of reduction of later (or replacement) clutches as described for many bird species (Klomp Reference Klomp1970, Cooper et al. Reference Cooper, Hochachka, Butcher and Dhondt2005), including the Great Bustard (Fodor Reference Fodor1974, Faragó Reference Faragó1992). However, the significant year-to-year delay in nest finding date reveals an inter-annual trend probably related to yearly climatic differences. In fact, there was an increase in autumn rainfall in the study area during the three study years (Rocha Reference Rivas-Martínez2006), which resulted in a progressive year-to-year delay in the date of cereal sowing. This caused a delay in the development of vegetation so that the adequate vegetation structure for nesting was probably attained later each year. This could explain why females nesting in cereals (the majority of them, in fact) tended also to start nesting later each year. Additionally, an increase in the intensity of early spring rainfall was recorded in the area over the study period (Rocha Reference Rivas-Martínez2006), which may explain the significant year-to-year delay of one-egg clutches: laying in general is delayed, but most particularly one egg clutches, which should mainly correspond to replacement ones (Faragó Reference Faragó1992). Other studies have also shown a negative effect of stormy spring rainfall on Great Bustard productivity (Morales et al. Reference Morales, Traba, Dopazo and Navarro2002).
Nesting success
Existing reports on hatching success and nest survival in the Great Bustard are scarce. Ena et al. (Reference Ena, Martínez and Thomas1987) estimated that only 50% of eggs laid in the Spanish population of Villafáfila finally hatched, and Flint and Mishchenko (Reference Flint, Mishchencko, Goriup, Batten and Norton1991) reported a 20–25% hatching success of first clutches in the Saratov region. These low figures, although expected for a ground-nesting bird (Yanes and Suárez Reference Wiegand and Moloney1995), contrast with the relatively high nesting success (71%) found in the present study. This relatively high nesting success may be, at least in part, a result of the habitat management measures applied in the Castro Verde SPA during the last 15 years, under the scope of conservation projects and agri-environmental policies to promote farming management compatible with bird conservation (Pinto et al. Reference Pinto, Rocha, Leitão, Jolivet, Rodriguez and Tavares2005). These measures include actions aiming at maintaining suitable nesting and feeding habitats (through promoting traditional crop rotations and regulating new afforestation), reducing livestock densities, matching timing of cereal harvest and ploughing of fallows to the breeding phenology of the birds, avoiding mortality and disturbance in nesting grounds (promoting modification in hazardous power lines, regulating new fences and hunting disturbance) and raising public awareness. These measures have probably contributed to reduce female mortality, disturbance, nest destruction by agricultural works and nest trampling by livestock, and to increase feeding conditions, which have most likely increased nesting success.
In spite of the above mentioned conservation measures, agricultural works involving machinery (mainly ploughing, mowing and harvesting) were the main cause of nest loss in the area. This threat is also the most frequently identified in other study areas, from the Iberian Peninsula to Hungary and Russia (Sterbetz Reference Silva, Palmeirim and Moreira1980, Ena et al. Reference Ena, Martínez and Thomas1987, Flint and Mishchenko Reference Flint, Mishchencko, Goriup, Batten and Norton1991) and is clearly linked to the increasing intensification of agriculture that occurred in Europe during the second half of the 20th century (Sandersson et al. Reference Rosenberg2005). Nevertheless, the estimated percentage of losses due to agricultural activity found in this study (14.9%) is clearly smaller than those reported for other areas (50% in north-western Spain and 70% for Hungary; Ena et al. Reference Ena, Martínez and Thomas1987 and Sterbetz Reference Silva, Palmeirim and Moreira1980, respectively), which, again, may be a positive consequence of the management measures applied in Castro Verde. In any case, nest losses due to agricultural works are a clear and widespread threat to populations of Great Bustard and other farmland birds (Beintema and Müskens Reference Beintema and Müskens1987, Green et al. Reference Green, Hawell and Johnson1987, Onrubia and Andrés Reference Morgado, Beja, Reino, Gordinho, Delgado, Borralho and Moreira2005) and there is a general consensus among experts on the need to halt or minimise such operations during the species’s nesting period (Moreno et al. Reference Moreira, Morgado and Arthur2010). The other two causes of nest loss, predation and livestock trampling, are widely documented in the Great Bustard (BirdLife International 2000, Morales and Martín Reference McGowan, Millspaugh, Ryan, Kruse and Pavelka2002, Langgemach and Bellebaum Reference Langgemach and Bellebaum2005, Watzke Reference Tucker and Heath2007) and other ground-nesting birds (Beintema and Müskens Reference Beintema and Müskens1987, Yanes and Suárez Reference Wiegand and Moloney1995). Corvids in particular are considered important predators of Great Bustard eggs (Ena et al. Reference Ena, Martínez and Thomas1987, Flint and Mishchenko Reference Flint, Mishchencko, Goriup, Batten and Norton1991, Morales and Martín Reference McGowan, Millspaugh, Ryan, Kruse and Pavelka2002). In relation to livestock trampling, there is a need to regulate and even eliminate grazing load during the nesting period (Moreno et al. Reference Moreira, Morgado and Arthur2010). In the case of Castro Verde this is particularly relevant, given the importance of extensive sheep and cattle grazing in the region and the large area of fallow land and pastures.
Nesting habitat use and selection
Great Bustard nests in Castro Verde were spatially aggregated, occupying a minimum area of 44.1 ha, which can be considered a realistic approximation to the real area used for nesting by Great Bustard females in the study area, given the exhaustive and homogeneous sampling effort. Aggregated spatial distribution patterns have been suggested for other studied populations (Alonso et al. Reference Alonso, Martin, Alonso, Palacin, Magaña and Lane2004, Magaña et al. Reference Magaña2010), although this is the first study in which such aggregation has actually been measured and tested. Although it is not always the case (see Magaña et al. Reference Magaña, Alonso, Martín, Bautista and Martín2011), aggregation of nests in the Great Bustard often occurs in the vicinity of male lekking arenas (Alonso et al. 2000, Magaña et al. Reference Magaña2010), which is a common pattern among lekking birds (see Höglund and Alatalo Reference Höglund and Alatalo1995). On the other hand, the range of distances at which nest clustering occurs can be used as a criterion to spatially delimit the application of management measures aimed at increasing nesting success. Nest density (locally, up to eight nests/1000 ha), was similar to that found in other large populations of the species, such as Villafáfila, where Ena et al. (Reference Ena, Martínez and Thomas1987) reported 5.15 nests/1000 ha.
Great Bustards in Castro Verde nest mainly in fallow fields and cereals, and very rarely in ploughed fields and young tree plantations. Although more nests were found in fallow land, cereal fields were the more intensely selected habitat type for nesting. The next most selected habitat types were young fallows, closely followed by old fallows. This nesting habitat selection pattern is similar to that found in other Great Bustard populations in Germany, Hungary and Spain (Petrick Reference Palacín and Alonso1996, Faragó et al. Reference Faragó, Giczi and Wurm2001, Magaña et al. Reference Magaña2010), as well as to that described by Morgado and Moreira (Reference Moreno, Morales and Traba2000) for a much smaller sample from Castro Verde. Both cereal fields and fallows probably provide the required anti-predator shelter for incubating females, in addition to adequate insect food supply (García and Arroyo Reference García and Arroyo2005, Traba et al. Reference Sutherland, Newton and Green2008). Predation of nests and incubating parents is a widespread and strong selection pressure in ground nesting birds (Yanes and Suárez Reference Wiegand and Moloney1995), including Great Bustard (Martín Reference Manly, McDonald and Thomas2008), whose habitat selection at the vegetation structure level can be considered a result of a trade-off between the need for concealment and the need for anti-predator survey (Morales and Traba Reference Morales and Martín2009, Magaña et al. Reference Magaña2010). In this respect, Morales and Traba (Reference Morales and Martín2009) showed that the vegetation structure selected by breeding females largely coincides with that generally found in cereal fields.
Yearly differences in the selection of fallows (highest in 2002 and 2003) and cereal fields (highest in 2004) may be related to the state of cereal growth in the corresponding year. As mentioned above, cereal sowing in 2004 was delayed due to excessive autumn rainfall, which produced a sparser cereal structure more suitable for nesting (pers. obs.). So the stronger selection of cereal fields in 2004 suggests that the difference was caused by the greater attractiveness of this habitat type.
The high selection for fallows (which are, in fact, the most intensely selected habitat type in some studies; see Magaña et al. Reference Magaña2010) poses an interesting question related to the management of cereal pseudo-steppes. In very intensive cereal farmland, fallows can play a key role as refuge habitat when too densely sown cereal fields prevent utilisation by Great Bustards and other species. However, in less intensive areas, where fields are more sparsely covered by cereal plants due to climate conditions or poorer soils, cereals would be preferred by Great Bustards (such is the case of Castro Verde), whereas fallows (normally with shorter vegetation due to grazing) are more frequently selected by smaller-body sized species such as Little Bustard Tetrax tetrax or Calandra Lark Melanocorypha calandra, which tend to avoid cereals (Morales et al. Reference Morales, Alonso and Alonso2008, Morgado et al. Reference Morgado and Moreira2010, Silva et al. Reference Shlyakhtin, Tabachishin, Khrustov and Zav’yalov2010). Land management recommendations for farmland bird conservation and agri-environment schemes (AES) should consider these site-specific differences, as well as the implications of changing agricultural policies (currently promoting the abandonment of cereal cultivation in Castro Verde) and climate change. Finally, the spatial association at intermediate scale between nest locations and areas where both cereals and fallows are present highlights Great Bustards’ dependence on landscapes dominated by the cereal-fallow mosaic generated by the culture rotation systems typical of Mediterranean dry farming. Therefore, these extensive agricultural landscapes should be maintained (e.g. via cross-compliance extensification measures) in order to conserve this and other steppe bird species.
Acknowledgements
We are indebted to all the people who provided valuable field information, particularly the shepherds, farmers and field biologists of the Campo Branco region. P. Rocha was financed by Grant SFRH/BD/3141/2000 from the Fundação para a Ciência e Tecnologia of Portugal.



