
INTRODUCTION Paolo Biagi
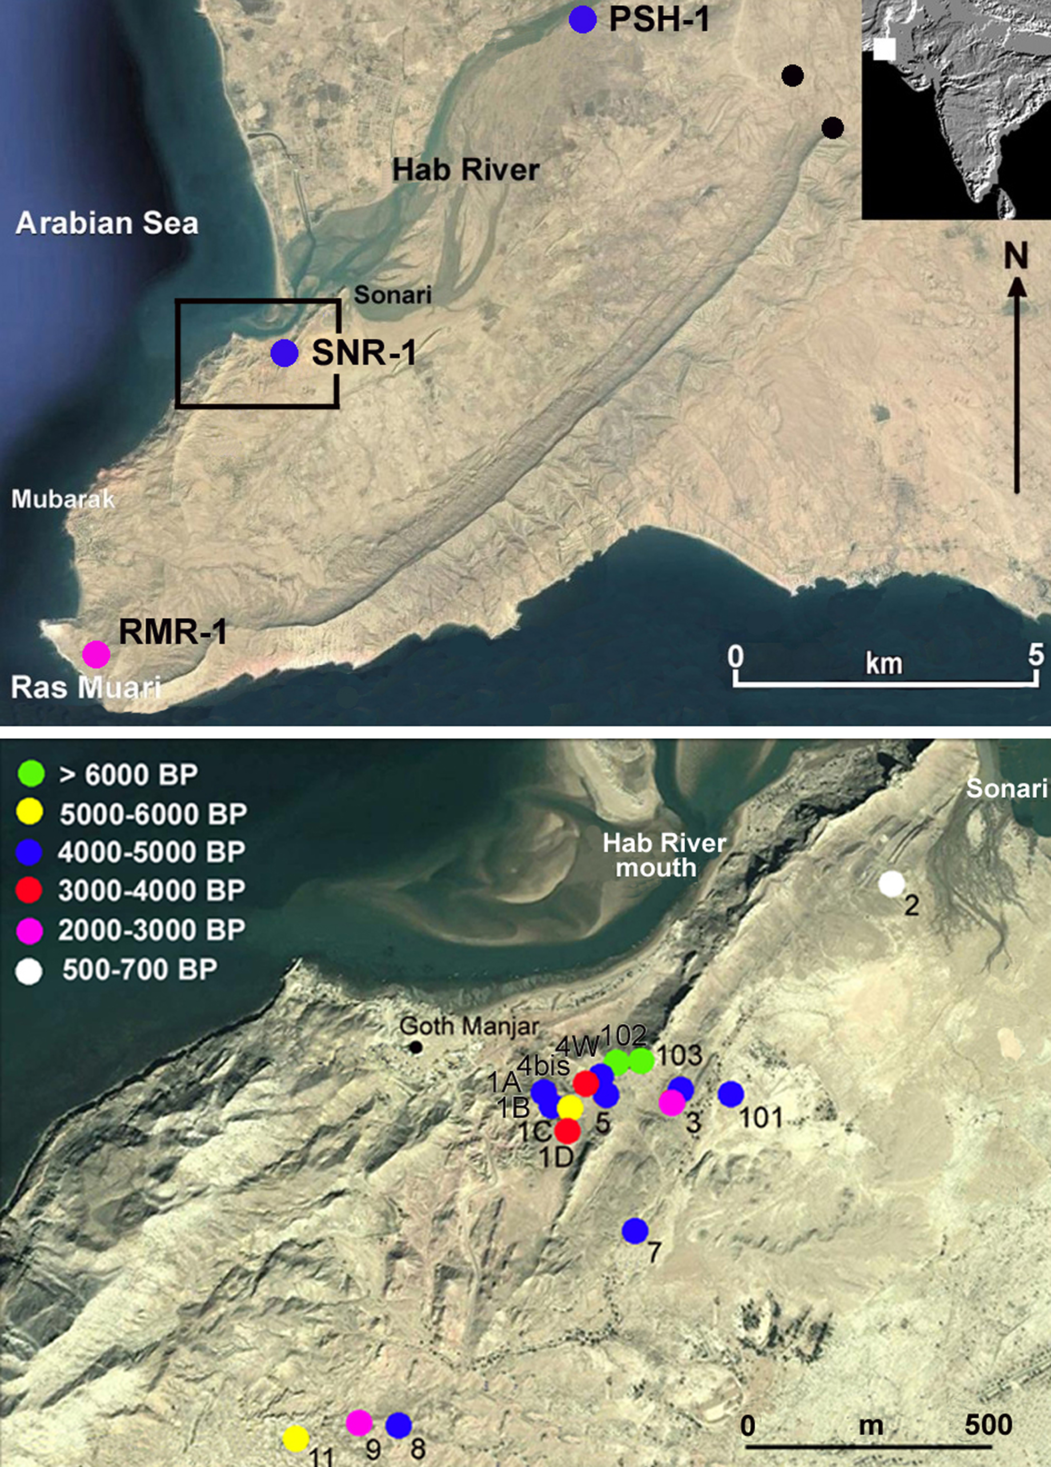
This paper presents and discusses the research carried out in 2013 and 2014 by the Italian Archaeological Mission in Sindh and Las Bela (Balochistan, Pakistan), part of an archaeological project conducted in the region since 2000. More precisely it describes the results of the surveys conducted along the northern side of Ras Muari (Cape Monze, Karachi) between the present village of Sonari at the Hab mouth, in the north, and the Baloch coastal settlement of Mubarak, a few kilometres north of the cape, in the south (fig 1).Footnote 1
Sonari: (top) the area surveyed in 2013 and 2014 with the location of the radiocarbon-dated sites of Pir Shah Jurio (PSH-1), Sonari (SNR-1) and Ras Muari (RMR-1) and two Mesolithic sites discovered near Sona Pass by A R Khan in the late 1970s (black dots); (bottom) distribution and chronology of the Sonari sites. Maps: R Nisbet and P Biagi.
This territory had never been studied in detail before the 2000s. Previous surveys were carried out by Professor A R Khan of the Institute of Geography, Karachi University, during the second half of the 1970s. His surveys led to the discovery of many archaeological sites of different ages, from the Palaeolithic to the Buddhist and Muslim periods,Footnote 2 among which is the prehistoric settlement of Sonari (SNR-1). Sonari is the only Bronze Age fisher-gatherer village ever discovered along the northern coast of the Arabian Sea with rectangular stone structures and net sinkers. The site is so far unique, and very important for the study of the Bronze Age of a region located at the south-western edge of the spread of the Indus Civilisation, where different archaeological aspects from the Indian subcontinent, the Arabian/Persian Gulf and the Gulf of Oman interacted.Footnote 3
The scope of the 2013 and 2014 research was also to fill a chronological gap in the archaeology of the territory, which extends between Lake Siranda in the west and the Indus Delta in the east, by means of a systematic programme of accelerated mass spectrometry (AMS) dates. To date, more than 100 radiocarbon dates have been obtained from samples collected from the coastal region, mainly from shell middens and scatters of mangrove and marine shells recovered during the surveys conducted in the last twenty years.Footnote 4
Our surveys were conducted on foot in August 2013 and January 2014 by two of the present authors (PB and RN). They were repeated systematically four different times following the same track: starting from the Hab mouth, where the present fishers’ village of Sonari is located, walking from north-east to south-west across small fans and slope debris along the ridge that runs at the northern edge of the alluvial plain where the saddle inside which the prehistoric settlement of Sonari SNR-1 is located, and then south-west towards the village of Mubarak and the Arabian Sea coast.
The surveys led to the discovery of many archaeological sites, most of which consist of concentrations of shell fragments lying at the top of wind-borne sediments and distributed over an area of c 0.5km2 at altitude 14–31m asl. The presence of scatters of marine and mangrove shells had already been reported by W T Blanford in the late 1800sFootnote 5 and O Schmieder in the 1950s.Footnote 6 It is important to note that the recorded shell features cannot be due to natural factors – they must be attributed to the human exploitation of past marine and mangrove environments during different ages. In fact, most shells have been intentionally fragmented by hard hammering to extract meat in a way that cannot be due to natural causes or animal predation. Moreover, the shell scatters consist of circular/oval concentrations, never alignments as would be the case if they had been deposited by sea wave/tide action.
Each archaeological site, irrespective of its age, was recorded by global positioning system (GPS) device and precisely positioned with the help of Soviet military maps and high magnification satellite photographs. One specimen of marine and mangrove shell species was collected from each site for identification. Whenever available, one single adult specimen of Terebralia palustris or Telescopium telescopium gastropod was selected for dating and defining where mangroves flourished around the cape. If mangrove shells were not available, specimens of Meretrix sp, Lunella coronata and Turbo bruneus marine shells were sampled for dating. All the dated samples were collected from the central part of each site, and located by GPS (see table 2). A first preliminary report on Sonari was published in 2004,Footnote 7 and a short note regarding the preliminary results of the 2013 survey were published in 2014.Footnote 8
ENVIRONMENTAL SETTING AND NATURAL RESOURCES Renato Nisbet and Paolo Biagi
The peninsula protruding into the Arabian Sea towards Ras Muari (fig 1, top) is formed by two low rocky chains that shape its northern and southern coasts, and the shallow alluvial basin that opens between them. The scanty vegetation consists of halophytes close to the shore and a few spiny shrubs along the rocky slopes and gullies. All of the semi-arid region of south-western Sindh is relieved by the summer monsoon,Footnote 9 with a rainfall of 80–90mm that is nearly a half of the annual precipitation in the area.Footnote 10
South of the Hab estuary, sedimentary rocks of Oligocene and Miocene age form the hilly chain facing the Arabian Sea that elongates south-west for 7km down to Cape Monze.Footnote 11 They are mostly composed of fine-grained to conglomeratic sandstone, interbedded with limestone and calcareous sandstone. The geology of the area strongly affects its morphology, as the succession of softer and harder rocks originated the characteristic local deflated mesas that are sometimes partly covered with aeolian deposits. The north-eastern segment of the range, facing the village of Goth Manjar, culminates at 45m. Its wide, almost flat, surface is easy to access from the south throughout a narrow passage (24°52′41.0″N–66°41′38.5″E) that leads to the saddle inside which the archaeological site SNR-1 is located.
South of the range, a large alluvial plain fills the area between the coasts. The plain is open towards the Hab, whose waters seasonally flow into it. Its surface gradually rises inland (westwards) for at least 1km, where isolated limestone outcrops, sand dunes and conglomerates reach 15–20m.
The whole Makran coast is subject to Quaternary and Holocene tectonic activities that shape the territory in multiple forms, among which are mud volcanoes, strong earthquakes, coastal uplift with raised beaches, faulting in younger sediments and river terraces.Footnote 12 An uplift of c 100m has been suggested for the western part of the Makran coast, gradually reducing to 2–3m in the Indus Delta.
R A Khan described the presence of a fault around Ras Muari,Footnote 13 which is part of the huge Karachi Arc generated by the motion between the Arabian and Asian plates.Footnote 14 Following Quaternary neotectonic processes, the cape has been formed by a strong uplift, as is shown by the occurrence of raised beaches close to the seashore. Just 300m from the present coastline, and c 0.5km south of the seasonal stream along which Mubarak village is located, a continuous horizontal layer of Lunella coronata marine shells was observed along natural erosion of a stream at c 2m of depth from the topsoil and 16m of altitude. One shell specimen was collected and dated to 2955±35 cal bp (RMR-1: GrA-62254) (fig 1, top). This is one of the most recent radiocarbon dates obtained from our Las Bela/Indus Delta survey. It deserves further investigation because of the absence of archaeological sites of this period in the cape that makes the presence of this shell horizon intriguing. Increasing evidence of eustatic/tectonic changes along the sea side that might have affected archaeological sites’ visibility even in historic times has been demonstrated for the coast east of the Indus Delta, Gujarat in particular.Footnote 15
Apart from unique geomorphologic characteristics, archaeological aspects should also be considered in their settings, as documented by G F Dales.Footnote 16 These include uplifted coastal and riverine Indus Civilisation ports such as Sutkagen-dor and Sotka-koh, at present located several kilometres from the coastline in the Gwadar-Ormara region of Makran, and Mai Gondrani Buddhist caves that open in vertical walls of faults in Las Bela Valley.Footnote 17 These geological conditions (crustal instability and strong uplift) should be taken into account when considering the changing past relationships between the archaeological sites of the area and the Hab mouth mangrove forest. Affecting Hab water discharge, together with climatic change, these movements might have caused the decline of mangrove environments and consequently the availability of its food and wood resources, until the very recent disappearance of this unique ecosystem (GrA-59834: 670±50 bp on T telescopium).
THE 2013 AND 2014 SURVEYS Renato Nisbet and Paolo Biagi
The main scopes of the 2013 and 2014 surveys were to record and reconstruct the history of human presence and interference in an almost unknown territory of coastal Sindh and Las Bela. Therefore, the following strategy has been adopted: 1) record and precisely locate each archaeological site by GPS device;Footnote 18 2) radiocarbon date the periods of human settlement by means of mangrove and marine shells recovered from the sites; 3) define the presence and death of mangroves at the Hab mouth and their different periods of human exploitation; and 4) study the Bronze Age fisher-gatherers village of Sonari (SNR-1) and its eventually related archaeological evidences.
The discovery of SNR-1 is very important since so far we do not have any evidence of other prehistoric fisher settlements along the northern coast of the Arabian Sea, despite great emphasis given to their presence in different periods.Footnote 19 The territory discussed in this paper is part of the mythical land of the Ichthyophagoi (fish-eaters) described by ancient Greek and Roman authors,Footnote 20 according to whom Las Bela was settled by groups of Oritae. However, we have scarce information regarding the locations and characteristics of their villagesFootnote 21 and their eventual relationship with other sites of the interior. This absence of evidence contrasts with that of the many Indus Civilisation and later port towns known from neighbouring Gujarat in India.Footnote 22 Moreover, the coast west of Karachi is considered to be one of the important north Arabian Sea sources from which large oceanic shells were exploited and traded to supply the artisan workshops of the Indus cities.Footnote 23
Our surveys led to the discovery of many archaeological sites. They mainly consist of man-made heaps or scatters/spots of decoloured, fragmented marine and mangrove shells, samples of which were AMS dated from most sites (fig 1, bottom; tables 1 and 2).
Sonari: list of the archaeological sites and their main characteristics. Abbreviations: T.p. (Terebralia palustris), T.t. (Telescopium telescopium), A.r. (Anadara rhombea), Cy. (Cypraea sp), L.c. (Lunella coronata), M. (Meretrix sp), O. (Ostrea sp), T.b. (Turbo bruneus), T.py. (Turbinella pyrum).

Sonari: date list of the radiocarbon-dated sites. Calibrations according to the marine curve of 229±27 14C years (see Reimer and Reimer Reference Reimer and Reimer2001).

The most recent AMS date (670±50 bp: GrA-59834) was obtained from a small scatter of Meretrix sp, Cyprea sp and T telescopium fragments (SNR-2 on T telescopium, see table 2). The result shows that a mangrove environment was still flourishing around the Hab’s mouth during the seventeenth to nineteenth centuries ad, though we do not know exactly when it began to disappear.
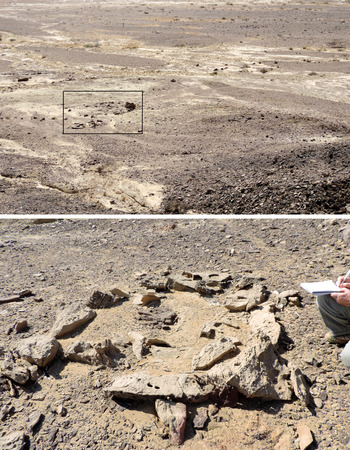
Close to site SNR-2, along the foot of the ridge, five Islamic tombs were discovered c 100m from the south-westernmost limit reached by the Hab’s floods (SNR-100: fig 2, top). The tombs are roughly rectangular, except for one that is almost oval and oriented east–west. They measure c 1.50 × 1.20m, and are delimited by medium-sized, limestone blocks (fig 2, bottom). They were numbered from 100A to 100E. Inside and around them a few grave goods were recovered. They consist of two conjoining sherds of one small Chinese porcelain cup painted in blue, probably attributable to the sixteenth century ad,Footnote 24 from graves 100A and 100C (fig 3, no. 2), a few ceramic potsherds (fig 3, nos 1, 3 and 5), and a few pieces of a glass necked flask (fig 3, no. 7) from the surface of graves 100B and 100C (fig 3, no. 8) (table 5).
Sonari: (top) the Islamic graveyard SNR-100 from the south-west; (bottom) tomb SNR-100A. Photographs: R Nisbet.

Sonari: potsherds and glass fragments from graveyard SNR-100. 1, 3 and 5: ceramic; 2 and 4: Chinese porcelain; 6–8: glass vessels (see table 5). Photographs: E Starnini.

A scatter composed exclusively of fragments of marine and mangrove shells was found c 500m south-west of the graveyard (SNR-101). A few pieces of Turbinella pyrum, a large oceanic shell often exploited in prehistoric and historic times for the manufacture of different types of artefacts,Footnote 25 were collected from its surface. The site was dated to 4690±35 bp (GrA-62252 on T palustris).
SNR-3 was discovered c 150m west of SNR-101 on the lower part of the slope that takes to the saddle inside which the settlement of SNR-1 was found (fig 4, top). The site consists of irregular spots of marine and mangrove shell fragments scattered over a surface c 25m in diameter. Two different dates suggest that the site was settled during different periods. In fact, one Lunella coronata specimen yielded the result of 4280±30 bp (GrA-67145), while one T palustris gastropod was dated to 2195±30 bp (GrA-62249). The assays show that while part of the midden accumulated around the end of the Bronze Age, a mangrove environment was still flourishing in the surroundings during the third to fifth centuries ad.
Sonari: (top) SNR-3 from south-west; (bottom) SNR-8 from west. Photographs: P Biagi.

Another scatter of T telescopium and T palustris fragments recorded c 300m south-southwest of SNR-3, along the edge of the same ridge (SNR-7), was dated to 4560±60 bp (GrA-59832). It shows that a mangal environment was present in the area also during the Bronze Age.
Moving farther south-west, five more shell spots were discovered. Site SNR-8 is an eroded midden located c 650m from SNR-7 (fig 4, bottom). It is a c 40m long scatter of marine and mangrove shells, dated to 4405±35 bp (GrA-66251 on T palustris). Some 80m west of the site, a heap of Lunella coronata shells (SNR-9), c 1.50m in diameter, was dated to 2190±50 bp (GrA-59831). It was found close to another scatter of Lunella coronata and Meretrix shells (SNR-10). SNR-11 is a spot of Turbo bruneus marine shells found on the surface of an eroded terrace. It was dated to 5650±60 bp (GrA-59830).
SNR-12 is a heap of marine gastropods, c 1.50m in diameter, while SNR-13 is another small spot of Meretrix marine shells dated to 3520±50 bp (GrA-59829).
Other sites were recorded inside the saddle, the most important of which is the prehistoric fisher-gatherer village of SNR-1 discovered by A R Khan in the late 1970s (fig 5). The settlement is a C-shaped feature made of collapsed limestone blocks well-sheltered inside the saddle that makes it invisible from both the sea and the Hab plain (fig 6). The site is c 30m long (north–south) and 35m wide (east–west). Its north, concave, side faces the Arabian Sea.
Sonari: view of the terrace with the location of SNR-1 (rectangles), and the area covered by SNR-4 in the foreground. Photographs: P Biagi.

Sonari: (top) SNR-1, stone-walled structures filled with shells in the western part of the site; (bottom) stone rubble in the eastern part. Photographs: P Biagi.

SNR-1 is composed of at least six rectangular rooms (or cabins) of different size delimited by limestone blocks. Their floors are covered with Meretrix and a few other shells that were sampled for radiocarbon dating (fig 7; tables 1 and 2). Most rooms are oriented east–west, only one is north–south (SNR-1B). The rooms SNR-1A, SNR-1A1 and SNR-1A2 are adjacent to each other. The larger feature SNR-1A was built west of SNR-1A1 and SNR-1A2, north of the previous one following the same orientation. Most probably, more rooms are buried in the eastern part of the village below the stone rubble.
Sonari: (top) SNR-1, stone-walled structure SNR-1A; (bottom) valves of Meretrix sp shells on its floor. Photographs: P Biagi.

Just in front of the concave side of the settlement, three shell heaps were recorded of different size and thickness, made of fragments of mangrove and marine shells, called SNR-1AC1, AC2 and AC3 (table 1). Regarding these features, it is important to note that around the end of the eighteenth century Lieutenant R Hughes-Buller reported the presence of small shell heaps along the coast of Makran, related to the production of lime from shells, whose scope was to lime cotton nets.Footnote 26 This process is accurately described by M I Siddiqi in his article on the fishers of West Pakistan, in which he points out that in Las Bela lime was obtained exclusively from T telescopium shells.Footnote 27 Therefore, we suggest that the SNR-1 shell heaps might be related to a similar activity that took place mostly during the Bronze Age.
SNR-4 is a wide triangular spot, c 75m long, sloping c 6m south-eastwards. It consists of colluvial shells, among which a few lithic artefacts were collected (fig 8). The site is very rich in mangrove and marine shell specimens, including fragments of Turbinella pyrum. The spot is delimited by the following coordinates: 24°52′39.4″N–66°41′35.7″E (SNR-4, central point), 24°52′39.4″N–66°41′35.2″E (SNR-4bis), 24°52′38.8″N–66°41′34.6″E (SNR-4W) and 24°52′38.7″N–66°41′36.5″E (SNR-4E). It is impossible to say whether SNR-4 is a single site or results from the erosion of more middens, as two different T palustris radiocarbon dates would suggest (SNR-4bis: GrA-62250: 4520±35 bp and SNR-4W: GrA-66633: 3995±35 bp) (fig 9).
Sonari: distribution maps of the stone tools (top), knapped stones and ceramic potsherds (bottom). Maps: P Biagi and R Nisbet.

Sonari: distribution map of the radiocarbon-dated sites on the terrace. Map: P Biagi and R Nisbet.

Two more points were taken by GPS within site SNR-4. The first marks the presence of a microlithic backed point (SNR-5) surrounded by fragments of T telescopium shells, one specimen of which was dated to 4470±60 bp (GrA-59833). The second is a bladelet core made of dark reddish brown Gadani chert (SNR-6) (fig 8).
THE STONE ASSEMBLAGE: FISHING EQUIPMENT Elisabetta Starnini
Our current knowledge of the presence of prehistoric fishing communities along the south-western coast of Pakistan is still very scarce. This fact contrasts with the evidence available from the Sultanate of Oman and the south-eastern coast of the United Arab Emirates, where c fifty years of surveys and the excavations carried out in aceramic shell middens and other types of Bronze Age sites have yielded a great variety of fishing implements. Among these are different types of stone net sinkersFootnote 28 and fish hooks made from shell and copper,Footnote 29 though remains of nets are almost absent with the exception of one Bronze Age specimen from the interior of the Makran coast (fig 10).Footnote 30
Distribution map of the most important sites of the Arabian Sea coasts mentioned in the text: 1) Lake Siranda, 2) Bay of Daun, 3) Ras Gadani, 4) Sonari, 5) Mulri Hills, 6) Kadeji Gorge, 7) Ongar, 8) Amri, 9) Pasni, 10) Sutkagen Kot, 11) Ras al-Khaimah, 12) Bandar Jissah, 13) Ra’s al-Khabbah. Drawing: P Biagi.

Simple, double-notched flat pebbles of various sizes are the commonest stone implement associated with fishing.Footnote 31 Their size variability has been related to different fishing techniques. The general impression is that small sized items and weight are associated with casting or ‘beach seine net’, while specimens of a larger size and weight belong to gill nets or large ‘seine nets’. However, this simplistic subdivision makes problematic the attribution of medium size and weight specimens.Footnote 32
Net sinkers, obtained from flat oval pebbles notched roughly in the middle of their long sides, are known from many Omani coastal sites of the Saruq and Bandar Jissah facies, dated between c 7000 and 5000 bp,Footnote 33 though they are known also from more recent Bronze Age sites.Footnote 34 Their form and weight variability is believed to show some chronological significance,Footnote 35 though some authors suggest that their different typology might derive from certain local traditions.Footnote 36
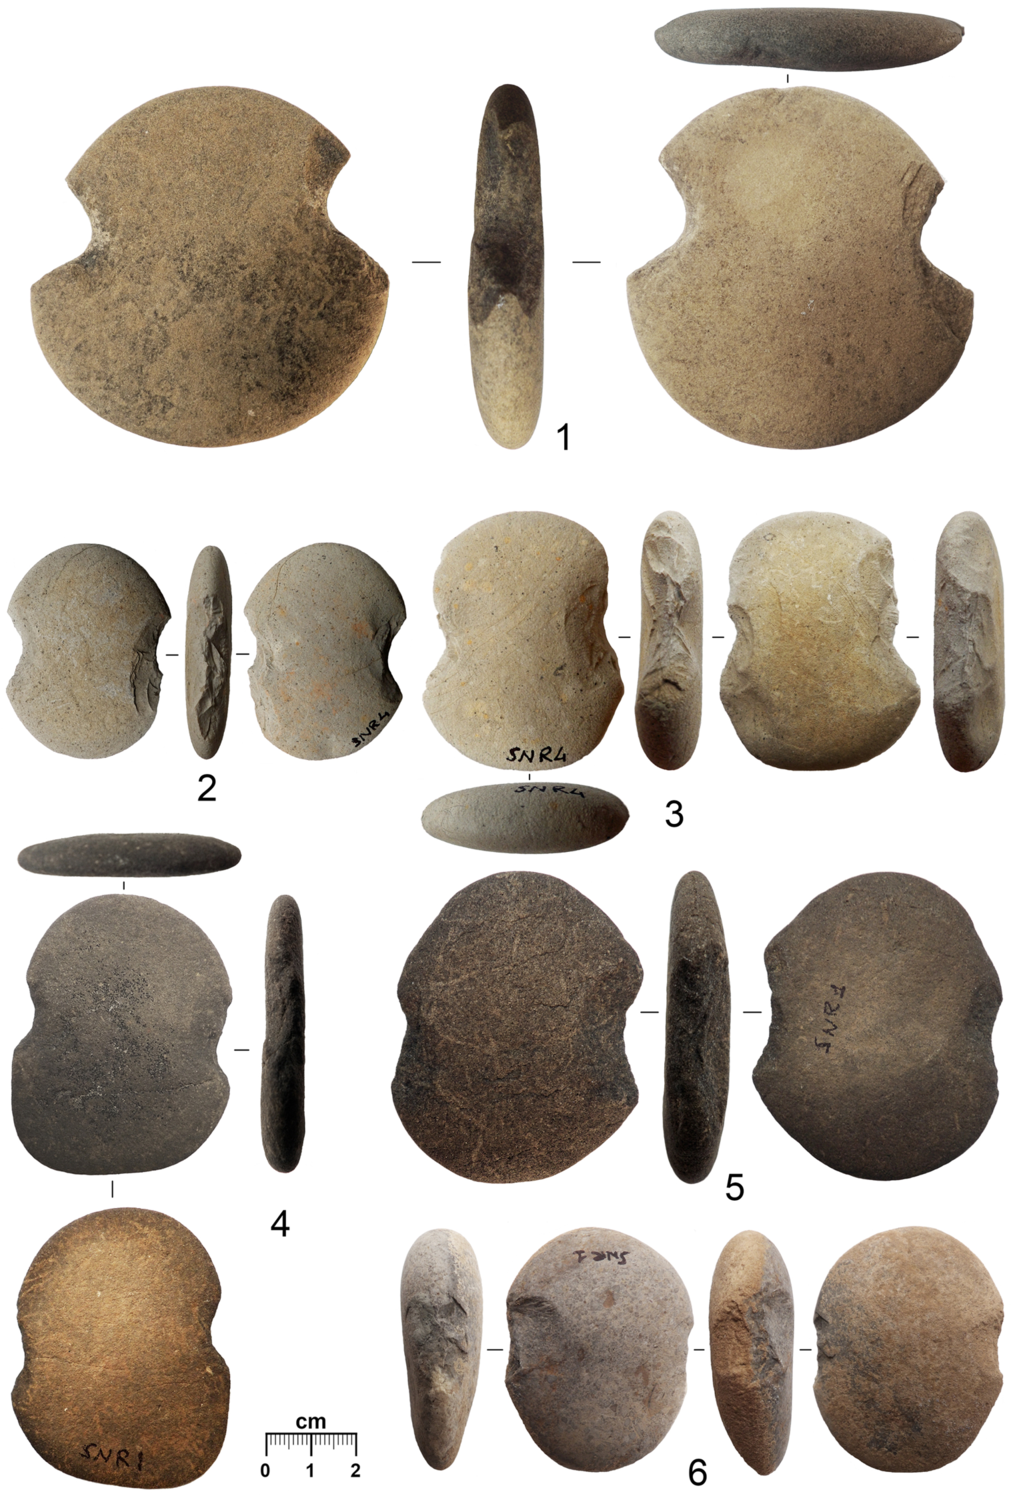
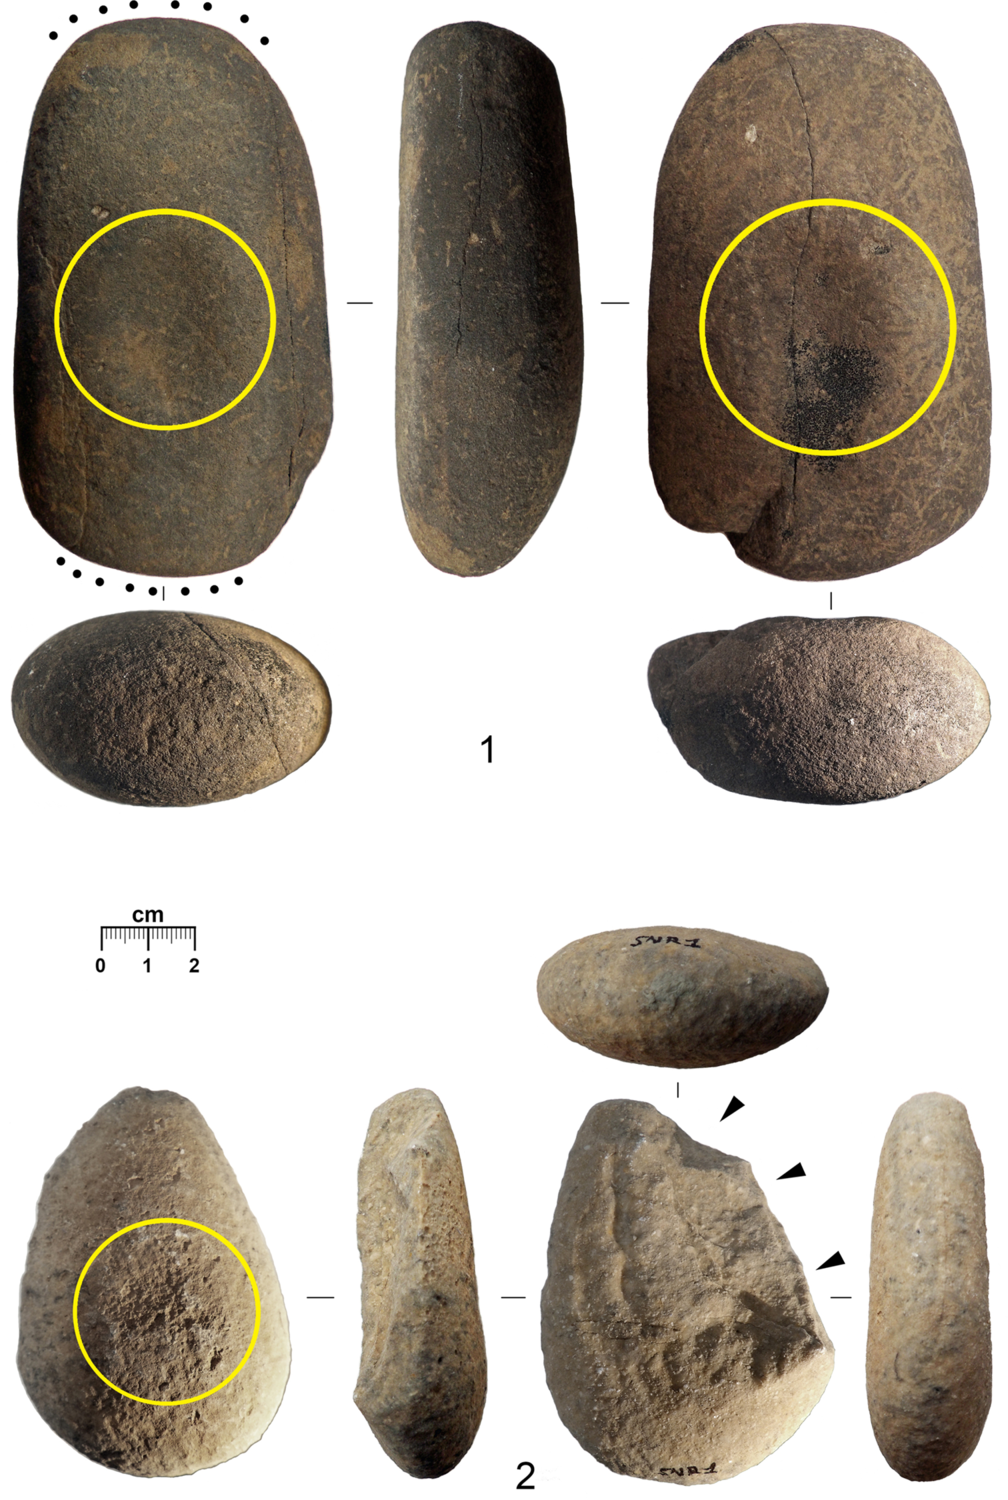
Besides five specimens already published in a preliminary report in 2004,Footnote 37 ten more net sinkers were collected from some of the Sonari sites (fig 8, top; fig 11; fig 12, nos 2–5; fig 13, no. 3). Their weight varies from small types of 22g to heavier specimens up to 168g (table 3). Most artefacts are less than c 100g, ie lighter than those reported from the Arabian/Persian and Oman Gulfs, Bronze Age Umm an-Nar period.Footnote 38 They can be compared with a group of medium-sized sinkers from the Middle Holocene coastal site of Ra’s al-Khabbah (KHB-1) in Oman.Footnote 39
Sonari: stone net sinkers. 1 and 2) SNR-4; 3) SNR-4bis; 4–6) SNR-1. Photographs: E Starnini.
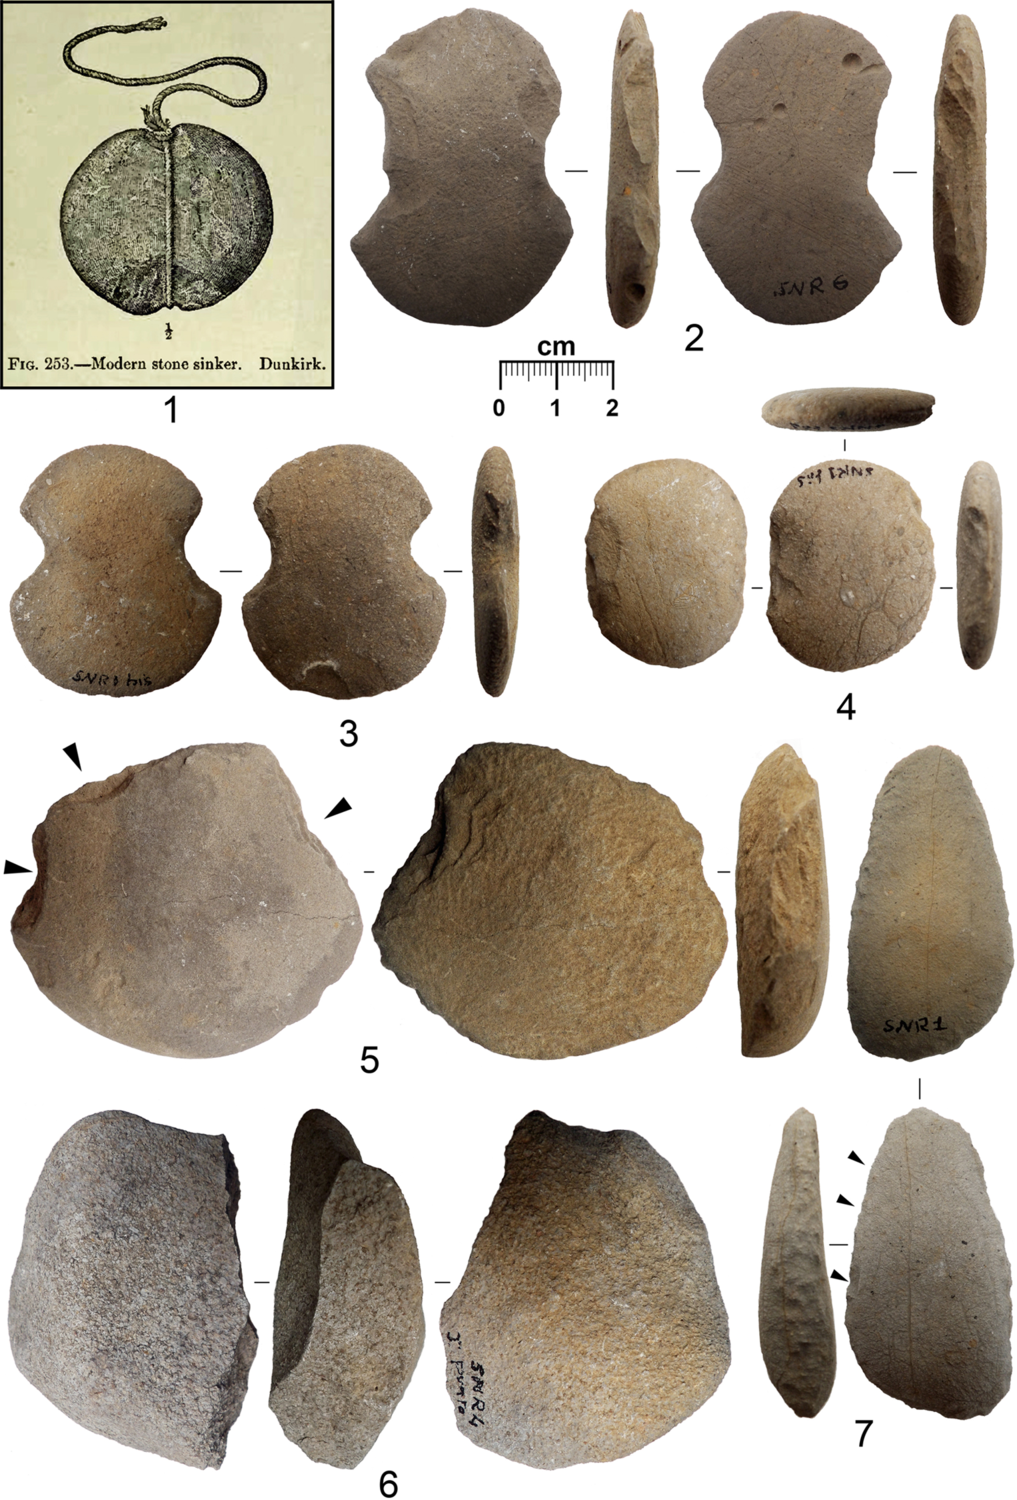
1) Illustration from C Rau (Reference Rau1884, fig 253) showing a notched stone net sinker of the native fishers of the Great Lakes in North America; 2) stone net sinker from SNR-6; 3) net sinker from SNR-1bis; 4) net sinker from SNR-1bis; 5) net sinker on a pebble flake with chipped sides from SNR-4; 6) fragment of a grinding implement with one concave, worn working platform, from SNR-4; 7) weathered pebble flake with side retouch, from SNR-1. Photographs: E Starnini.
Sonari: stone artefacts from SNR-4. 1, 2, 4 and 5) pebble flakes with chipped margins; 3) net sinker from a small pebble with centripetal flaking on one face. Photographs: E Starnini.

Sonari: list and description of the stone artefacts.

The Sonari net sinkers consist of flat pebbles with two opposed notches knapped in the middle of the long sides, around which a string can be firmly tied. These objects are often reported in the literature as ‘net weights’, ‘notched pebbles’, ‘fishing weights’ or ‘notched weights’. Indeed, the blanks have been carefully selected among the limestone beach pebbles that abound along the shores of Cape Monze, the sole modification being represented by the two opposed, bifacial notches knapped by hard hammering.
The size variability of the Sonari net sinkers can be explained either as consequent to different, albeit contemporaneous, fishing strategies adopted by the same community or as a chronological proxy implying multiple frequentations of the site. Therefore, it is necessary to examine their significance in better detail.
These stone objects were illustrated and described for the first time by C Rau towards the end of the nineteenth century in his book devoted to prehistoric fishing, where he discussed the finds from some European lake sites.Footnote 40 He noticed that their production technology and shape are similar to those of the North American aboriginal net weights extensively used by native fishers for weighting gill nets along the shores of the Great Lakes (fig 12, no. 1). The ethnographic parallels provided by Rau are an undisputable proof of the function of these stone artefacts. The same author noticed another characteristic of the stone sinkers, ie their size variability, most probably related to their different use and fishing techniques.Footnote 41
H-P Uerpmann and M Uerpmann, describing stone implements from the prehistoric fishers’ sites of Oman,Footnote 42 distinguished two basic types according to their manufacture technology. They called them N-type (‘Normal’, ie made from oval pebbles notched on their longer sides) and R-type (‘Retouched’, ie with a retouch shaping the whole outline of the pebble on both faces and notches) respectively, assuming that their difference is related to two different functions and fishing techniques. All the Sonari specimens, regardless of their size, fit into the N-type category, except for one atypical item (fig 13, no. 3).
Similar artefacts are known from the Neolithic site of Sha’ar Hagolan, and many other sites in Israel, dated from the Upper Palaeolithic to the Early Bronze Age.Footnote 43 Here, stone net sinkers in the form of notched pebbles have been related to freshwater fishing with ‘throwing nets’ or fishing lines or rods. This fishing gear was apparently first used by Upper Palaeolithic and Epipalaeolithic hunters and gatherers, though their use was continued by sedentary Neolithic communities.Footnote 44 Moreover, it has been suggested that differences in the form of weights, size and the location and size of the notches may indicate different fishing methods, probably related to tying. Their occurrence within archaeological sites is considered to be consequent to the discard of the net.Footnote 45
According to Siddiqi,Footnote 46 who studied the fishers’ settlements of the south-western coast of Pakistan in the 1950s, ‘the most promising fishing grounds are situated at the mouths of the rivers, where the small fish congregate and attract the larger ones’. The same author reports that stones equipped the gears at the fishers’ settlements of Makran and Las Bela,Footnote 47 although he did not provide us with any description of the net weights.
Moreover, stone net sinkers are part of the material culture of the Jōmon hunter-gatherers of prehistoric Japan,Footnote 48 who were also skilled fishers since the Initial Jōmon period (ninth to seventh millennia bp). Ichthyologic studies have shown that the Jōmon fishers captured salmon and trout running upstream during the autumn, carp in the freshwater zone, black sea bream and sea bass in the estuarine water and, most interestingly, bonito and tuna in the off-shore zone.Footnote 49 Y Kondo provided a very interesting spatial analysis of the archaeological contexts (house, midden, pit, etc.) where Jōmon net sinkers have been recorded,Footnote 50 discovering that disposal loci can be classified into settlement (on-site) and non-settlement (off-site). The same author observed a significant correlation between fishing potential and standardised weight of sinkers,Footnote 51 interpreting the variability of sinkers in function of fishing conditions such as water depth, target fish and expected fish catch. The variability of net fishing strategies is explained as a means to effectively exploit the aquatic resources available close to settlements in accordance with their population size and location.Footnote 52 Therefore, we can confidently interpret our net weight assemblage from Sonari as evidence of fishing most probably related to different fish catches.
Other Sonari stone objects consist of several pebble flakes with retouched sides or edges, resembling large scrapers (fig 12, no. 7; fig 13, nos 1, 2, 4 and 5). They have never been reported or described before from any other Pakistani Arabian Sea site, except for one limestone specimen from Daun-111 shell midden (Las Bela), AMS dated to the mid-seventh millennium bp.Footnote 53 These tools resemble the so-called ‘heavy duty scraping tools’ that are known from many Late Stone Age sites of Oman whose subsistence economy was based on the exploitation of marine and mangrove resources.Footnote 54
Sonari also yielded some pebbles with traces of hammering and pitting in the form of shallow, rounded cup marks (fig 14, nos 1 and 3; fig 15), These tools have often been described as anvil stones and hammers, and have been retrieved from shell middens of both the Arabian Sea coasts.Footnote 55 Pebbles with pecked round grooves roughly in the centre of both surfaces from the Omani shell middens have been interpreted as crushing stonesFootnote 56 for breaking the hard shell of mangrove gastropods to extract their meat.Footnote 57
Sonari: stone artefacts. 1) anvil stone/hammerstone on pebble from SNR-4; 2) small, rounded flaked pebble, from SNR-1; 3) anvil stone on pebble, used on both sides, from SNR-4. Photographs: E Starnini.

Sonari: stone artefacts. 1) anvil stone/hammerstone on pebble from SNR-4; 2) fragment of flat pebble, probable hammerstone, from SNR-1. Photographs: E Starnini.
Finally, there are two stone tools on cobbles that can be interpreted as lower parts of grinding implements. They are made from sandstone and present one worn, concave working platform (fig 12, no. 6).
To sum up, the small assemblage of stone tools described above can be attributed to the activities of a community of fisher-gatherers that exploited sea and mangrove environments. On the basis of the typology of the associated potsherds and the radiocarbon dates it can be attributed to the Bronze Age (figs 8 and 9).
THE KNAPPED STONE ASSEMBLAGE Paolo Biagi
A few knapped stone artefacts were collected from the sites located on the Sonari terrace. Most specimens come from a spot called SNR-1bis, c 30m east of SNR-1 (table 4). They consist mainly of fragments of bladelets and flakelets,Footnote 58 only one of which is retouched (fig 16, no. 2), and one straight perforator obtained from a small limestone flake (fig 16, no. 11). Most artefacts are made from a variety of dark reddish brown chert whose source is known at Ras Gadani (c 25km north of Sonari), from which we have traces of its exploitation, radiocarbon dated to the fifth millennium bp (GDN-0: GrN-26369: 4460±30 bp on T palustris).Footnote 59 One bladelet of high quality exogenous chert was found on the floor of room SNR-1B. It has a trapezoidal cross-section, straight parallel sides, semi-abrupt, inverse retouch along the right side and cut wood use-wear traces along the left side (fig 16, no. 10).Footnote 60 This tool can be compared with four other bladelets recovered in 2002, two of which show the same type of semi-abrupt retouch.Footnote 61 One microbladelet backed point of Gadani chert with abrupt retouch along the left side was collected from SNR-5 (fig 16, no. 1). One exhausted, prismatic core with microbladelet detachments on one face obtained from a small, corticated pebble of Gadani chert comes from SNR-6 (fig 16, no. 3), while another fragment of Gadani chert core with one prepared platform and microbladelet detachments on one face comes from SNR-4.
Sonari: list and description of the knapped stone artefacts. Colours of the Munsell Soil Color Charts 1992.

Sonari: knapped stone industry. 1) microlithic backed point from SNR-5; 2) retouched microbladelet fragment from SNR-1bis; 3) microbladelet core from SNR-6; 4) microbladelet fragment from SNR-1bis; 5) bladelet fragment from SNR-1bis; 6) microflakelets fragment from SNR-4bis; 7) microbladelet fragment from SNR-1bis; 8) microbladelet fragment from SNR-1bis; 9) microbladelet core from SNR-4; 10) used microbladelet fragment from SNR-1B; 11) perforator on limestone flakelet from SNR-1bis. Photographs: E Starnini.

The knapped stone assemblage from Sonari consists of very few artefacts. However, some considerations can be made on their typology, function and the raw material exploited to produce them. Most specimens are made from Gadani dark reddish brown chert,Footnote 62 though Rohri and Las Bela chert artefacts are also present. Gadani chert is easy to identify. It was exploited for making tools between the beginning of the HoloceneFootnote 63 and most probably the Indus period, as is shown by a radiocarbon date obtained from Ras Gadani (GrN-26369, see above). However, during this latter period the exploitation of Gadani chert seems to have partly ceased and been substituted by that of exogenous, better quality raw material extracted from the chert mines of Lower and Upper Sindh.Footnote 64 As far as we know, the present distribution radius of Gadani artefactsFootnote 65 extends roughly from the Mulri Hills at the eastern outskirts of Karachi, in the east, to Lake Siranda (Las Bela), in the north-west.Footnote 66
The presence of two cores, from SNR-4 (fig 6, no. 9) and SNR-6 (fig 6, no. 3) respectively, shows that at least some of the artefacts were produced on the spot. The backed point of no. 1 in fig 16 is atypical for a Bronze Age lithic assemblage, and might be better related to an earlier occupation, most probably of the seventh millennium bp. This attribution is suggested by the recovery of one comparable tool type, made from the same raw material, from the impressive Lake Siranda shell midden SRN-29, whose earliest occupation is radiocarbon dated between 7130±35 bp (GrM-18731)Footnote 67 and 6595±35 bp (GrA-54299), both on T palustris.Footnote 68 However, we have to consider that we know very little of the typology and technology of the knapped stone assemblages of the fisher-gatherers of this period, and most Gadani chert artefacts from the Sonari sites are indeed microlithic specimens. The presence of one regular bladelet of non-local chert from the surface of one of the SNR-1 structures is also important. Most probably it comes from Lower or Upper Sindh sources, among which are the Rohri Hills, Ongar and Jhimpir,Footnote 69 that undoubtedly supplied the Bronze Age Indus sites located around Sonari, including Pir Shah JurioFootnote 70 and Balakot.Footnote 71
The general impression, based on the study of the knapped stone artefacts at present underway from the Lake Siranda sites in Las Bela,Footnote 72 the Tharro Hills and Kot Raja Manjera, in Lower Sind,Footnote 73 suggests that important technological changes took place at the turn of the Chalcolithic in the study region, when pressure technique was introduced for the manufacture of regular blades and bladelets and new, exotic raw materials started to be exploited for the first time during the Amri Culture period.Footnote 74
THE POTTERY Michela Spataro
A few small potsherds come from the surface of three radiocarbon-dated sites (SNR-1, SNR-4 and SNR-8: tables 1 and 5; fig 8, bottom), two of which from structure SNR-1A2 (fig 17, nos 7 and 8).
Sonari: prehistoric potsherds. 1 and 3–5) SNR-1; 2) SNR-1Sud; 7 and 8) SNR-1A2; 12–15) SNR-4bis; 6 and 9–11) SNR-8 (see table 5). Photographs: E Starnini.
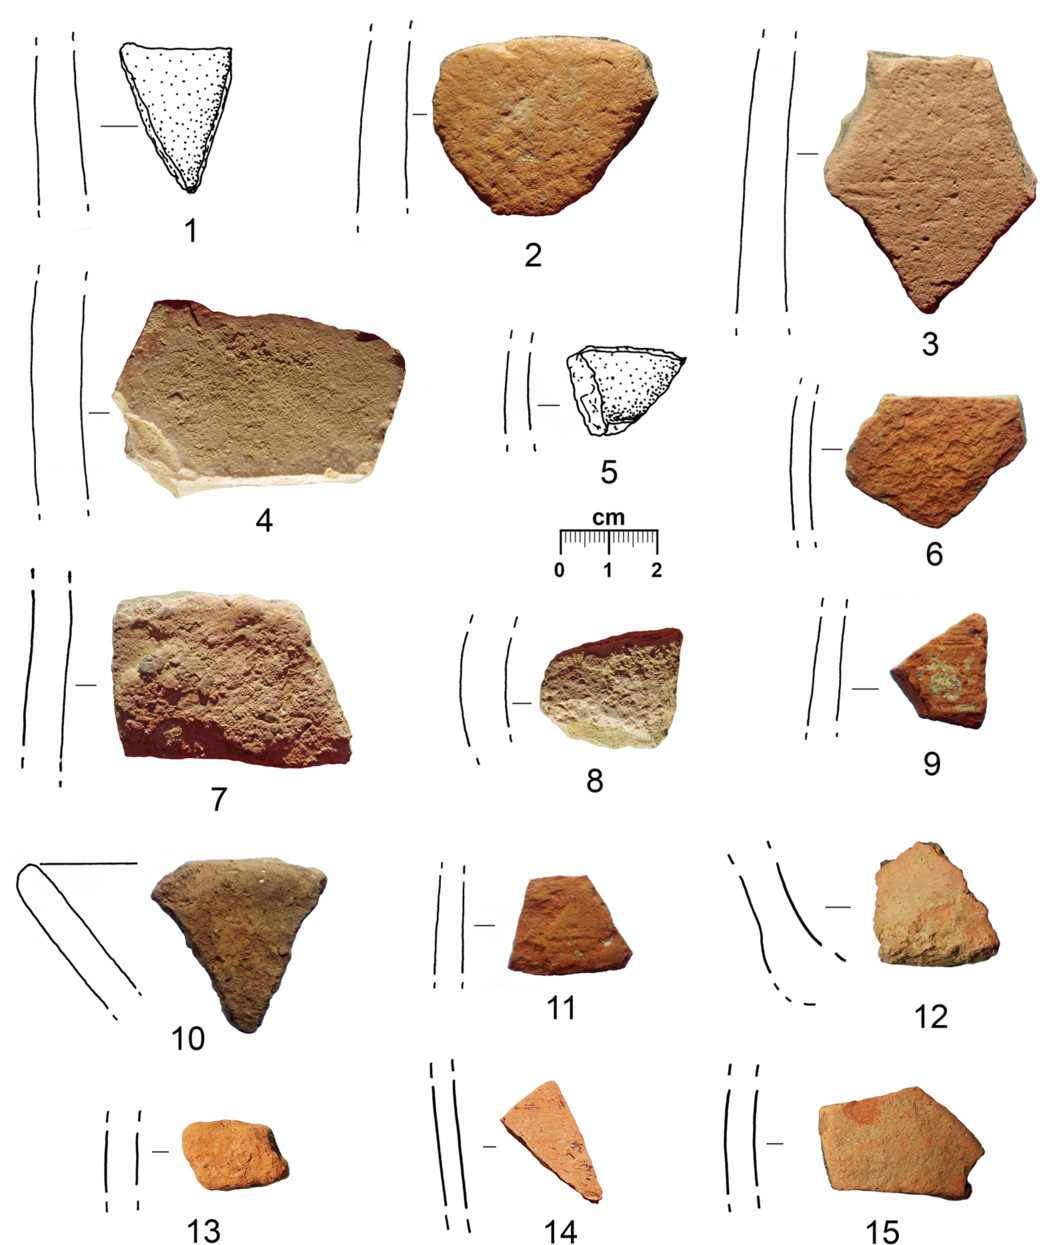
Firing colour and paste characteristics show that most potsherds might be attributed to the Indus Civilisation or slightly earlier (SRN-1A2). Most fragments are undecorated body sherds of unidentifiable vessel shapes (fig 17, nos 1–8, 13–15), with the exception of a small rim of a probable plate (fig 17, no. 10), a lower body fragment close to the bottom from SNR-4bis (fig 17, no. 12), one sherd with narrow, horizontal, red-painted lines from SNR-8 (fig 17, no. 9) and with narrow, horizontal grooves from SNR-8 (fig 17, no. 11). A few pieces have wheel traces.
Besides fragments of two Chinese porcelain vessels (fig 3, nos 2 and 4) and undecorated potsherds (fig 3, nos 1 and 3), a few fragments of two glass vessels were found on the surface of graves 100B and 100C (fig 3, nos 6–8; table 5).
Sonari: list and description of the ceramic and glass sherds. * = same vessel; n.a. = not analysed.

Seventeen ceramic potsherds from a maximum of sixteen vessels (table 6) and three porcelain samples were analysed.
Sonari: description of ceramic fabric groups discussed in the text (analysis by M Spataro)

All samples were sent for polished thin sectioning. The thin sections were analysed with a Zeiss Axiophot polarised microscope and by variable pressure scanning electron microscopy-energy dispersive X-ray spectrometry (SEM-EDX).Footnote 75 EDX analyses were carried out on four different areas of each sample at ×100 magnification (each covering an area of c 1.5 × 1.1mm). The SEM was used at a pressure of 30Pa with a 20kV accelerating voltage; the samples were analysed uncoated at a 10-mm working distance. Ten elements (Na, Mg, Al, Si, K, Ca, Ti, Mn, Fe and Pb) were detected and measured. The results were converted into oxide percentages, which were normalised (oxygen by stoichiometry) to take into account the fact that oxygen and carbon are not measured.
A variety of recipes and raw materials were used to make the seventeen ceramic samples, which were divided into eleven fabric groups (see table 6 for detailed descriptions). No fabric group appears at more than one site.
There are therefore significant differences between the ceramic fabrics, as expected from pottery made in different periods. Unfortunately, on the basis of the fragmented status and the weathered surfaces of the sherds, it is not possible to trace correlations between shape, surface treatments and paste used to make the ceramics. In some instances, ceramics were not tempered (Fabrics 1, 3 and 5, eg fig 18c), while others were probably tempered with sand (Fabrics 2, 6 and 7; eg fig 18a and d) and grog (Fabrics 8–10; see fig 18 e–f). Grog was added to a couple of Bronze Age sherds (SNR11 and 12) and to a body sherd with grooved decoration (SNR14). Grog inclusions varied, some were calcareous, others were not (eg in sample SNR14), some were more highly-fired than the matrix of the sherds to which they were added, some included scattered coarse and fine quartz. Sample SNR14 included second generation grog (grog in grog; see fig 18f), suggesting that this technical choice was an ongoing tradition. In prehistory, the use of a specific temper type is often linked to cultural tradition rather than for functional reasons, so the presence of a grog fragment within another grog fragment suggests a tradition of grog-tempering within the same cultural group.
Sonari: photomicrographs of ceramic thin sections of samples. a) SNR4; b) SNR5; c) SNR8; d) SNR13; e) SNR12; f) SNR14; g) blue-on-white SNR102; h) SNR101 white porcelain samples. Photomicrographs a–c were taken in cross polarised light, and d–h in plane polarised light. Photographs: M Spataro.

The only levigated pot (SNR5, Fabric 4) is a body sherd (fig 17, no. 4), which was also red-painted (fig 18d) with a paint made by mixing a fine clay and iron oxides (the paint is not visible to the naked eye).
The sands inclusions in the potsherd fabrics, some of which were deliberately added to the clay and others were naturally occurring in the raw materials, represent a variety of minerals that come from metamorphic and igneous settings. As they are fine-grained, they might have been transported over long distances from the original rock outcrops. The Sonari sites are located in proximity of the Hab mouth, whose lower reaches cross Alveolina limestone. The local geology also includes Nari and Gáj formations and Kojak shales.Footnote 76 The Nari (Oligocene to early Miocene) and Gáj (Miocene) formations are consolidated rocks that include igneous rocks (altered basalt, andesite, diorite and granite); metamorphism is also recorded.Footnote 77
Amphibole and the igneous inclusions identified in the potsherds are too fine to be attributed to a specific rock formation; in addition, amphibole occurs in different igneous rock formations (eg granite, andesite, diorite, etc.). On these bases, the potsherds could be of local origin, but the geology is also homogenous for a long stretch of the Hab.Footnote 78
The chemical compositions of the sherds confirm the mineralogical groupings (table 7). For example, four body sherds (samples SNR2, 3, 4 and 5) were found at the same spot (SNR-1), and they were attributed to three fabrics (table 6): they have three different chemical compositions, as seen in principal components analysis (PCA) (fig 19). Other sherds found together have a very similar chemical composition, suggesting that they were made from the same raw materials. The samples of Fabric 7 (SNR13, 15 and 16) could come from the same pot (fig 19), as suggested by the mineralogical analysis. Two pots (SNR9 and 10), which were made with a clay richer in muscovite and biotite micas than the other pots, are also chemically different from the others. Although mineralogically different, the dark bluish/grey vessel (SNR100), is chemically similar to samples attributed to Fabric 7, found at SNR-8.
Sonari: SEM-EDX compositional results of the fabrics of the Sonari sherds. Average of four bulk analyses in the grey rows, and standard deviation in the white rows; s.d. = standard deviation; – = below detection limit (analysis by M Spataro).

PCA output (Components 1 and 2), based on SEM-EDX compositional data for the sherds analysed from Sonari. PCA was carried out using Past v3.18 (Hammer et al Reference Hammer, Harper and Ryan2001). Each point represents the average of four bulk analyses (table 7). The samples analysed represent the full range of variability in petro-fabrics. Symbols according to the find spot of the sherds (see table 5). Legend: symbols correspond to find-sites (filled triangle SNR-1; filled square: SNR-1Sud; filled diamond: SNR-1A2; diamond SNR-8; dot: SNR-100D; square SNR-100E; asterisk: Pir Shah Jurio). PCA output: M Spataro.

Finally, the Chinese porcelain sherds are very different from each other; although they have both a fine paste, the small blue and white bowl (SNR102, 103) has a paste rich in fine quartz with recurrent voids. The glaze is 0.14–0.09mm thick and lime-alkaline (fig 18g). The white porcelain fragment (SNR101) has a finer paste, with few quartz inclusions, occasional iron oxides and no voids. It was glazed with a fine, c 0.05mm thick, lead glaze (fig 18h).
DISCUSSION
The surveys carried out by the Italian Archaeological Mission during the last twenty years in the territory stretching from Sonmiani and Siranda lagoons in Las Bela to the Indus Delta, in Lower Sindh, led to the discovery of many archaeological sites, most of which consist of shell middens and scatters/spots of mangrove and marine shells that have been systematically recorded and sampled for radiocarbon dating.
The project led to the first reconstruction of the time, pace and settlement pattern related mainly to the human exploitation of mangal and marine resources along this part of the north Arabian Sea coastline, an almost terra incognita from both archaeological and palaeoenvironmental points of view.
At present we have at our disposal more than 100 radiocarbon dates, most of which are from T palustris and T telescopium samples. Footnote 79 They show that mangroves flourished during the Holocene in virtually every estuary of freshwater courses in this part of the north Arabian Sea coast whenever suitable environmental conditions were available in term of salinity and temperature, attracting human groups that exploited their resources. Their late Holocene and sub-recent disappearance has been observed along the coasts of Sindh, Balochistan and the Persian/Arabian Gulf.Footnote 80 This fact is connected with the fractionation and later disappearance of the Bronze Age Indus Civilisation that was caused by monsoon weakening and the establishment of arid conditions that started to prevail around the end of the third millennium cal bc.Footnote 81
The earliest indication of the presence of mangrove swamps comes from the Mulri Hills (MH-15: GrA-63863: 7320±40 bp on T palustris), a low limestone range located at the eastern outskirts of Karachi, at that time under direct influence of the Malir and some Indus channels, while a slightly more recent date comes from a shell midden discovered along the eastern shore of Lake Siranda (Las Bela) (SRN-43: GrA-54290: 7200±35 bp on T palustris). Both these dates are from single adult fragments of T palustris shell. However, it is important to remark that a piece of marine bivalve from KDJ-1, a site located along the southern bank of the Kadeji River at its confluence with the Mol, yielded a result c 1000 years earlier (KDJ-1: GrA-63862: 8275±45 bp). Though the date comes from a marine shell, its negative δ13C value of −4.44 shows that it grew in a mangrove environment, suggesting that mangrove swamps were already flourishing at the Malir mouth, and more broadly the Karachi Gulf, around the end of the ninth millennium bp.Footnote 82
The earliest evidence of human exploitation of the coastal resources at Sonari comes from two small scatters of Meretrix bivalves, radiocarbon dated to the second half of the seventh millennium bp (SNR-102: GrA: 62253: 6340±40 bp, and SNR-103: GrA-59828: 6180±50 bp). These results raise the question of the time mangroves made their first appearance around the Hab mouth (fig 20), given that the oldest T palustris dates available from the area fall between the middle of the fifth and the end of the fourth millennium bp (from SNR-101 to SNR-4W: see table 2). Moreover, the results show that mangroves were still present around Sonari when they were already disappearing from the coast of Las Bela, as suggested by the assays obtained from Lake Siranda and the Bay of Daun.Footnote 83 The SNR-101 date matches well with that obtained from the Chalcolithic/Bronze Age mound of BalakotFootnote 84 (BLK-1: GrA-55828: 4660±40 bp on T palustris),Footnote 85 along the course of the Winder, suggesting the existence of a mangrove swamp exploited by its inhabitants most probably along the eastern coast of the Sonmiani Lagoon.
Plot of the calibrated dates from Sonari (SNR), Ras Muari (RMR-1) and Pir Shah Jurio (PSH) calibrated according to the marine curve of 229±27 14C years (see Reimer and Reimer Reference Reimer and Reimer2001). Graph: T Fantuzzi.

Two slightly later dates were obtained from the small Indus Civilisation settlement of Pir Shah Jurio (fig 17; table 2). The site is located on a protruding terrace surrounded by alluvium and the traces of an old riverbed, along the left, eastern, bank of the Hab, c 6.5km north-east of its mouth and 8km north of Sonari (fig 1, top).Footnote 86 Finally, two results from Sonari (SNR-3 and SNR-2: see table 2), one from Daun (Daun-117: GrN-31494: 1440±30 bp on T palustris) and one from the northern shore of Lake Siranda (SRN-10, GrA-54302: 975±25 bp on T palustris) are the only historical dates so far available from Pakistani palaeo-mangroves.
As reported above, the Sonari sites yielded a small number of stone artefacts related to fishing. They consist almost exclusively of net sinkers, while fish hooks, harpoons and fish bones are missing. Their absence is most probably due to the very arid climatic conditions of the cape and salinity that have destroyed both metal artefacts and bones. However, the presence of notched stone net sinkers is very important. These artefacts are very rare in Las Bela. So far, Bronze Age specimens are known only from two sites discovered along the shores of the Bay of Daun, namely Daun 3 and Daun 5,Footnote 87 where ten shell middens have been radiocarbon dated to the Mature Indus period, and two more to the end of the same civilisation.Footnote 88 They are not represented from the Chalcolithic and Bronze Age mound of Balakot, along the Winder course, in the northern part of the Kurkhera Plain, where fish bones and mangrove shells are numerous.Footnote 89 Stone net sinkers are also very rare from the shell middens discovered along the shores of the ancient Siranda lagoon, in which only four specimens have been recovered,Footnote 90 three of which from Neolithic sites and one dated to the beginning of the Chalcolithic (SRN-73).Footnote 91
According to the available evidence, we can suggest that fishing was not the primary activity practised by Neolithic to Bronze Age groups that seasonally settled along the shores of Daun and Siranda. These sites show that their main subsistence economy was the collection of mangrove shells and, to a lesser extent, bivalves that live also in mangrove waters. Only at Sonari was a different pattern recognised. Here, fishing was undoubtedly practised as well as shellfish gathering. The location of the site and the material used for the constructions of the SNR-1 village stone structures are also important. The site is definitively well hidden inside a wide saddle c 150m from the present seashore. Moreover, the exposed features are made of local limestone blocks and not bricks, which are widely considered the commonest construction material used during the Indus Civilisation. Though of quite a different age, the only known parallels are the small, historical stone fishers’ structures on the hills near Gwadar, along the coast of Makran. On their surface, Siddiqi reports the presence of potsherds, flints, grinding stones and lime fragments, as well as Greek and Bactrian coins associated with bones and shells.Footnote 92
Our data would suggest that fishing started to be more intensively practised in the area during the Bronze Age. The Sonari net sinkers are all typologically the same, though their weight differs. They would suggest that coastal fishing took place during the winter months, at low-tide in shallow waters along a narrow zone of the rocky coastline of this part of the cape,Footnote 93 considering the great danger represented by the Arabian Sea waters, especially in the summer months when the seasonal monsoon blows from the south-east and fishing is not practised even today.
Finally, two conjoined fragments of ostrich egg from SNR-1 are also important to report.Footnote 94 This discovery is unique in the archaeology of the region, since we still know very little of the presence of ostriches along the Arabian Sea coasts during the Holocene, and our knowledge has not improved during the last thirty years.Footnote 95
To conclude, SNR-1 is the only Bronze Age fisher-gatherer site with stone structures so far discovered along the northern coast of the Arabian Sea.Footnote 96 It was settled mainly between the last centuries of the fourth and the first centuries of the third millennium cal bc; that is, between the end of the Chalcolithic and the beginning of the Bronze Age. One radiocarbon result obtained from structure SNR-1D (GrA-59835: 3660±50 bp on T telescopium) shows that it was inhabited again a few centuries later. According to the radiocarbon chronology, SNR-1 is slightly older than the small Indus settlement of Pir Shah Jurio (PSH).
A ceramic bangle from the latter site is petrographically and chemically similar to the vessel found at SNR-1,Footnote 97 suggesting a similar provenance (fig 19). However, most probably the two sites were settled in different periods and were not complementary to each other. This evidence raises interesting questions regarding the origins of SNR-1’s inhabitants, the radius of their seasonal movements along the north Arabian Sea coast and, more broadly, about their systems of production, of which fishing, gathering, farming and probably hunting were part.Footnote 98
ACKNOWLEDGEMENTS
One of the authors (MS) would like to thank Drs Petra Herms and Peter Raase and Professor Romain Bousquet (Department of Petrology and Geodynamics, Christian-Albrechts University, Kiel, Germany) for allowing her to carry out the analyses in the department at the university as part of the CRC1266 ‘Scales of Transformation’ subproject F5 ‘Social Dimensions of Technological Change’ while she was a Mercator Fellow. Thanks also to Professors Martin Furholt and Johannes Müller (Christian-Albrechts University) and Professor Berik Eriksen (Centre for Baltic and Scandinavian Archaeology, Schleswig, Germany), who were the PIs of the CRC1266 subproject F5.
Thanks are also due to Dr Tiziano Fantuzzi (Department of Humanities, Ca’ Foscari University, Venice, Italy) for calibration of the radiocarbon dates, and to Alberto Girod (Italian Malacological Society, Milan, Italy) for identification of the shell species.
This paper is published with the aid of grants from the Italian Ministry of Foreign Affairs (MAE, Rome), and B de Cardi research awards of the Society of Antiquaries of London, with many thanks.


 Open access