


While there has been some debate over whether citizens who support populist parties are in favour of or opposed to democracy (Norris and Inglehart Reference Norris and Inglehart2019; Stavrakakis Reference Stavrakakis2018), most scholars in this area make the more nuanced argument that populist voters are disappointed or dissatisfied with certain aspects of democratic performance, but still retain loyalty to the principles of democracy as a whole (Rovira Kaltwasser and Van Hauwert Reference Rovira Kaltwasser and Van Hauwert2019). Other scholarship suggests that populist citizens are supportive of direct or majoritarian democracy but oppose its more liberal aspects such as the protection of minority rights, or decision-making by elected representatives (Heinisch and Wegscheider Reference Heinisch and Wegscheider2020; Mohrenberg et al. Reference Mohrenberg, Huber and Freyburg2019; Wiesehomeier and Singer Reference Wiesehomeier, Singer, Chryssogelos, Hawkins, Hawkins, Littvay and Wiesehomeier2024).
However, this literature still has several unanswered questions concerning how those who support populists feel about democracy. Specifically, what aspects of democracy’s performance are these voters disappointed with? Democracy scholars have long distinguished various forms of democracy from one another (König et al. Reference König, Markus, Siewert and Ackerman2022). Political theorists have recognized that the ideal democratic society features some tension between the rule of the majority of the people and the protection of minorities. One way to conceptualize this difference is by looking at the liberal aspects of modern democracy designed to protect minority interests – such as free and fair elections for representatives, diverse political parties, media freedom and the protection of minority rights (Dahl Reference Dahl1998; König et al. Reference König, Markus, Siewert and Ackerman2022) – and conceptions of democracy focused more exclusively on popular sovereignty designed to preserve the rule of the majority – such as obedience to the unfiltered desires of the majority of voters through referenda, or the supremacy of the will of ‘the people’ over the will of elites (Bengston and Mattila Reference Bengston and Mattila2009; Bowler et al. Reference Bowler, Donovan and Karp2007). So, are citizens who support populist parties disappointed liberal democrats, popular-sovereignty democrats, or some combination of the two?
The literature also does not fully consider whether the type of democratic disappointment populist supporters feel is related to populist parties’ ideologies. Populist parties differ widely in their ideological orientation, whether left, right or centrist (Hawkins and Rovira-Kaltwasser Reference Hawkins, Rovira-Kaltwasser, Hawkins, Carlin, Littvay and Rovira-Kaltwasser2019; Mudde and Rovira-Kaltwasser Reference Mudde and Rovira-Kaltwasser2012). So, are supporters of either left-populist or right-populist parties both disappointed democrats? If so, are they both disappointed in the same aspects of their countries’ performance?
I seek to answer these questions by examining whether greater disappointment in one’s country’s performance on popular sovereignty or liberalism leads to more support for populist parties, and whether the relationship between democratic disappointment and populism is moderated by the ideology of the parties involved. Importantly, I examine the democratic attitudes of individual citizens and not the (anti-)democratic positions of the parties they support.
Using several items from the tenth wave of the European Social Survey (ESS 2023), which ran from 2020 to 2022, I employ Enrique Hernández’s (Reference Hernández2018) strategy to capture respondents’ disappointment in the democratic performance of their specific countries, taking the difference between respondents’ reported belief in democratic principles and their beliefs about how well their individual countries live up to those same principles. This approach to measuring disappointment in democracy allows me to capture the difference between how respondents believe democracy ought to perform and how they believe it is actually performing in their own country. I then expand on Hernández’s (Reference Hernández2018) method by using factor analysis to unravel respondents’ disappointment in both the liberal and popular-sovereignty aspects of their countries’ performance. This measurement strategy reveals distinct conceptions of democracy, allowing me to determine which aspects of democratic practice respondents are disappointed in. This then allows me to show not only that populist supporters are disappointed democrats, but also how different forms of democratic disappointment are associated with support for different types of populist parties.
I find that those who support populist parties are indeed more disappointed than non-populist voters in democratic performance but that the nature of this disappointment varies depending on the ideology of the populist party voters support. All populists are disappointed in their countries’ adherence to the popular-sovereignty aspects of democracy, but left-populist voters are more disappointed in their countries’ adherence to the liberal aspects of democracy. Right-populists and centre-populists are often less likely to be disappointed liberal democrats. These results are robust to a variety of specifications and suggest that there are meaningful differences in the feelings towards democracy of left-populist and right-populist supporters. This supports past theorizing on the difference between inclusive and exclusive populism (Mudde and Rovira-Kaltwasser Reference Mudde and Rovira-Kaltwasser2012).
How do populist supporters feel about democracy?
Populists frame politics as a cosmic, Manichean struggle between a good, homogenous people and an evil, conspiring elite (Hawkins and Rovira-Kaltwasser Reference Hawkins, Rovira-Kaltwasser, Hawkins, Carlin, Littvay and Rovira-Kaltwasser2019; Mudde Reference Mudde2004). There is some debate over whether citizens’ populist attitudes (their agreement with the basic idea of a Manichean struggle between the people and elites) adequately predict their likelihood of supporting populists. While Steven van Hauwaert and Stijn van Kessel (Reference Van Hauwaert and Van Kessel2018) argue strongly that populist attitudes predict support for parties, Bruno Silva et al. (Reference Silva, Fuks and Ryô Tamaki2022) find in Brazil that populist attitudes hardly predict support for Jair Bolsonaro when controlling for ideological affinity between voters and the populist candidate. This is consistent with Kirk Hawkins and Cristóbal Rovira Kaltwasser (Reference Hawkins, Rovira-Kaltwasser, Hawkins, Carlin, Littvay and Rovira-Kaltwasser2019), who point out that the prevalence of populist attitudes does not consistently track with populists’ electoral success. Thus, agreement with populist attitudes seems to overlap, though imperfectly, with actual support for populists.Footnote 1 Despite this disconnect, the literature on mass-level populism most often focuses on the relationship between populist attitudes and feelings towards democracy and not on the democratic attitudes of those who actually vote for populist parties.
Scholars debate whether populism is compatible with democracy. Some claim that populism is a natural or even helpful part of democracy providing a pro-majority counterbalance to liberal democracy’s tendency to prop up minority and oligopolistic interests (Stavrakakis Reference Stavrakakis2018, see also Manow Reference Manow2020; Kriesi Reference Kriesi2020). But other scholars argue that this view is too charitable. Stefan Rummens (Reference Rummens, Kaltwasser, Taggart and Espejo2017) argues that populism and liberal democracy feature incompatible definitions of who counts as ‘the people’ and thus populism can only ever be a symptom and not a cure for liberal democracy’s alleged shortcomings. Pippa Norris and Ronald Inglehart (Reference Norris and Inglehart2019) as well as Lisa Zanotti and José Roma (Reference Zanotti and Roma2021) find empirical evidence that populists are more authoritarian and exhibit lower support for liberal democracy.
Most scholarship, however, is open to the compatibility of populism and support for democracy but with greater nuance in definitions of democracy. One branch of this literature distinguishes support for democracy and satisfaction with democracy. For example, Rovira Kaltwasser and Van Hauwert (Reference Rovira Kaltwasser and Van Hauwert2019) find that citizens with populist attitudes in both Europe and Latin America consistently support democracy but are also consistently disappointed with its implementation. Similarly, Hawkins et al. (Reference Hawkins, Lyne, Ingles, Beesley and Ackerman2023) find that Latin American bureaucrats with more populist attitudes rated the quality of democracy in their countries lower but were not less supportive of their countries’ systems.
Another branch of scholarship distinguishes support for the liberal aspects of democracy and the aspects more focused on rule by the people. However, even here there is disagreement on which aspects of democracy populists favour. Survey evidence from several European countries suggests that populists are supportive of popular sovereignty over liberal constraints on the will of the people. Steffen Mohrenberg et al. (Reference Mohrenberg, Huber and Freyburg2019) find that French, German, Swiss and British respondents with more populist attitudes showed more support for direct democracy. Nina Wiesehomeier and Matthew Singer (Reference Wiesehomeier, Singer, Chryssogelos, Hawkins, Hawkins, Littvay and Wiesehomeier2024) found that ESS respondents who supported populist parties were more likely than non-populist supporters to believe referenda were important to democracy. And Reinhard Heinisch and Carsten Wegscheider (Reference Heinisch and Wegscheider2020) found that Austrian and German respondents with more populist attitudes favoured the general will of the people over representative decision-making. At the same time, though, other scholarship suggests that populists may not be inherently opposed to liberalism. Wouter Van der Brug et al. (Reference Van der Brug, Popa, Hobolt and Schmitt2021) find that right-wing populists favoured liberal constraints (so long as their preferred parties were out of office), and Victor Ellenbroek et al. (Reference Ellenbroek, Meijers and Krouwel2023) find that populist respondents were more likely than non-populists to favour pluralism in the Dutch parliament.
Some scholarship has incorporated both the liberalism–popular sovereignty and the support–satisfaction dimensions of democratic support. Andrej Zaslove et al. (Reference Zaslove and Meijers2023) find that Dutch populists are dissatisfied with democracy, but still supportive of both liberal and majoritarian concepts of democracy, especially unconstrained rule by the majority of the people. Alexander Wuttke et al. (Reference Wuttke, Schimpf and Schoen2023) find that both populists and non-populists favour a liberal democratic system, but populists hold more inconsistent beliefs, demanding things that liberal democratic institutions simply cannot provide.
Ideology also seems to matter for the relationship between support for populism and support for democracy. Some scholars have categorized left-wing populist parties as inclusionary and right-wing populist parties as exclusionary. Cas Mudde and Cristóbal Rovira Kaltwasser (Reference Mudde and Rovira-Kaltwasser2012) compare left-wing populist parties in Latin America to right-wing populist parties in Europe and find that left-wing populists tend to have a more all-encompassing view of who constitutes ‘the people’ while right-wing populists often limit their definitions to certain nationalities or ethnic groups. At the same time, left populists favoured more inclusive forms of political participation and material distribution. Other scholars have confirmed that left-leaning populist parties in Europe are also more inclusive (Ivaldi et al. Reference Ivaldi, Landzone and Woods2017; Stavrakakis and Katsembekis Reference Stavrakakis and Katsembekis2014). This divide between left- and right-populist parties might suggest populist voters’ feelings about democracy depend on whether they are right- or left-leaning.
But empirical scholarship in this area has only flirted with the possibility that the relationship between support for populism and support for democracy depends on the ideological flavour of the populism involved. For example, Wiesehomeier and Singer find that left populists and right populists differed on how important they believed it was to democracy for governments to reduce income inequalities and follow the public. And Heinisch and Wegscheider find that both right and left populists favoured direct democracy but only favoured greater representation for the specific constituencies their ideologies advocated for. Importantly, Hernández (Reference Hernández2018) found that discontent with specific aspects of democracy was associated with greater support for challenger parties on the left or the right. However, this critical insight has yet to be applied to specific studies of support for populists. Thus, populism’s ideological flavour seems to matter, but this important aspect of the puzzle has gone understudied.
Populists as disappointed democrats
Building on past literature, I do not expect populist supporters to be inherently opposed to democracy. Instead, I expect disappointment in how well one’s country lives up to democratic principles to lead to greater support for populist parties. Populist voters will be more likely than non-populist voters to see a gap between how a democracy ought to run and the ways in which their country is (not) living up to this ideal. This is because populism is not inherently an undemocratic discourse, but one that is activated by a perceived crisis of representation, or failure of democracy.
In fact, populism is a democratic discourse (Stavrakakis Reference Stavrakakis2018). As the word democracy implies, any conception of democracy sees the demos, the people, as the ultimate source of political legitimacy. Populism is simply one particular way of viewing the democratic arrangement. Populist democracy is ‘a conception of democratic politics that stresses the centrality of popular sovereignty based on the idea of a homogenous people, popular will, and opposition to decision-making by a political elite’ (König et al. Reference König, Markus, Siewert and Ackerman2022).
At the same time, the ideational theory of populism holds that some sort of crisis of representation is required to activate latent populist attitudes and motivate people to support populist parties (Hawkins and Rovira-Kaltwasser Reference Hawkins, Rovira-Kaltwasser, Hawkins, Carlin, Littvay and Rovira-Kaltwasser2019). These crises could include corruption or some sort of intentional policy failure. Real-world examples include the immigration crisis in Europe, shifting demographics (Norris and Inglehart Reference Norris and Inglehart2019), forced austerity by the European Union (Stavrakakis Reference Stavrakakis2018) or economic concerns such as globalization-fuelled trade shocks or growing inequality (e.g. Rodrik Reference Rodrik2018).
Thus, populist voters should be those who hold to some (populist) conception of democracy, but who are spurred into supporting populist parties through an increase in democratic disappointment brought on by some perceived democratic failure. For my purposes, the type of event or failing that voters perceive as a crisis of representation is with important differences in left-leaning important than the sense of disappointment it generates. When citizens hold democratic views but believe, for whatever reason, that their countries are not living up to the democratic ideal, they should be more likely to support populist parties that tout themselves as pro-people, pro-democracy and a drain-the-swamp corrective to the country’s woes.Footnote 2 Importantly, I do not argue that populists are dissatisfied with democracy as a concept – they are not disillusioned former democrats now seeking to embrace a more authoritarian politics. Instead, they are loyal to a certain concept of democracy and simply believe that their country is not living up to what democracy ought to be. This assertion also adds nuance to the typical argument that populists are anti-establishment. While in a sense they do oppose and distrust the established status quo, they do not want to destroy democracy entirely but instead hope to reform it to better fit their conceptions of how it ought to operate.Footnote 3
But how do these disappointments translate into vote choice for certain populist parties? I argue that this mechanism can best be understood through supply and demand dynamics. As the sprawling literature on the topic makes clear, there are many ways to conceptualize democracy, including liberal, direct, substantive, stealth, populist and even authoritarian concepts (König et al. Reference König, Markus, Siewert and Ackerman2022). I argue that voters who possess certain conceptions of democracy and feel their country is not living up to these conceptions (the demand) will be attracted to the parties which they believe will advocate for and achieve their ideal form of democratic governance (the supply).Footnote 4
On the demand side, the important distinction among disappointed democrats will be between those who wish their countries did more to live up to the popular sovereignty and liberalism aspects of democracy. This distinction reflects the tension in modern democracies between the rule of ‘the people’ and liberal protection of minority interests. Popular-sovereignty disappointment reflects the difference between how important citizens believe the people-centric aspects of democracy are and the extent to which they believe their country is living up to this people-centric ideal. The popular-sovereignty aspects of democracy as I construe them are perhaps best understood as a combination of Pascal König et al.’s (Reference König, Markus, Siewert and Ackerman2022) conceptions of direct democracy and populist democracy. It is the aspect of democracy that is focused on rule by the majority of the people over the allegedly minority views of the elites. It is democracy in the Platonic sense: the unchecked and unfiltered rule of the majority of everyday voters. Liberalism disappointment reflects the difference between how important citizens believe the liberal aspects of democracy are and the extent to which they believe their country is living up to this liberal ideal. The liberal aspects of democracy are those that constrain the will of the majority in an effort to protect the interests of minorities. These can include the protection of minority rights, media freedoms, independent courts, political pluralism or even the Madisonian ideal of delegating decision-making to virtuous representatives.Footnote 5 Thus, I argue that there will be variation among disappointed democrats. Some demand that their countries do more to live up to the ideal of rule by the people, others will demand their countries do more to uphold liberal ideals, and others may demand both.
There is a diverse supply of populist parties to meet this demand. While all populists claim a desire to restore ‘true’ democracy, especially through reasserting the will of the people over the elites, they seem to differ in the type of democracy they seek to implement, with important differences in left-leaning, inclusive populist parties, and their right-leaning, exclusive counterparts (Mudde and Rovira-Kaltwasser Reference Mudde and Rovira-Kaltwasser2012). Yannis Stavrakakis and Giorgos Katsambekis (Reference Stavrakakis and Katsembekis2014) argue that Greek right-wing Golden Dawn’s conception of ‘the people’ is exclusionary, racist and autocratic, while Spanish left-wing Podemos pitches itself as an ‘ally of democracy in times of economic and political crisis’. Gilles Ivaldi et al. (Reference Ivaldi, Landzone and Woods2017) find that right-leaning populists are illiberal democrats who are focused on promulgating the unfiltered will of the people through institutions such as referenda. At the same time, further left populist parties support a more ‘deliberative and participatory notion of popular representation’ (Ivaldi et al. Reference Ivaldi, Landzone and Woods2017). Thus, left-populist parties tend to have a more inclusive, liberal and representational concept of democracy than their right-leaning counterparts. Thus, there is a diverse supply of populist parties that vary in how they value the liberal aspects of democracy in particular. This should allow citizens with their own diverse demands for certain types of democracy to align their support with parties who match their views.
Therefore, I expect there to be some association between a citizen’s feelings about democratic ideals, how well they feel their country is doing at living up to these ideals, and the party they choose to support. Citizens feel different levels of disappointment (or satisfaction) with how well their country is living up to various democratic ideals. At the same time, political parties have differing stances on these same democratic issues. Citizens should be more likely to support political parties that speak to the types of failings they see in their countries’ performance. Of course, other factors, including ideological and policy affinity towards a party, are also important motivators for support. However, I expect that even when controlling for these things, higher democratic disappointment should lead to a greater likelihood of supporting a populist party.
As a common denominator, I expect greater disappointment in one’s country’s adherence to the popular-sovereignty aspects of democracy, such as the supremacy of the will of the people and the use of referenda, to lead to a higher likelihood of supporting all populist parties, regardless of those parties’ ideologies. This is because, by definition, populists are those who believe ‘the people’ to be good and the ‘will of the people’ to be the ultimate source of political legitimacy. Supporters of left-, centre- and right-populist parties should all believe that their countries can do a better job of living up to the popular-sovereignty ideal. Thus:
Hypothesis 1 (H1): Voters who are more disappointed in how their country lives up to popular-sovereignty related principles will be more likely to support left-, centre- and right-populist parties.
At the same time, based on the variation in left- and right-populist parties’ commitment to liberalism discussed above, I expect stronger disappointment in one’s country’s adherence to the more liberal aspects of democracy, including free and fair elections, media freedom, political pluralism and minority protections, to have divergent effects on support for left- and right-populist parties. Those who vote for left-populist parties will be more likely to feel disappointed in their country’s performance on liberal aspects of democracy because left-populist parties embrace a more representational, liberal conception of the democratic polity. Inversely, a belief that one’s country is not living up to liberal principles will lead to a lower likelihood of supporting right-populist and centre-populist parties because these parties embrace an illiberal vision of democracy. Thus:
Hypothesis 2a (H2a): Respondents who are more disappointed in how their country lives up to liberal principles will be more likely to support left-populist parties.
Hypothesis 2b (H2b): Respondents who are more disappointed in how their country lives up to liberal principles will be less likely to support right-populist parties and centre-populist parties.
In sum, I expect all populist voters to be disappointed in some aspect of their countries’ performance on democratic principles. Supporters of all populist parties will be disappointed in the popular-sovereignty aspects of this performance because populism of all kinds is focused on the supremacy of the people over the elites, but left-wing populist voters will be more disappointed in the liberal aspects of their country’s performance because left-populist parties tend to have a more liberal stance.
Data and analysis
Data
To test these hypotheses, I conduct a series of logit regression models. The primary source of data for these tests is the tenth wave of the ESS. This survey includes thousands of observations and provides information on the individual-level attributes of respondents, including partisan support, policy and ideological preferences, and demographics. I supplement the ESS with party-level information on populism and ideology using both the Populism and Political Parties Expert Survey (POPPA) and the Chapel Hill Expert Survey (CHES) datasets (Jolly et al. Reference Jolly, Bakker, Hooghe, Marks, Polk, Rovny, Steenbergen and Vachudova2022; Meijers and Zaslove Reference Meijers and Zaslove2020). The combination of these datasets allows me to conduct my factor analyses on 24 of these countries,Footnote 6 and my models on all but five of these.Footnote 7 The following sections describe the measurement strategies for my dependent, independent and control variables.
Dependent variables
My dependent variable is the type of party respondents voted forFootnote 8 in the most recent election, whether that be left-populist, right-populist, centre-populist, or some sort of non-populist party. By examining support for populist parties and not populist attitudes, I am breaking from a significant portion of the literature on populism and attitudes about democracy (including Ellenbroek et al. Reference Ellenbroek, Meijers and Krouwel2023; Heinisch and Wegscheider Reference Heinisch and Wegscheider2020; Mohrenberg et al. Reference Mohrenberg, Huber and Freyburg2019; Rovira Kaltwasser, and Van Hauwert Reference Rovira Kaltwasser and Van Hauwert2019; Wuttke et al. Reference Wuttke, Schimpf and Schoen2023; Zanotti and Roma Reference Zanotti and Roma2021; Zaslove and Meijers Reference Zaslove and Meijers2023). This is because I am specifically interested in the feelings of those who vote for populists, a group which only imperfectly overlaps with those with populist attitudes, as described above.
I categorize parties using both the POPPA and CHES datasets. POPPA’s populism variable ranges from 0 to 10, with higher values indicating a more populist party. These scores were created using expert surveys in 2018. I estimate models with dichotomous measures of party populism. I set 5 as a cut-off point, categorizing all parties that had a score less than 5 as non-populist and all parties with a score greater than or equal to 5 as populist. As described below, my results are robust to alternative cut-off points. I made the left, centre and right distinctions based on each party’s left–right position according to CHES’s general left–right measure. Parties with a score lower than 4 were designated left. Parties with a score greater than or equal to 6 were considered right. All other parties were considered centrist. Table 1 gives the number of respondents who supported each type of party. The left-populist category encompasses newer left-wing parties (such as SYRIZA in Greece) and the successor parties to some communist movements (such as the Communist Party of Bohemia and Moravia in Czechia). The relatively small group of centre populists includes big-tent parties like the Five-Star Movement in Italy. The right-populist category includes nationalist (National Rally in France) and in some cases more authoritarian (Fidesz in Hungary) parties. Table A1 in the Appendix in the online Supplementary Material lists each party categorized as a populist party and indicates which ideological family it belongs to.
Number of Respondents per Party Type

Note: Total number of respondents who indicated supporting a party of each type. The number is limited to the subset of observations included in the logit models (n = 15,101).
Independent variables
My independent variables are how disappointed individuals are with the liberal and popular-sovereignty aspects of their countries’ democracy. I begin with Hernández’s (Reference Hernández2018) method of subtracting respondents’ democratic aspirations from their democratic evaluations on a host of survey items, but I also take his method one step further by applying factor analysis to these items. This reveals two distinct dimensions of democratic disappointment: what I label popular-sovereignty disappointment and liberalism disappointment.
Like Hernández (Reference Hernández2018), I calculate respondents’ levels of disappointment using the ESS. The structure of the ESS allows me to directly measure how committed respondents are to democratic values and to what extent they feel that their countries live up to these values. The ESS poses a series of nine questions asking respondents what they think generally about a series of democratic principles. Immediately following these nine questions respondents were asked exactly the same questions, but this time reworded to apply exclusively to the respondent’s country. Table 2 lists both sets of questions.
ESS Survey Items: General Democratic Principles and Country-Specific Democratic Principles

Source: ESS items relating to general democratic principles.
Table 3 displays descriptive statistics for each individual item used, and Figure A2 in the online Appendix displays their distribution. The wording of these 18 questions allows me to determine to what extent respondents feel that democracy in their country is operating as it should. Individuals make judgements about how well something is performing relative to how well they believe it should be performing. Because different respondents have different conceptions of what democracy should be, the answers to the first nine questions allow me to measure how well they believe democracy is doing in their country relative to each individual’s own reported conception of the democratic ideal.
Table of Descriptive Statistics for Raw Measures of Democratic Principles

Note: All measures range from 0 to 10.
More specifically, I construct measures of democratic disappointment that are the difference between what respondents say democracy ought to be, and the perceptions they report of their own country's performance. Individuals with higher values on these scales are those who are more disappointed in how democracy is performing in their country.Footnote 9 Importantly, my measures do not depend on individuals having a correct understanding of what democracy ought to be, or even one that is consistent with what political scientists or normative theorists say democracy ought to be. The point is that individuals report their own personal conception of what a democracy ought to be and then report how well they think their own countries are doing at living up to this standard.
I use these questions to construct two independent variables, Popular-sovereignty disappointment and Liberalism disappointment. As discussed above, popular-sovereignty disappointment is disappointment with the ways one’s country lives up to the democratic ideal of rule by the people. We would expect a desire for the people to reassert their will over the elites, perhaps through referenda, to be most strongly associated with this dimension. Liberalism disappointment is disappointment with the ways one’s country is living up to the liberal ideal of protecting minority rights and interests. We would expect this to be most strongly associated with political pluralism, protection of media and minority rights, and fair courts.
To construct my two measures, I first took the difference between each general question and its country-specific counterpart in Table 3. This gave me nine measures of disappointment for each respondent corresponding with each democratic principle involved (i.e. media freedom, fair elections, referenda, etc.). I then used factor analysis on these nine disappointment measures to reveal two distinct factors. Table 4 gives the results of this factor analysis using a varimax rotation (see below for a discussion of how using a promax rotation yields very similar results).
Factor Loadings for Measures of Democratic Disappointment (Varimax Rotation)

Notes: n = 18,065. Factor loadings below 0.4 are not displayed. Factor loading scores for democratic disappointment items loading into Liberalism disappointment and Popular-sovereignty disappointment.
At first glance, most disappointment items seem to load onto both factors. However, there is a divide with items generally loading much more strongly onto one factor or the other. Table A22 in the online Supplementary Material also shows that the two dimensions correlate only weakly with one another. I label the first factor Liberalism disappointment. Disappointment related to the quality of elections, political party diversity, media freedom and minority rights load most clearly into this factor. I label the second factor Popular-sovereignty disappointment. Disappointment about the quality of direct democracy through referenda, the dominance of the ordinary people over elites, and the supremacy of the will of the people load most clearly into this factor. Disappointment over the fairness of the courts and whether badly performing governments are removed from power load about equally onto both factors.
Thus, I generate factor scores that serve as distinct measures of disappointment in both the liberal and popular-sovereignty aspects of a country’s performance. By its nature, the factor analysis generates variables with a mean of zero and that are approximately normally distributed. Popular-sovereignty disappointment ranges from −3.88 to 2.80, and Liberalism disappointment ranges from −3.13 to 3.54. In accordance with my Popular-Sovereignty Disappointment Hypothesis (H1), I expect my models to indicate a statistically significant positive relationship between popular-sovereignty disappointment and support for all types of populist parties. In line with my Liberalism Disappointment Hypothesis, I expect my models to indicate a significant positive relationship between Liberalism disappointment and support for left-populist parties (H2a), but I expect to find a negative relationship between liberalism disappointment and support for centre or right-populist parties (H2b).
Control variables
Because populist parties tend to have radical ideological and policy positions, I also expect respondents’ ideological and policy dispositions to be important predictors of their support for left-populist or right-populist parties. This is consistent with scholarship that attributes support for populists (especially radical-right populists) to support for their ultra-conservative platforms (Norris and Inglehart Reference Norris and Inglehart2019). It is also consistent with Agnes Akkerman et al. (Reference Akkerman, Zaslove and Spruyt2017), who find that while populist voters on the left and right shared populist attitudes, they were motivated by different ideological reasons to support the parties they chose. Thus, I also include controls for respondents’ self-placement on a cultural conservativism scale and an economic right scale. I constructed the cultural conservativism scale using five ESS items that ask respondents their feelings on homosexuality and immigration. I constructed the economic scale using three ESS items concerning government protections against poverty and inequality. Tables A2 and A3 in the online Appendix show how these scales were constructed using factor analysis with varimax rotations. A higher value on these scales indicates more conservative cultural views and further right economic views, so I expect these control variables to be positively associated with support for right-populist parties and negatively associated with support for left-populist parties.
Each of my models also controls for several other individual factors. I control for the respondent’s trust in politicians (0 = no trust at all, 10 = complete trust), gender (1 = female and 0 = male), years of completed education, age in years, and household income decile (higher values indicate higher decile). Each of these variables is taken from the ESS. I expect those who have lower trust in politicians, less education, lower income, are younger and are men to be more likely to support populist parties. There are of course a host of country-level factors (such as culture, history or institutions) that could lead to variation in the electoral success of populist parties and even the ease with which populist parties appear in the first place. Countries also feature great variation in historical commitment to democracy. For this reason I also include country-fixed effects. Additionally, the online Appendix features several reiterations of the analysis where I omit one country at a time and subdivide the sample between east and west. As discussed in the robustness section, the general pattern of my results holds across these specifications.
Table A22 in the Appendix in the Supplementary Material gives the correlations for my independent variables and the most salient control variables. It also includes the ESS left–right self-placement measure (Overall Right). In general, the correlations between the variables are weak, meaning I should not see major problems of collinearity in my models.
Empirical analysis
I employ two analyses to test my hypotheses. First, I conduct a multinomial logit regression with the outcome variable being the category of party respondents could support (with six possible options: populists or mainstream parties on the left, centre or right). This test allows me to determine whether popular-sovereignty disappointment and liberalism disappointment significantly predict support for each type of populist party in the hypothesized direction. Second, to test whether the different relationships between liberalism disappointment and party support between left- and right-populists is simply a product of the general relationship between party ideology and liberalism disappointment, I conduct a series of dichotomous logit models comparing left- and right-populist supporters to only their mainstream ideological counterparts.
Multinomial logit model
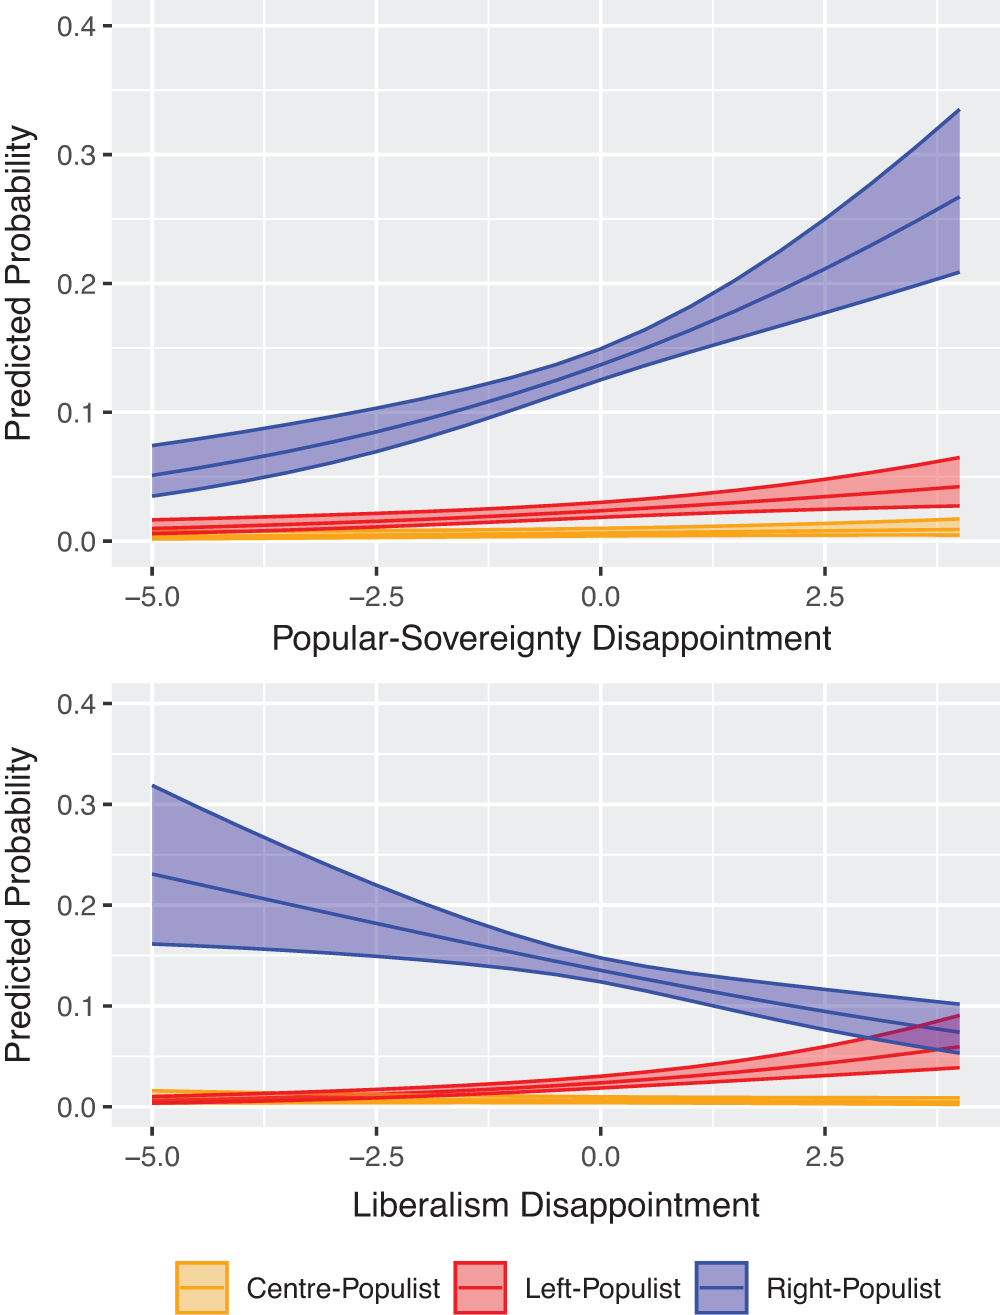
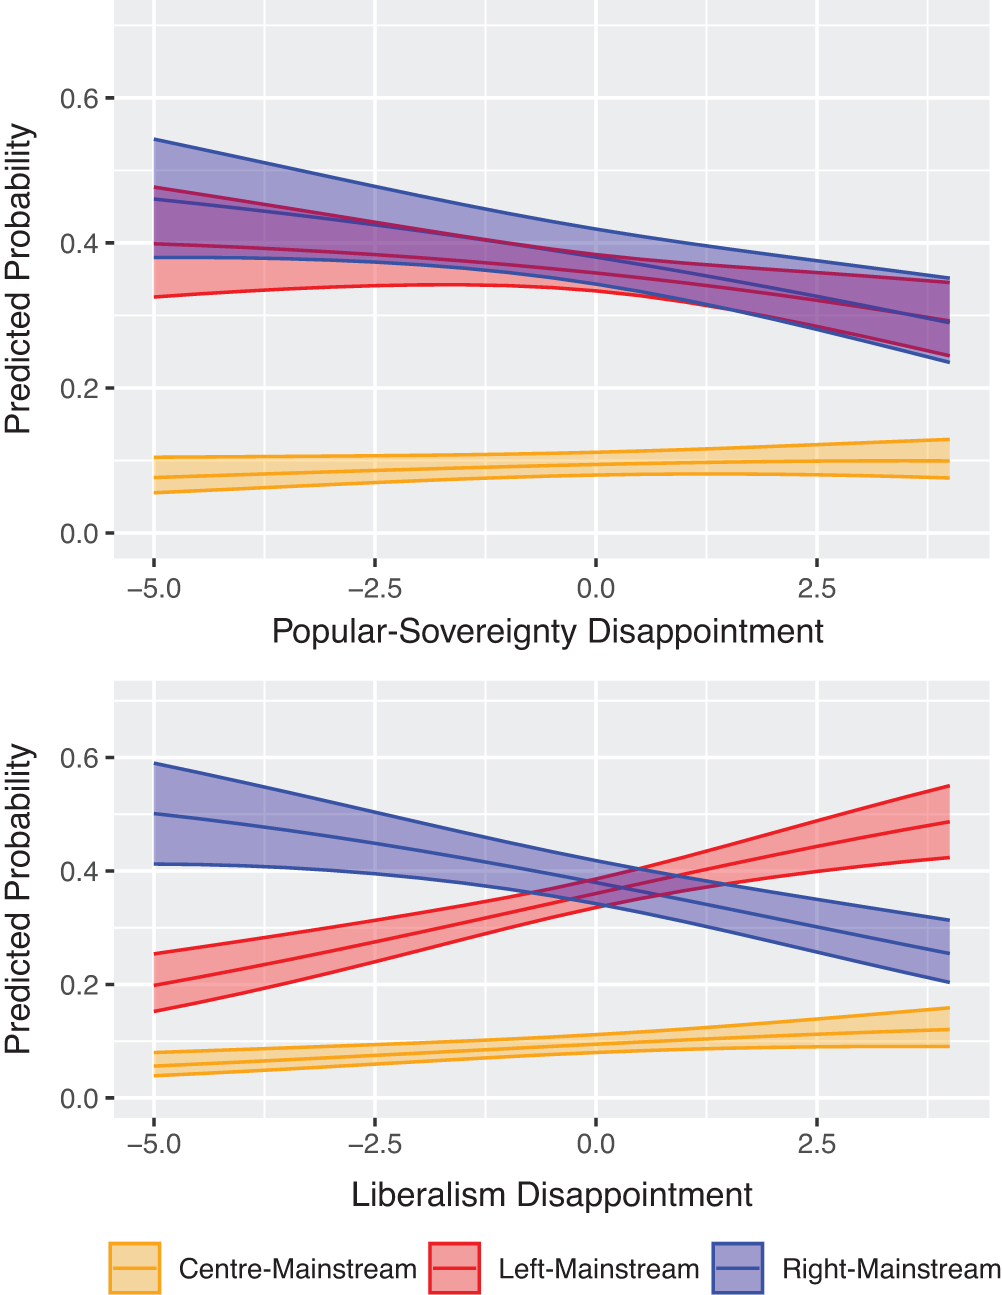
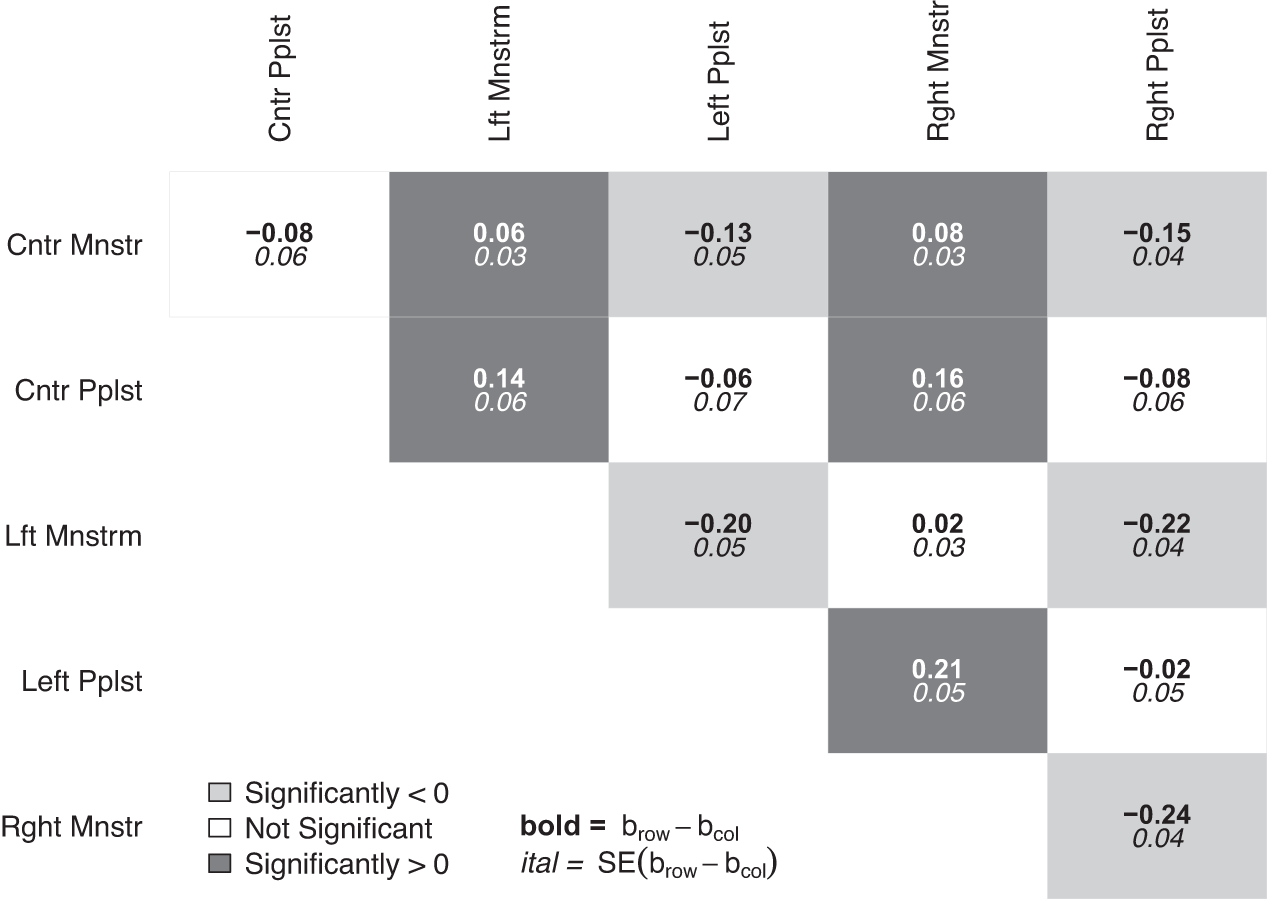
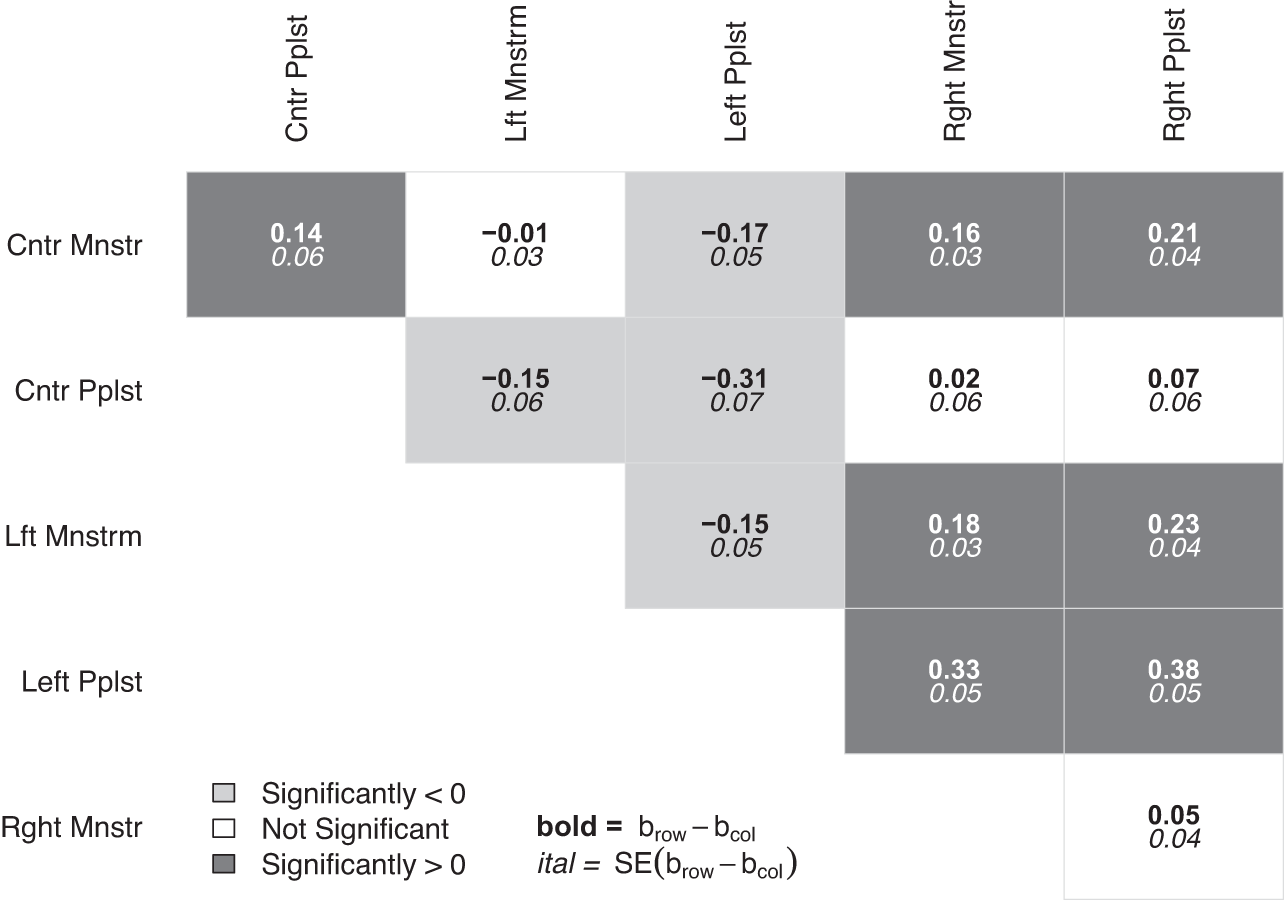
Figure 1 displays the predicted probability of supporting the three categories of populist parties based on respondents’ level of popular-sovereignty disappointment and liberalism disappointment, and Figure 2 displays the predicted probabilities for mainstream parties. Additionally, Figures 3 and 4 display pairwise comparisons of the disappointment coefficients for each type of party, allowing me to infer the relationship between disappointment and support for each type of party relative to every other type of party.Footnote 10
Predicted Probabilities of Support for Populist Parties Based on Popular-Sovereignty Disappointment and Liberalism Disappointment

Predicted Probabilities of Support for Mainstream Parties Based on Popular-Sovereignty Disappointment and Liberalism Disappointment

Popular-Sovereignty Disappointment Coefficient Pairwise Comparison

Liberalism Disappointment Coefficient Pairwise Comparisons

The results of the multinomial logit model strongly support H1 that greater popular-sovereignty disappointment is associated with greater support for all types of populist parties. The upper panel of Figure 1 shows that higher values of popular-sovereignty disappointment are associated with a higher probability that respondents support right, left and centre populists (although this relationship appears relatively weak for the much smaller number of centre populists). At the same time, Figure 2 shows that popular-sovereignty disappointment does not predict more support for mainstream parties and indeed predicts less support for mainstream-right and mainstream-left parties. The pairwise comparisons displayed in Figure 3 confirm the pattern of popular-sovereignty disappointment predicting greater support for each type of populist party.
The multinomial logit model also supports H2 that greater liberalism disappointment will be associated with more support for left populists but less support for right and centre populists. The lower panel of Figure 1 shows that higher values of liberalism disappointment are associated with a higher probability that respondents support left-populist parties but a lower probability of support for centre- and right-populist parties (though once again the relationship appears weak for centre populists). As before, the general pattern of these findings is confirmed by the pairwise comparisons displayed in Figure 4.
However, the results in the right-hand panel of Figure 2 complicate the picture somewhat. Liberalism disappointment is also a significant predictor of support for mainstream parties, and in the same direction as their populist ideological counterparts. Specifically, higher liberalism disappointment predicts greater support for mainstream-left parties and lower support for mainstream-right parties.Footnote 11 Indeed, Figure 4 shows that this model predicts no significant difference of effect on support for right-mainstream and right-populist parties. This begs the question of whether disappointment in one’s country’s performance on the liberal aspects of democracy is really associated with support for populism or simply support for particular ideologies along the left–right spectrum.
Dichotomous logit models: is disappointment a salient cleavage within ideological families?
To test whether liberalism disappointment is a salient cleavage within the ideological camps, I ran a series of dichotomous logit models displayed in Table 5. These models test whether popular-sovereignty disappointment and liberalism disappointment are important predictors of whether a voter chooses to support left- or right-populist parties rather than a non-populist party with the same ideology. Models 1 and 2 display the results of these analyses for left and right voters, respectively. For these models, I subset my data to look only at respondents who reported voting for a left party (Model 1) or a right party (Model 2) with the dependent variable being support for a populist party within that ideological family.
Dichotomous Logit Regression of Left and Right Voters

Note: See Table A6 in the online Appendix for full regression results. AIC = Akaike information criterion. *p < 0.05; **p < 0.01 (includes standardized coefficients).
The results of these dichotomous logit models once again support H1. Higher popular-sovereignty disappointment predicts greater support for both left- and right-populist parties relative to their mainstream ideological counterparts. This once again supports the idea that populist supporters are more likely to believe that their countries are not living up to the ideals of democracy related to rule by the people.
At the same time, the models clarify the picture on H2. Higher liberalism disappointment predicts greater support for left-populist parties relative to mainstream-left parties. But it does not significantly predict either more or less support for right-populist parties relative to mainstream-right parties. Thus even though left voters in general are more likely to have higher liberalism disappointment than other types of voters, greater disappointment in one’s country’s adherence to liberal principles seems to be a salient divide between left-populist supporters and mainstream-left supporters. Left-populist voters seem to feel liberalism disappointment more than their mainstream ideological brethren. The same cannot be said for right-wing voters, however. As a group they are less likely to be disappointed in their countries’ adherence to liberalism, but this lack of disappointment does not divide-right populists from right-mainstream voters.
Overall then, I find strong support for both of my hypotheses. Both the multinomial logit model and the dichotomous models show that higher levels of popular-sovereignty disappointment are associated with greater support for populist parties, regardless of their ideological bent (H1). At the same time, the models show that there is an ideological divide in the relationship between liberalism disappointment and support for populist parties. Higher liberalism disappointment is associated with greater support for left-populist parties, even above and beyond the effect of liberalism disappointment on support for left-mainstream parties (H2a). At the same time, greater liberalism disappointment is associated with less support for centre- and right-populist parties (H2b). However, this type of disappointment does not provide a salient cleavage between mainstream and populist voters on the right.
Robustness checks
I conducted a series of robustness checks to confirm the validity of my findings. Overall the results are robust to a variety of specifications. Due to space constraints, I do not fully discuss the robustness checks here but include full discussions in the Appendix in the Supplementary Material. The Appendix shows how an alternative party categorization strategy (four categories: left-, centre- and right-populists as well as any mainstream parties), adding a control for trust in politicians with a more all-encompassing control for trust in several institutions, adding a control for unemployment, and replacing the ideological controls with ESS’s own left–right economic and cultural variables all yield virtually identical results. Additionally, the Appendix includes a test of whether adding non-voters to the analysis changes the results, finding that it largely does not. The Appendix also discusses repeating the analyses, omitting one country at a time. The results remain virtually unchanged in each iteration with the exception of changes to the relationship between support for right-populist parties and liberalism disappointment when omitting the important case of Poland, and to a lesser extent Sweden and Slovakia.
The Appendix also has a discussion of three alternative ways of constructing my disappointment measures. First, I repeat the analysis using a theoretically motivated factor analysis that only includes disappointment items unambiguously related to each dimension of democratic disappointment, finding virtually identical results to the main results. Second, I repeat the analysis using a promax rotation for the factor analysis and also find similar results. Third, I test whether the results were skewed by the subset of respondents who evaluated their countries’ performance on certain aspects of democracy above their own expectations of ideal democracy (and thus had negative disappointment on specific items). In general, the results are robust to an alternative measurement strategy that addresses this anomaly.
Additionally, the Appendix discusses a test of whether my results are robust to different cut-off points along POPPA’s populism scale and finds substantively similar results. While it is true that if a higher bar is used to classify a party as populist, right-populist supporters are more likely to have higher liberalism disappointment than their mainstream counterparts, the general pattern of higher disappointment being associated with lower support for right-populists holds, regardless of the cut-off point used.
Finally, I tested whether the results vary based on geography. Because of the limited number of right- or left-populist parties in certain regions, the main analysis focuses on the continent as a whole, but the Appendix includes an additional analysis examining first the historically democratic west and then the formerly communist east. Overall, the general pattern holds of higher popular-sovereignty disappointment being associated with support for all types of populist parties (though to a lesser extent in the east), and liberalism disappointment predicting more support for left populists but less support for right populists (particularly in the east).
Discussion
My results strongly support Hypothesis 1 that voters who are more disappointed in how their country lives up to popular-sovereignty principles will be more likely to support all types of populist parties. The multinomial logit model shows that higher values of popular-sovereignty disappointment are associated with a greater likelihood of supporting a centre-, left- or right-populist party and that higher popular-sovereignty disappointment does not predict support for mainstream-left and mainstream-centre parties and actually predicts lower support for mainstream-right parties. The dichotomous logit models show that this relationship also holds when we simply compare the likelihood of voting for a left- or right-populist party to its mainstream ideological counterpart.
This strongly supports my theory that those who support populist parties are motivated by a belief that their countries are failing to live up to the popular-sovereignty aspects of democracy, including the plebiscitary power of the electorate and the supremacy of the will of the people over the interests of elites. It also confirms that this form of democratic disappointment is felt by populist supporters across the ideological spectrum. Because a belief in rule by the people rather than rule by elites is central to populism, it is unsurprising that a belief that one’s country can do more to live up to this popular-sovereignty ideal would be associated with support for all types of populist parties.
I also find strong support for Hypothesis 2 that the relationship between disappointment in one’s country’s adherence to liberal principles and support for populist parties will depend on the ideology of the populist party. My multinomial logit regression revealed that greater liberalism disappointment was positively associated with support for left-populist parties (H2a) but was negatively associated with support for centrist- and right-populist parties (H2b). While it is true that higher liberalism disappointment also predicted support and opposition to mainstream-left and mainstream-right parties, respectively, my dichotomous model revealed that it still formed a salient cleavage between populist-left and mainstream-left voters. However, levels of liberalism disappointment did not seem to matter for distinguishing between populist-right and mainstream-right supporters.
This last point, as well as the sensitivity of my right-populist results to alternative model specifications, somewhat weakens my argument that higher liberalism disappointment is associated with lower support for right-populist parties. However, regardless of model specification, the same general pattern holds: that higher disappointment in liberal performance is associated with higher support for left-populists but not for right-populists. Whether the effect of liberalism disappointment on support for right-populist parties is negative or null, the general trend in the results still lends credence to my theory that greater disappointment in one’s country’s adherence to the liberal aspects of democracy – including free and fair elections, media freedom or minority rights – will only draw citizens to support the more liberal and inclusive left-populist parties and not the illiberal, exclusive, right-populist parties. There seems to be an illiberal–liberal divide between right- and left-populist supporters, just as there is an illiberal–liberal divide between right- and left-populist parties.
Conclusion
I have shown that populist supporters tend to be more disappointed in democracy than their non-populist counterparts. But the specific nature of this disappointment depends on the ideology of the populist party they support. All populist supporters tend to be more disappointed in performance related to the popular-sovereignty aspects of democracy. However, only the supporters of liberal, inclusive, left-populist parties are more disappointed in their country’s liberal performance while supporters of centre- and right-populist parties tend to be less disappointed in liberal performance.
While it is likely unsurprising that supporters of right-wing populist parties are less concerned with preserving and expanding the liberal aspects of democracy, this article’s most important argument is that left-populist supporters do appear to be committed liberal democrats, interested in expanding the liberal aspects of democracy. It seems particularly significant that voters with higher liberalism disappointment are more likely to support an outsider left-populist party than a mainstream party. Established mainstream parties in Europe have been the practitioners and caretakers of liberal democracy for decades, but voters who feel that the countries these parties govern are not living up to liberal standards are more likely to support new or outsider parties. This result is doubly intriguing when one considers that left-wing populist parties are not typically campaigning on issues related to liberal democracy, but are more likely to emphasize economic equality and combatting capitalist elites.Footnote 12 Nevertheless, Table A7 in the Supplementary Material indicates that liberalism disappointment has an even stronger substantive effect than respondents’ economic preferences on supporting a left-populist over a left-mainstream party. More research could be done to explain why disappointed liberals are turning to radical-left options over mainstream-liberal parties and whether the type of left-populist party (i.e. whether or not it is a former communist party) matters for this relationship.
Lastly, while I have made the theoretical argument for a causal relationship, it is difficult to say – and impossible to determine with the ESS’s non-panel data – whether democratic disappointment really causes support for populist parties, or if it is affinity for populist parties that leads voters to believe that their county is not living up to the democratic ideal. It could be the case that identifying with populist parties and listening to their disparaging rhetoric leads voters to become disenchanted with their country’s performance. At the very least, identifying with populists could serve to re-enforce pre-existing disappointment. While it is certainly theoretically likely that democratic disappointment motivates voters to support populists, scholars should remain open to the causal arrow going the other way. Confirming my hypotheses only indicates that there is a relationship between the two phenomena. Future, more experimental research is necessary to identify causation.
Despite this inability to make any causal claim, my results still give important insights into the characteristics of populist parties’ supporters. The literature on populist parties themselves suggests that these parties are a family sharing a similar thin-centred ideology focused on the supremacy of the righteous people over the evil elites (Hawkins and Rovira-Kaltwasser Reference Hawkins, Rovira-Kaltwasser, Hawkins, Carlin, Littvay and Rovira-Kaltwasser2019; Mudde Reference Mudde2004) but still differing in important ideological ways, particularly in their support of or opposition to inclusive, liberal democracy (Ivaldi et al. Reference Ivaldi, Landzone and Woods2017; Mudde and Rovira-Kaltwasser Reference Mudde and Rovira-Kaltwasser2012; Stavrakakis and Katsembekis Reference Stavrakakis and Katsembekis2014). The same seems to be true for these parties’ supporters. All populist voters seem to share a belief that their countries can do more to live up to the popular-sovereignty, people-centric aspects of democracy, but only left-populist supporters believe their countries also need to do more to adhere to liberal values.
Supplementary material
The supplementary material for this article can be found at https://doi.org/10.1017/gov.2025.10025
Data availability
Data and replication code are available from the author upon request.
Use of artificial intelligence
The author used ChatGPT to assist in drafting the R code used to generate the figures and analyses. AI was not used to produce any of the ideas or data in this article.


 Open access