


Impact Statement
Our computational investigation of pool fire dynamics links small-scale jet in cross-flow dynamics such as jet shear-layer, horseshoe and counter-rotating vortical structures to support further understanding of large-scale pool fire phenomena, including flame length, leeward flame drag and ground-level radiative fluxes for fires of varying pool shapes (circle, square, rectangle) in cross-flow. An induced vertical velocity due to vortical structures emanating from the pool's combustion event is lowest for a rectangular pool and represents the controlling factor for the far-field leeward trajectory plume height. At critical crosswinds, the location of the peak radiative flux magnitude shifts from the leeward side of the pool to the windward side and is well correlated to increased scalar dissipation rate. The sensitivity of mesh resolution on radiative flux and vorticity magnitude is investigated. Under-resolved meshes show increased radiative heat fluxes for quiescent conditions, while as crosswind is increased, radiative heat flux is generally underpredicted.
1. Introduction
Large-scale pool fires are of concern to the shipping and transportation industry. For example, sensitive cargo is frequently carried in vehicles powered by hydrocarbon fuels. Therefore, it is necessary to understand the nature of fires that may develop from an accident where the fuel tank is breached and the spilled fuel is ignited. Towards this end, the US Department of Energy, over the past thirty years, has invested in the advancement of fire dynamics knowledge. This includes both theoretical and experimental approaches to understand the thermal insult to an object exposed to the abnormal thermal environment (ATE). The ATE is characterized as a fire environment in which an object is exposed to convective and radiative loads. Here, objects can be either in close proximity to the fire or engulfed within the fire event. In this context, the use of the term ‘fire event’ implies a low-Mach turbulent reacting flow scenario in which hydrocarbon-, propellant- or composite-based fuels are combusting, thereby creating a thermal environment that can pose risk to nearby objects.
Early fire research centred on experimental campaigns for hydrocarbon fuel accident scenarios in quiescent conditions. For example, in Reference Russell and CanfieldRussell and Canfield (1973), an experiment was conducted of a rectangular pool (roughly  $5~{\rm m}\times 2~{\rm m}$) burning aviation JP-5 fuel where temperature and total effective radiative flux was provided. In Reference Gregory, Mata and KeltnerGregory, Mata, and Keltner (1987), a large-scale rectangular pool fire (approximately, $9~{\rm m} \times 18~{\rm m}$) was investigated, again in the near-quiescent outdoor regime. For this effort, the objective was to characterize the thermal response of an engulfed object, to define thermal boundary conditions, and to make an assessment on the repeatability of outdoor experiments, which in most cases can be difficult.
In the seminal work of Reference Tieszen, Nicolette, Gritzo, Holen, Murray and MoyaTieszen et al. (1996), fire phenomena in quiescent and moderate crosswind was outlined based on experimental observations conducted at both the Naval Air Warfare Center (China Lake, CA) and the Lurance Canyon Burn Facility (Sandia National Laboratories, NM). In the work of Reference Gritzo, Gill and KeltnerGritzo, Gill, and Keltner (1995), gaps in experimental and modelling techniques were outlined that continue to guide current fire instrumentation. Early Reynolds-averaged Navier–Stokes (RANS) modelling approaches were provided in Reference Gritzo and NicoletteGritzo and Nicolette (1997), thereby showcasing how a modelling and simulation paradigm can serve as an aid to fire physics elucidation. In all experimental and transient numerical studies of pool fires, there is the observation of a puffing phenomenon, whose frequency is well correlated to pool diameter (Reference Cetegen and AhmedCetegen & Ahmed, 1993) via  $f = 1.5/\sqrt D$ ( $f$ is the puffing frequency, and $D$, the pool diameter).
The dynamics of quiescent pool fires are dominated by Rayleigh–Taylor (RT) bubble spike instabilities that form small-scale vorticity structures at the outer diameter of the pool fire, see Reference TieszenTieszen (2001). These structures are noted in both reacting flows and variable-density helium plumes, see Reference Tieszen, O'Hern, Weckman and ScheferTieszen, O'Hern, Weckman, and Schefer (2004) and Reference O'Hern, Weckman, Gerhart, Tiezen and ShefferO'Hern, Weckman, Gerhart, Tiezen, and Sheffer (2005), respectively. As the plume accelerates vertically, entrainment of these small-scale structures towards the centre of the plume is noted – a phenomenon that also supports Kelvin–Helmholtz (KH) shear layer instabilities and core collapse. The large-scale puffing phenomenon, which drives a vortex structure of the order of the pool diameter, is characterized first by small-scale RT mixing, followed by the growth of a large-scale vortex that is formed by the misalignment of density and pressure gradients, i.e. baroclinic torque (the reader is referred to Reference O'Hern, Weckman, Gerhart, Tiezen and ShefferO'Hern et al. (2005) for a helium plume description of a puffing cycle, and Reference Domino, Hewson, Knaus and HansenDomino, Hewson, Knaus, and Hansen (2021) for a pool fire description). This large-scale vortical structure accelerates upwards due to buoyancy effects, thereby allowing the cycle to repeat. From a modelling and simulation perspective, capturing the baroclinic torque that drives core collapse is quite easy, both in the unsteady-RANS regime (Reference Tieszen, Nicolette, Gritzo, Holen, Murray and MoyaTieszen et al., 1996) and the large-eddy simulation (LES) regime (Domino, Hewson, et al., Reference Domino, Hewson, Knaus and Hansen2021; Reference Kang and WenKang & Wen, 2004; Reference Ma, Nmira and ConsalviMa, Nmira, & Consalvi, 2020). Pool fires also produce the observable phenomenon of finger-like structures, which was noted in Reference Tieszen, Nicolette, Gritzo, Holen, Murray and MoyaTieszen et al. (1996) and observed clearly in the most recent LES-based modelling studies of Reference Vilfayeau, White, Sunderland, Marshall and TrouvéVilfayeau, White, Sunderland, Marshall, and Trouvé (2016) and Domino, Hewson, et al. (Reference Domino, Hewson, Knaus and Hansen2021), where radial entrainment, RT instabilities and streamwise vorticity generation interact.
Migration from the quiescent pool fire use-case to those that involve crosswind is necessary, as it represents a more likely scenario based on average wind speed maps in the USA (NOAA, 2018). In addition to representing a more probable environment, the increased mixing due to both large- and small-scale vortical features can drastically increase combustion efficiency that increases radiative fluxes convective loads due to direct flame contact (Reference Finney, Grumstrup and GrenfellFinney, Grumstrup, & Grenfell, 2020). The presence of wake vortices in outdoor experiments was observed in Reference Tieszen, Nicolette, Gritzo, Holen, Murray and MoyaTieszen et al. (1996), in addition to leeward large-scale column vortex structures that had a time mean structure, yet meandering characteristic. Experimental observations in this study were that although the column vortex structure had an appreciable lifetime, they were not stable. The authors cite observations of slow column vortex growth, downstream convection and an extinction event. The process of inception to extinction of the fire columns repeated for the lifetime of the observation period.
The role of crosswind on measured radiative flux was the focus of the experimental campaign of Reference Suo-Antilla and GritzoSuo-Antilla and Gritzo (2001) and Reference Suo-Anttila and GritzoSuo-Anttila and Gritzo (2008), where a mock fuselage that was represented by a cylinder 3.66 m in diameter, was placed tangential to the outer leeward edge of two circular pool configurations (10 and 20 m in diameter). Outdoor wind crosswind conditions for the medium wind configuration were roughly 5 m s $^{-1}$ and supported much higher maximum heat fluxes (260 kW m $^{-2}$) on the windward side of the object (directly attributed to flame impingement), and a high heat flux region on the leeward side of the calorimeter (corresponding to the flame shape) as compared with the low-speed configuration of 2 m s $^{-1}$. In experiments by the same team, a substantially higher crosswind test (10.9 m s $^{-1}$) resulted in peak radiative fluxes in excess of 300 kW m $^{-2}$ measured now on the leeward, i.e. wake region of the calorimeter, thereby quantitatively emphasizing the critical role of crosswind on fire insult magnitude.
Although a baseline of understanding for jets in cross-flow exists (for example, the review provided by Reference MaheshMahesh (2013)), details as to how pool fires respond to crosswinds of a given magnitude and baseline turbulence state remain an active area of research. In this application space, much of the research and observation has been performed within the large-scale wildland fire arena; for example, the observation of finger-like structures in large-scale wildland fires (Reference Forthofer and GoodrickForthofer & Goodrick, 2011), and the possible existence of Taylor–Gortler vortices due to flame curvature (Reference Finney, Cohen, Forthofer, McAllister, Gollner, Gorham and EnglishFinney et al., 2015). Much of our high-level understanding of pool fire dynamics in crosswind is driven by analogy with jets in cross-flow, building from the experimental work of Reference Fric and RoshkoFric and Roshko (1994) and Reference Kelso, Lim and PerryKelso, Lim, and Perry (1996). In the well-cited representation of a jet in cross-flow, see figure 1 of Reference Fric and RoshkoFric and Roshko (1994), key vortical features classically identified include jet shear-layer, horseshoe, counter-rotating vortex pair (CVP) and wake vortical structures, the first two of which reside in the windward side of the jet, while the later form on the leeward side. All of these foundational vortical structures that are noted in cross-flow configurations can be envisioned to augment mixing and combustion efficiency. For example, at high cross-flow magnitude, a standing horseshoe vortex at the windward air–fuel interface is expected to support increased mixing and, therefore, shift peak radiative heat fluxes from the leeward side of the pool to the windward position. The inclusion of bluff body interactions in crosswind, as already noted in Reference Suo-Anttila and GritzoSuo-Anttila and Gritzo (2008), further complicates the radiative and convective loads on objects and is the subject of our continued research.
Many researchers have used laboratory-scale experiments to learn more about the behaviour of pool fires, specifically the burn rate, flame height, flame tilt and heat transfer to adjacent surfaces. This work has focused on creating analytical correlations and fitting data to supply constants for these relations. Reference BabrauskasBabrauskas (1983) reviewed data for pool fires with a diameter greater than 0.2 m. From this data, they developed analytical models for burn rate and heat output for fires in quiescent conditions. In addition, a modification to these equations is presented for a pool in a crosswind. The shape of the pool has an effect on several quantities of interest (QoI), as explored by Reference Quintiere and GroveQuintiere and Grove (1998). In that work, they reviewed data to generate algebraic relations to predict the entrainment rate and flame height for circular and rectangular pool fires with a range of heat release rate values. Reference Hu, Zhang, Zhang and YangHu, Zhang, Zhang, and Yang (2014) revisited the work of Reference Quintiere and GroveQuintiere and Grove (1998) by conducting experiments with rectangular nozzles. These nozzles had a fixed surface area (285 mm $^2$) and a range of aspect ratios ( $1:1$ to $1:71$). They presented a modification to the flame height predictions for rectangular sources. Other researchers have examined the effects of crosswinds, along with the effects of pool shape. Reference Kolb, Torero, Most and JoulainKolb, Torero, Most, and Joulain (1997) investigated rectangular burners, all 0.4 m wide with lengths from 0.25–0.75 m, where the length was in the streamwise direction, and crosswinds from 0.5–2.5 m s $^{-1}$. They found that flame length increases linearly with the crosswind velocity, flame height decreases with crosswind velocity, and the flame narrows (when viewed from above) as the crosswind increases. Reference Jiang and LuJiang and Lu (2016) examined the mass burning rate and flame tilt for aviation fuel pool fires. In their work, they varied the circular pool diameter from 0.1–0.6 m and crosswinds from 0 to 4.71 m s $^{-1}$. They determined correlations to relate dimensionless numbers, such as the Froude number (defined as $Fr = u/\sqrt {gD}$, where $u$,
$u$,  $g$ and $D$ are defined as the velocity, gravity and diameter, respectively), to the mass burning rate and the flame tilt. In Reference Ju, Gollner, Wang, Tang, Zhao, Ren and YangJu et al. (2019), the downstream radiative and convective heating from a flame in cross-flow was examined. Methane and propane were supplied to a rectangular burner (25 by 5 cm) under crosswinds from 0.6–2.2 m s $^{-1}$. They found that propane (which is more luminous in the small-scale regime) exhibited a larger radiative heat transfer than the methane; however, methane showcased larger convective heat transfer.
Relationships between flame thickness, the Grasshoff number and Reynolds number correlate well to local radiative heat transfer, while relationships between Nusselt number, Reynolds number and Grasshoff number are found to describe the convective heat transfer. Reference Li, Hu and ShangLi, Hu, and Shang (2018) performed experiments with 8–15 mm nozzles that were attached to a vertical pipe under various crosswinds. The objective was to measure how far down the pipe the flame would attach on the leeward side (called ‘the downwash’). As the crosswind increased, the downwash increased to a critical value and then decreased. The maximum flame downwash was shown to have a linear relation with the Froude number of the fuel jet or the cross-flow. Reference Tang, He and WenTang, He, and Wen (2019) found a similar critical value in their work. They examined rectangular burners with an area 100 cm $^2$, but varying aspect ratios (1, 2, 4 and 8.1) under crosswind velocities ranging from 0.71–3.43 m s $^{-1}$. The flame attachment length on the ground was found to increase, and then decrease after a critical crosswind value. This critical value was found to decrease with the increasing burner aspect ratio and fuel heat release rate. Below the critical value, high aspect ratio burners were most effected by increased crosswind. They found that this critical value occurred at around a Froude number of 2.5.
Another postulated question related to pool fire behaviour in a crosswind is how pool shape affects the overall fire dynamics, especially when varying the crosswind magnitude. In the reacting flow RANS-based study of Reference Sinai and OwensSinai and Owens (1995), the effect of pool shapes (square and circle) were investigated in low crosswind (less than 5 m s $^{-1}$). Evidence of plume bifurcation in the square, i.e. temperature peaks that formed off of the centreline plane, was found as was an elevated plume structure for the circular pool as compared with the square pool. In more recent numerical studies that involve fire, aircraft crash-and-burn scenarios using LES were captured in Reference Wang and Da WangWang and Da Wang (2015), however, using a large circular pool shape of 20 m.
The subject of our paper is to evaluate the effects of both crosswind and pool shape on a large-scale methane pool fire using a low-Mach, unstructured, large-eddy, unsteady flamelet formulation recently explored in Domino, Hewson, et al. (Reference Domino, Hewson, Knaus and Hansen2021). In our study, we use the National Nuclear Security Administration simulation tool, Sierra Thermal/Fluids: Fuego (Reference Moen, Tieszen, Evans, Black, Domino, Cochran and PierceMoen et al., 2017) (hereafter referred to as Fuego) that is actively developed under Sandia's Advanced Simulation and Computing portfolio. For our study, the following three pool shapes are considered: circular, square, rectangular; all at a fixed surface area of approximately 78 m $^2$, in the presence of four crosswind velocities, 0, 5, 10 and 20 m s $^{-1}$. We will discuss novel physical insights of pool fire dynamics gained by deploying a high-fidelity, LES-based multiphysics computational fluid dynamics tool that employs state-of-the-art combustion and participating media radiation modelling. The QoI presented include general flame shape and tilt, temperature profiles and radiative heat flux magnitude. Of specific interest to our research is the effect that mesh resolution has on capturing key QoI found in accident scenario scoping studies. Although the simulations presented in this body of research do not correspond to a particular validation or experimental configuration, the methodology presented provides a systematic workflow example for fire analysis. Therefore, these simulations strive to serve as a mechanism to inform future experimental campaigns that are most relevant to our application space of interest. In essence, our computational investigation provides a series of pretest configurations that can guide upcoming experimental parameters and be used for future investment decisions. The paper is organized by first providing an overview of mathematical and numerical formulation exercised, see § 2. In § 3, the underlying configuration and principles of mesh and time step sensitivity are outlined. The general overview of results is provided in § 4, while conclusions and future research avenues are presented in § 5.
2. Mathematical and numerical formulation
The requisite mathematical and numerical methodology to characterize the dynamics of a pool fire includes the coupling between low-Mach, turbulent, reacting flow modules with participating media radiation transport, see Reference Tieszen, Nicolette, Gritzo, Holen, Murray and MoyaTieszen et al. (1996). Fuego is a Sandia National Laboratories simulation tool that is built under the Sierra Toolkit (Reference Edwards, Williams, Sjaardema, Baur and CochranEdwards, Williams, Sjaardema, Baur, & Cochran, 2010) and Trilinos (Reference Heroux, Bartlett, Howle, Hoekstra, Hu, Kolda and WilliamsHeroux et al., 2003) open-source packages that allow for unstructured topological mesh transversal, i.e. iteration of mesh objects such as elements, nodes, external faces and the implicit solver interface that arise from the ATE partial differential equation set, respectively. The infrastructure and application tools are designed to operate in the massively parallel, extreme computing regime as noted in Reference Lin, Bettencourt, Domino, Fisher, Hoemmen, Hu and KennonLin et al. (2014), that was first established within the open-source counterpart application code Nalu (Reference DominoDomino, 2014).
The set of partial differential equations that Fuego solves for our particular fire environment are the Favre-filtered, variable-density, low-Mach continuity, momentum, enthalpy (both with and without the divergence of radiative flux source term) and mixture fraction transient transport equations. The activation of a non-scattering radiative transport equation completes the fire modelling partial differential equation suite. An unsteady flamelet-based formulation is used to model combustion, see Domino, Hewson, et al. (Reference Domino, Hewson, Knaus and Hansen2021). The central concept of a flamelet approach is to separate the numerical evolution of the turbulent flow field from the chemistry via the introduction of a conserved mixture fraction,  $\tilde {Z}$, that represents the fraction of mass originating from the fuel stream, see Reference PetersPeters (2001). A generalized heat loss mechanism due to the combination of radiative and environmental heat loss is activated. For turbulent flow modelling, we choose the LES construct, where it is expected that the primal instabilities associated with fire dynamics, (i.e. KH and RT) are resolved. In our LES, we activate the one-equation $k_{SGS}$ model of Reference YoshizawaYoshizawa (1993).
To determine thermochemical state quantities including the density, viscosity, temperature and the source and sink terms for the radiative transport equation, values are pretabulated and stored in a flamelet library as a function of the mixture fraction, the scalar dissipation rate, the heat loss and the scaled scalar variance,  $\tilde {Z}^{\prime \prime 2}/\tilde {Z}(1-\tilde {Z})$. Here, mixing is characterized by the scalar dissipation rate, $\chi = 2 D_Z | \boldsymbol {\nabla } \tilde {Z} |^2$. The diffusion coefficient, $D_Z$, for the mixture fraction whose value is obtained from the dynamic viscosity ( $\mu$), constant Schmidt number (in this study taken to be $Sc = 0.7$) and density ( $\rho$) via the following relationship: $\rho D_Z = \mu /Sc$. The library is generated using a steady flamelet solver for adiabatic flames followed by a transient flamelet calculated with heat losses as described in Domino, Hewson, et al. (Reference Domino, Hewson, Knaus and Hansen2021) for pure methane burning in air at 1 atm using GRI-Mech 3.0 (Reference Smith, Golden, Frenklach, Moriarty, Eiteneer, Goldenberg and QinSmith et al., 2022). The flamelet library is tabulated in a structured table with 179 values adaptively meshed in the mixture fraction coordinate, 21 logarithmically spaced values in the scalar dissipation rate coordinate, 36 values of heat losses down to a heat loss of 1.3 MJ kg $^{-1}$ at the stoichiometric point and 25 logarithmically spaced values in the scaled scalar variance coordinate. A presumed probability density function approach is used for subgrid closure due to turbulent fluctuations, e.g. see Reference PetersPeters, 2001.
To support a variety of use cases that are characterized by geometric complexity such as the modelling of a damaged road fuel tanker in an urban environment, a generalized, unstructured discretization approach is chosen. The underlying numerical discretization formulation that Fuego supports is represented by the control volume, finite element formulation (CVFEM), (Reference Schneider and RawSchneider & Raw, 1986). Although CVFEM affords the ability to promote in polynomial space, e.g. from linear to quadratic, thereby recovering a higher-order formulation (Reference DominoDomino, 2018), in this study we solely exercise linear hexahedral unstructured meshes that, along with our three-point backward Euler implicit time integrator, allow for second-order in space-and-time accuracy. An approximate projection with time step scaling methodology, as defined in Reference DominoDomino (2006), is exercised. This numerical formulation has been used in a variety of recent turbulent flow research works including COVID-19 modelling (Reference DominoDomino, 2021; Reference Domino, Pierce and HubbardDomino, Pierce, & Hubbard, 2021), methanol fires (Reference Hubbard, Hansen, Kirsch, Hewson and DominoHubbard, Hansen, Kirsch, Hewson, & Domino, 2022) and hydrocarbon pool fires (Reference Domino, Hewson, Knaus and HansenDomino, Hewson, et al., 2021). For participating media radiation, an unstructured finite element formulation using streamwise upwind Petrov–Galerkin residual-based stabilization is activated within a discrete ordinates construct (Reference BurnsBurns, 1997).
For a complete set of fire environment equations, numerical stabilization and coupling details, along with references to Fuego code verification (for example, see Reference Domino, Wagner, Luketa-Hanlin, Black and SutherlandDomino, Wagner, Luketa-Hanlin, Black, & Sutherland, 2007), the reader is referred to Reference Domino, Hewson, Knaus and HansenDomino, Hewson, et al. (Reference Domino, Hewson, Knaus and Hansen2021). We note that in contrast to Reference Domino, Hewson, Knaus and HansenDomino, Hewson, et al. (Reference Domino, Hewson, Knaus and Hansen2021), our current study omits soot transport. Complex phenomena such as smoke shielding (Reference Luketa and BlanchatLuketa & Blanchat, 2015) are not captured, while hydrodynamic findings are similar to a recent non-sooting pool fire application found in Reference Hubbard, Hansen, Kirsch, Hewson and DominoHubbard et al. (2022). Therefore, participating media radiation coupling to the energy equation, which enters through the divergence of the radiative flux source term, is solely through the presence of  ${\rm CO}$, ${\rm CO}_2$, ${\rm CH}_4$ and ${\rm H}_2 {\rm O}$, whose absorption coefficient is obtained from a curve-fit from RADCAL data (Reference Barlow, Karpetis, Frank and ChenBarlow, Karpetis, Frank, & Chen, 2001; Reference GrosshandlerGrosshandler, 1993). The reader is encouraged to view the radiative heat fluxes and temperature profiles provided as approximate and not intended for safety decisions. For example, Reference Liu, Guo, Smallwood and GülderLiu, Guo, Smallwood, and Gülder (2002) conducted numerical simulations with and without the effect of soot and gas phase species for a bench-scale ethylene flame and found that neglecting soot radiation resulted in peak temperatures that were 25 K greater than when both soot and gas phase contributions were included (roughly a 2 % error). Key hydrodynamic features of fires do not appreciably change with and without the inclusion of soot as, for example, both reacting and non-reacting flows display puffing phenomena (Reference O'Hern, Weckman, Gerhart, Tiezen and ShefferO'Hern et al., 2005; Reference Tieszen, O'Hern, Weckman and ScheferTieszen et al., 2004). Future work is planned to evaluate soot generation, oxidation and quenching events that support smoke shielding events.
3. Model and numerical parameter details
Previous work at Sandia National Laboratories has validated Fuego's use of the unsteady, generalized heat loss flamelet-based combustion and soot model, against experimental data for a 5 m diameter JP-8 pool fire; baseline meshing requirements were also provided (Domino, Hewson, et al., Reference Domino, Hewson, Knaus and Hansen2021). This study demonstrated that utilizing under-resolved mesh resolutions for quiescent pool fires resulted in radiative heat flux predictions that were higher than the most refined meshes exercised. From a safety perspective, this finding suggests that coarse mesh representations of fires in quiescent flows provide a conservative description of the fire environment. In this work we consider a larger-scale methane pool fire for three pool shapes (circle, square, rectangle) and four prescribed crosswind velocities,  $u_k$, of 0, 5, 10 and 20 m s $^{-1}$. A schematic of the domain can be seen in figure 1. The pool shapes are defined so they have the same surface area as a circular pool fire with a diameter of 10 m. The square has the constraint that the aspect ratio (length to width) is defined as one, and the rectangle has an aspect ratio of three. The domain is 114 m long ( $x$ direction), 57 m wide ( $z$ direction) and 43 m high ( $y$ direction) for the cases with a crosswind, and 71 m high for the quiescent case to allow extra space for the vertical plume. The origin of the mesh is located at the centre of the pool. The inflow condition is along the positive $x$ axis. A steady power-law crosswind condition is defined as $u(y)=u_k (y/y_k)^{(1/\alpha )}$, such that at 10 m from the ground, $y_k$, the velocity is equal to the prescribed crosswind velocity. In our study, the value of $\alpha$ is seven. The effect of a realistic turbulence represents the focus of our upcoming research. Open boundary conditions are used on all surfaces other than the ground (adiabatic wall-modelled LES boundary), the pool (inflow boundary) and the inflow. An inlet fuel velocity of 0.06 m s $^{-1}$ consisting of low turbulence intensity is prescribed at 300 K that enters the domain in the vertical direction.
(a) The domain is 114 m long ( $x$ direction), 57 m wide ( $z$ direction) and 43 m high ( $y$ direction) for the cases with a crosswind. An additional 28 m were added to the height for the quiescent case. The inflow condition is along the $x$ axis. The origin of the domain is on the centre of the pool. (b) Each pool has the same area, $A=\pi 10^2/4\approx 78.53 \ m^2$. The square pool is defined as $W=L=\sqrt {\pi 10^2/4}\approx 8.862 \ m$ and the rectangle is defined as $W=L/3=\sqrt {\pi 10^2/12}\approx 5.122 \ m$.

To explore the effect of mesh resolution on predicted QoI, three mesh resolutions were evaluated for all pool shapes and crosswinds. In order to make the problem tractable, the mesh was selectivity refined in areas were the fire plume would be present (near and downwind from the pool). As an example, the refinement strategy can be seen in figure 2, where the coarsest linear hexahedral mesh with paving is shown. In this set of images, five mesh resolution transitions occur between the pool and the far-field region. For the most refined mesh, spacing at the centre of the pool is 0.0425 m. Mesh spacing at the inner, middle and outer refinement regions of the mesh were 0.085, 0.10625, 0.14875 m, respectively, while the far-field mesh spacing was 0.425 m.
Coarse (R0) mesh illustration outlining (a) vertical resolution, and the surface-based paving construct for the (b) circle, (c) square and (d) rectangle pool shape configurations.

Detailed information for each mesh is shown in table 1. The R0, R1 and R2 simulations were run on one, four and 10 nodes, respectively (36 MPI ranks/node), on Sandia's institutional cluster resource, Eclipse (2.1 GHz processors; nodes with dual sockets, 18 cores each; Intel Omni-Path high-speed interconnect). Upper limits for mesh size, and hence, core count utilization, were based on expected mesh resolution requirements while balancing our Sandia institutional compute node allocation provided for the study. Each simulation was considered converged in time when the Favre-average temperature isotherm at 700 K, which is a representative flame isotherm, no longer changed location with respect to time. The R0 meshes could simulate of the order of 30 s in two days, whereas the R2 meshes were of the order to two seconds per two days.
Number of elements for each of the meshes used in the study.

‘Standard’ indicates the 43 m-high meshes, while the ‘Tall’ indicates the 71 m meshes used in the 0 m s $^{-1}$ cases. The R2 mesh represents a uniform refinement of the R1 mesh, while R0 was manually coarsened.
Low-dissipation LES operators, as exercised in Reference Domino, Sakievich and BaroneDomino, Sakievich, and Barone (2019), were in use for the momentum system while van Leer MUSCL-based stabilization was activated for the scalar transport equations (Reference Moen, Tieszen, Evans, Black, Domino, Cochran and PierceMoen et al., 2017). In our study, we used the symmetric quadrature set of Reference Thurgood, Pollard and BeckerThurgood, Pollard, and Becker (1995) with a quadrature set order,  $N=4$, that results in $8N^2 = 128$ ordinate directions. Simulations were marched at unity Courant numbers using a temporally second-order, three-state implicit time integrator (BDF2). A generalized minimum residual (GMRES) iterative solver was used for all transport equations and were preconditioned by a symmetric Gauss–Seidel smoother. For the continuity equation, the aggregation-based Muelu algebraic multigrid preconditioner was activated. Each solver is provided through the Tpetra/Balos/Ifpack2/Kokkos/Muelu Trilinos open-source solver package (Reference Heroux, Bartlett, Howle, Hoekstra, Hu, Kolda and WilliamsHeroux et al., 2003). In general, numerical stability for the simulation suite was very good.
4. Discussion
The most obvious aspect to the fire use case in comparison with a standard jet in cross-flow configurations is the extremely low jet to ambient velocity and momentum ratios found, i.e.  $r = u_j/u_\infty$ and $J = \rho _j u_j / \rho _\infty u_\infty$, respectively, as each are $\ll$1. However, unlike a classic low-velocity ratio jet in cross-flow examples where hairpin vortices dominate (Reference MaheshMahesh, 2013), classic shear-layer and horseshoe vortices form on the windward side of the pool, along with counter-rotating vortex pairs and wake vortices on the leeward side. In fires, these structures are due to the substantial effective vertical acceleration from the combustion process. The ensuing baroclinic torque generates vortex rings near the pool surface, rather than by a vortex sheet emanating from the jet nozzle. Therefore, although fires are low-momentum configurations based on inflow conditions, combustion, dilatation, vertical acceleration and rotation drives laminar-to-turbulent transition and substantial coupling between the crosswind and baseline fire dynamics.
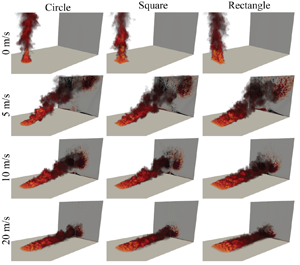
Figure 3 outlines the volume renderings of instantaneous temperature for the most refined set of meshes for each of the pool shapes and crosswind velocities, along with a vertical plane of Favre-averaged vorticity in the streamwise direction. For the quiescent pool fire configuration (top row), large-scale vortex rings associated with the puffing phenomenon can be seen. In fact, fires in crosswind also display a puffing phenomenon, as observed and highlighted by Reference Tieszen, Nicolette, Gritzo, Holen, Murray and MoyaTieszen et al. (1996). For low-to-moderate crosswind configurations, the large-scale vortical features, which are of the order of the pool length scale, are advected downstream and eventually stagnate in vertical acceleration due to mixing with the ambient surroundings. These large-scale structures found in the wake of fires very much resemble shear layer vortex rings commonly found in axisymmetric jets, as these structures tilt and fold when subjected to cross-flow (Reference Kelso, Lim and PerryKelso et al., 1996). Several trends are clear as we investigate the effects of crosswind and pool shape on the macroscale fire plume. For instance, here we see the most intuitive trend that as the crosswind velocity increases, the plume leans over, similar to the behaviour seen by Reference Kolb, Torero, Most and JoulainKolb et al. (1997) and Reference Tang, He and WenTang et al. (2019), among others. Expected finger-like structures are also evident in all of the mesh resolutions that appear in the spanwise, or  $z$, direction. Although not yet quantified, leeward plume trajectory height (or simply the distance above the bottom ground plane that the plume trajectory follows) can be seen to be lowest for the rectangular pool. The Favre-averaged vorticity magnitude shading also captures the downwind counter-rotating vortex pair structures, and the near-wall counter-rotating vortical features that are induced by the complex fire structure above the ground plane.
A matrix of volume renderings of instantaneous temperature for the R2 meshes. The back plane is coloured by Favre-averaged vorticity (in the direction normal to the plane,  $+x$), where red is positive rotation and black is negative rotation. In our discussion that follows, Favre-averaged variables (in time) for Favre-filtered QoI are labelled as $\hat \phi = \overline {\rho \tilde \phi } / {\bar \rho }$, and referred to as simply ‘Favre-averaged $\phi$’.

Differences in the flame shape due to the pool shape are harder to view from the instantaneous temperature field, as the trends are not separated from intermittent effects. Most experimental researchers use an image processing technique (Reference Kolb, Torero, Most and JoulainKolb et al., 1997) to determine the average location of the flame. By viewing the Favre-averaged temperature, we can obtain a more obvious description of the time mean flame shape. Figure 4 shows an isocontour between 723 and 773 K (Reference Wang and Da WangWang & Da Wang, 2015) for the centreline of the domain ( $z=0$). This gives an indication of fire's size and shape, if not the exact location, and makes the effect of pool shape and wind velocity clearer. As seen in the figure, the circular and square pools show similar results in terms of height for the quiescent flows. This trend agrees well with the work of Reference HeskestadHeskestad (1991), where a height of 24 m is predicted for a circular pool of our configuration using
 \begin{equation} H_f = D(3.7\dot{Q}^{ * (2/5)} - 1.02), \end{equation}
where  $H_f$ is the flame height, $D$ is the diameter of the pool and $\dot {Q}^*$ is defined as
 \begin{equation} \dot{Q}^ * = \dot{Q}/(\rho c_p T g^{.5} D^{2.5}). \end{equation}
Above,  $\rho$ is the density of air, $c_p$ is the density of air, $T$ is the far field temperature, $g$ is gravity and $D$ is the diameter of the pools. The heat release rate per unit area, $\dot {Q}$, can be measured or approximated by
 \begin{equation} \dot{Q} = Am''\Delta H_{c,eff}(1-\exp({-}k\beta D)), \end{equation}
where  $A$ is the area of the pool, $m''$ is the mass loss per unit area per unit time, $\Delta H_{c,eff}$ is the effective heat of combustion and $k\beta$ is an empirical constant. Reference BabrauskasBabrauskas (1983) gives information for $m''$ and $k\beta$. For our circular pool, we calculate a heat release rate (HHR, $Q$) of 3.9 MW. Figure 4 and table 2 give a flame height of 20.4 m (as for the quiescent case, the flame length is equal to the flame height). While there is a 3.6 m difference between the correlation prediction and the simulation, one must keep in mind that a temperature isotherm is an imperfect representation of the flame's location. As such, we consider this to be a good agreement.
Isocontours of the Favre-averaged temperature at 723 and 773 K for the three pool shapes, (a) circular, (b) square, (c) rectangle, showing the four crosswind conditions (0, 5, 10, 20 m s $^{-1}$), R2 mesh. The rectangular pool has shorter contours than the circle and the square. For the rectangular pool shape, pool-generated vortex pair interaction is separated more than in the other two pools, leading to less interaction and a smaller induced velocity in the vertical ( $y$) direction.

Flame lengths ( $L_f$), flame angle ( $\theta _d$) and drag lengths ( $L_d$), as defined by the 773 K isotherm on the R2 mesh for each crosswind velocity and pool shape.

Reference Quintiere and GroveQuintiere and Grove (1998) developed a similar correlation for rectangular pools, where flame height can be solved for implicitly:
 \begin{equation} \dot{Q}^ * _{mod} = C_f(H_f/W)^{1/2}[1 + 2C_1(H_f/W)][1 + 2C_1(W/L)(H_f/W)]. \end{equation}
Above,  $W$ is the width of the pool, $L$ is the length of the pool, $C_f = 0.152$, $C_1=0.199$ and $\dot {Q}^*_{mod}$ is given by
 \begin{equation} \dot{Q}^ * _{mod} = \dot{Q}/(\rho c_p T g^{.5}W^{1.5}L). \end{equation}
For our conditions, we estimate a flame height of 22 m for a square pool. Again, using the 773 K temperature isocontour in our simulations, we find a height of 22.5 m. This correlation can also be used to evaluate the flame height of the rectangular pool, where we estimate 11 m using the correlation. Our simulations give the height of the 773 K temperature isocontour at 9.9 for the rectangular pool case. Again given the caveat of using temperature as a proxy for flame location, we find that the predictions from these correlations agree well with our simulated results.
Obviously as crosswind is introduced, as expected based on intuition, the flame leans over. The effect of crosswind is to decrease the flame height, while increasing the drag length. Here, we define the flame length,  $L_f$, as the distance from the centre of the pool to the tip of the flame for the 773 K isotherm and the flame angle $\theta _f$ as the angle between the flame length and the ground. The flame drag length, $L_d$, is the distance from the leeward edge of the pool of the maximum $\times$ location on the ground of that same isotherm. We note that as this is a temperature isotherm, these quantities should be taken as an indication of the trends of flame shape, rather than an absolute quantity. Our trends are similar to that observed by Reference Kolb, Torero, Most and JoulainKolb et al. (1997), Reference Tang, He and WenTang et al. (2019) and Reference Li, Hu and ShangLi et al. (2018). For the circular and the square pools, the drag length continues to increase with increased wind speed. However, the rectangle flame behaviour displays a different trend. For 20 m s $^{-1}$, the drag length does not increase significantly over 10 m s $^{-1}$. This would indicate that a critical wind speed has been reached, similar to what was seen in Reference Tang, He and WenTang et al. (2019) and Reference Li, Hu and ShangLi et al. (2018). Reference Tang, He and WenTang et al. (2019) noted that the critical velocity decreased as the aspect ratio increased, which echoes our results. Table 2 shows information for the flame lengths, angles and drag lengths for each of the pool shapes and crosswinds. The Froude number was also calculated for each pool and crosswind configuration, where the length scale, $D$, was taken to be the diameter for the circle and the length (in the $x$ direction) of the square and rectangle, and $u$ as the crosswind velocity. Reference Tang, He and WenTang et al. (2019) noted in their work that $Fr=2.5$ correlated with the critical wind speed that produced the maximum drag length. This agrees with our work; only the rectangular pool at 20 m s $^{-1}$ had a $Fr$ greater than 2.5.
Our observations as to how a pool fire of varying shape, i.e. circle, square, or high-aspect ratio rectangle, responds to a given crosswind can be informed by studying the phenomena in small-scale isothermal jet experiments, see for example Reference Haven and KurosakaHaven and Kurosaka (1997). In this isothermal jet configuration, the effect of shape on jet dynamics was identified where decreasing jet lift-off was found as jet shapes varied from circular, square and high-aspect rectangular. It was found that the induced vertical velocity component that originates from the jet shear layer vortex interaction at the inlet was much lower for a high-aspect rectangle as compared with a circle, thereby resulting in a far-field leeward trajectory that was closer to the bottom wall. Moreover, the existence of the double-decked structures of streamwise vorticity that either rotated in concert of the downstream jet column-vortex (termed the ‘steady’ vortex pair), or the ‘upper-deck’ structure that, depending on the specific jet geometry, can rotate at the same or opposite direction of the large-scale column vortex. By viewing the Favre-averaged vorticity in the  $x$ direction on the outlet plane (figure 3), we see similarities between the fire use case and the study of Reference Haven and KurosakaHaven and Kurosaka (1997). Here, the role of baroclinic torque that is highest at the pool drives large-scale vorticity and, therefore, its interaction near and around the pool drives the downstream dynamics.
For the quiescent use case, no vorticity on the back plane is expected. However, as the crosswind velocity increases, a strong counter-rotating vortex pair is evident as expected from jets in cross-flow (Reference MaheshMahesh, 2013). The circular pool's CVP is the highest vertical distance from the ground, while the rectangle's is the lowest. The trend is correlated with flame height, as the height is controlled by the interaction of the counter-rotating vortex pair and the crosswind and, where present, the increased horseshoe vortex structure in the rectangular pool that further drives the flame closer to the ground plane. At present, an upper-deck structure is not entirely clear to see, possibly due to dilatation of our reacting flow use case, or lack of resolution. Figure 5 demonstrates the interactions between the plume structure and the crosswind in more detail by showcasing information about the vertical velocity and temperature fields (results provided are for the most refined mesh, R2). For a pool fire in a quiescent flow (not shown) the  $y$ component of Favre velocity continues to increase until plume core collapse. Conversely, as the crosswind increases, the $y$ component of Favre velocity (the colouring on the planes) decreases, as the fire plume interacts the crosswind. The net effect is a plume that is pushed towards the ground plane. For the lower crosswinds, the $y$ component of velocity penetrates farther into the plume and at downstream locations, and the CVP structure, which is denoted by the isocontour at 350 K, is seen. As the crosswind reaches 20 m s $^{-1}$, the $y$ component of Favre velocity weakens considerably and is no longer able to penetrate vertically. This set of results also clearly shows the reduced vertical induction from the rectangular pool configuration relative to the square and circle. In general, the rectangular pool yields shorter flame heights. For the 20 m s $^{-1}$ configuration, the region of warm air is still very near to the ground, even as it exits the domain, for all pool shapes while the consistent trend of reduced vertical height for the rectangle, square and rectangle, respectively, is noted.
The Favre-averaged temperature contours and Favre-averaged velocity plots for all pool shapes and for three crosswind values: (a) 5 m s $^{-1}$; (b) 10 m s $^{-1}$; (c) 20 m s $^{-1}$. For each image, the first column shows an isometric projection of an isothermal contour at 350 K of the fire plume, as well as the location of three planes. The second column is the plane at 0 m from the centre of the pool; the third column is the plane at 35 m from the centre of the pool; the fourth column is the plane at 70 m from the centre of the pool. Each plane shows the $y$ component of velocity (colour map), the projection of the velocity on the $z$-plane (arrows) and a contour of 350 K (white lines). If no temperature contour appears on the slice, no temperature on the plane was over 350 K.

As noted in the introduction, a major motivator of our research is to better understand the effects of crosswind and pool shape on QoI such as radiative flux at ground level in-and-around the pool. In figure 6, the radiative flux predictions are provided at the ground plane in addition to contours of scalar dissipation, which can be viewed as a measure of fuel mixing, for the R2 mesh. The surface plot of radiative flux provides information about the location and intensity for each of the pool shapes and crosswinds and how they correlate with fuel mixing. A few trends become apparent immediately. First and foremost, for all pool shapes the quiescent flow demonstrates the lowest radiative flux. However, as a crosswind is introduced, the radiative flux magnitude drastically increases, as expected from the work of Reference Ju, Gollner, Wang, Tang, Zhao, Ren and YangJu et al. (2019). We also observe that as the crosswind increases, the location of the highest fluxes transitions from the leeward- to the windward-side of the pool. The pool shapes that capture sharp features drive localized high-values of peak radiative flux, especially at high crosswind magnitudes where winglet structures due to intense vertically oriented column vortex formation reside. Moving downwind from the pool, for the lower crosswinds, the radiative flux reduces, and then increases in magnitude, a trend that agrees with the observations of Reference Ju, Gollner, Wang, Tang, Zhao, Ren and YangJu et al. (2019). Figure 6 also provides an informal estimate of the gradients of  $\hat {\chi }$ by simply observing the distances between the three provided contours of scalar dissipation rate. As wind speeds increase, regions of high gradients in scalar dissipation rate are noted (within the flame envelope), while the radiative flux reduces in the wake zone where gradient of $\hat {\chi }$ are low, a region that also defines the vapour dome.
A matrix of the magnitude of the Favre-averaged radiative flux on ground with contour lines for the Favre-averaged scalar dissipation rate at  $1\times 10^{-2}$, $1\times 10^{-3}$ and $1\times 10^{-4}$ s $^{-1}$ at 1 mm above the ground. Results shown are for the R2 mesh. The rectangular and square pools generally have higher radiative fluxes, particularly as a crosswind is introduced. The location of the highest radiative heat flux transitions from the leeward side of the pool to the windward side.

In figure 7, the Favre-averaged subgrid-scale kinetic energy is presented for the R2 mesh configuration. While modelled turbulence levels are high on the leeward side, indicating substantial downstream hydrodynamic mixing effects, as there is not enough fuel in the middle of the wake region, combustion does not occur and therefore the heat flux remains low. We do see that along the edges of the wake zone that we have the conditions of a high subgrid-scale kinetic energy, as well as a high gradient of the scalar dissipation rate, leading to higher heat fluxes. This is particularly evident in the 20 m s $^{-1}$ cases for the square and the rectangle. In figure 6, we see ‘wings’ form on the leading edges of the wake that also correlates to areas of high modelled subgrid-scale kinetic energy in figure 7.
A matrix of the Favre-averaged subgrid-scale kinetic energy,  $\hat {k}_{SGS}$ for each pool shape and crosswind for the R2 mesh at one millimetre above the ground. A similar pattern is seen as with the heat flux (figure 6), where now the rectangular pools have higher modelled turbulence, and increases with crosswind.

Pool shape also plays a significant role in the radiative flux at the ground level. Once a crosswind is introduced, the square and the rectangular pools have higher radiative fluxes than the circular pool. For the square, this is due to the sharp corners of the pool increasing mixing. This can be seen very clearly at 20 m s $^{-1}$, as wings with high mixing and heat flux appear on the windward corners. The rectangular pool not only has the effect of the sharp corners, but the high aspect ratio of the pool induces a flow pattern that increases the size of the mixing zone at lower wind speeds (compared with the other pools shapes). This echoes the trends seen in drag length in figure 4. We also see the radiative wake of the of the rectangular pool decrease between wind velocities of 10 and 20 m s $^{-1}$. This supports the notion that a critical value of crosswind has been reached, and the flame is contracting back towards the pool.
4.1 Mesh resolution functionality
Domino, Hewson, et al. (Reference Domino, Hewson, Knaus and Hansen2021), demonstrated that utilizing under-resolved mesh resolutions for quiescent pool fires resulted in radiative heat fluxes that were higher than the simulations that exercised uniform mesh refinement. In the quiescent fire use case, the large-scale vortical structure originates from a baroclinic vorticity generation mechanism and is a size of  $O(D)$. Results in that study demonstrated that all mesh resolutions captured this general structure and predicted pool fire puffing. However, increased numerical diffusion that was found at the coarse meshes increased mixing and, therefore, combustion efficiency was numerically enhanced. From a safety perspective, this finding suggests that coarse mesh representations of fires in quiescent flows provide a conservative description of the fire environment.
As the set of accident scenarios moves towards realistic outside configurations where quiescent flow is not likely, we seek to understand the interaction between mesh resolution on crosswind magnitude. Table 3 provides the integrated flux over the area of the ground plane for each pool shape and crosswind combination for all mesh resolutions. Although the metric of interest for an accident fire scenario is a localized radiative heat flux, integrated quantities can be useful. We can see that for the quiescent condition, the finding of Domino, Hewson, et al. (Reference Domino, Hewson, Knaus and Hansen2021) is replicated, where we demonstrate that the coarse mesh overpredicts the integrated heat flux for all pool shapes. However, as the crosswind increases, this trend no longer remains true. Specifically, as the mesh resolution increases, a net increase in integrated radiative fluxes is predicted relative to the R0 mesh, except for in the case of the rectangular pool at 20 m s $^{-1}$. Figure 8(a) shows the representative effect of resolution for the rectangular 5 and 20 m s $^{-1}$ cases. Here we see that for the 5 m s $^{-1}$ case, the shape of the radiative flux is consistent across mesh resolutions, though the integrated flux nearly doubles from the R0 to R2 mesh. In the 20 m s $^{-1}$ case, the shape of the flux changes significantly as the mesh resolution increases. Figure 8(b) shows the Favre-averaged vorticity. We can see how the vortex pair is under-resolved, causing significant changes in the prediction of flame location and radiative heat flux. These trends occur at lower crosswind velocities for the rectangle, indicating that the sharp neighbouring features found in this shape drive smaller-scale structures. We stress that while the integrated radiative flux decreases over the ground plane, the intensity of the radiative flux increases in specific locations, such as on the leeward wing structures. Therefore, although the total integrated flux shows a departure from the trend, localized radiative flux over small scales substantially increase. Our results suggest that another refinement may be necessary for this specific case to ensure that the physics and conclusions provided are being properly captured.
(a) Magnitude of the Favre-averaged radiative flux on the ground for two crosswind velocities (5 and 20 m s $^{-1}$), and (b) vorticity on a cut plane 70 m from the centre of the rectangular pool for the same pool and crosswind velocities. The vorticity is shown in the direction normal to the plane, $+x$, where red is positive rotation and black is negative rotation. Here we see that the for both the vorticity and the radiative flux, the 5 m s $^{-1}$, the shape does not change significantly across mesh resolutions. The 20 m s $^{-1}$ shows a significant difference in the shape of the radiative flux across mesh resolutions.

The integrated flux over the area of the ground plane, in megawatts, for each pool shape and crosswind combination for each of the mesh resolutions.

The integrated flux is highest for the midrange velocities. For quiescent and low crosswinds, the integrated flux decreases with mesh resolution. As the crosswind increases, this trend flips, with the exception of the rectangular pool at a crosswind of 20 m s $^{-1}$.
In figure 9, we again see the effects that crosswind have on the R0 results. Like figure 4, figure 9 looks at the shape of the flame using the 723 to 773 K isotherm, but across resolution for the rectangular pool. While the flame height for the quiescent case is shorter in the R0 mesh, the difference between the three meshes is not substantial. However, the R0 mesh predicts significantly different locations for the flame when a crosswind is introduced, particularly at 10 and 20 m s $^{-1}$. Therefore, it is found that under-resolving the flow field for fire analysis in the presence of strong crosswind drives less conservative radiative flux prediction, thereby pushing mesh density and overall element counts larger than may be routinely afforded in routine thermal response studies. In absence of turbulence modelling improvements, the fire in crosswind use case represents a strong candidate for justification for computing resources in the extreme scale.
Isocontours of the Favre-averaged temperature for the rectangular pool at 723 and 773 K for the three refinements (a) R0, (b) R1 and (c) R2 – each showing the four crosswind conditions (0, 5, 10, 20 m s $^{-1}$). In the under-resolved case, the flame lengths are shorter, while when small-scale mixing is underpredicted, such as in the high cross-flow configuration, drag lengths are poorly predicted.

5. Conclusions
In this work we present a computational study where we investigate the effect of pool shape and crosswind velocity on a large-scale pool fire. Our modelling approach activates a high-fidelity, LES construct exercising an unsteady flamelet modelling approach for combustion. Three pool shapes are investigated (circle, square, rectangle), all with a surface area equal to that of a circle with a diameter of 10 m. Four crosswinds (0, 5, 10, 20 m s $^{-1}$) were investigated in concert with the pool shapes. Each combination of pool shape and crosswind velocity was run for three mesh resolutions, were the R2 minimum mesh edge length was 0.0425 m, the R1 was 0.085 m, and the R0 was 0.17 m. The main results of our study can be distilled into the following set of points.
• Our large-scale pool fire simulations agree well with analytical height predictions and observations from other researchers.
• We observe that although fires are low momentum ratio configurations, baroclinic torque drives the large-scale vortical structures in lieu of traditional jet shear layers found in high-speed jets. Induced vertical velocity, which is greatest for the circular pool and lowest for the rectangular pool, strongly influences flame length and flame drag length, in addition to prevailing leeward plume long-range trajectories.
• The radiative heat flux to the ground is sensitive to both the pool shape and the crosswind velocity. As crosswind velocity increases, so too does the radiative heat flux. The location of the peak radiative heat fluxes transitions from the leeward to windward side of the pool and are well correlated to scalar dissipation rate. For the square and the rectangular pools, the sharp corners also promote mixing, and thus they have higher heat fluxes than the circle, once a crosswind is introduced.
• As the mesh is further refined, we note that large-scale vortical structures in and around the fire are captured and that on the most coarse mesh resolution, these features are absent. Since these structures play an important role in flame shape, under-resolving this flame feature changed the predicted shape of the flame, as well as the radiative flux to the bottom surface. In the quiescent configuration, the least-resolved mesh predicts a higher radiative heat flux, where as once a crosswind is introduced, the opposite is true. This finding has substantial impact on fire analysis for important use cases in that high mesh resolution, and therefore increased computational time, is expected to obtain a converged peak radiative flux environment.
The next series of fire simulations will activate fuels that are more likely to be used in ground and aviation transport, e.g. JP-8, and will incorporate the soot modelling approach recently presented in Domino, Hewson, et al. (Reference Domino, Hewson, Knaus and Hansen2021) to yield realistic radiative and convective loads in the presence of smoke shielding. Future research paths will also include prescribing realistic crosswind inflow conditions that are based on precursor atmospheric boundary layer simulations. Sweeping and ejection events that occur in a turbulent boundary layer are expected to strongly affect localized mixing and support intermittent, high radiative flux events. Moreover, streaks that vary in streamwise and spanwise size are expected to complicate the crosswind/fire coupling scenario and add to flame quenching events that lead to smoke shielding. Incorporation of improved pool modelling approaches that can allow for the fuel burn rate to be a function of crosswind are planned, thereby allowing for a coupling between localized pool heating loads and pool devolatilization. Finally, we plan on establishing mesh resolution requirements for our outlined QoI via the deployment of a one or more additional levels of uniform mesh refinement.
Acknowledgements
The authors would like to thank Sandia National Laboratories staff F. Pierce and A. Luketa for their suggestions on this manuscript, and J. Hewson for technical discussions on the fire in crosswind use case.
Funding Statement
Funding for this work was provided by the Advanced Simulations and Computing (ASC) programme. This article has been authored by an employee of National Technology & Engineering Solutions of Sandia, LLC under contract no. DE-NA0003525 with the US Department of Energy (DOE). The employee owns all right, title and interest in and to the article and is solely responsible for its contents. The US Government retains and the publisher, by accepting the article for publication, acknowledges that the US Government retains a non-exclusive, paid-up, irrevocable, world-wide license to publish or reproduce the published form of this article or allow others to do so, for US Government purposes. The DOE will provide public access to these results of federally sponsored research in accordance with the DOE Public Access Plan https://www.energy.gov/downloads/doe-public-access-plan.
Declaration of Interests
The authors declare no conflict of interest.
Author Contributions
S.N.S. and S.P.D. created the project plan and scope of cases to be investigated. S.P.D. formulated the equations sets to be solved and created the input deck. S.N.S. lead the mesh creation, running the simulations and post-processing data, with S.P.D.'s guidance and input. S.P.D. and S.N.S. wrote the manuscript.
Data Availability Statement
Data is provided within the paper. For specific requests, please contact the corresponding author (S.P.D.).
Ethical Standards
The research meets all ethical guidelines, including adherence to the legal requirements of the study country.


 Open access