


I. INTRODUCTION
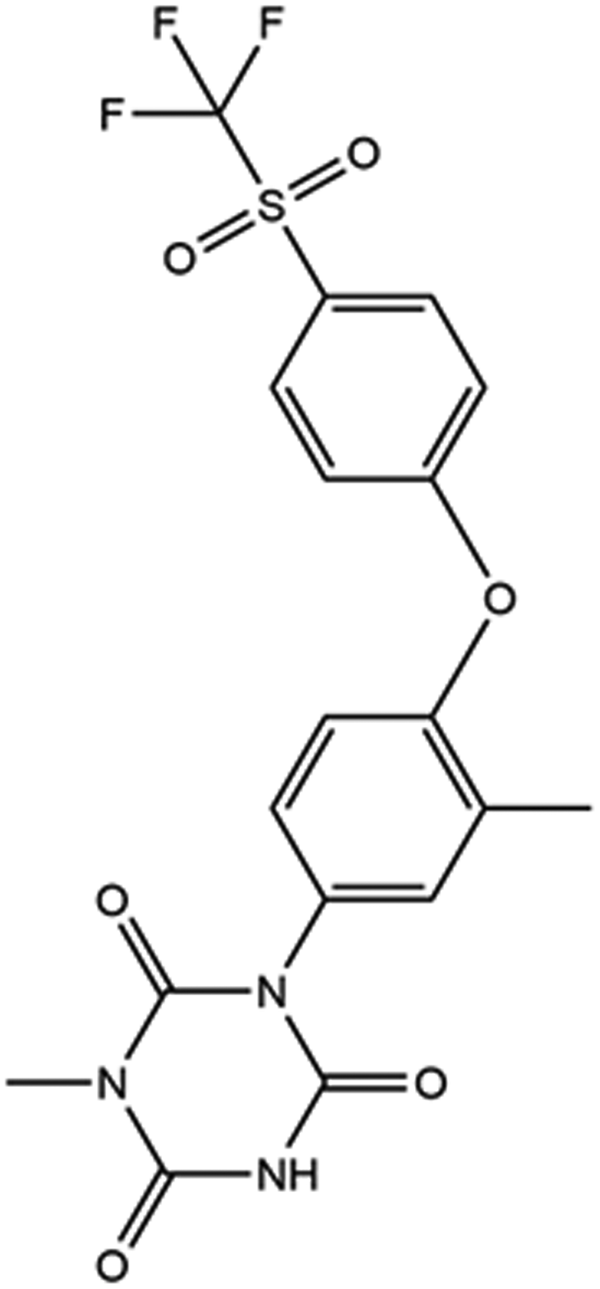
Ponazuril (sold under the brand names Toltrazuril sulfone®, Marquis®, and Ponalrestat®) is an antiprotozoal medication used to treat equine protozoal myeloencephalitis (EPM). While it is labeled for use in horses, it is also used in cats, dogs, rabbits, birds, and reptiles to treat coccidiosis due to protozoal parasites. The systematic name (CAS Registry No. 69004-04-2) is 1-methyl-3-[3-methyl-4-[4-(trifluoromethylsulfonyl)phenoxy]phenyl]-1,3,5-triazinane-2,4,6-trione. A two-dimensional molecular diagram is shown in Figure 1.
The 2D molecular structure of ponazuril.
A powder pattern of crystalline ponazuril has been reported by Li et al. (Reference Li, Wang, Feng, Yuan, Xu, Jiang, Xiao and Lu2022), in the context of a study of preparation of co-amorphous formulations of toltrazuril and ponazuril, but no crystal structure of ponazuril was reported.
This work was carried out as part of a project (Kaduk et al., Reference Kaduk, Crowder, Zhong, Fawcett and Suchomel2014) to determine the crystal structures of large-volume commercial pharmaceuticals, and include high-quality powder diffraction data for them in the Powder Diffraction File (Gates-Rector and Blanton, Reference Gates-Rector and Blanton2019).
II. EXPERIMENTAL
Ponazuril was a commercial reagent, purchased from TargetMol (Lot #131432), and was used as-received. The white powder was packed into a 1.5 mm diameter Kapton capillary and rotated during the measurement at ~50 Hz. The powder pattern was measured at 295 K at beamline 11-BM (Antao et al., Reference Antao, Hassan, Wang, Lee and Toby2008; Lee et al., Reference Lee, Shu, Ramanathan, Preissner, Wang, Beno, Von Dreele, Ribaud, Kurtz, Antao, Jiao and Toby2008; Wang et al., Reference Wang, Toby, Lee, Ribaud, Antao, Kurtz, Ramanathan, Von Dreele and Beno2008) of the Advanced Photon Source at Argonne National Laboratory using a wavelength of 0.458208(2) Å from 0.5 to 50° 2θ with a step size of 0.0009984375 and a counting time of 0.1 s per step. The high-resolution powder diffraction data were collected using twelve silicon crystal analyzers that allow for high angular resolution, high precision, and accurate peak positions. A mixture of silicon (NIST SRM 640c) and alumina (SRM 676a) standards (ratio Al2O3:Si = 2:1 by weight) was used to calibrate the instrument and refine the monochromatic wavelength used in the experiment.
The pattern was indexed using JADE Pro (MDI, 2022) and N-TREOR (Altomare et al., Reference Altomare, Cuocci, Giacovazzo, Moliterni, Rizzi, Corriero and Falcicchio2013) on a primitive monoclinic cell with a = 8.50462, b = 12.39817, c = 18.85480 Å, β = 96.72°, V = 1974.41 Å3, and Z = 4. A reduced cell search in the Cambridge Structural Database (Groom et al., Reference Groom, Bruno, Lightfoot and Ward2016) yielded 16 hits, but no structures of ponazuril derivatives. The suggested space group was P21/c, which was confirmed by successful solution and refinement of the structure. A diclazuril molecule was downloaded from PubChem (Kim et al., Reference Kim, Chen, Cheng, Gindulyte, He, He, Li, Shoemaker, Thiessen, Yu, Zaslavsky, Zhang and Bolton2019) as Conformer3D_CID_3050408.sdf. It was converted to a *.mol2 file using Mercury (Macrae et al., Reference Macrae, Sovago, Cottrell, Galek, McCabe, Pidcock, Platings, Shields, Stevens, Towler and Wood2020). The structure was solved by Monte Carlo simulated annealing as implemented in EXPO2014 (Altomare et al., Reference Altomare, Cuocci, Giacovazzo, Moliterni, Rizzi, Corriero and Falcicchio2013).
Rietveld refinement was carried out using GSAS-II (Toby and Von Dreele, Reference Toby and Von Dreele2013). Only the 2.0–27.0° portion of the pattern was included in the refinement (d min = 0.981 Å). All non-H bond distances and angles were subjected to restraints, based on a Mercury/Mogul Geometry Check (Bruno et al., Reference Bruno, Cole, Kessler, Luo, Motherwell, Purkis, Smith, Taylor, Cooper, Harris and Orpen2004; Sykes et al., Reference Sykes, McCabe, Allen, Battle, Bruno and Wood2011). The Mogul average and standard deviation for each quantity were used as the restraint parameters. The restraints contributed 4.0% to the final χ 2. The hydrogen atoms were included in calculated positions, which were recalculated during the refinement using Materials Studio (Dassault, 2021). The U iso of the heavy atoms were grouped by chemical similarity. The U iso for the H atoms were fixed at 1.2× the U iso of the heavy atoms to which they are attached. A second-order spherical harmonic preferred orientation model was included in the refinement. The refined texture index was 1.007(0). The peak profiles were described using the generalized microstrain model. The background was modeled using a 6-term shifted Chebyshev polynomial, and a peak at 5.72° 2θ to model the scattering from the Kapton capillary and any amorphous component.
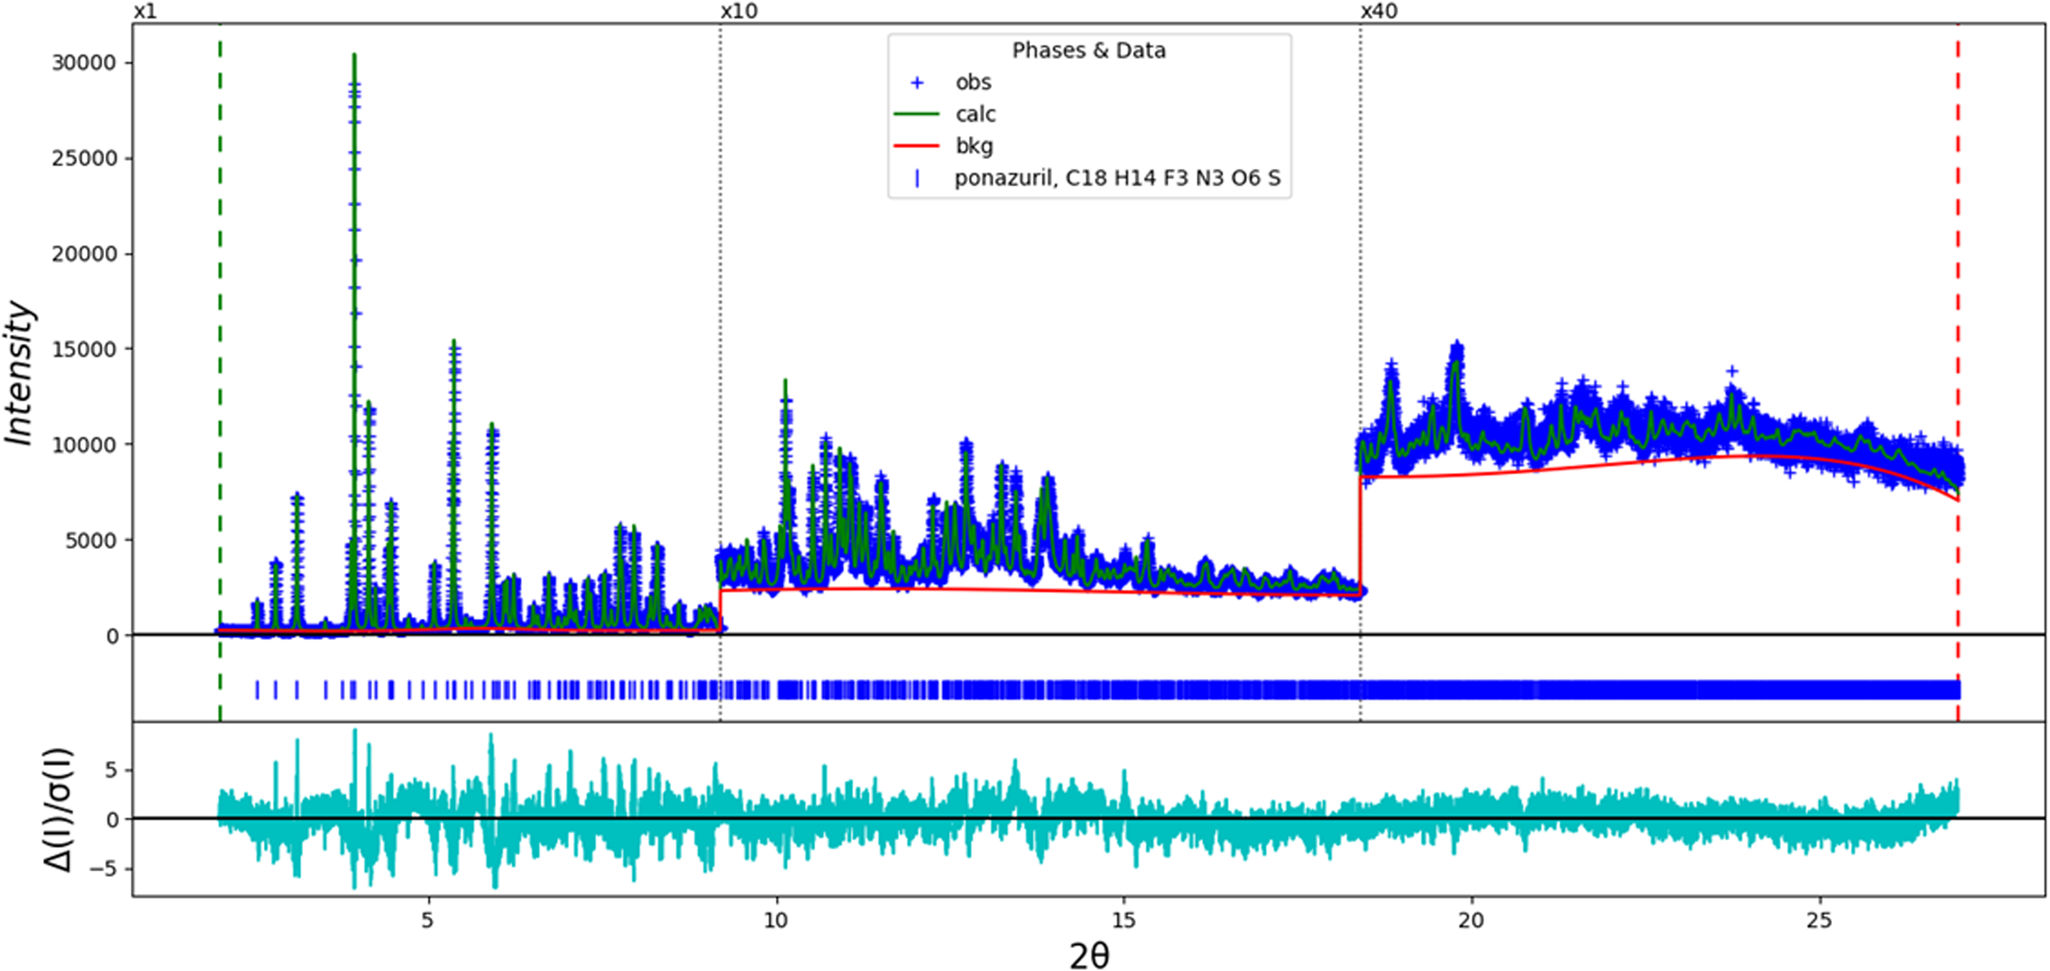
The final refinement of 121 variables using 25 040 observations and 84 restraints yielded the residuals R wp = 0.0662 and GOF = 1.49. The largest peak (1.11 Å from F4) and hole (1.14 Å from O8) in the difference Fourier map were 0.32(8) and −0.32(8) eÅ−3, respectively. The largest errors in the difference plot (Figure 2) are in the shapes of some of the strong low-angle peaks.
The Rietveld plot for the refinement of ponazuril. The blue crosses represent the observed data points, and the green line is the calculated pattern. The cyan curve is the normalized error plot. The vertical scale has been multiplied by a factor of 10× for 2θ > 9.2°, and by a factor of 40× for 2θ > 18.4°. The row of blue tick marks indicates the calculated reflection positions.
The crystal structure was optimized using density functional techniques as implemented in VASP (Kresse and Furthmüller, Reference Kresse and Furthmüller1996) (fixed experimental unit cell) through the MedeA graphical interface (Materials Design, 2016). The calculation was carried out on 16 2.4 GHz processors (each with 4 GB RAM) of a 64-processor HP Proliant DL580 Generation 7 Linux cluster at North Central College. The calculation used the GGA-PBE functional, a plane wave cutoff energy of 400.0 eV, and a k-point spacing of 0.5 Å−1 leading to a 2 × 2 × 1 mesh, and took ~28.5 h. A single-point density functional calculation (fixed experimental cell) and population analysis were carried out using CRYSTAL17 (Dovesi et al., Reference Dovesi, Erba, Orlando, Zicovich-Wilson, Civalleri, Maschio, Rerat, Casassa, Baima Salustro and Kirtman2018). The basis sets for the H, C, N, and O atoms in the calculation were those of Gatti et al. (Reference Gatti, Saunders and Roetti1994), and those for F and Cl were those of Peintinger et al. (Reference Peintinger, Vilela Oliveira and Bredow2013). The calculations were run on a 3.5 GHz PC using 8 k-points and the B3LYP functional, and took ~2.8 h.
III. RESULTS AND DISCUSSION
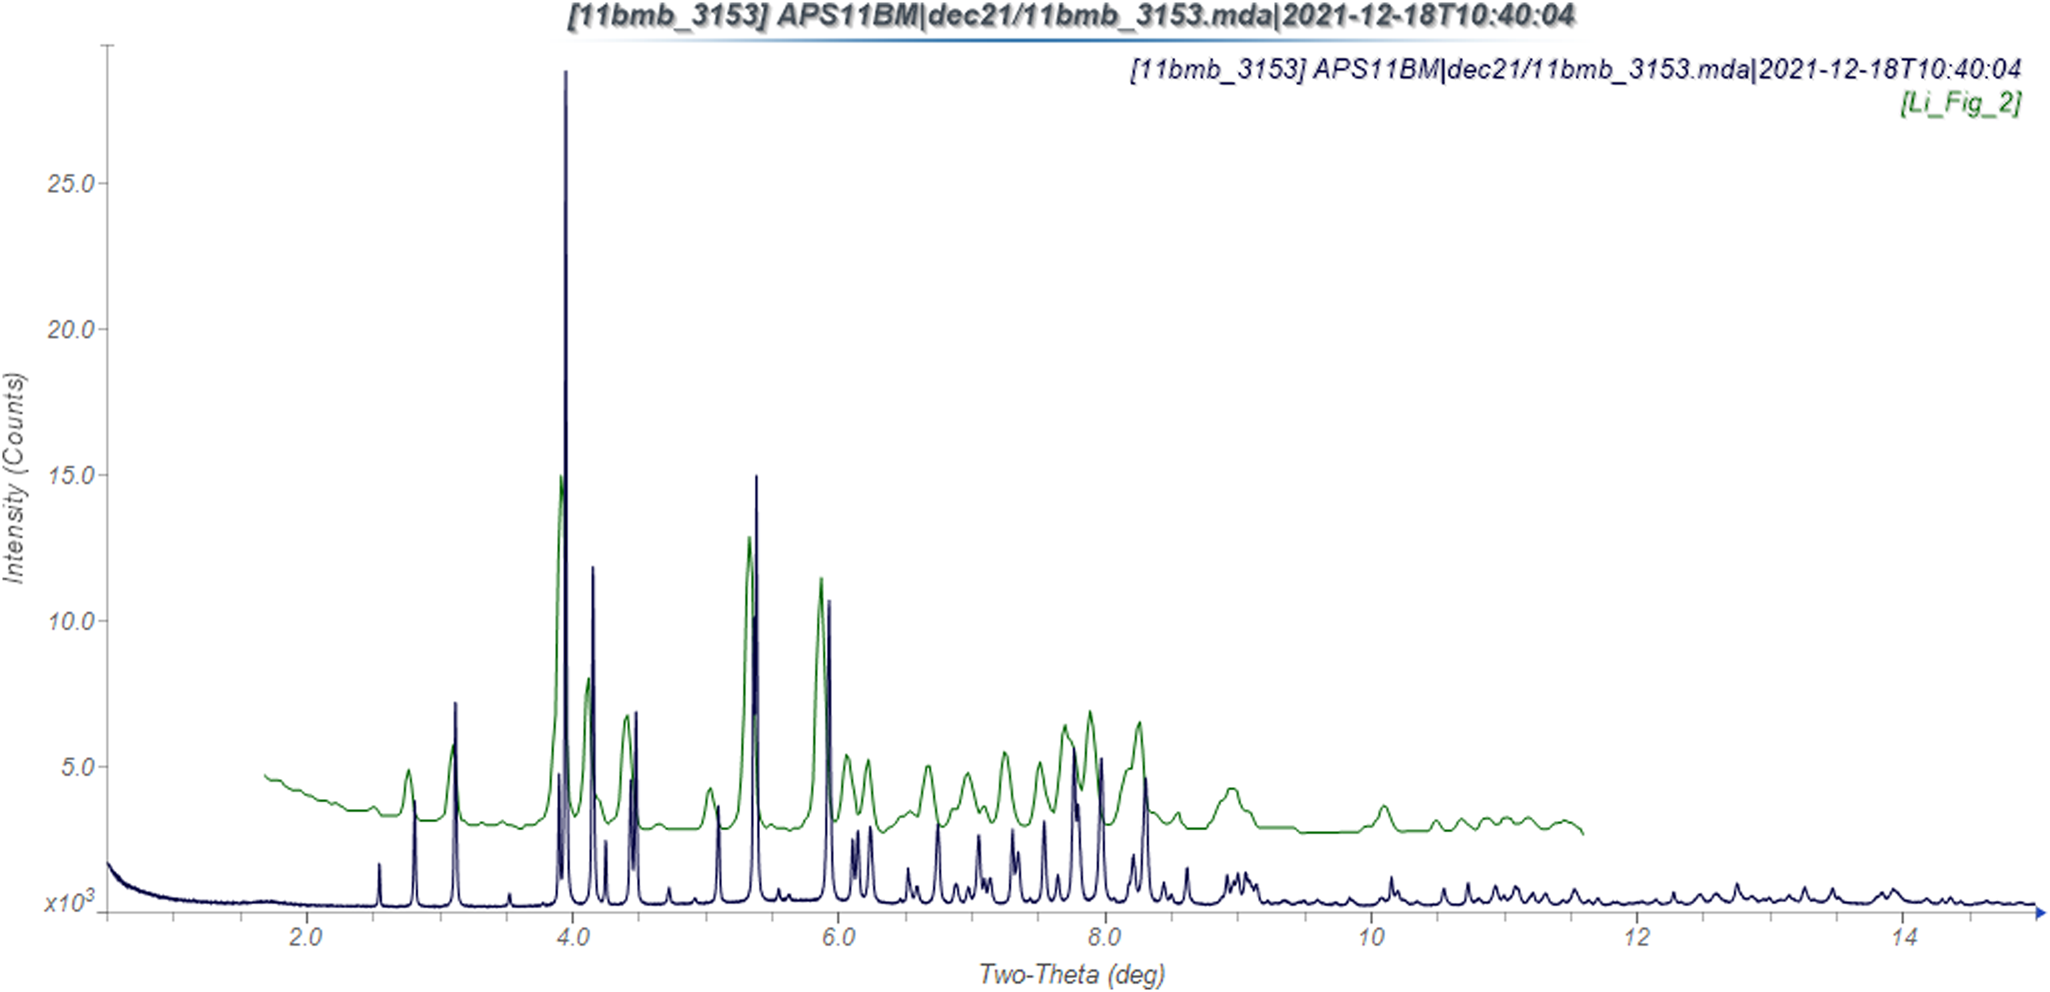
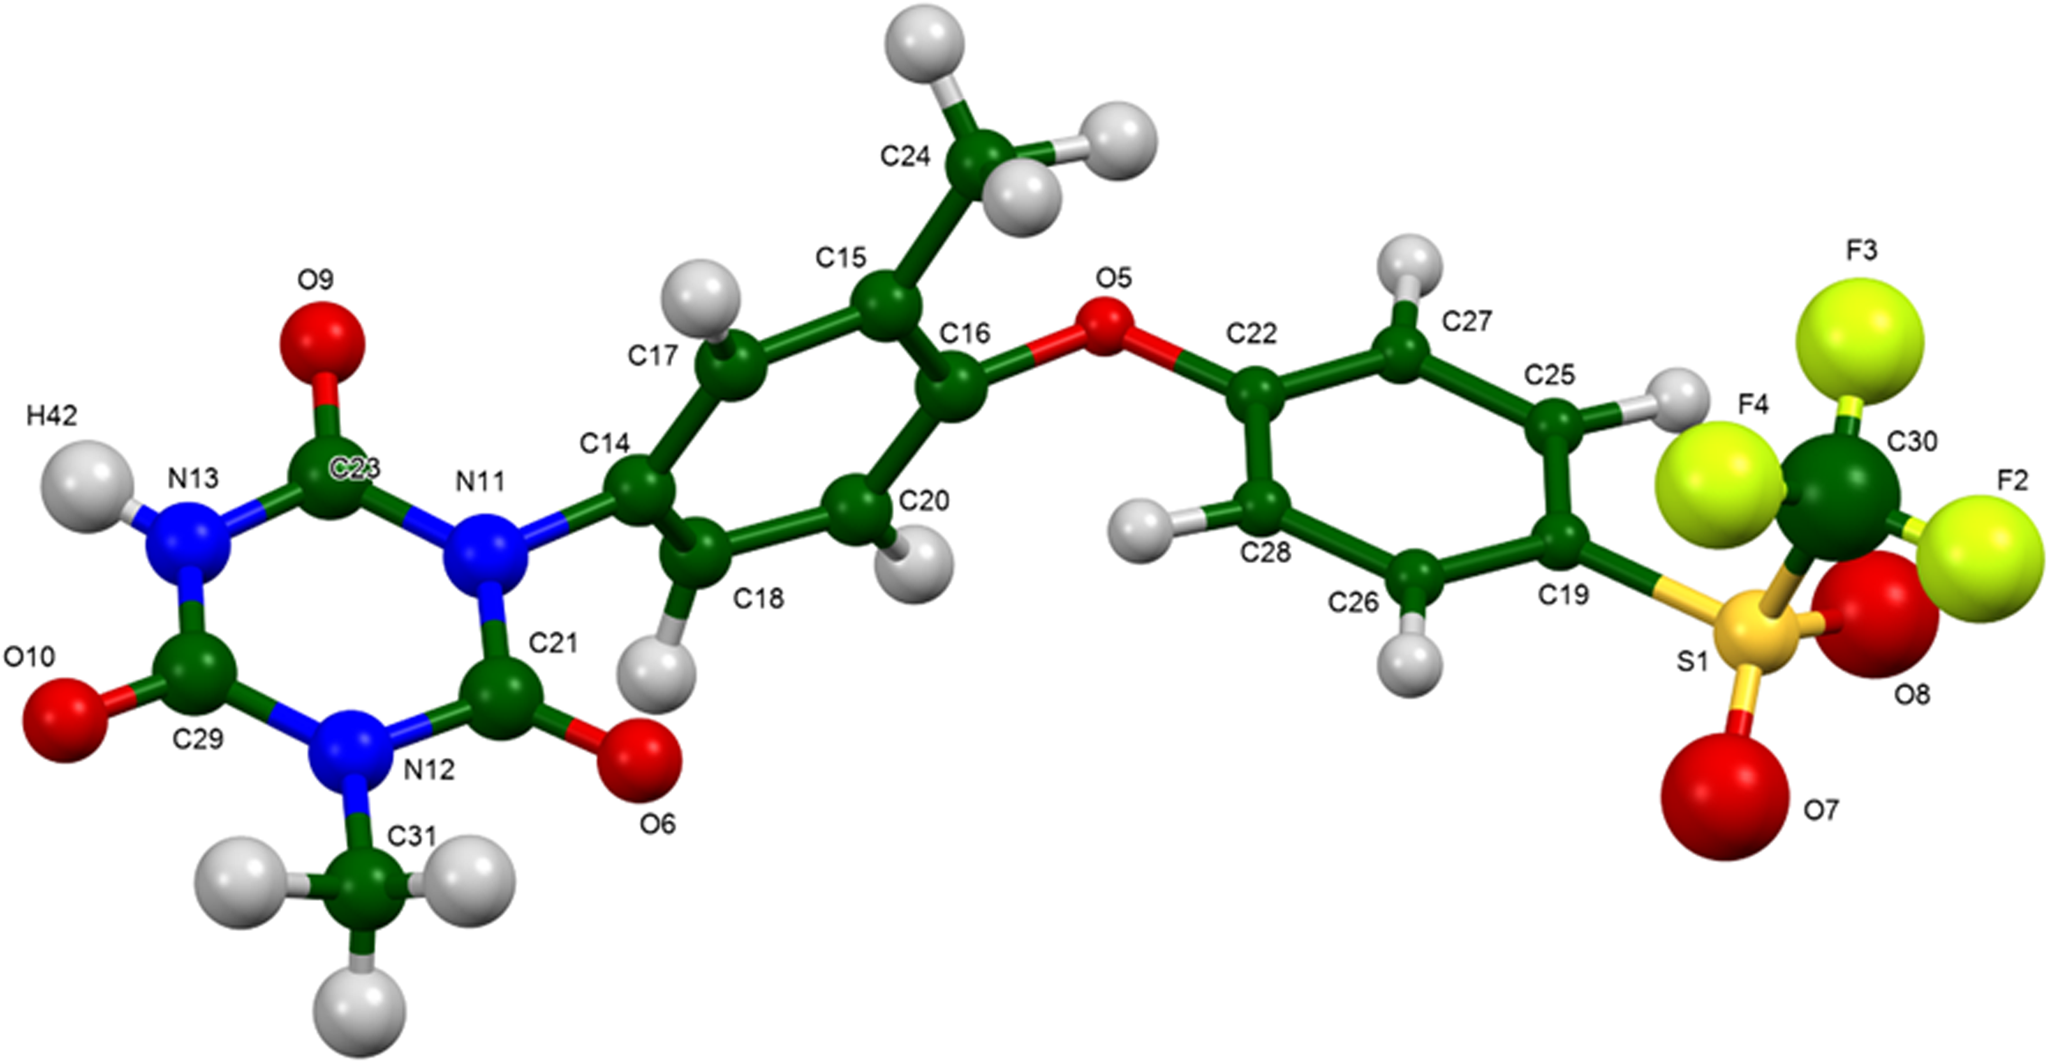
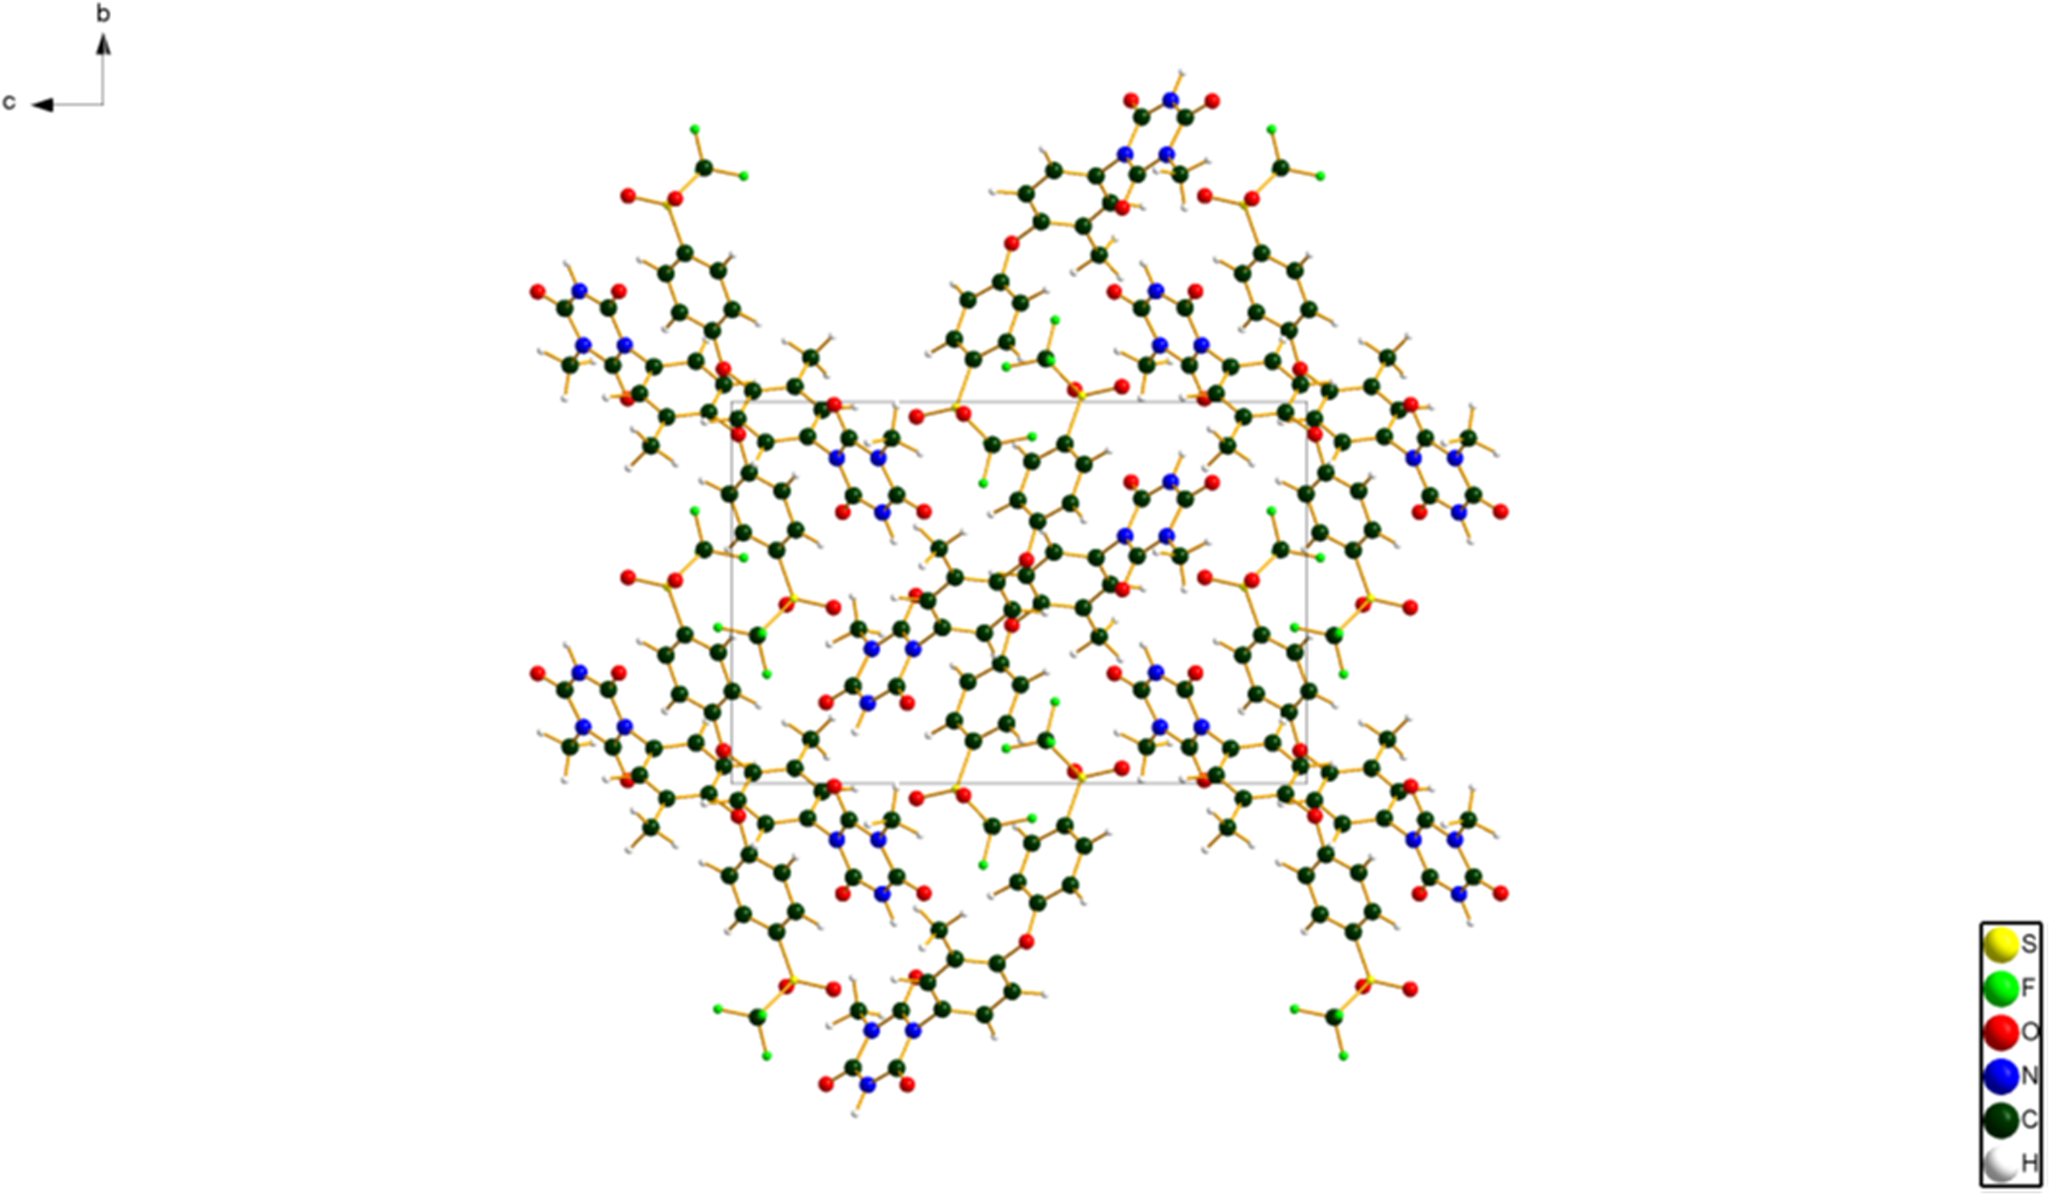
The synchrotron powder pattern of this study matches the pattern measured by Li et al. (Reference Li, Wang, Feng, Yuan, Xu, Jiang, Xiao and Lu2022) well enough to conclude that they represent the same material, and that our sample is representative (Figure 3). The root-mean-square (rms) Cartesian displacement between the Rietveld-refined and DFT-optimized structures of ponazuril is 0.066 Å (Figure 4). The excellent agreement provides strong evidence that the refined structure is correct (van de Streek and Neumann, Reference van de Streek and Neumann2014). This discussion concentrates on the DFT-optimized structure. The asymmetric unit (with atom numbering) is illustrated in Figure 5. The best view of the crystal structure is down the a-axis (Figure 6). The crystal structure consists of normally packed molecules with hydrogen bonds parallel to the a-axis.
Comparison of the synchrotron pattern from this study of ponazuril (black) to that reported by Li et al. (Reference Li, Wang, Feng, Yuan, Xu, Jiang, Xiao and Lu2022; green). The literature pattern, measured using Cu Kα radiation, was digitized using UN-SCAN-IT (Silk Scientific, 2013), and converted to the synchrotron wavelength of 0.458208 Å using JADE Pro (MDI, 2022). Image generated using JADE Pro (MDI, 2022).
Comparison of the Rietveld-refined (red) and VASP-optimized (blue) structures of ponazuril. The rms Cartesian displacement is 0.066 Å. Image generated using Mercury (Macrae et al., Reference Macrae, Sovago, Cottrell, Galek, McCabe, Pidcock, Platings, Shields, Stevens, Towler and Wood2020).

The asymmetric unit of ponazuril, with the atom numbering. The atoms are represented by 50% probability spheroids. Image generated using Mercury (Macrae et al., Reference Macrae, Sovago, Cottrell, Galek, McCabe, Pidcock, Platings, Shields, Stevens, Towler and Wood2020).
The crystal structure of ponazuril, viewed down the a-axis. Image generated using Diamond (Crystal Impact, 2022).
All of the bond distances, bond angles, and torsion angles fall within the normal ranges indicated by a Mercury/Mogul Geometry Check (Macrae et al., Reference Macrae, Sovago, Cottrell, Galek, McCabe, Pidcock, Platings, Shields, Stevens, Towler and Wood2020). Quantum chemical geometry optimization of the ponazuril molecule (DFT/B3LYP/6-31G*/water) using Spartan ‘18 (Wavefunction, 2020) indicated that the observed conformation is in a local minimum. A conformational analysis (MMFF force field) indicates that the minimum-energy conformation is only 0.1 kcal mol−1 lower in energy, but has a very different conformation (Figure 7). The molecule is thus apparently flexible, and intermolecular interactions are important in determining the solid-state conformation.
Comparison of the observed solid-state conformation of ponazuril (blue) to the minimum-energy conformation of an isolated molecule (green). Image generated using Mercury (Macrae et al., Reference Macrae, Sovago, Cottrell, Galek, McCabe, Pidcock, Platings, Shields, Stevens, Towler and Wood2020).

Analysis of the contributions to the total crystal energy of the structure using the Forcite module of Materials Studio (Dassault, 2021) suggests that the intramolecular deformation energy is dominated by angle and torsion distortion terms. The intermolecular energy is dominated by electrostatic attractions, which in this force field analysis include hydrogen bonds. The hydrogen bonds are better analyzed using the results of the DFT calculation.
There is only one classical hydrogen bond in the structure, N13–H42⋯O6 (Table I). This interaction between NH and carbonyl groups results in chains along the a-axis, with a graph set C1,1(6) (Etter, Reference Etter1990; Bernstein et al., Reference Bernstein, Davis, Shimoni and Chang1995; Shields et al., Reference Shields, Raithby, Allen and Motherwell2000). By the correlation of Wheatley and Kaduk (Reference Wheatley and Kaduk2019), this hydrogen bond has an energy of 5.2 kcal mol−1. Several C–H⋯O hydrogen bonds also contribute to the lattice energy.
Hydrogen bonds (CRYSTAL17) in ponazuril
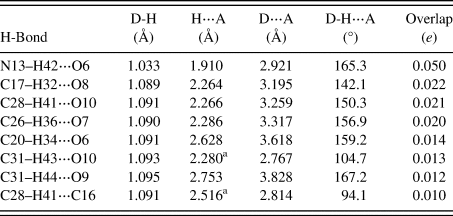
a Intramolecular.
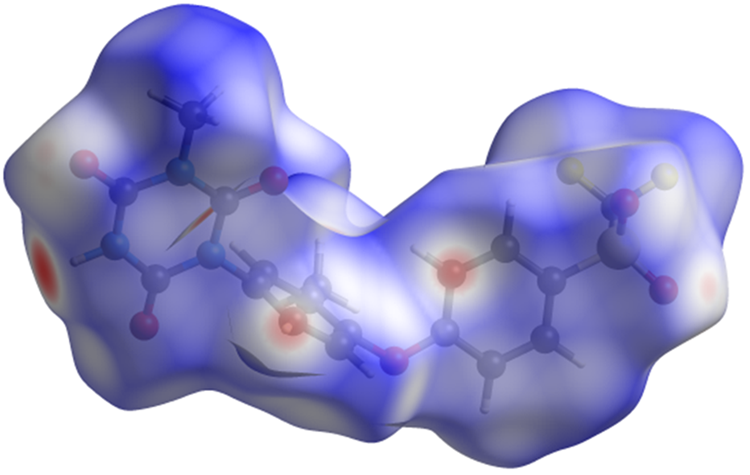
The volume enclosed by the Hirshfeld surface of ponazuril (Figure 8, Hirshfeld, Reference Hirshfeld1977; Turner et al., Reference Turner, McKinnon, Wolff, Grimwood, Spackman, Jayatilaka and Spackman2017) is 484.29 Å3, 98.37% of 1/4 the unit cell volume. The packing density is thus fairly typical. The only significant-close contacts (red in Figure 8) involve the hydrogen bonds, and a short C–H⋯ring distance. The volume/non-hydrogen atom is smaller than usual at 15.9 Å3.
The Hirshfeld surface of ponazuril. Intermolecular contacts longer than the sums of the van der Waals radii are colored blue, and contacts shorter than the sums of the radii are colored red. Contacts equal to the sums of radii are white. Image generated using CrystalExplorer (Turner et al., Reference Turner, McKinnon, Wolff, Grimwood, Spackman, Jayatilaka and Spackman2017).
The Bravais–Friedel–Donnay–Harker (Bravais, Reference Bravais1866; Friedel, Reference Friedel1907; Donnay and Harker, Reference Donnay and Harker1937) morphology suggests that we might expect blocky morphology for ponazuril. A second-order spherical harmonic preferred orientation model was included in the refinement. The texture index was 1.007(0), indicating that preferred orientation was not significant for this rotated capillary specimen.
IV. DEPOSITED DATA
The Crystallographic Information Framework (CIF) files containing the results of the Rietveld refinement (including the raw data) and the DFT geometry optimization were deposited with the ICDD. The data can be requested at pdj@icdd.com.
ACKNOWLEDGEMENTS
The use of the Advanced Photon Source at Argonne National Laboratory was supported by the U.S. Department of Energy, Office of Science, Office of Basic Energy Sciences, under Contract No. DE-AC02-06CH11357. This work was partially supported by the International Centre for Diffraction Data. We thank Lynn Ribaud and Saul Lapidus for their assistance in the data collection.
CONFLICT OF INTEREST
The authors have no conflict of interest to declare.


 Open access