

1. Introduction
Progress in snow research and more powerful computer facilities have made ii possible to simulate the main features of the snowpack and the corresponding avalanche activity. Based on three individual models (SAFRAN. Crocus, MÉPRA; see below . we have built an automatic system, hereafter called the SCM chain. The only inputs to this chain are daily meteorological observations, output from numerical meteorological models and precipitation climatologies. No snowpack information is entered into the system. The main assumption of this system is the spatial homogeneity of the massifs invoked especially for precipitation;, which implies a corresponding working scale and excludes representing all the local effects such as those due to accumulation and erosion by wind. As outputs, the chain simulates an average snow mantle, described by its stratigraphy, on different elevations and aspects for 23 massifs in the French Alps and 15 massifs in the Pyrenees (France and Spain) (surface area of each massif about 500 km2). It also simulates the corresponding avalanche risks. Since winter 1992–93, this set of models has been used operationally by French Alps avalanche forecasters, and since 1995–96 in the Pyrenees. At the same time it has been developed and improved both by contact with the different users and by comparison with different sets of human observations. Some of these studies will be presented here:
comparisons of snow depths and simulated stratigraphy with measurements throughout the winter;
comparisons of simulated snow-temperature gradients with measurements on numerous sites;
comparisons of observed avalanche activity with simulated avalanche risks.
The SCM chain is also being used in research in hydrology (Reference Braun, Brun, Durand, Martin and TourasseBraun and others, 1994) and on the sensitivity of the snow cover to climate change (Reference Martin, Brun and DurandMartin and others, 1994). All these studies have contributed greatly to its development.
This paper investigates the global possibilities of this integrated computer-based system, its limitations and weaknesses, and how it is used operationally as a helpful tool by French avalanche forecasters.
2. Background
In Alpine and Pyrenean regions, increased frequenting of the mountains has brought a need for greater security. Avalanches kill people every year, mostly mountaineering skiers and alpine off-track skiers, and cause damage to roads and vehicles. Preventative measures have been dev eloped in order to minimise avalanche casualties. Following the example of the Weissfluhjoch Institute, Switzerland, the French Snow Research Centre (Centre d’Études de la Neige (CEN) was created at Grenoble in 1959 under the French Meteorological Office. It was Charged with setting up an avalanche-forecasting system and conducting research and development in that field. Until 1984, the CEN produced avalanche reports. Since 1984 daily reports have been produced by meteorological centres located in the French Alps and Pyrenees Paliaut and others, 1991), under a new system (based on the French departmental administration) which aims to provide more detailed information. The different local centres use different models developed by the CEN, which now devotes most of its activity to the research and development of methods and tools to aid avalanche forecasters. The CEN has developed an automatic chain to simulate snow-cover stratigraphy and corresponding avalanche risk for operational avalanche forecasting, which forms the subject of this paper.
3. State of the art in avalanche-forecasting tools
Since the 1970s, different avalanche-forecasting models have been developed and used by various snow and avalanche research centres. Statistical methods using discriminant analysis and nearest neighbours have been the most popular approaches (Reference BoisBois and others, 1975; Reference Buser, Butler and GoodBuser and others, 1987), although generally they do not deal explicitly with physical snow processes. Operational systems based on nearest-neighbour methods are used by avalanche forecasters in several countries, but their results are highly dependent on the available archive data, and unusual situations are often poorly reconstructed. The most common limitation is that the criteria for searching analogous situations generally use meteorological data rather than the internal state of the snowpack (stratigraphy and physical parameters of the different snow layers). The discriminant analysis method is more difficult for the local forecaster to interpret (less “sensible” approach). The discriminating capacity of the function used must be well studied to obtain the best skill score in a stable way throughout the period of use. Generally speaking, statistical approaches are efficient tools, but their simplicity needs careful tuning and a long calibration series. These methods are thus best at forecasting natural fresh-snow avalanches, rather than slab avalanches triggered by skiers. As pointed out by Reference Bader and Salm.Bader and Salm (1990) and Schweicr (1993], statistical methods cannot identify the presence of weak layers which arc of prime importance for the release of slab avalanches. Even if information on the vertical structure of the snowpack were available at a given time [ typically once a week from a snow pit), such models would not be able to provide continuous and realistic time evolution of the characteristics of the different snow layers. These models use local measurements as a main source of input data and thus have difficulty taking into account the variability of the snowpack stability due to elevation and slope aspects.
Numerical models have also, been developed to simulate snow-cover processes (Reference ColbeckColbeck, 1973; Reference NavarreNavarre, 1975; Reference Obled and RosséObled and Rossé, 1975; Reference AndersonAnderson, 1976). These physically based models simulate the evolution of the snow cover depending on the weather conditions. They include a representation of the principal phenomena affecting the energy and mass balance of the snowpack. A new generation of these one-dimensional models has added more physical processes to the snowpack simulation and to the snow/atmosphere interface. These include snow metamorphism and absorption of solar radiation. These processes can be modelled in various ways. The SNOTHERM model (Reference JordanJordan, 1991) calculates crystal-growth rates using thermodynamics, while the Crocus model (Reference Brun, Martin, Simon, Gendre and ColeouBrun and others, 1989, Reference Brun, David, Sudul and Brunot1992) calculates the evolution of both crystal size and shape in connection with the international snow-crystal classification (Reference ColbeckColbeck and others, 1990). A first attempt at using these models for avalanchc forecasting was made in France in 1988, based on a preliminary version of Crocus (Reference Brun, Martin, Simon, Gendre and ColeouBrun and others, 1989). This model required manual input of the observed or forecast meteorological variables necessary for the forecasters to calculate the evolution of the snow cover at given locations. This requirement limited the number of possible simulations to approximately five locations, which was too few to calculate the evolution of the snow cover at various elevations and For different slope aspects. It was therefore decided to develop the automatic suite of models described in this paper.
Another avalanche-forecasting method is based on expert systems, a popular approach in the 1980s. The initial objective of such models was to reproduce expert human reasoning in a particular field (Reference Giraud, Lafeuille and PahautGiraud and others, 1987). Most systems use production rules organised in bases; some examples of these rule bases can be found in Lafcuille and others (1987). Recently, hybrid expert systems have been developed by coupling expert systems with statistical models (Reference BolognesiBolognesi, 1994; Reference SchweizerSchweizer and Föhn, 1994; Reference Weir and MeClungWeir and MeClung, 1994) or with neural networks (Reference SchweizerSchweizer and others, 1994).
4. SAFRAN/Crocus/MÉPRA models
Local snowpack stability is strongly influenced by microtopography (e.g. several tens of meters), especially because of the high spatial variability of snow cover due to wind drift. However, avalanche forecasting is possible at a larger scale because the snowpacks of a given region present similar features at similar elevations on slopes of similar aspect. This is particularly the ease for the presence of weak layers and for the occurrence of processes like melting and refreezing.
Since the evolution of a snowpack is controlled by the prevailing local meteorological conditions, we can make the following assumption: it is possible, for a set of elevations and aspects, to simulate the evolution of the main characteristics of the snowpack in a given region from the average meteorological conditions prevailing in that region.
To achieve this, it is first necessary to calculate the prevailing meteorological conditions as a function of different elevations and slope aspects. As we do not have observed data for each elevation and aspect, we developed a meteorological analysis model, SAFRAN (Système d’Analyse Fournissant des Renseignements Atmosphériques à la Ncige), to compute the relevant meteorological variables from all the meteorological information available in and around the region considered. The outputs of SAFRAN are then used by the snow model Crocus to calculate the corresponding evolution of the snowpack. In a third stage, the expert system MÉPRA is used to diagnose the snowpack stability at each elevation and aspect from the internal state calculated by Crocus.
Due to the density of the composite observation network in the French Alps and Pyrenees, and for practical reasons, we decided to consider regions of about 500 km2 , called massifs (Fig 1a and b). and to run the models on elevations of 600–3600 m a.s.l separated by 300 m steps, on the aspects north, east, southeast, south, southwest and west with slope angles of 20° and 40°. Figure 2 displays the architecture of the three models, details of which are given below.
SAFRAN
SAFRAN (Reference Durand, Brun, Mérindol, Guyomarc’h, Lesaffre and MartinDurand and others, 1993) is a meteorological application. It performs a spatialisation (hereafter “analysis”) of the observed weather data available over the considered elevations and aspect of the different massifs. The sources of these data are the automatic observation network at different elevations; the French Snow/Weather network; temporary observation sites; meteorological messages such as
Maps showing the names and locations of the studied massifs:23 in the French Alps (a) and 15 in the Pyrenees (b).

SYNOP, which provides data collected at regular (synoptic) times, usually every 6 hours based on Greenwich Mean Time; and atmospheric upper-level sounding. SAFRAN automatically combines the observed information with preliminary estimates. These fields (generally called “guesses”) are computed from the results of the ARPÈGE Action Recherche Petite Échelle Grande Échelle) French meteorological model (Reference Courtier, Freydier, Geleyn, Rabier and RochasCourtier and others, 19911 or from the European Centre for Medium-range Weather Forecasts analyses through appropriate downscaling operators. The interpolation method (“optimal interpolation” (Ol)) and operators used are described in detail in Reference Durand, Brun, Mérindol, Guyomarc’h, Lesaffre and MartinDurand and others (1993).
Flow chart of the SCM chain.

As outputs, SAFRAN provides the main relevant atmospheric parameters affecting snowpack evolution: air temperature, wind speed, air humidity, cloud cover, snow and rain precipitation, longwave radiation, direct and scaltered solar radiation. The analysis is carried out on the 23 French Alpine and 15 Pyrenean massifs at hourly time-steps, and throughout the year provides a series of relevant meteorological parameters over areas where no human or automatic observation is available. These different massifs were chosen for their climatological homogeneity, especially with regard to precipitation fields. The calculated results are at the massif scale, although this spatial definition can vary slightly in each massif because or inherent filters used in the different operators:
-
1. the downscaling procedures which produce the initial guess-field can have a variable response according to the size of the massif and its location (especially along the vertical dimension);
-
2. the density of the observation network which governs the amount of data used in the analysis of each massif (see Table 1) and so carries variable fine-scale information through the analysis process;
-
3. the shape of the structure functions of the OI scheme which implies increased smoothing in the line scales analyzed (Reference PhillipsPhillips, 1986).
Several new improvements to this analys is not described in Reference Durand, Brun, Mérindol, Guyomarc’h, Lesaffre and MartinDurand and others (1993) include:
a revised radiative code with better transmission functions for the different cloud classes, especially for high altitude cirrus;
a better hourly discrimination between rain and snow; the use of satellite images to determine cloudiness.
Figure 3 displays the precipitation analyzed by SAFRAN for 20 December 1996 on 23 Alpine massifs on a flat surface at 1800 m a.s.l. The observation data used by the analysis scheme for each mass if a re shown in Table 1, with their respective locations and elevations.
SAFRAN was tested by comparing its analyses throughout a complete snow season with meteorological observations collected at two well-instrumented automatic sites located at 1320 m a.s.l (Col de Porte, Chartreuse massif) and 2700 m a.s.l (Col dl! Lac Blanc, Grandes-Rousses massif) At both sites, air temperature, air humidity, wind velocity, incoming longwave and shortwave radiation and snow or rain precipitation were measured. Naturally, these data were not used by SAFRAN to perform its analyses and thus were designed to qualify SAFRAN results. Some results, derived from Reference Durand, Brun, Mérindol, Guyomarc’h, Lesaffre and MartinDurand and others (1993), a re presented in Table 2. With very small biases and reasonable rms values between observed and predicted values, SAFRAN results were considered very satisfactory for providing input meteorological data for a snow model.
Crocus
Crocus (Reference Brun, Martin, Simon, Gendre and ColeouBrun and othels, 1989, Reference Brun, David, Sudul and Brunot1992) is a numerical snow model calculating the energy and mass evolution of the snow cover. It uses the meteorological data calculated by the SAFRAN model and simulates the evolution of temperature, density, liquid-water content and layering of the snowpack. The originality of this snow model lies in its ability to simulate snow metamorphism in near-surface and buried layers and to represent each snow type in a comprehensible form. The snow albedo and extinction coefficient depend on the wavelength and the surface snowtype, size and age. We consider that each simulated slope is snow-free on 1 August each year. The simulated snowpack then evolves day by day from the first snowfall until complete melting without reinitialisation. The computed snow state for a given day is thus based only on the snow slate of the previous day and on the SAFRAN atmospheric analysis of the current day. No information concerning the snowpack structure is used. The drawback of this running system is that there is a cumulative effect of all the daily errors throughout the season with no direct correction possible; this point is illustrated in section 5 below in the discussion of the validation of the simulated snow depth at Tignes ski resort.
Data used by SAFRAN to produce the precipitation analysis shown in Figure 3 (20 December 1996)

SAFRAN averaged analyzed precipitation on the 23 Alpine massifs at 1800 m a.s.l on a flat aspect, 19–20 December 1996.

The main recent development of this model is the initial determination of the parameters describing fresh snow crystal (dendricity and sphericity) depending on the SAFRAN wind speed, in order to begin to take-into account the destructive effect of the wind during a snowfall.
SAFRAN verifications at two instrumented sites, showing the averaged difference, the rms and the correlation coefficient during winter 1990-91

Local validation of Crocus was mainly conducted during winter 1988–89 at the research site of Col de Porte where all meteorological parameters are measured and recorded. Using these data. Crocus simulated the evolution of the internal state of the snow cover (temperature, liquid-water content, density profiles and stratigraphy; which was compared with observations collected weekly from, a snow pit at the site (Reference Brun, David, Sudul and BrunotBrun and others, 1992). During ibis test, Crocus simulated snowpacks very similar to those observed in the field. The test period included most of the meteorological occurrences that can be observed in Alpine regions: heavy dry-snow falls, long dry periods, rain-on-snow events, complete refreezing, late-spring snowfalls, high temperature gradients. All this made us very confident in the ability of Crocus to simulate the main processes affecting a snowpack.
MÉPRA
MÉPRA (Reference GiraudGiraud, 1993) is an expert system for avalanche-risk forecasting. Thus system deduces from the Crocus snowpack simulations additional mechanical characteristics (shear strength, rammsonde resistance; and adds this new information to the different snow profiles. An evaluation of such quantities is made through statistical relationships calculated (rom numerous in situ snow-measurement campaigns. As detailed in Reference Giraud and NavarreGiraud and Navarre (1995), shear strength is a function of snow density, type of crystals, temperature arid possibly Iiquid-water Content. After classifying the computer-generated rammsonde and stratigraphie profile, this model predicts the “natural” mechanical stability of the snowpack (i.e. the risk of spontaneous avalanches without human overloading). In the first step, the classical stability index S is calculated for each layer of each simulated snowpack (Föhn, 1987):
where C is shear strength and τn is snow shear stress. Depending on the value and the temporal evolution of this index as well as the unstable snow quantity, the “natural” avalanche risk is classified at one of six levels (very low, low, moderate increasing, moderate decreasing, high or very high) according to different thresholds based on experience, snow measurements and the literature. This estimation is completed by a classification of different avalanche types ( fresh dry, fresh wet, fresh mixed, surface slab, surface wet, bottom wet). In the case of wet snow, (he calculated index is adjusted by a diagnostic based on the increasing depth of the wetted layer. Two examples of “natural” risk and associated avalanche type are discussed below in section 6.
In the second step, the expert system interprets the snowpack structure to detect the hazard of release of a dry-slab avalanchc by a skier. It is thought that slab avalanches start with a shear fracture or a collapse in a weak layer or interface (Reference Jamieson and JohnstonJamieson and Johnston, 1993; Reference SchweizerSchweizer, 1993). lb achieve this, MÉPRA looks fu st for a snow slab in the superficial layers of the snowpack according to different criteria such as density, grain-size and grain type. After detecting a slab, it looks for the presence of a weak layer beneath the slab by calculating a new stability index S’ integrating human triggering (Föhn, 1987, Reference Giraud and NavarreGiraud and Navarre, 1995), based on a simple Rankine equilibrium:
where βs is skier shear stress. Depending on the S’ index value, an “accidental” avalanche risk is then deduced on a four-level scale for each point (very low, low, moderate, high). The practical use of such indexes is presented below within the framework of a real avalanche case.
MÉPRA was first tested at the Flaine ski resort during winter 1988 89. Initialised by Crocus, we compared MÉPRA’s computed estimation of the snowpack structure with those observed weekly at snow pits, and the computed risk evaluation with human-observed focal avalanche activity as described in the daily reports. As presented in Reference GiraudGiraud (1993), various meteorological conditions had been encountered during the season, implying different evolutions of the snow. The season began with a cooling and the formation of faceted crystals due to antieyclonic pressures, followed by a heating with heavy rainfall increasing settling and welting of the snowpack. Considerable avalanche activity followed a large Snow accumulation on this weakened snow cover. MÉPRA diagnostics wrere globally satisfactory, with no erroneous avalanche activity forecast and only three wrong alerts when risk evaluation was decreased loo slowly when the slopes were already naturally drained.
These avalanche diagnostics have the same spatial representativity as their input data (i.e. the massif) and do not take into account the accumulation or erosion of snow by the wind. MÉPRA does not calculate a risk level integrated spatially on the whole massif, ft provides the forecaster with “natural”or “accidental” risks at different elevations and aspects, pointing out what kind of slopes are more likely to be affected by the natural or accidental release of avalanches.
5. Validations
Each of the three models was first validated separately m order to assess its individual performance, but as they have to run together a global validation is necessary. In fact, validation of die three SCM components does not ensure that Crocus can simulate realistic snowpacks over a whole massif when its input data are provided daily by SAFRAN instead of local observations. This running mode also governs the quality of the MÉPRA diagnostics. Several tests have therefore been conducted to validate the results of the integrated system.
Validation of snow accumulation and ablation
These tests mainly concerned SAFRAN/Crocus and focused on their performance in simulating the dynamics of the snow cover, i.e. the accumulation and the ablation of the snowpack at various elevations. We simulated 10 years of daily snow depth at 37 observation sites from the Snow/ Weather network which were compared to observations (Reference Martin, Brun and DurandMartin and others, 1994). In most locations, simulations and observations are very similar, highlighting the performance of SAFRAN/Crocus in representing the accumulations of fresh snow, its compaction and the melting of the snowpack for a wide range of elevations.
An example of the snow depth simulated at Tignes ski resort by Crocus, and the corresponding observed snow depth, is shown in Figure 4. In addition to the close Correspondence between the two curves, some details are apparent that reveal the inherent difficulties of our numerical simulations.
Most of the information observed is produced during winter even though the snow deposition has already begun (the dotted “observed” lines do not cover the full year, because meteorological observations of this site were not available at some periods). The sparsity of the observation network prior to the ski season causes the uncertainty in the modelled snow depth at the beginning of December 1981. Lack of data also makes it difficult to evaluate the melting rate, although in April 1988, for example, the simulated melting rate seems erroneous. But this kind of evaluation is generally performed with automatic stations whose vicinity is less affected by human activities and whose geographical masks arc well known.
Erroneous settling rates can be seen, especially in March 1982 and 1983 and February March 1987; these are mainly due to inaccurate estimation of the initial density and of the crystal parameters for freshly fallen snow.
Some errors in the quantities of the analyzed precipitation are visible in December 1981, March April 198b and April 1989. These are often coupled with errors in the hourly vertical determination of limit between rain and snow, generally through lack of pertinent observed information.
10 Year comparisons (1987–91) between measured snoe depth (dotted line) and simulated Snow depth (solid line) at the Tignes ski resort, vanoise massif.

The impossibility of correcting the simulated snow depths with in situ observations is apparent during some winters, such as 1982 83 or 1985 86. These seasons show a cumulative bias based on an initial error.
The scatter diagrams of Figure 5, which complete the set published by Reference Martin, Brun and DurandMartin and others (1994), generalise these indications. They comprise 37 observation sites and show the observed (y axis) and simulated (x axis) mean snow depth over four monthly periods. Here we can appreciate the close correspondence at most of the sites; only in April is an erroneous snowpack simulated when in reality it had disappeared. The rms errors of the 37 sites are usually < 20 cm for test sites below 1500 m a.s.l. and 30 cm for other sites during winter (15 December to end of April) generally with an existing snow cover. This performance was confirmed by using the outputs of S A FR AN”/ Croc us as input data for the Swiss Federal Institute of Technology’s HBV hydrological model (Reference Braun, Brun, Durand, Martin and TourasseBraun and others, 1994).
Validation of the simulated stratigraphy
No unique parameter can quantify the similarity between a profile simulated by SAFRAN/Crocus and a measured profile from a snow pit. Similarity must be found in a range of variables, such as the stratigraphy, the temperature profile, the liquid-water-content profile and the density. We have chosen to show the performance of SAFRAN/Crocus by displaying all observed and simulated profiles at the Fa Plague Montchavin site, where only one snow pit is observed weekly by local snow patrollers. This last fact has a bearing on the estimation of the results, for it implies that this site does nut provide any information which could be used by the numerical System. The winter 1996 97 comparison is presented in Figure 6a. In assessing the results, we must keep in mind that such a comparison is complicated by uncertainties about the observation itself (exact time, precise location, different observers and difficulties of a field observation) and the natural variability of the snowpack. The liquid-water content is not displayed, as it is not measured routinely in the network, but it is implicit in the density (green line). The different types of crystals, plotted on the right of each profile, are presented in Figure 6b with a colour code which appears in more detailed form in Reference Brun, David, Sudul and BrunotBrun and others (1992). The correspondence between this code and the international classification (Reference ColbeckColbeck and others, 1990) is shown in Figure 6b.
Scatter diagrams of measured and simulated mean snow depth at the 37 test sites during four different months.

The different profiles correspond closely throughout the season, and no major difference can be found. Simulated and observed snow depths arc in agreement despite some discrepancies (31 December, 13 January, 17 March) which can be attributed both to the difficulty of using SAFRAN to estimate snowfalls in a precise location, and to the natural local variability of the snow cover. However, no long-term trend can be observed. Density profiles arc, on the other hand, well simulated.
Temperature profiles are well simulated in winter. However, we observe a slight tendency of the model to produce colder profiles at the beginning of the melt period (especially in March). Wet snow grains (in red in Fig. 6a) were systematically observed more often than the simulated profiles indicate from mid-March. Another consequence is the simulation of crusts (vertical hatch ) with temperatures different from zero and no liquid-water content while wet grains were observed.
Sometimes, as on 27 January, observed and simulated crystal types differ: they arc faceted (blue) in the observations and rounded (pink.) in the model. The grain-sizes, however, are about the same. More detailed examination of the observed profiles (not presented here) shows that in fact mixed forms were observed and the faceted grains were coded first. The discrepancy between numerical and observed profiles is thus reduced, and seems to be mainly due to a slight difference in the temperature gradients.
The “dark-blue” faceted layer, seen on the observed profiles of 11 and 24 February, near 80 cm depth is also present in the model, but is thinner. It is an important factor in determining the stability of the profile, for it can constitute a weak layer, especially in case of overloading (see section 4 above, subsection on MÉPRA).
Validation of snow depth and simulated temperature gradient
Comparisons between observed and simulated snowpacks cannot be shown for all snow-pit locations. In order to use most of the available observations from snow pits to validate our system, we have compared the snow depths and the simulated temperature gradient inside the snowpack with the corresponding values observed. As stated previously, no corresponding elimatological quantities are entered into the chain. The temperature gradient is a pertinent variable since it governs the formation of most weak layers. Table 3 displays the correlation and the bias between these quantities. The comparisons were carried out on 701 observed profiles in 50 locations covering all the French massifs and separated into three main areas during winter 1996–97.
Snow depths are always greater in reality than in tin.1 simulations (especially in the Pyrenees and Southern Alps; and exhibit low’ correlation. This is mainly because in this particular winter most of the snowfalls occurred in November, before the opening of the observation network. The results of temperature gradients are more satisfactory in bias and correlation, although the low value in the Southern Alps must be investigated further, and they make it possible to calculate a realistic associated metamorphism.
Validation of risk levels diagnosed by MÉPRA
The natural observed avalanche activity and the SCM natural avalanche risk on Vanoise massif were compared, lo carry out this comparison, a measurement of the avalanche activity and of the MÉPRA risks was defined.
For the avalanche activity, w7c used a simple evaluation of regional avalanche activity deduced from the daily reports of snow patrollers. As explained in Reference Giraud, Lafeuille and PahautGiraud and others 1987), this regional score is an average of different local-avalanche visual observations as indicated in the currently used code. The local-avalanche estimation for each site is computed according to the number of events and their nature; artificial releases have less weight than spontaneous avalanches. A general weight also allows us to take into account the number of sites with no observed avalanche activity. This score is expressed on a ten-level scale.
For MÉPRA, we took an index which summarises the great spatial and temporal variability and intensity of the MÉPRA avalanche risks in a massif. It is an average of all MÉPRA “natural” risks between 1500 and 3000 m a.s.l. for different aspects (north, cast, southeast, south, southwest and west), which is expressed on the previously mentioned six-level scale.
Quantitative comparisons were then conducted, and are illustrated in Figure 7 by the chronological representations of the different avalanche events (“observed” index on the right y axis and MÉPRA index on the left one) of winter 1986-87. This kind of plotting allowed us to identify the avalanche periods for further meteorological and snow investigations, although the intense avalanche-activity period at the beginning of winter is generally poorly observed by the patrollers (extremely-severe weather conditions). Based on a simple classification of the results from these two indices, contingency tables were created year by year (see, e.g., Table 4). They have been studied according to the Hanssen and Kuipcrs score (Reference Hanssen and KuipersHanssen and Kuipcrs, 1965):

where aij is an element of the contingency table and V is the Ilanssen and Kuipcrs score.
(a) Comparisons between observed and numerically simulated snowpack structures during winter 1996-97 til the La Plagne ski resort, Vanoi.se massif, at the snow-pit location of Montchavin (2100 m a.s.l., north-eastern aspect). The different panels illustrate the weekly-observed snow pits and the corresponding computed profile. The vertical axis (in cm J represents the snow depth, and the blue and green curves, respectively. the temperature (in C) and density profiles (in gem ‘), with two different scales an the horizontal axis. On the right side of each profile, the stratigraphic profile is illustrated by the colour code presented in (b), while the vertical hatch shows crusts. (b) dolour code used for the snow-crystal representation. The connection with the international classification (Reference ColbeckColbeck and others, 1990) is shown. The fresh snow is represented in green, faceted crystals in blue and rounded crystals in red. As explained in Reference Brun, David, Sudul and BrunotBrun and others (1992), fresh snow is desert bed in terms of dendricity and sphericity, and the more transformed crystals are defined by their size and sphericity.

Comparisons between observed and simulated snow depths and vertical temperature gradients inside the snowpack for different locations in the Alps and Pyrenees during winter 1996-97

Time comparison between observed avalanche activity ( dotted line according to a scale of about ten levels; y axis and scale on the right) and MÉPRA avalanche-risk index (bars, on a five-level scale; y axis and scale on the left) for the Vanoise massif during winter 1986–87.

The full results (not presented here) show a Hanssen and Kuipers score of 0.7—0.8 for all winters. These are quite good results, especially for spring, which shows a good spatial and temporal correlation between activity and risk. Incorrect forecasts low predicted risk with an observed avalanche) are attributable to very small spring avalanches which are reported as avalanches instead of snow flows or sloughs. Winter-avalanche situations with high snow precipitation seem to have been less well estimated. Avalanche observations in winter are very difficult, arid even impossible when weather conditions are extreme, hence the incorrect warnings high risk without observed avalanche).
Contingency table of MÉPRA risk and avalanche activity during winter 1986–87 in Vanoise massif (Hanssen and Kuipers score = 0.75)

Field verification during an avalanche inquiry (Vanoise, 15 February 1996)
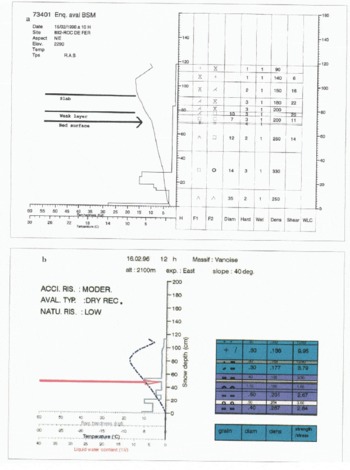
When a dry-slab avalanche occurred near Roc de For in the Vanoise massif, from about 2300 m a.s.l on a northeastern slope of about 35°, several investigations were carried out the following day. The fracture was about 40 60 cm thick and 100 m wide. The in situ profile (Fig. 8a) is all dry with cold snow, but its most prominent characteristic is a weak layer (70 76 cm deep) of faceted crystals overlain by a crumbly buried slab (76 91 cm). The weak layer lies on a l em crust. It is the dry slab, buried under about 30 cm of fresh snow, which was triggered by the overload of many skiers, with a collapse of the faceted crystals.
The corresponding SCM simulated profile (Fig. 8b) shows similar characteristics. At the top, we find about 30 cm of fresh snow (plotted “+” and “/” as grain type) which covers an older set of different layers (90–60 cm deep) which arc more or less transformed. The density of these layers is higher (156–183 kg 3) and the MÉPRA stability index suggests a good cohesion (3.20–13.90 compared to about 1.5). We can thus assimilate these layers to the slab observed. The main differences between simulated and observed profiles (although perhaps present in reality) are in the two weak layers shown in Figure 8b: at 60 cm a layer of faceted crystals overlays a layer of depth hoar (45 cm) separated by a small crust (50 cm). This kind of structure has been described by Reference Jamieson and JohnstonJamieson and Johnston (1993) to explain a common case of slab avalanche. The deepest layer has a lower stability index (1.66) than the upper one; this explains why MÉPRA identifies this layer as the most likely failure (see red arrow in Fig. 8b). In addition, the presence of the crust is taken into account in MÉPRA diagnostics which consider it to be not thick enough to stabilise the underlying layers and so moderate the risk.
The close correspondence between the observed and the simulated profiles and their respective stability illustrates the SGM’s capacity to help prevent some of the mountain dangers. At the time of this catastrophic event the SCM chain was running and some of its elements were at the disposal of the local forecasters who classified that day at level 4 (the maximum being 5) on the European avalanche scale.
6. Operational process for running the model
Since winter 1991 -93 at mid-morning each day, the chain of models has been used to calculate the previous day’s snow-profile evolution for all of the French Alpine and Pyrenean massifs.
(a) Observed snowpack profile during ike Rocdu Fer avalanche, 16 February 1906, showing the profiles of temperature (°C) and rammsonde hardness (kgf) at different depths H, According to Reference ColbeckColbeck and others (1090). columns F1 and F2 indicate the two main gram shapes. The density of each layer is in kg m3 and the grain-size is described by its diameter in tenths of mm. The column “Wet”’ at 1 indicates a dry profile, whereas the manual hardness “Hard” is expressed on five-level scale. A manual estimation of the shear strength (in kg dm 2j is given in the column “Shear”, (b) Simulated snowpack profile at a computing location corresponding to the site of the Roc du Fer avalanche, 16 February 1996 ( Vanoise massif 2100 m a.s.l., eastern aspect, 40° slope) and showing the same two profiles as in (a). The two main grain shapes are presented in the column “grain” the diameter of the grain-size (column “diam’’) is in mm and the density “dens “in gem3. The stability index S is printed in the last column.
The process begin s with the collection of the different manual observations from the different ski resorts (Snow/Weather net work) which is assured by the local stations of Météo-France. The observations are generally made at 0800 h local time and are transmitted by telephone to the station which inserts them into the different networks and databases after quality-checking. Another observation is made in the afternoon and transmitted. Data are available from about 110 stations during winter over the Alps and Pyrenees. In parallel, we extract the other information, such as radar images, automatic station data, meteorological messages and numerical products from mesoscale meteorological models. All this information is available at the CEN.
The SCM chain begins its run at about 1100 h by simulating both the meteorological conditions and the full state of the snowpack including the avalanche risks over the massils, aspects and heights mentioned. The numerical simulation is performed over a 24 h period from 0600 h the day before. All the results are available hourly,
To help the avalanche forecaster to interpret the SCM results, software has been developed that allows the forecast ter to look at the meteorological output and the simulated snowpack for different aspects and elevations in different massifs. Displays include:
SAFRAN meteorological parameters (e.g. air temperature, wind .speed, humidity, solar radiation) averaged at the massif scale (see Fig. 3) for the Alps and Pyrenees.
symbolic representations (i.e. concentric circles; see Figs 9 and 10) by elevation steps (300 m) with expositions (pie charts).
The avalanche risks in Figure 9 are due to destabilisation by rain (first wetting of dry weak layer), and a high risk is indicated at low elevation. When all the weak layers have been wetted, the MÉPRA avalanche risks immediately decrease, with a return to stability by refreezing. Just above the snow/rain limit, a low avalanche risk is estimated because fresh-snow density calculated by Crocus is high enough. At higher elevation, natural avalanche risk is more significant, with fresh snow becoming lighter.
The second example in Figure 10 is a spring situation with destabilisation by welting due to solar radiation and water flow. In this type of avalanche situation, the most important factor is liquid-water penetration into the snowpack. When a dry weak layer (fresh or recent snow, faceted crystal, depth hoar) becomes wet, its shear strength decreases and an avalanche risk is estimated as a function of wet-snow depth. This process of destabilisation depends on both aspect and elevation. The SCM chain gives general information about the geographical distribution of these parameters ii i order to survey the snow-cover wetting day by day and the associated avalanche risk.
Symbolic representation (elevation and aspects) of MÉPRA natural avalanche risks and types on the Grandes-Rousses massif for one slope (40°) in a typical winter situation (23 January 1995 at 12 UTC).The different avalanche risks plotted are; very high, high, moderate decreasing, moderate increasing, low and very low. 1 he corresponding avalanche types are; wet bottom, wet surface, mixed recent, surface slab, wet recent and dry recent. The grey “vid”color is used when no indication is available.

Symbolic representation (elevation and aspects) of MÉPRA natural avalanche risks and types on the Belledonnes massif for one slope (40°) in a typical spring situation (9 march 1994 at 12 UTC) with the same colour code as in figure 9.

complete stratigraphic and rammsonde profiles as presented in Figures 8b and 11. Figure 11 represents an unstable snowpack, with accidental risk due to the presence of a weak layer of faceted crystals below a snow slab in a northern exposure. All the elements of the profile are Summarised (Belledonne massif, 2100 m a.s.l., western aspect, 40° slope) and are used by MÉPRA evaluation for each layer. On the right side we find the grain-size according to the international classification (Reference ColbeckColbeck and others, 1990), the diameter of the grains (in mm), the density and the stability index (Föhn, 1987). On the left side three vertical curves indicate simultaneously at different snow depths (vertical axis, in cm) the snow temperature (blue curve, in °C), the rammsonde baldness (brown curve, in kgf) and the liquid-water content (red filling, in % of the total volume as indicated at the bottom of the profile). The large red arrow indicates the weak layer.
continuous evolution of stratigraphy and snowpack temperature i Fig. 12) from the beginning of winter.
As the expert system must justify its reasoning, the avalanche forecaster can also display complete, detailed graphics of stratigraphy and rammsonde profiles (Figs 8 and 11) with instability levels and MÉPRA information such as avalanche risks and type and snowpack profile.
Our first-hand contact with the forecasters has allowed continuous development of all the programs. The forecasters have daily contact with the snow patrollers of the ski resorts who inform them of the observed avalanche activity. The chain outputs are also systematically used and compared with the Held reality when specific inquiries are made about real avalanche cases (e.g. the Roc de Fer avalanche discussed in section 5 above). These comparisons allow us to identify the differences between the chain and reality but not to easily correct them. As previously explained, there is no feedback to the system from field observations concerning snow and avalanches; the only input is the meteorological conditions, and the chain can be corrected only by modification of these conditions, as explained in the next section.
We are also working on projections on a ground digital model (75 m mesh) of some elaborated parameters: surface snow temperature, snow depth, avalanche risk, avalanche type, wet-snow depth and relicezing-snow depth. Even if some preliminary versions of these displays are already at the disposal of local forecasters, this kind of product is still a research subject because it is difficult, given our basic assumptions, to integrate the necessary local effects. Some new developments and their corresponding illustrations will soon be available.
7. Weaknesses of the models and opinion of the forecasters
The SCM results have been used and verified by the Grenoble avalanche forecasters since winter 1992–93. This operational use has allowed us to correct some preliminary errors and to make improvements in different parts of the code, such as a better determination of the elevation of the transition between snow and rain. The forecasters are not she only source of information; we consider all the daily observations, especially those provided by the two automatic-instrumented sites (Col de Porte and Col du Lac Blanc) which are not used by the chain and provide real-time diagnostics for evaluating both the meteorological conditions and the state of the snowpack. Another verification procedure is to carry out quasi-real-time numerical simulations on snow-pit sites characterised by their massif, elevation, slope and aspect.
Apart from some local effects, the main source of problems is the SAFRAN analysis which may lack pertinent information, as can occur outside (he winter period or at high elevation. Flic problem becomes noticeable when, in these under-determined situations, an analyzed quantity is obviously erroneous or badly evaluated, or crosses a physical threshold (as when the analysis determines it is raining instead of snowing through an inaccurate determination of the hourly vertical limit between rain and snow. But some other problems can be more insidious and reveal permanent weaknesses, as did the previous cloudiness scheme. Once an error has been detected and analyzed (generally in the snowpack state, more rarely in the meteorological conditions, except in the analyzed precipitation or cloudiness), we check the SAFRAN output. This is the most “sensible” point and the easiest to correct. The cause is usually an erroneous observation (accepted despite automatic checking) or missing data, in which case it is possible to change the results by modifying input meteorological data and re-running the models from the date of the error. But problems are not always directly linked with incorrect data; they can also be due to the limitations of these numerical models. All malfunctions (found by the forecasters or by us) are recorded and studied.
Graphical indication of the likely underlying MÉPRA processes for an accidental risk 0n the Belledonne massif for one slope (40°), 1 January 1996 at 12 UTC.

Time-continuous evolution of Crocus snowpack temperature on the Chablais massif al 2700 m a.s.l on a northern aspect (40° slope) during winter 1996 97 (time-scale on a; axis, snow depth in cm ony axis, temperature according to the colour scale).

Embarrassment arises when SCAT snow profiles differ too much from local observations such as the weekly snow pits. This problem is mainly due to the lack of meteorological observations at high elevation and on southern slopes. At present, there is no way to rectify such a divergence between simulated and observed snow profiles, for it is impossible to modify (with coherent corrections for all the physical and stratigraphical elements) all the simulated profiles at different elevations and aspects using only a few sparsely observed snow pits.
In spite of such current limitations, French avalanche forecasters have found that SCM helps them to analyze the spatial variability of the snowpack structure (e.g. weak layer, rammsonde resistance, shear strength) over a wide range of elevations and aspects. Throughout the winter (November– May), the avalanche forecaster receives realistic simulations of the snow-cover limits, snow depths, locations of high-temperature-gradient metamorphism, wetting or refreezing depth and natural or accidental avalanche risks. During winter, when weekly snow pits are numerous, Crocus outputs are a useful complement to pit observations: they make it possible to obtain continuous and reliable information on the evolution of the internal state of the snow cover between two pits and they give information at elevations and aspects where no pit observation is available. Crocus and MÉPRA help the forecaster in pointing out the range of elevations and aspects where processes affecting the stability of the snowpack are occurring or expected: weak-layer formation due to thermal gradient metamorphism, surface or deep wetting, fresh-snow compaction, refreezing. At the beginning (November to mid-December) or at the end of winter (mid-April to May), snow and avalanche observations are rare, and the SCM chain has proved itself a reliable source of information on the snowpack structures in spite of sparse observations.
Every spring, a general meeting takes place at C1EN, Each local centre is represented and the different forecasters make an assessment of the previous winter. The SCM performances are discussed and can be presented as in Figure 13. Figure 13a shows the opinion of the forecasters at the Toulouse local centre concerning the daily SCM snow depths over the four Pyrenean massifs where they provided their avalanche reports throughout winter 1996—97. The results seem quite poor in terms of the snow-depth parameter because of numerous insufficient simulations, but the associated simulated natural risks on the four massifs are considered satisfactory nearly three times out of four (see Fig. 13b i and the associated accidental risks are considered satisfactory in 58% of cases (sec Fig, 13c). The other indications in Figure 13b and c show how forecasters judged MÉPRA diagnostics compared to their Own (“pessimistic” indicating a simulated risk too high compared to the observed avalanche activity, and “optimistic” indicating a simulated risk that is too low). The weakness in the snow depths produced has been found to be due to inadequate SAFRAN rainfall climatology fields which inferred an erroneous vertical gradient.
8. Using SCM chain in a forecast mode
The first goal of the SCM chain was to simulate the evolution of snow cover according to present and past weather conditions. But in France, the daily avalanche report emitted by the mountain meteorological station describes the present slate of the snow cover and its evolution for the next 48 h in connection with the weather forecast. Therefore, SCM has been upgraded to provide a 48 b forecast of the snow-cover evolution. The solution of the problem was within the SAFRAN analysis (Reference Durand, Merindol and MichoudDurand and others, 1995, Reference Durand, Giraud and Mérindol.1998) which had to be customised to run with Weather forecasts and observation data of an analogous day.
(a) Evaluation by Pyrenean forecasters of the global simulated snow depth over four massifs during winter 1996 97 according to four simple criteria (‘“exaggerated” indicating a simulated snowpack deeper than observed, and “insufficient “ indicating that the observation is deeper than the simulation). (b) Corresponding evaluation by Pyrenean forecasters of the simulated spontaneous MÉPRA risks according to three simple criteria on the same four massif (“pessimistic” indicating a simulated risk loo high compared to the observed avalanche activity, and “optimistic” indicating a simulated risk that is loo low ). (c) Corresponding evaluation by Pyrenean-forecasters of the simulated accidental MÉPRA risks according to the same three simple criteria on the same four massifs.

Two main sources of information have been used:
fine-scale adaptation of the ARPÈGE (Reference Courtier, Freydier, Geleyn, Rabier and RochasCourtier and others, 1991) French meteorological-model forecast (output mesh size about 30 km)
research of past dates where the synoptic patterns of different meteorological fields at 500 and 700 hPa heights arc close to those forecast by the ARPÈGE model, ft is a classical application of the nearest-neighbour method applied to middle-altitude meteorological fields with different operators concerning both the fields and their derivatives : Reference Durand, Giraud and Mérindol.Durand and others, 1998).
For all meteorological variables except precipitation, we perform only an adaptation of ARPÈGE forecasts at the massif scale through downscaling operators, as is done in the analysis version of SAFRAN : Reference Durand, Brun, Mérindol, Guyomarc’h, Lesaffre and MartinDurand and others, 1995] to compute the initial guess-field.
For the precipitation, both methods are used see Reference Durand, Giraud and Mérindol.Durand and others, 1998): the first estimation is obtained from ARPÈGE through different appropriate operators, and the second from the analysis of nearest-neighbour (analogous) past day. The two estimated precipitation Sields {ARPÈGE adaptation and “analogous” solution) are then merged. In addition, a special algorithm is used in the frequent cases where one estimation is rainy and the other one not. After nearly 2 years of verifications (627 comparisons, September 1994 August 1996), this final mixing with regard to the operational analyses has given improved results, as indicated by the different correlation values in the first row of Table 5. These numbers are computed on daily values for every Alpine massif at 1800 m a.s.l. for the full 2 year period and are typical of a statistical mixing compared to its separate components. On the other hand, we must remember that the study period covers summer periods where analyses and forecasts of precipitation are difficult because of convective events and many analyzed and forecast dry days. For the last two winters (171 situations), the same validation is presented in the second row of Table 5 with better results than over the full period.
9. Conclusion
Various validations of the SCM models have shown that they gave a reliable analysis of the meteorological conditions prevailing in a massif at different elevations and aspects, and simulate their effects on the evolution of the snowpack and its stability. These models have been used for several years both to monitor the present state of the snow cover and to forecast its evolution and stability for the following 48 h. They help the avalanche forecaster in pointing out the range of elevations and aspects at which the snow-pack undergoes processes affecting its stability: accumulation and compaction of deep fresh-snow layers, formation of weak layers due to high-temperature-gradient metamorphism, melting and refreezing.
The main limitation of the models is that they do not simulate accumulation and erosion by the wind which may significantly modify the local snow conditions. Improving them in this respect is a challenge for future research. Physically based methods could be developed by using the outputs of recent fine-mesh meteorological models which are now able to represent the wind field in mountainous regions with a spatial resolution of about 100 m.
Acknowledgements
We are grateful to all our colleagues who routinely use and help with the validation of this chain. We are also indebted to the friends and colleagues who helped us improve the manuscript. Special thanks go to all the observers who collect the essential observations daily. We also thank the editors and reviewers for their useful comments and helpful suggestions.
Correlation between analyzed precipitation and different forecast field precipitation, as described in the text (ARPÈGE downscaling adaptation, analysis of the nearest-neighbour day and mixing of the two previous solutions (mixed[forecast))


