

Introduction
Several studies have demonstrated that magnetic resonance imaging (MRI) can detect otherwise occult breast cancers, and it is playing an increasingly important role in the clinical setting including a possible role in screening high-risk women [1–3]. Breast MRI has a high sensitivity for breast cancer detection, reported as high as 94–100%, but a lower specificity, reported as 37–97% [4]. Until recently, one of the limiting factors in the utility of breast MRI has been the lack of standardized criteria for interpretation and reporting of breast MRI [4]. The American College of Radiology has recently published a lexicon for breast MRI [5].
Lesion interpretation in breast MRI relies entirely on lesion enhancement but solely identifying an enhancing area on breast MRI as suspicious will not optimize the specificity of breast MRI and will result in too many false positive biopsies. For the best analysis, all features of the lesion should be analyzed including kinetics as well as morphology of enhancement. By combining kinetic and morphologic information with clinical history and conventional imaging (mammography and ultrasound) findings, a recommendation for biopsy can be made with more assurance.
As malignant lesions can masquerade as benign and vice versa, there can be overlap in the imaging characteristics of benign and malignant lesions. As there is overlap, the most definitive method of differentiation between benign and malignant is of course biopsy, which should be performed for any suspicious finding. This article will address the features that will help the reader determine how to manage enhancing lesions first detected on MRI.
Morphologic features
A basic understanding of cancer growth and spread in the breast aids in the analysis of the morphologic features seen with breast MR imaging. Similarly, knowledge of the histopathology of benign lesions such as the different types of fibroadenomas can aid in the interpretation of benign findings.
Morphologic analysis is best performed with high spatial-resolution techniques that allow evaluation of the mass shape and border so that suspicious spiculated masses can be differentiated from round benign-appearing masses. Also, with high spatial resolution, the borders and internal architecture of the lesion can be assessed and the pattern of enhancement can be readily characterized.
Description of terms
Focus/mass
A focus is a tiny punctate enhancement that is non-specific and too small to be characterized. A focus is clearly not a space-occupying lesion or mass and is smaller than 5 mm (Fig. 1).

Figure 1. Non-specific foci of enhancement – unchanged on follow-up scans.
Shape/margin
The shape and margins of masses can be described. Mass shape can be described as round (Fig. 2), oval (Fig. 3) or not otherwise specified (NOS). Margins of masses are smooth (Fig. 4), lobulated (Fig. 5), irregular (Fig. 6) or spiculated (Fig. 7). Spiculated or irregular masses are suspicious for carcinoma whereas a smooth margin is more suggestive of a benign lesion and lobulated borders are of intermediate concern. It is important to realize that margin analysis is dependent on spatial resolution and that even irregular borders can appear relatively smooth when insufficient resolution is used. Therefore, carcinoma may present with benign imaging features on MR imaging, particularly when small. In general, margin and shape analysis should be performed on the first post-contrast image to avoid washout and progressive enhancement of the surrounding breast tissue, which could obscure lesion analysis.

Figure 2. Round mass. Pathology – Fibroadenoma.
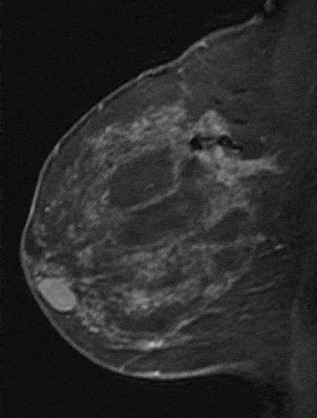
Figure 3. Oval-shaped mass. Pathology – Fibroadenoma.

Figure 4. Smooth lobulated mass. Pathology – Fibroadenoma.

Figure 5. Lobulated mass. Pathology – Infiltrating ductal cancer.

Figure 6. Irregular mass. Pathology – Infiltrating ductal cancer.
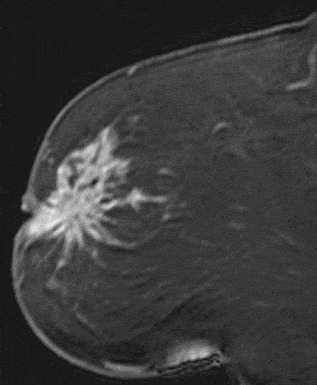
Figure 7. Spiculated mass. Pathology – Invasive lobular cancer.
Internal enhancement
Internal enhancement of masses can be described as homogeneous or heterogeneous. Homogeneous enhancement is confluent and uniform (Fig. 8). Heterogeneous enhancement is non-uniform with areas of variable signal intensity (SI) (Fig. 9). Heterogeneous enhancement can be further classified as rim (Fig. 10), dark internal septations (Fig. 11), enhancing internal septations (Fig. 12) or central enhancement (Fig. 13).

Figure 8. Homogeneously enhancing mass. Pathology – Stromal fibrosis.

Figure 9. Heterogeneously enhancing mass. Pathology – Infiltrating ductal carcinoma.
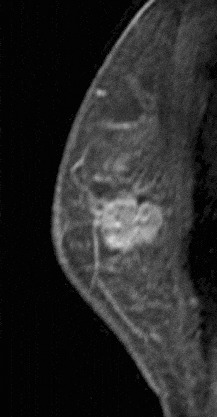
Figure 10. Rim-enhancing mass. Pathology – Infiltrating ductal cancer.

Figure 11. Dark internal septations. Pathology – Fibroadenoma.
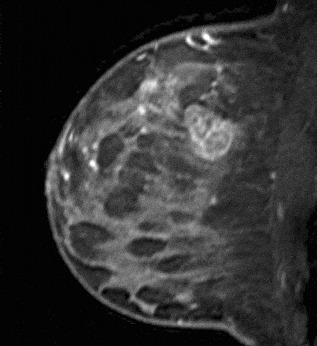
Figure 12. Enhancing internal septations. Pathology – Invasive ductal cancer.
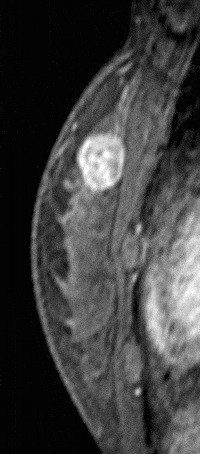
Figure 13. Centrally enhancing mass. Pathology – Invasive ductal cancer.
Homogeneous enhancement is suggestive of a benign process, however, again, in small lesions, one must be careful as spatial resolution may limit evaluation. Heterogeneous enhancement is more characteristic of malignant lesions especially if rim-enhancement is present.
Non-enhancing internal septations are classic for fibroadenomas though only 40% demonstrate this finding [6]. When present, masses can be considered benign with a high degree of certainty (>95% according to Nunes). Similarly, non-enhancing masses are also likely benign fibroadenomas that have a high hyaline content. Other benign lesions include an inflammatory cyst that enhances peripherally and benign fat necrosis that can exhibit rim enhancement with central low signal indicating fatty content. These latter two lesions should be recognized as potential pitfalls in interpretation of ‘rim’-enhancing lesions. The cyst can generally be identified on a T2-weighted image and fat necrosis can often be recognized based on the patient’s history and mammographic findings.
Non-mass enhancement
If the enhancement is neither a focus nor mass then it is classified as non-mass-like enhancement. Non-mass enhancement is classified according to the distribution of the enhancement and can be described as linear–ductal (Fig. 14), linear-non-specific (Fig. 15), regional (Fig. 16), segmental (Fig. 17) or diffuse (Fig. 18). Linear enhancement is enhancement in a line. Ductal enhancement may also be linear but would correspond to one or more ducts in orientation and is suspicious for ductal carcinoma in situ (DCIS). Ductal-non-specific would not follow this pattern and is less suspicious for malignancy. Segmental refers to enhancement that is triangular in shape with the apex at the nipple and is suspicious for DCIS within a single-branching duct system. Regional enhancement is enhancement that does not correspond to a single-duct system, however, may be within multiple ducts.

Figure 14. Linear ductal enhancement. Pathology – Invasive ductal cancer.
Figure 15. Linear non-specific enhancement. Enhancing scar from reduction mammoplasty.

Figure 16. Regional enhancement. Pathology – Invasive carcinoma with mixed lobular and ductal features.
Figure 17. Segmental enhancement. Pathology – DCIS.
Figure 18. Diffuse enhancement. Inflammatory carcinoma.
Linear enhancement can be further described as smooth, irregular or clumped (Fig. 19). As with smooth masses, smooth linear enhancement is suggestive of a benign process. Irregular enhancement refers to any non-smooth enhancement and may be continuous or discontinuous. Clumped enhancement refers to an aggregate of enhancing masses or foci that may be confluent in a cobblestone pattern (Fig. 20). Linear enhancement is suggestive of DCIS especially if clumped or irregular.

Figure 19. Clumped enhancement. Pathology – DCIS.
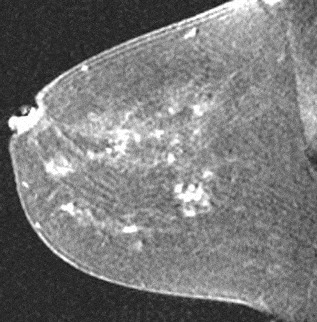
Figure 20. Clumped enhancement in a cobblestone pattern. Pathology – Pseudoangiomatous stromal hyperplasia.
Segmental, regional or diffuse enhancement can be further described as homogeneous, heterogeneous-stippled/punctate, clumped, septal/dendritic or non-specific. Stippled refers to multiple, often innumerable punctate foci that are approximately 1–2 mm in size and appear scattered throughout an area of the breast that does not conform usually to a duct system (Fig. 21). Stippled enhancement is more characteristic of benign normal variant parenchymal enhancement or fibrocystic changes. Regional enhancement and diffuse enhancement are more characteristic of benign disease such as proliferative changes although multicentric DCIS may have this appearance.

Figure 21. Diffuse stippled enhancement. Pathology – Fibrocystic change.
In a recent study by Liberman [7] 666 non-palpable, mammographically occult MRI-detected lesion were reviewed; the frequency of malignancy was found to increase significantly with lesion size (P < 0.0000001) and only 3% of lesions <0.5 cm were found to be malignant.
Kinetics
Enhancement kinetics are particularly helpful if the lesion has a benign morphologic appearance. Any suspicious morphologic feature should prompt biopsy and therefore, kinetic analysis in these cases, while interesting, is not necessary, as the decision to biopsy has already been made. However, in the case of a well-defined mass that could quite possibly be benign, enhancement kinetic data may help one decide whether biopsy is required or whether it is safe to recommend follow-up of the lesion.
In order to perform kinetic analysis, high temporal resolution is required so that multiple acquisitions can be obtained after the intravenous contrast bolus. At the time of this writing there is no uniform consensus on what the optimal time frame for each acquisition should be in order to capture dynamic data. In general, the time per sequential acquisition should be under 2 min. If breast MRI is performed in this manner, spatial resolution need not be sacrificed. As there is usually a trade-off between spatial and temporal resolution, an extremely rapid sequence that would provide excellent temporal resolution resulting in excellent dynamic data may be compromised with respect to the morphologic information of the lesion. Therefore, when choosing sequences to perform these examinations, a compromise between spatial and temporal resolution is necessary.
Kinetic techniques analyze the enhancement rate of a lesion. The SI in the region of interest is then plotted over time. Clearly, the more acquisitions obtained after intravenous contrast administration, the more points on the curve. Additionally, the faster the acquisition, the more potential information obtained about the curve. If multiple Regions of Interest (ROIs) are placed, the most suspicious curve should be reported. SI increase is measured relative to the baseline SI value:

where SIpre is the baseline SI and SIpost is the SI after contrast injection [8].
Kinetic techniques generate time/signal intensity curves (TIC). Computer-aided diagnosis systems are commercially available (Confirma/Cadstream and Invivo/Dynacad). Software applications can create angio maps and plot time curves. The information derived from these curves can be interpreted in several ways and there is no uniform consensus on criteria for malignancy. Some investigators have advocated the use of a threshold level for determination of malignancy [9]. Others have used the rate of enhancement [10] and yet others have looked at the initial enhancement relative to arterial enhancement [11]. While these criteria have proven to be useful in the individual investigators hands, there has been difficulty in reproducing the results.
Kuhl et al. [12] described three general types of curves that rely less on the absolute value of the enhancement than on the shape of the enhancement curve. A Type-I curve is continuous enhancement increasing with time (Fig. 22). A Type-II curve reaches a plateau phase where maximum SI is reached approximately 2–3 min after injection and the SI remains constant at this level. Type-III is a washout curve where there has been a decrease in SI after peak enhancement has been reached within 2–3 min (Fig. 23).
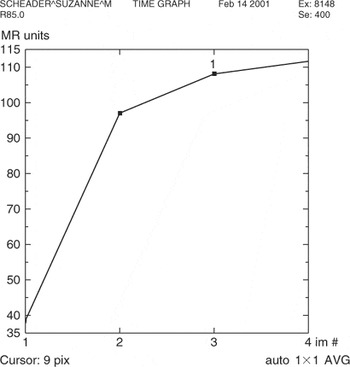
Figure 22. Type-I curve demonstrating persistent enhancement. Pathology – Fibroadenoma.
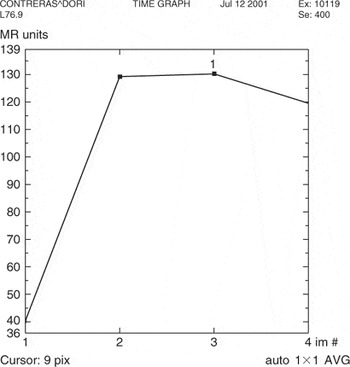
Figure 23. Type-III curve demonstrating washout. Pathology – Invasive lobular cancer.
As a general rule, benign lesions follow Type-I curve and malignant lesions follow a Type-III curve. A Type-II curve can be seen with both benign and malignant lesions. As with morphologic analysis, malignant lesions can exhibit benign kinetics and vice versa. Kuhl et al. [12] showed that 57% of malignant lesions demonstrated a Type-III curve and 83% of benign lesions showed a Type-I or -II curve. In a recent study by Bartella [13], a retrospective review was performed on 68 mammographically occult invasive cancers detected by MRI; only 38% had washout kinetics and the majority 59% had plateau kinetics. It is therefore important to carefully assess the morphologic features in lesions with plateau kinetics.
Predictive appearances
Benign disease
Certain specific morphologic features can be predictive of benign disease. Nunes et al. [6,14] reported that certain MR findings are predictive of benign disease such as smooth or lobulated borders (negative predictive value (NPV) for malignancy = 97–100%), absence of lesion enhancement (NPV = 100%), enhancement less than surrounding breast stroma (NPV = 93–100%) and absence of a lesion (NPV = 92%). The presence of non-enhancing internal septations in a smooth or lobulated mass is highly specific for the diagnosis of fibroadenoma (specificity 93–97%).
Malignant disease
Certain morphologic characteristics are very suggestive of malignancy. Findings that are highly predictive of malignant disease include spiculated margins (positive predictive value (PPV) = 76–88%) and rim enhancement (PPV = 79–92%) [6,14].
The strongest correlations that Nunes et al. [6,14] found between lesion appearance and pathologic findings were: smooth mass and fibrocystic change, lobulated mass with non-enhancing internal septations and fibroadenoma, enhancing irregular or spiculated mass and invasive ductal carcinoma, spiculated mass and invasive tubular carcinoma or radial scar, enhancing lobulated mass and medullary or colloid carcinoma, ductal enhancement and DCIS, and regional enhancement and DCIS.
Liberman et al. [15] found that features with the highest PPV for masses were spiculated margin, rim enhancement and irregular shape, and for non-masses segmental or clumped linear or ductal enhancement.
Suggested algorithm for interpretation
Initial evaluation of T2-weighted images is performed to determine if high-signal masses such as cysts are present. Bartella demonstrated that 20% of invasive cancers had high signal on T2-weighted images [13] so lesions with a high T2 signal that also subsequently enhance, may not be necessarily benign, and evaluation should be performed based on their morphologic and kinetic features. Evaluation of the non-enhanced T1-weighted images documents the presence of high-signal hemorrhagic or proteinaceous cysts as well as high signal within dilated ducts. Some solid lesions may have a high T1 signal; Bartella demonstrated that in a group of 68 MRI-detected invasive cancers, none had a high signal on the T1 pre-contrast images [13]. It is overall reassuring when solid mass has a high signal on the T1 pre-contrast images, but again, careful evaluation based on kinetic features, as demonstrated on subtraction images, and morphology should be performed. Ducts with high signal on the T1 pre-contrast images are extremely commonly seen. This usually is due to the presence of proteinaceous debris in ducts. Blood may also be of a high signal here; this may be relevant in patients being investigated for bloody nipple discharge. Careful evaluation of the subtraction images is warranted in these cases, as enhancement of ducts with a high pre-contrast signal, may only be confirmed on the subtraction images. Absolute stillness of the patient during scanning is needed here, as misregistration artifact limits accurate evaluation of ductal enhancement. The presence of ductal enhancement warrants correlation with mammography to exclude suspicious calcifications and biopsy.
The post-contrast T1-weighted images will demonstrate the presence of any enhancing masses or non-mass-like areas of enhancement. Morphologic analysis of the architectural features of a mass would then determine if the margins are irregular or spiculated, findings that would be highly suggestive of malignancy. At this point, biopsy would be recommended. A search for the mass by ultrasound may be helpful to allow percutaneous biopsy.
In the literature, the frequency of sonographic correlates for MRI-detected lesions warranting biopsy has ranged from 23% to 100% [16–18]. La Trenta et al. found that in the cancers with a sonographic correlate, 78% were invasive and 22% were DCIS; in the cancers without a sonographic correlate, 50% were invasive and 50% were DCIS. The frequency of cancer among MRI-detected lesions that have sonographic correlates was found to be lower compared with those that do not (43% vs. 14%, P = 0.01). In a recent study by Bartella [13], only 21% of invasive cancers detected by MRI had a sonographic correlate; therefore, suspicious MRI-detected lesions that lack sonographic correlates warrant biopsy.
If the mass demonstrates smooth margins and rim enhancement, as rim enhancement is highly predictive of malignancy, biopsy would be recommended in this case as well. Similarly, ductal enhancement that is irregular or clumped will be suspicious for DCIS and biopsy will generally result from this finding. The false positive causes of rim enhancement such as inflamed cyst and fat necrosis have been excluded. Inflamed cysts demonstrate high signal on a T2-weighted sequence. The enhancement of these smoothly marginated, usually round masses, is smooth and quite thick compared to the size of the lesion (Fig. 24). No follow-up is necessary in these cases, as these are benign. Fat necrosis typically demonstrates high-signal fat in the lesion on a non-fat saturated T1-weighted sequence (Fig. 25). Peripheral usually thin rim of enhancement (Fig. 26) may persist for several years. Again, no follow-up is necessary for these lesions.
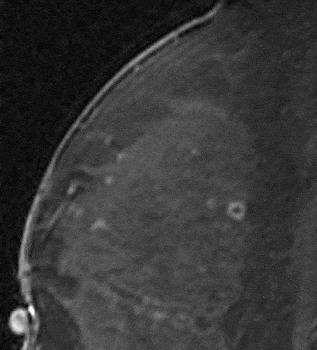
Figure 24. Inflammatory cyst demonstrating smooth thick rim enhancement. There was a high signal correlate on the T2-weighted sequence.

Figure 25. Fat necrosis typically with high signal on the non-fat saturated T1-weighted images.

Figure 26. Fat necrosis with rim enhancement.
If however the mass is homogeneously enhancing and demonstrates smooth borders, possibly representing a benign finding, kinetic analysis case can be extremely helpful. Kinetics can determine whether this is indeed likely benign (Type-I or -II curve) or possibly malignant (Type-III curve), prompting biopsy. It is important to note here that intramammary lymph nodes may present in this way (Fig. 27) and they typically washout. Careful examination of the location of the lesion (typically in the upper outer quadrant), correlation with the non-fat saturated T1-weighted sequence to look for the presence of fat in the lesion, correlation with the T2-weighted sequence which usually would demonstrate high signal and correlation with mammography or ultrasound may avoid such unnecessary biopsy. As a homogeneously enhancing smooth mass with a Type-I or -II curve has been reported in some malignant lesions, short-term follow-up in 6 months may be advisable, if this combination of findings is found to document benignity. Once stability over a year has been documented, the risk of carcinoma falls to <2%. In this high-risk patient population, the 6-month follow-up step is important, as it is well known that the cancers here tend to grow fast and a yearly follow-up recommendation may well fail to catch a potentially curable cancer at such a stage.

Figure 27. Enhancing reniform-shaped mass in the upper outer quadrant with a high T2-weighted correlate consistent with a lymph node.
Liberman et al. [19] performed a retrospective review of 367 asymptomatic, high-risk women with normal mammograms who underwent breast MRI examinations. Twenty-four per cent received a probably benign interpretation and short-interval follow-up MRI was recommended. Breast carcinoma occurred in 7–10% of these women. Both the short-interval follow-up and subsequent malignancy rates were higher in this group than the reported figures with mammography interpretations [20–23]. This was thought to be due to the high-risk population recommended for MRI evaluation, the nature of breast MR imaging which detects lesions with increased vascularity and a learning curve. Warner et al. reported that the MRI recall rates in their study, decreased substantially from 26% on the first round of screening to 13% on the second round and 10% on the third round [24]. This demonstrates the learning curve for the interpreting radiologist and the advantage of comparison with prior studies, once these are available. Like in mammography, the prevalent round results in a higher recall rate than the subsequent incident rounds.
For areas of non-mass-like enhancement, kinetic analysis may be helpful as findings such as regional enhancement can be found in both benign and malignant breast pathology, such as proliferative changes and DCIS. Again, if the distribution of the non-mass-like enhancement is suspicious, for example, focal nodular clumped, ductal or linear, biopsy would be prudent. Kinetic curves may have little use in stippled enhancement, as the tiny foci of enhancement are likely too small for accurate placement of an ROI. Correlation with the patient’s cycle may account for the presence of diffuse stippled enhancement therefore prompting to accurate timing of the subsequent studies during week 2 of the patient’s cycle. The presence of stippled enhancement does not warrant follow-up unless further areas of mild focal enhancement are seen.
Conclusion
Breast MRI has been shown to date to be of value in the high-risk population. Challenges in interpretation are present. Maintaining a high volume of examinations in dedicated centers definitely impacts positively on experience in interpretation. MR-guided intervention is a necessity in all diagnostic centers where breast MRI is performed. Guidelines in interpretation should be used in conjunction with optimum technique and by combining kinetic and morphologic information with clinical history and conventional imaging (mammography and ultrasound) findings, a recommendation for management can be made with more assurance.


