

I. Introduction
The European Union (EU) spends nearly 94% of its yearly budget on fiscal allocations to Member States (MS). The funds – which in the case of EU’s less developed states comprise nearly 80% of their public investment – aim to boost regional development and narrow the wealth disparities between the EU countries. The underlying expectation is that by stimulating socioeconomic outcomes, EU allocations will advance recipient states’ institutional effectiveness, reinforce EU values, and enhance democratic performance across Europe.
In practice, however, policy makers and constituents have increasingly linked the EU’s fiscal transfers to political corruption and institutional malperformance in recipient states – practices that, contrary to the funds’ intent, undermine democratic effectiveness and jeopardise the EU’s democratic consolidation. In 2008, the European Commission (EC) responded to new MS’ high-level corruption and improper administration of European funds by freezing nearly 500 million euros in farming and structural aid to Bulgaria and 28 million euros in agricultural aid to Romania.Footnote 1 Similarly, in 2012, the EC withheld 3.5 billion euros from Romania’s funding in response to irregularities in managing the human resources development sector.Footnote 2 The misuse of funds extends to the EU’s developed members as well. In 2008, Brussels addressed violations of the Common Agricultural Policy (CAP) rules by Italy, Greece and the UK by recalling 400 million euros.Footnote 3 France, Germany and the Netherlands were also implicated in the recall.Footnote 4
Citizens and policy makers in recipient countries have also voiced concerns about the misappropriation of EU funds. Anti-corruption protesters in Bulgaria, Poland and Romania question the proper use of fiscal inflows and support EU policies that ensure public service delivery and governance systems that fight corruption and the misallocation of public funds.Footnote 5 Concerns voiced by policy makers, opposition actors and citizens across Central and Eastern Europe suggest that EU fiscal transfers unintentionally reinforce corruption by expanding the discretionary resources available to political elites. This raises the question of how EU funds allocated to MS exhibiting varying degrees of corruption shape domestic politics and incumbent parties’ governing outcomes. Despite an established linkage between inefficient uses of EU funds and political corruption in recipient MS,Footnote 6 we know surprisingly little about how allocations to corrupt states affect domestic party politics and the political longevity of recipient states’ governing parties. While the development aid literature has devoted systematic due diligence and extended critical findings regarding the effect of foreign and development aid on the quality of developing states’ institutions, caution is needed when seeking to generalise these findings to EU countries – especially, given the variation in context and funding magnitudes between the world’s developing countries and EU states.
Systematic assessment of the impact of EU’s allocating policies on recipient states’ political corruption and domestic party politics is relevant for democratic theory and distributive policy. By examining whether and how EU funds are used by MS for personal and political rather than economic purposes, these findings advance our understanding of the efficiency of EU distributive policies and shed light on the factors underlying the rise of illiberal politics within the EU.Footnote 7 Hence, understanding this relationship helps explain the variation in the degree of effectiveness that EU fiscal policies have garnered in promoting EU democratic values and economic coherence across the organisation’s geopolitical space.
In this paper, I analyse whether EU transfers to MS deliver an electoral advantage to recipient countries’ governments, conditional on their degree of executive corruption.
I argue that greater EU allocations increase the likelihood of misallocation by corrupt recipient governments. Given their corruption tendencies, incumbents are more likely to expect electoral backlash, particularly in the presence of robust opposition.Footnote 8 Under these conditions, governments have greater incentives to engage in corruption compensation strategies – measures that allow corrupt incumbents to divert EU resources toward policies that appease their political networks and electoral bases (Shehaj 2020).Footnote 9 Consequently, rather than promoting balanced development and democratic values within the EU, greater funds to corrupt EU states boost corrupt incumbents’ competitive advantage over the opposition.
Examining data on EU allocations from 2000 to 2015, I empirically test my theory that incumbents in states with higher executive corruption gain a greater electoral boost than do their counterparts in less corrupt members. The results support my theoretical expectation that corrupt governments divert EU funds toward policies that increase electoral payoffs. Taking into account recipient states’ political corruption, this study contributes a theoretical and empirical understanding of how EU funds impact recipient MS’ internal electoral politics.
The article proceeds in the following manner. First, I assess the link between fiscal allocations, corruption, and governance from the perspectives of the development and Europeanisation literatures. I then discuss how the EU’s fiscal distributions serve as a corruption compensation mechanism for advancing governing parties’ competitive advantage. The third section presents an overview of the EU’s budget composition, while the following examines the case of Poland to illustrate the study’s theoretical expectations. Next, I examine data on EU fiscal allocations over the period of 2000 to 2015 and find that fiscal transfers to EU MS are correlated with higher electoral margins for incumbent parties in corrupt states. The study concludes with the political implications of the EU’s distributive politics and the significance of these findings for both democratic theory and distributive policy.
II. Distributive politics, corruption and governance
In the development literature, much research examines foreign aid and its link to target countries’ corruption, institutions and governance in Africa, Asia, or Latin America. Despite the different contexts, the dynamics that characterise the aid allocation process and the findings extended by the aid literature offer insight into the mechanisms whereby EU fiscal transfers impact patterns of political corruption and the domestic politics of recipient states. One hypothesis is that recipient states’ institutional performance and governance effectiveness shift in ways that optimize continuous flows of aid from donor states. The literature’s findings in terms of the direction of this shift, however, are mixed. While some works find no empirical support for the impact of aid on democracy,Footnote 10 others find that aid inflows can serve as resource rentsFootnote 11 , Footnote 12 that deteriorate the quality of target countries’ domestic institutions, rights and democratic governance.Footnote 13 , Footnote 14 , Footnote 15 ,Footnote 16
This general lack of consensus on a relationship between transfers, political corruption and democratic outcomes is echoed in the Europeanisation literature. Existing works focus primarily on the EU’s role in establishing practices and proceduresFootnote 17 that helped revamp the economic and institutional structures of the region’s less developed states,Footnote 18 particularly in the post-Cold War period.Footnote 19 , Footnote 20 One branch of the literature finds that under effective conditionality, monitoring mechanisms and credible threats of fund withdrawal by the EU,Footnote 21 the EU’s fiscal allocations shape the utility and policy choices of domestic elites in ways that promote institutional efficiency, human rights, democratic norms and economic growth across the region.Footnote 22 Extrapolating from the aid literature, this effect is likely to increase in the presence of effective rule of law policies and macroeconomic measures, including the level of trade openness, inflation and trade regulations that also reinforce recipient countries’ economic development.Footnote 23 Hence, when faced with credible threats of fund withdrawal from the EU, recipient countries’ elites are constrained in their ability to utilise EU funds for personal and political gain.
At the same time, research on the quality of government and citizens’ attitudes toward EU cohesion policy finds that where domestic institutions are perceived as corrupt, citizens prefer EU control over funds, even though corruption in EU-funded public contracting remains high in low-quality-of-government regions.Footnote 24 , Footnote 25 Recent works further show that conditionality has itself become fiscally and managerially driven. The budget, cohesion policy, and recovery spending are currently deployed as part of the EU’s rule-of-law protection toolbox, with access to resources tied to meeting governance and judicial milestones.Footnote 26 , Footnote 27 , Footnote 28 By linking fiscal disbursements and long-term budgetary support to these benchmarks, the European Commission signals that compliance with the rule of law is a precondition for drawing on European funds and resources.
Other works have examined the impact of EU funds on governance and patterns of political corruption in target states, particularly those of the ECE region.Footnote 29 Focusing on the type of investment sponsored by the funds and the degree of public discretion over said investment, scholars find that when EU allocations are invested in projects over which domestic actors and the public have high discretionary power, the likelihood of political corruption and ineffective governance in recipient states increases.Footnote 30 , Footnote 31 As the aid literature points out in other regions of the world, these tendencies are stronger in recipient states with a history of poor governanceFootnote 32 and ineffective institutions that further exacerbate the misallocation of external funds.Footnote 33 , Footnote 34 , Footnote 35 Under these conditions, rather than promoting regional growth and economic convergence within the region, EU funds provide a resource pool utilised by actors and political elites to extract rents and promote their personal and political interests.Footnote 36 , Footnote 37 As a consequence, misallocating tendencies threaten the EU’s economic and democratic norms by impinging on the recipient states’ political culture and, as observed in the developing, post-socialist states of Hungary and Romania, reaching the highest strata of political leadership.Footnote 38 Emergency-style governance in parts of the ECE region has concentrated power, weakened parliaments, and opened space for non-transparent uses of public resources, and similar dynamics across the Visegrád countries indicate a regional pattern that European Union instruments have not fully constrained. Read together with work on protecting the rule of law through spending conditionality, this shows that funds can still be disbursed even where courts, media or anti-corruption bodies remain only partly reformed, creating a structural vulnerability for post-communist MS that depend heavily on European structural and investment funds.Footnote 39 , Footnote 40
While current findings advance our understanding of the relationship between EU funds and corruption, the range of analysis is limited to the impact of fiscal transfers on corruption and does not engage with the question of how EU funds interact with recipient states’ corruption tendencies to shape party dynamics and the political survival of incumbent parties. Specifically, how does fund allocation to EU member states – taking into account the countries’ degree of executive corruption – affect the democratic outcomes of executives and political parties with allocating discretion? Additionally, how do these dynamics differ across the EU’s political space? The aid literature, for instance, finds that access to aid flows increases political competition and consolidates electoral support for newly elected leaders.Footnote 41 However, these findings offer insight into the longevity of individual politicians rather than parties, and their empirical scope covers developing countries with economic and political structures distinct from those of EU states. The Europeanisation literature, for its part, assesses the funds’ impact on patterns of political corruption in a subset of EU countries while inviting research into the question of how EU funds affect corrupt countries’ internal politics.Footnote 42
This article builds upon these works to contribute a systematic understanding of this phenomenon. I offer and empirically test a theory of corruption compensation that underlines the interactive, explanatory effect of EU funds and the degree of executive corruption in recipient states and find that incumbent parties in highly corrupt states enjoy a larger electoral boost from EU fiscal inflows than do those of less corrupt states. I present my theoretical rationale and hypotheses in the following section.
III. EU allocations & parties’ competitive advantage
Governing parties and political elites are driven by rational incentives to maintain political power and maximize the rewards associated with public office. These tendencies are especially strong in parties with corrupt dispositions, as their ability to access the state’s fiscal resources and continue accumulating desired payoffs requires maintaining political power. For instance, preserving power allows governing parties to use their privilege and resources to engage in clientelistic, principal-agent interactions with the electorate.Footnote 43 , Footnote 44 It also allows them to implement distributive policies that compensate voters for parties’ corruptive tendencies (Shehaj 2020) and appease particular electoral groups in ways that enhance corrupt incumbents’ electoral returns.Footnote 45 , Footnote 46 , Footnote 47
That said, corrupt incumbents’ ability to achieve their optimal outcomes diminishes when robust and organised opposition parties induce higher electoral accountability by providing voters with viable political alternatives.Footnote 48 , Footnote 49 Under these conditions, incumbent parties have incentives to invest in ensuring the loyalty of their close network and electoral base as a mechanism for consolidating power and securing their competitive viability over opposition forces.Footnote 50 In doing so, corrupt incumbents can, for instance, rely on their supporting networks to recruit “brokers” who monitor the electorate’s behaviour and ensure parties’ continuous electoral support.Footnote 51 This form of corruption compensation is key to incumbents’ longevity, particularly when parties’ past practices of corruption and favouritism inform expectations of future benefits among their networks and politically aligned regions, as well as voters expecting trade-offs for parties’ political misconduct.Footnote 52 Hence, governing parties’ incentives to use EU fiscal flows to gain a competitive advantage over opposition forces increase even further when they are corrupt.
However, governing parties’ coalitions, which are stronger when parties initially take office, weaken over time.Footnote 53 These diminishing loyalties threaten incumbents’ electoral survival, particularly when their history of corruption may be used by opposition forces and the media to increase voter information and undermine incumbents’ electoral returns. Under these conditions, corrupt incumbents’ incentives to maintain their position increase even further: institutional power grants them greater access, fewer controls and greater distributive authority over the state’s budgetary resources, comprised significantly of EU fiscal inflows. In the absence of effective governance, rule of law and monitoring mechanisms,Footnote 54 , Footnote 55 corrupt incumbents’ ability to achieve these objectives and consolidate their position becomes a probable outcome.
I argue that under these conditions, incumbents’ ability to engage in corruption compensation with members of their personal and political network increases. These conditions foster a political climate where corrupt incumbents face limited constraints on their ability to misallocate European Union (EU) funds for purposes of rewarding their own networks, win the support of potential coalition partners, and implement policies that appease particular factions of the electorate. Even when EU bodies investigate and document abuses of EU subsidies, the combination of domestic judicial discretion, politically controlled procurement, and voter tolerance for clientelist benefits allows incumbents to keep accessing EU funds, turning them into partisan capital. In such settings, corruption around EU fiscal flows reflects not only an individual abuse but also a systemic regulatory and ethics risk that can reappear even when formal controls exist.Footnote 56 , Footnote 57 The EU can choose to withdraw the funds as a punishment mechanism. However, the process of downsizing MS’ fiscal flows calls for adjustments to the EU budget – a procedure that must be agreed upon by all national leaders unanimously. Thus, attempts to withdraw a particular illiberal state’s funds require the approval of other, potentially illiberal governments who themselves stand to lose access to EU funds by setting a precedent.
The EU retains several formal mechanisms for suspending, reducing or redirecting fiscal transfers in cases of mismanagement or systemic risk. During the period examined in this study, adjustments to MS’ fiscal flows were embedded within the broader budgetary framework of the Multiannual Financial Framework and governed by the Treaty on the Functioning of the EU, notably Articles 310 to 312, which require extensive intergovernmental agreement. As a result, enforcement relied heavily on political consensus, rendering fund withdrawal costly and often non-credible. Importantly, the adoption of Regulation 2020/2092 represents a later institutional response to these limitations, reinforcing the argument that earlier enforcement constraints created opportunities for the strategic misuse of EU funds.
Mutual veto expectations among illiberal governments therefore undermine the credibility of fiscal sanctions, reducing the deterrent effect of withdrawal threats.
Thus, leaders’ utility costs for engaging in corruption are low given the revenue streams of EU funds. This, in turn, diminishes their incentives to curb corruptive practices and increases their governing latitude over opposition forces. Given these dynamics, I expect EU fiscal transfers to boost the electoral shares of corrupt incumbent parties over the opposition in EU states.
Additionally, I expect the intensity of this effect to vary across the EU’s developed and developing states. Fiscal transfers, much like aid, serve as a sizable, non-taxable resource that incumbents as well as opposition and other factions compete over.Footnote 58 , Footnote 59 This is especially the case in the EU’s post-socialist states. While the EU’s better-performing economies accumulate the bulk of their financial revenue from trade and other domestic economic initiatives, the main source of income for the less developed, post-socialist economies is European funding, which finances up to 80% of their public investment.Footnote 60 Hence, the EU’s fiscal transfers comprise the largest resource pool from which the governing parties of post-socialist states can draw to engage in rewarding strategies that yield a competitive advantage over the opposition. In accordance with the above discussion, I offer the following hypotheses:
H1: Increases in the corruption tendencies of recipient states’ governing parties have a negative effect on parties’ governing shares.
H2: The electoral margins of governing parties in high corruption states increase when the amounts of the EU’s fiscal allocations also increase.
An important point to make regarding H2 is the issue of reverse causality. As argued in the aid literature, the direction of causality is an important concern when assessing the relationship between aid and development. For instance, does aid cause poverty, or is it the case that underdeveloped countries receive more aid to address poverty? When assessing the direction of causality between EU funds and corrupt governments, however, this is less of a concern. It is difficult to imagine that the EU would allocate greater resources to corrupt incumbents for the purpose of combating corruption. This reasoning is evident in the EC’s threats to freeze funds to Romania, the Czech Republic, Hungary and other corrupt members.
Prior to testing these expectations, I discuss the EU’s budget composition and briefly illustrate the theoretical mechanism in the case of Poland.
1. The EU’s budget composition & fiscal funds distribution
The EU fiscal budget constitutes a central mechanism through which resources are redistributed across MS with the stated objective of promoting economic convergence and territorial cohesion. Funded primarily through national contributions proportionate to gross national income, the EU budget allocates the majority of its expenditures to cohesion policy, agricultural support and investment-oriented development programs. These transfers represent a significant and predictable source of public financing for recipient governments, particularly in less developed and post-socialist MS.
While formal allocation formulas are administered by the European Commission, fiscal transfers are ultimately implemented through domestic institutions, including national ministries, regional authorities and implementing agencies that exercise substantial discretion over project selection, procurement and oversight. As a result, EU funds enter national political economies not merely as technocratic development instruments, but as large resource streams that interact with domestic governance structures and political incentives.
This institutional configuration is especially consequential in domestic contexts where executive oversight is weak and political corruption is high. Under these conditions, EU fiscal inflows attenuate domestic budgetary constraints, freeing national resources for politically targeted spending and enabling governing parties to leverage both European and domestic funds to consolidate electoral support. It is this interaction between the scale of EU transfers and domestic political control over their allocation that underpins the corruption compensation mechanism advanced in this study.
2. Poland: an illustrative case
Poland is selected as an illustrative case because it combines three analytically relevant features: large and predictable EU fiscal inflows, documented corruption risks in public administration and procurement, and partisan control over the domestic institutions responsible for allocating and managing funds. The case is intended not to suggest Polish exceptionalism, but to demonstrate the plausibility of the corruption compensation mechanism in a context where the theoretical conditions identified in this study are clearly observable.
Having joined the EU in 2004, Poland, a country marked by multiple cases of political and executive corruption,Footnote 61 has been among the EU’s most significant net recipients. In the mid-2010s, Poland drew approximately 13–14 billion euros annually – an amount well above its national contribution and consistent with the allocation logic of the 2014–2020 financial perspective.Footnote 62 These fiscal inflows were directed primarily toward infrastructure, modernisation, and regional development and, as shown in works examining the distributive and political effects of EU spending, created sizeable opportunities for domestic actors to steer resources toward preferred territories, sectors and networks.Footnote 63 , Footnote 64 , Footnote 65 Under the Civic Platform–Polish People’s Party coalition (2007–2015), these resources sustained a growth-plus-modernisation agenda, and in the 2011 election, the coalition secured 47.5% of the vote and 235 seats in the Sejm. Fragmentation among opposition parties produced a seat bonus for the governing coalition under proportional representation.
The 2015 election altered the political use of these European Union resources. Due to the d’Hondt rules and, crucially, to a high level of wasted votes on the left (the United Left fell below the coalition threshold), the Law and Justice party (Prawo i Sprawiedliwo, PiS) won 235 of 460 seats with only about 38% of the vote, becoming the first party since 1989 to govern alone. Once in office, the new government moved on two key fronts: First, it placed loyalists in ministries, voivodeship and regional authorities, and national implementing agencies that manage or co-finance EU-supported programs, thus tightening partisan control over who receives contracts, grants, investment and procurements. This is consistent with evidence that corruption and favouritism in public procurement in ECE frequently materialise at the level of contracting agencies and politically exposed management boards rather than only at the level of cabinet politics.Footnote 66 , Footnote 67 Second, PiS used the fiscal room created by EU–financed capital expenditure to introduce an electorally attractive domestic transfer, the Family 500+ programme, in April 2016. EU funds did not pay for Family 500 + directly; it paid for roads, local infrastructure and investment that would otherwise have absorbed national resources. By covering investment from EU sources, the government could redirect domestically raised revenues toward a large, visible, and clientelist-friendly social benefit that disproportionately rewarded the party’s rural and lower-income electorate.Footnote 68 , Footnote 69
The 2018 scandal surrounding the chair of the Polish Financial Supervision Authority (Komisja Nadzoru Finansowego, KNF) bears mentioning here not because the KNF allocates EU cohesion funds – it does not – but because it revealed the government’s willingness to place politically trusted individuals in high-discretion oversight bodies and the ease with which such appointments are leveraged for rent-seeking. Considered together with evidence on corruption risks in EU-funded contracting, the case underscores a broader point: an executive that is ready to politicise financial supervision is unlikely to leave unpoliticised the agencies that actually sit on or intermediate EU fiscal flows.
Poland has experienced high-profile corruption episodes under governments of various partisan colours, from the early 2000s to the post-2015 period, which supports the view that opportunities for misallocation are structural rather than partisan accidents.Footnote 70 , Footnote 71 What is distinctive about the 2015–2019 configuration is the presence of three conditions: very large and predictable EU inflows, partisan control over the domestic institutions that channel those inflows, and the launch of a costly social transfer that could be narrated as “national” even though it was indirectly enabled by EU funds. These are the components of the mechanism extended in this study: when substantial EU transfers enter a system in which the governing party can staff the allocation chain, those transfers free up domestic fiscal resources for partisan distribution and strengthen, rather than constrain, the incumbent. The subsequent clash between Warsaw and Brussels over judicial independence and media pluralism, and the partial freezing of funds until rule-of-law milestones were restored, further confirms that these risks were material and recognised at the EU level.
IV. Research design
To assess how European Union (EU) disbursements shape domestic party politics and the competitive advantage of recipient countries’ governing parties, I concentrate my analysis on twenty-six EU MS from 2000 to 2015.Footnote 72 These countries share common institutional structures while displaying distinct development trajectories. Their commonalities include EU-defined institutional and regulatory frameworks and participation in the EU’s legislative and executive bodies via elected representatives. Yet, they differ in terms of economic performance, democratic robustness and historical legacies – with several post-communist members, including Hungary, Poland, Romania, etc., lagging behind in economic growth and effective governance.
The empirical analysis focuses on the 2000–2015 period, as it captures the expansion and consolidation of EU fiscal transfers prior to the introduction of formal rule-of-law conditionality mechanisms. This period allows for the examination of fund allocation dynamics under comparatively weak enforcement and monitoring constraints, providing a fitting context for testing the theory.
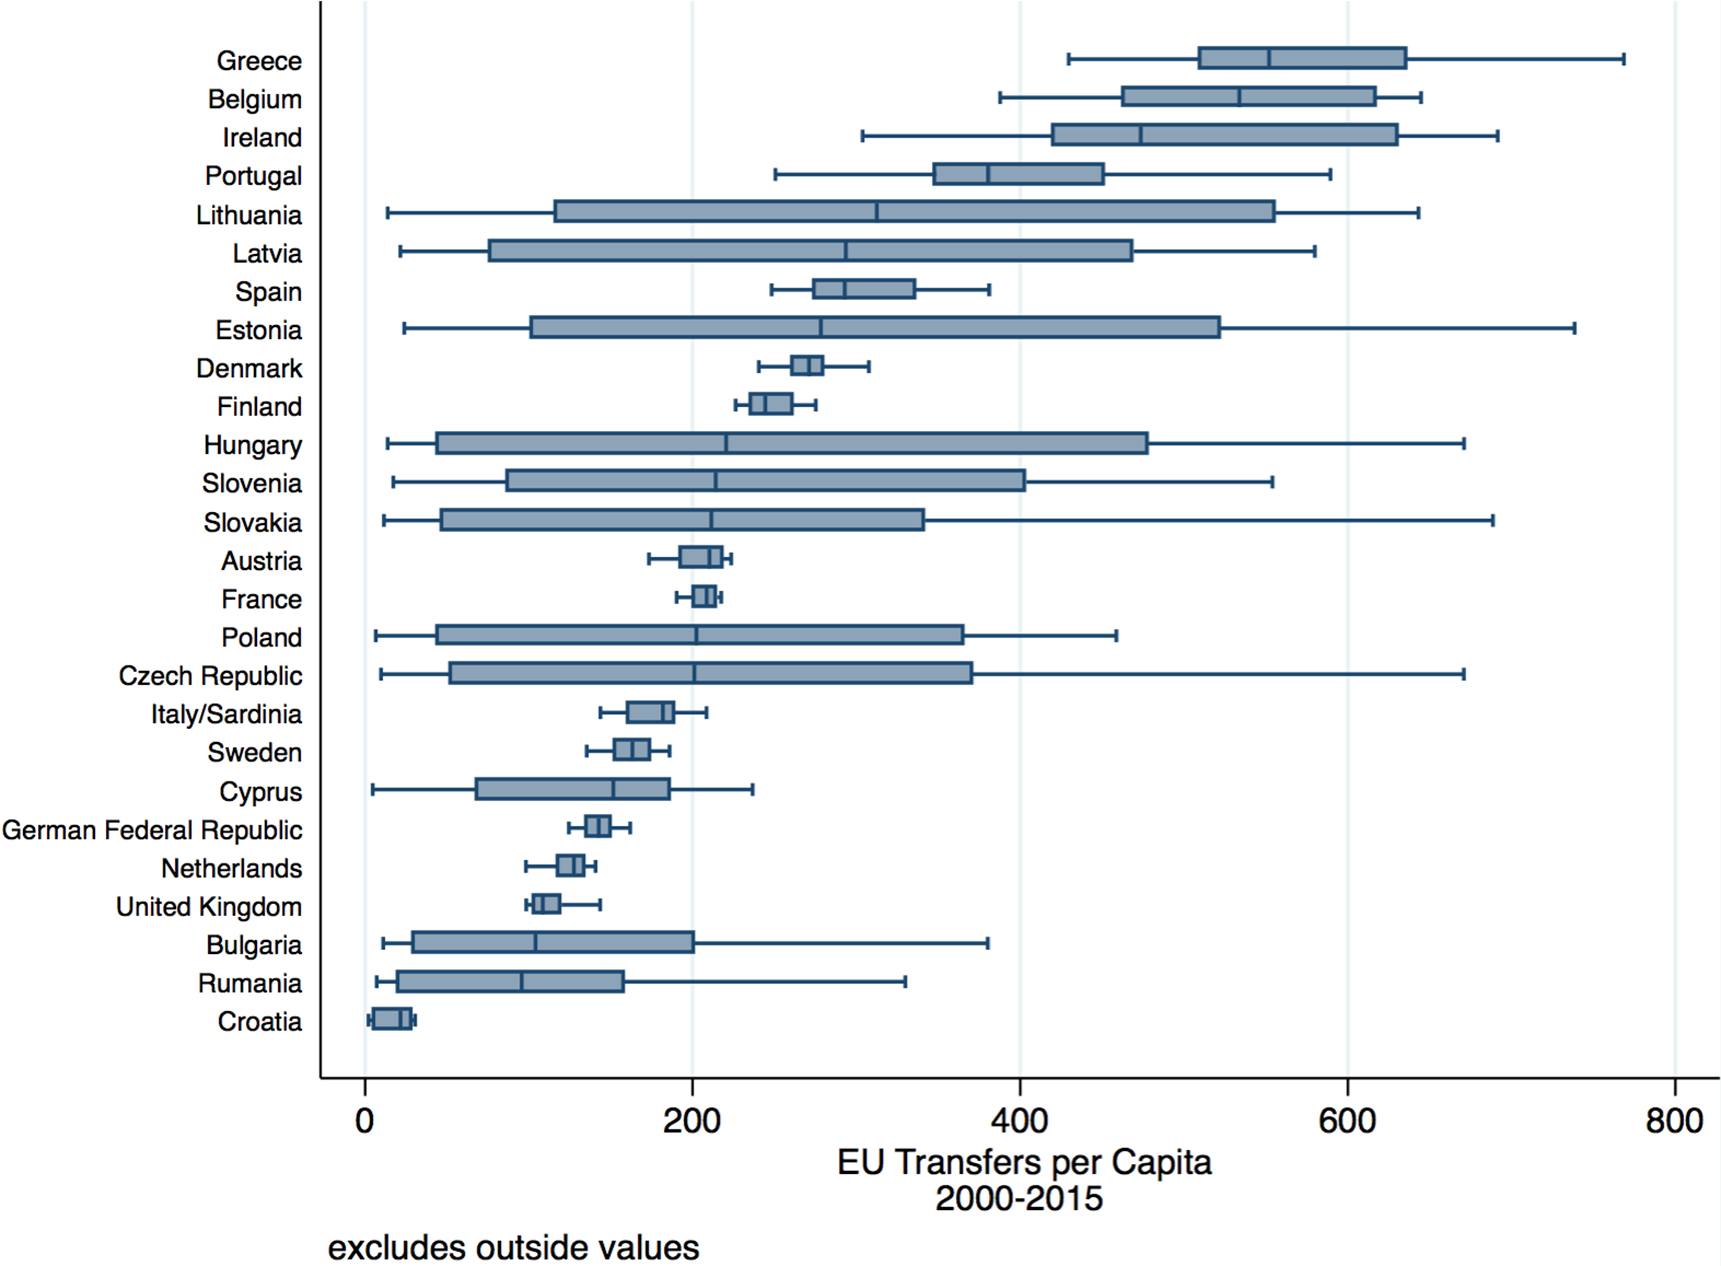
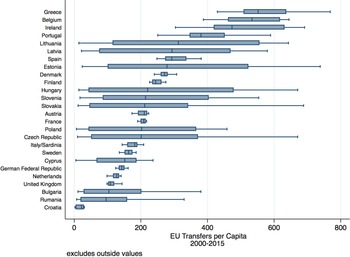
The countries under study differ along two main theoretical dimensions argued here to shape incumbent parties’ political gains – the amount of EU fiscal inflows and degree of executive corruption. As shown in Figure 1, the amount of EU funds per capita distributed to MS differs significantly across the region and over time. For instance, in 2015, Sweden received 150 euros per capita in EU disbursements, while Poland and Bulgaria received, respectively, 352 and 689 euros per capita (Figure 2).
EU transfers per capita (2000–2015).
Note: Distribution of EU Funds across member states during 2000–2015.
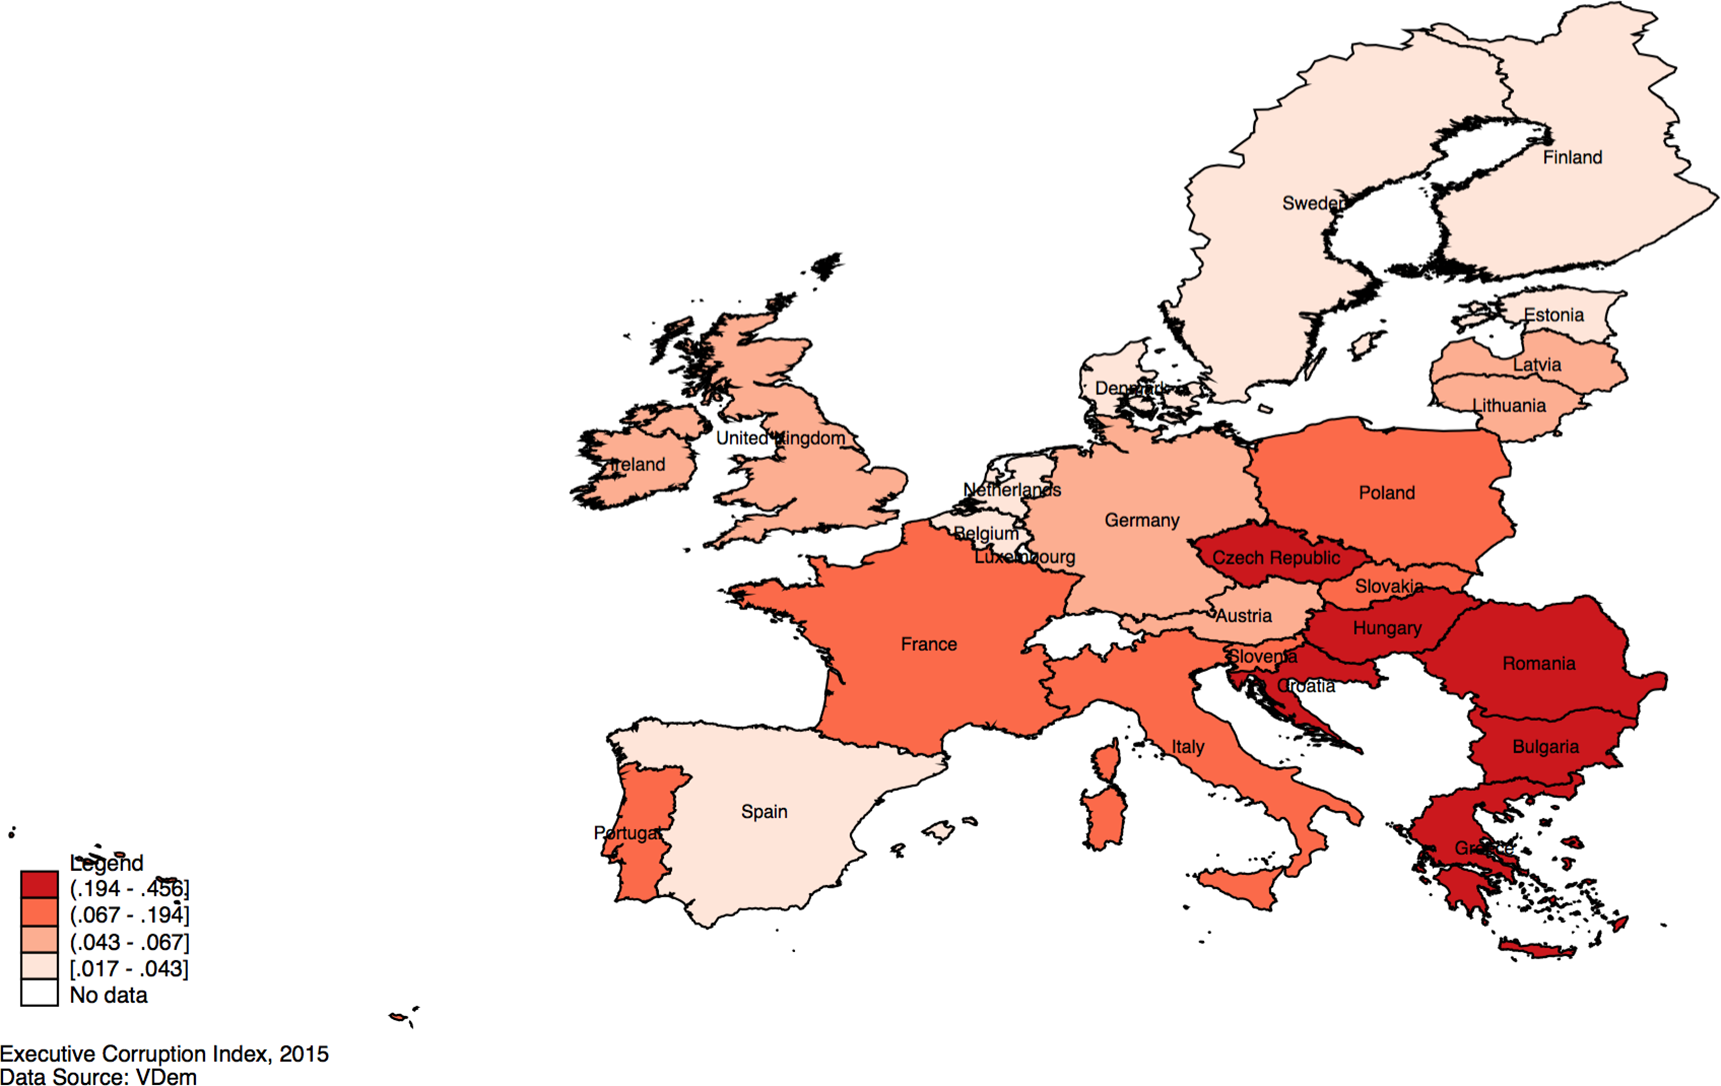
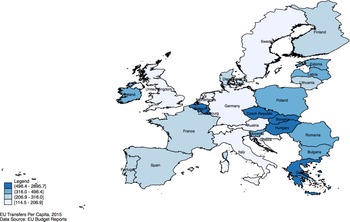
EU transfers per capita, 2015.
Note: The graph depicts the amount of EU allocations relative to the population of each recipient country in year 2015. Darker areas indicate greater EU funds per capita allocated to the recipient country.

Additionally, the countries under consideration demonstrate distinct patterns of political and executive corruption. Despite established monitoring mechanisms and uniform expectations of corruption controls and fiscal transparency by the EU, political and executive corruption is particularly high among the EU’s post-socialist members and reaches the highest executive ranks.Footnote 73 As captured in Figure 3 the post-socialist members display comparatively higher levels of executive corruption than do their Western counterparts.
Executive corruption index, 2015.
Note: The graph represents each EU member state’s Executive Corruption Index in 2015.
1. Dependent variable
My main expectation is that higher EU inflows to corrupt governments deliver a political advantage to incumbent parties over opposition forces. To capture this effect, the analysis focuses on the seat share of recipient states’ governing parties as the main outcome of interest. This variable captures the fraction of seats held by all government parties in country i during year t. The measure is calculated by dividing the total number of government seats by the total number of government plus opposition plus non-aligned seats.Footnote 74 The dependent variable remains constant in the years between parliamentary elections. Therefore, to take advantage of the variation in the outcome variable, I concentrate the analysis only on years during which parliamentary elections were held.
2. Explanatory variables
In accordance with my theoretical expectations, the main explanatory variable is the interacted effect of the total shares of fiscal flows distributed by the EU to national governments $\times$
the degree of executive corruption in recipient countries. I collect the data on EU transfers from the European Commission’s Budget Reports for the years 2000 to 2015. The transfers are distributed across several categories, including agriculture, structural, development, etc. My theory, however, is primarily focused on (1) the quantity of funds received by recipient states; and (2) access to the funds by governing parties. Thus, my interest lies less in the transfers’ intended policy objective and more in the total shares of fiscal flows available to the recipient countries’ governing parties. For this reason, I aggregate my measure of fiscal transfers across the various divisions of EU expenditure.
$\times$
the degree of executive corruption in recipient countries. I collect the data on EU transfers from the European Commission’s Budget Reports for the years 2000 to 2015. The transfers are distributed across several categories, including agriculture, structural, development, etc. My theory, however, is primarily focused on (1) the quantity of funds received by recipient states; and (2) access to the funds by governing parties. Thus, my interest lies less in the transfers’ intended policy objective and more in the total shares of fiscal flows available to the recipient countries’ governing parties. For this reason, I aggregate my measure of fiscal transfers across the various divisions of EU expenditure.
Consistent with the aid literature, I then calculate two different measures that capture, the short-term value of EU fiscal flows and the size of transfers received by MS: (1) fiscal transfers per capita and (2) fiscal transfers by government expenditure. In regard to the first, a contested feature of the EU’s redistribution mechanism as well as its decision-making system is the size of MS’ populations. MS with smaller populations are favoured by the EU’s institutional structure.Footnote 75 They are routinely over-represented in EU legislative bodies, including the Council of Ministers, and use their powers within the organisation to influence EU budget decisions and increase their fiscal inflows. I account for this empirically by constructing the share of fiscal flows per capita variable. The variable is calculated by dividing the total amount of expenditures that the EU allocates to state i in year t by the population of state i during year t, where, as indicated earlier, the amount of transfers allocated to state i over year t is the aggregate sum of all different categories of EU expenditure directed to country i in year t. Normalising the disbursement size by population accounts for the likelihood that smaller states that are over-represented in the European Council receive greater allocations by the EU.Footnote 76 , Footnote 77 Also, I measure the size and relative value of EU fiscal flows to each recipient country’s economy by taking the ratio of the funds allocated to state i in year t to the total government consumption of state i during year t. The distribution of this variable across EU states during the period 2000–2015 is presented in Figure A1.
The second component of the main explanatory variable is the Executive Corruption Index (ECI) of country i in year t. I obtain this variable from the VDem Dataset. The index is formed by taking the average of the point estimates from a Bayesian factor analysis model of the indicators for executive bribery and executive embezzlement.Footnote 78 These indicators provide a good estimate of the corruption practices of governing parties and elected executives. They are derived from responses to the question “How routinely do members of the executive or their agents grant favors in exchange for bribes, kickbacks, or other material inducements, and how often do they steal, embezzle, or misappropriate public funds or other state resources for personal or family use?” The data are in interval format, and their direction runs from less to more corrupt.
3. Control variables
The control variables account for factors plausibly associated with the study’s main explanatory and dependent variables – the share of EU funds, the degree of executive corruption, and the seat shares of receiving states’ incumbent parties. Previous research argues that countries with shared democratic norms and institutions are less likely to misallocate aid and external funds for political purposes. To account for these effects, I control for the degree of variation in recipient states’ political institutions. I obtain the data from the Polity IV dataset. The continuous (versus binary) nature of the Polity IV combined score allows me to effectively capture any changes caused by the inflow of fiscal transfers.Footnote 79 Equally important is the degree of effective governance in recipient states. Higher fiscal inflows to inefficient governments lead to higher corruption risks and fewer limits on incumbents’ opportunity to misuse fiscal flows for electoral gains. To account for this tendency, I control for government effectiveness in recipient states using WDI data.
Moreover, the politics of fiscal allocations and party outcomes differ among recipient countries based on their past experiences with democratic governing. Previous works show that history and previous institutions impact a society’s values, cultural norms, and social behavior.Footnote 80 , Footnote 81 These forces shape the domestic politics and current formal institutions of transitioning states.Footnote 82 , Footnote 83 , Footnote 84 I account for these effects by controlling for democracy duration, the data for which come from the Data Set of Political Regimes, and whether recipient countries have undergone a democratic transition in the post-1990s period. I code the variable for democratic transition by assigning it a value of 1 if country i underwent a democratic transition in the post-1990s period and 0 otherwise. The empirical analysis also includes controls for political stability and the rule of law – factors that influence the relationship between aid flows, corruption and party politics. Political stability strengthens the judiciary, which in turn promotes the rule of law. Under these conditions, the opportunity of domestic elites to misallocate aid and other external funds for personal and political purposes is constrained by legal bounds. The data for political stability and the rule of law are derived from the State Fragility Index and World Governance Indicators. Additional controls account for the robustness of civil societies and equal distribution of resources in recipient states. Similar to aid, EU allocations influence the political environment and civil societies in ways that promote dialogue among polarised actors, change their incentive structures, and affect citizens’ political behaviour and vote choices.Footnote 85 , Footnote 86 This political atmosphere may shape demands for an equal distribution of resources by active citizens informed about states’ fiscal inflows. Thus, robust civil societies relate to the efficiency of funds as well as incumbents’ outcomes. Hence, I control for robust civil societies and the equal distribution of resources, using VDem indicators.
Lastly, I control for election years by including a binary variable that takes on the value of 1 in legislative election years and 0 in the years between elections. The GDP (logged) of each target country i in year t is also included to account for the macroeconomic performance of recipient states.
Table A1 presents the descriptive statistics for all control variables.
4. Empirical strategy
To regress the dependent variable, seat shares of recipient states’ governing parties, $SeatShar{e_{it}}$
, on my main explanatory variables and their combined effect,
$SeatShar{e_{it}}$
, on my main explanatory variables and their combined effect, $ShareEUTransfer{s_{it}}$
,
$ShareEUTransfer{s_{it}}$
, $ExecutiveCorruptionIndex{(ECI)_{it}}$
, [
$ExecutiveCorruptionIndex{(ECI)_{it}}$
, [ $ShareEUTransfer{s_{it}}$ $\times $ $EC{I_{it}}$
], I use a pooled cross-sectional time-series ordinary least squares (OLS) analysis with country clustered standard errors. Formally, the model is as follows:
$EC{I_{it}}$
], I use a pooled cross-sectional time-series ordinary least squares (OLS) analysis with country clustered standard errors. Formally, the model is as follows: $\matrix{\rm{seatshar{e_{it}} = {\beta _0} + {\beta _1}{share{\left( {EUFunds} \right)}_{\it{it}}} + {\beta _2}ExecutiveCorruptionIndex{{\left( {ECI} \right)}_{\it{it}}}} \cr {\,\,\,\,\,\,\,\,\,\,}{\rm + {\beta _3}{{\left[ {share\left( {EUFunds} \right) \times \left( {ECI} \right)} \right]}_{\it{it}}} + {\beta _4}polit{y_{\it{it}}} + {\beta _5}In{{\left( {GDP} \right)}_{\it{it}}}} \cr \!\!\!\!\!\!\!\!\!\!\!\!\!\!\!\!\!\!{ + \sum\limits_{k = 6}^n {\left( {{\beta _k}ControlVariabl{e_{\left( {k - 4} \right),it}}} \right) + {\alpha _i} + {\mu _t} + {\varepsilon _{it,}}} } \cr } $
where ${\alpha _i}$
and
${\alpha _i}$
and ${\mu _t}$
denote country and year dummies, respectively, and
${\mu _t}$
denote country and year dummies, respectively, and ${\varepsilon _{it}}$
denotes the country-year error term. Given that incumbents’ vote shares remain constant in the years between elections, I only regress the portion of the sample during which legislative elections were held. This permits me to effectively capture variation, in the dependent variable, governing parties’
${\varepsilon _{it}}$
denotes the country-year error term. Given that incumbents’ vote shares remain constant in the years between elections, I only regress the portion of the sample during which legislative elections were held. This permits me to effectively capture variation, in the dependent variable, governing parties’ $SeatShar{e_{it}}$
. I also include in the analysis country and year fixed effects. Country fixed effects capture country-specific, time-invariant variables that associate with the dependent variable, while year fixed effects capture global factors that may affect incumbents’ seat shares in recipient state i during year t. The empirical strategy is designed to capture systematic cross-national relationships between fiscal transfers, executive corruption, and governing parties’ electoral outcomes, rather than to model country-specific trajectories. Descriptive figures and robustness checks illustrate cross-country variation, while more granular country-level analyses are left for future research. I report the empirical results in the following section.
$SeatShar{e_{it}}$
. I also include in the analysis country and year fixed effects. Country fixed effects capture country-specific, time-invariant variables that associate with the dependent variable, while year fixed effects capture global factors that may affect incumbents’ seat shares in recipient state i during year t. The empirical strategy is designed to capture systematic cross-national relationships between fiscal transfers, executive corruption, and governing parties’ electoral outcomes, rather than to model country-specific trajectories. Descriptive figures and robustness checks illustrate cross-country variation, while more granular country-level analyses are left for future research. I report the empirical results in the following section.
5. Empirical results
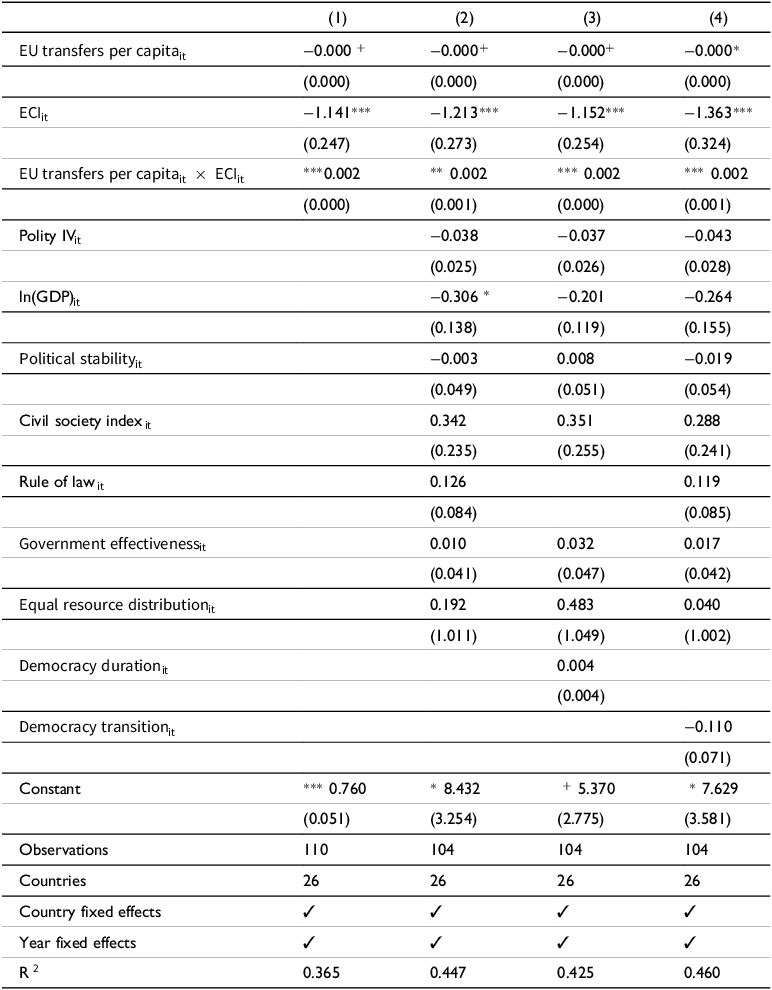
Table 1 presents regression estimates of the determinants of seat shares for incumbent parties in EU member states from 2000 to 2015. The measure for EU transfers in Models 1–4 is the amount of fiscal transfers per capita. The main parameter of interest in all presented models is ${\beta _3}$
, which captures the combined effect of [
${\beta _3}$
, which captures the combined effect of [ $ShareEUTransfer{s_{it}}$ $ \times $ $EC{I_{it}}$
] on the dependent variable, governing parties’
$EC{I_{it}}$
] on the dependent variable, governing parties’ $SeatShare{s_{it}}$
. A positive
$SeatShare{s_{it}}$
. A positive ${\beta _3}$
estimate corroborates the theoretical expectation that higher fiscal allocations to MS with high degrees of executive corruption are associated with increases in electoral margins for recipient states’ governing parties.
${\beta _3}$
estimate corroborates the theoretical expectation that higher fiscal allocations to MS with high degrees of executive corruption are associated with increases in electoral margins for recipient states’ governing parties.
Determinants of governing parties’ seat share

Note: This table portrays a pooled cross-sectional time-series ordinary least squares (OLS) analysis of the determinants of governing parties’ seat shares in year $t$
. Cluster-robust standard errors are shown in parentheses.
$t$
. Cluster-robust standard errors are shown in parentheses. $^{***}$
,
$^{***}$
, $^{**}$
,
$^{**}$
, ${{\rm{\;}}^{\rm{*}}}$
and
${{\rm{\;}}^{\rm{*}}}$
and ${{\rm{\;}}^ + }$
indicate statistical significance levels of 0.1, 1, 5, and 10%, respectively. All models include country and year fixed effects.
${{\rm{\;}}^ + }$
indicate statistical significance levels of 0.1, 1, 5, and 10%, respectively. All models include country and year fixed effects.
Model 1 captures a baseline estimate of the relationship between EU funds, executive corruption and incumbents’ seat shares. The coefficient on the executive corruption variable is highly significant (p = 0.001) and in the predicted negative direction. This suggests an inverse effect of executive corruption on governing parties’ seat shares, which corroborates Hypothesis 1. The direction of this effect shifts to positive – while maintaining its statistical significance – when recipient states’ ECI is interacted with the amount of EU funds per capita received by MS. These findings hold when additional governance and macroeconomic controls are added to the analysis. Models 2, 3 and 4 control for recipient states’ GDP (logged), Polity IV score, government effectiveness, rule of law and other indicators plausibly associated with the dependent and explanatory variables. Throughout all models, the ${\beta _3}$
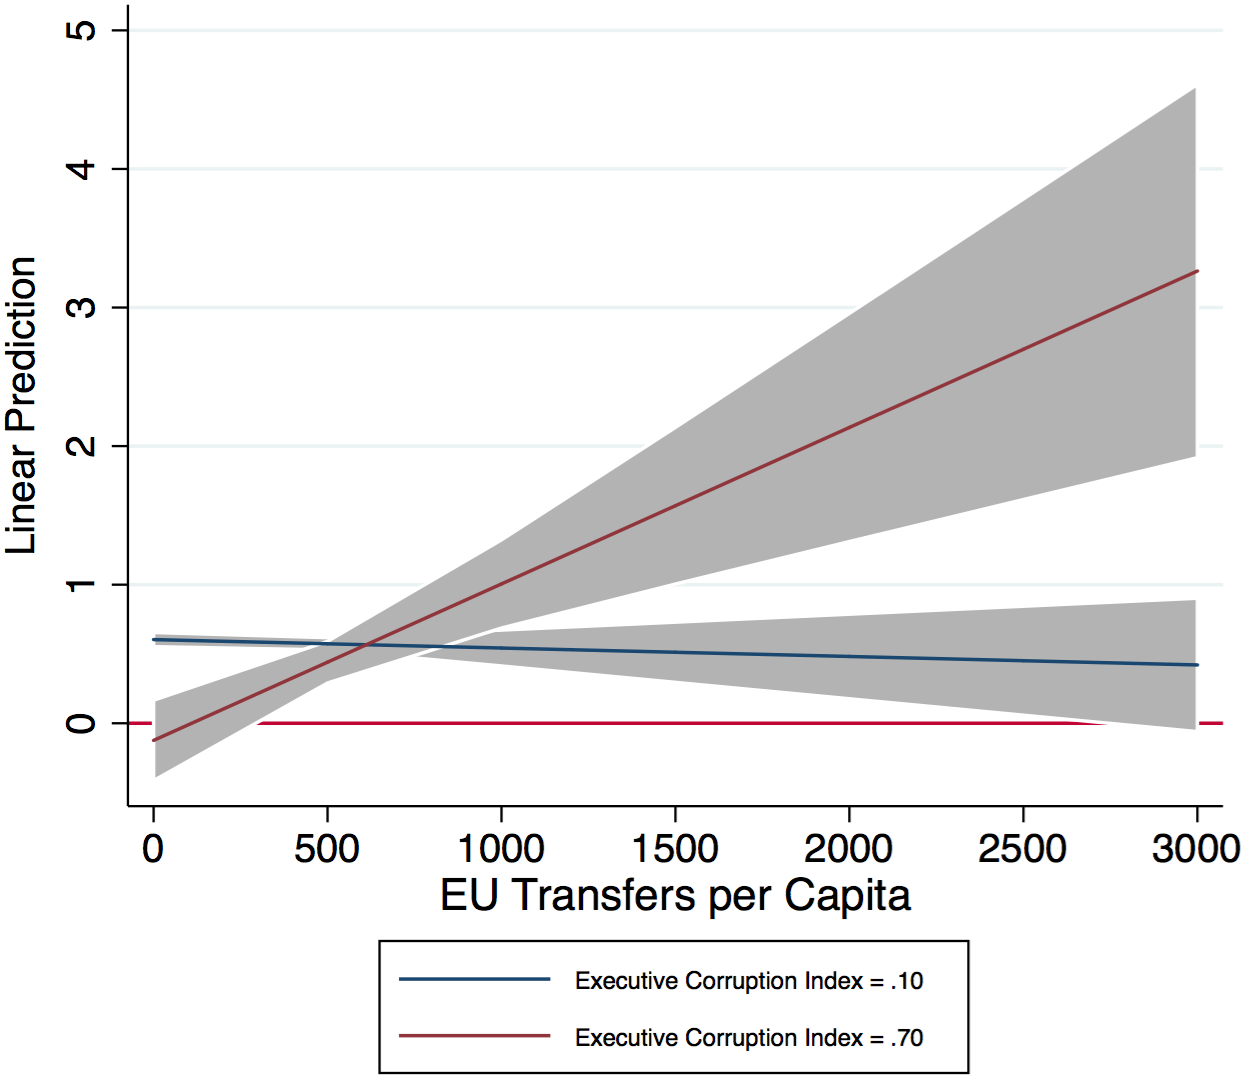
coefficient maintains its statistical significance and predicted, positive direction. These findings lend support to the expectation that higher fiscal flows to recipient states with high degrees of executive corruption have a positive effect on incumbent parties’ competitive advantage (Hypothesis 2). Figure 4 focuses on Model 2 to illustrate this relationship. As shown, the marginal effect of higher fiscal flows to corrupt MS has a positive effect on the seat shares of target states’ governing parties.
${\beta _3}$
coefficient maintains its statistical significance and predicted, positive direction. These findings lend support to the expectation that higher fiscal flows to recipient states with high degrees of executive corruption have a positive effect on incumbent parties’ competitive advantage (Hypothesis 2). Figure 4 focuses on Model 2 to illustrate this relationship. As shown, the marginal effect of higher fiscal flows to corrupt MS has a positive effect on the seat shares of target states’ governing parties.
Average marginal effects of EU funds (Model 2).
Note: The grey areas indicate 95% confidence intervals.
To further test the robustness of the findings, I replicate the results in Table 1 using the share of EU transfers to government expenditure as an alternative measure to test the effect of the interacted term on the dependent variable.
The results, presented in Models 5–8 in Table A2, show that the coefficient ${\beta _3}$
on the interacted term maintains its expected positive direction. As shown, while the size of the
${\beta _3}$
on the interacted term maintains its expected positive direction. As shown, while the size of the ${\beta _3}$
coefficient varies slightly across the models, the results remain relatively consistent and highly significant when controlling for other factors expected to be associated with the dependent and explanatory variables. In addition to the interaction term, the rule of law variable also has a positive and significant effect on incumbent parties’ seat shares. This effect supports the literature’s previous findings of a positive association between the rule of law, aid and domestic politics.
${\beta _3}$
coefficient varies slightly across the models, the results remain relatively consistent and highly significant when controlling for other factors expected to be associated with the dependent and explanatory variables. In addition to the interaction term, the rule of law variable also has a positive and significant effect on incumbent parties’ seat shares. This effect supports the literature’s previous findings of a positive association between the rule of law, aid and domestic politics.
Figure A2 further supports the positive, marginal effect of higher fiscal flows on the seat shares of recipient countries’ governing parties. The graph focuses on Model 6 to illustrate the marginal effect of EU transfers on incumbents’ seat shares across different levels of executive corruption. As shown, the marginal effect of EU transfers on incumbents’ seat shares increases in recipient states with high levels of executive corruption (ECI = .7) while remaining relatively stable in low-corruption recipients (ECI = .1). Thus, the positive effect of higher fiscal flows on incumbent parties’ competitive advantage appears to be a concern only when recipients’ governing parties show high executive and political corruption tendencies.
6. Robustness checks
To further test the findings’ robustness, I place my theoretical expectations under further empirical scrutiny. First, I measure the effect of the interacted term on the change in seat shares between government and opposition parties. I present these results in Tables A3 and A4. The common dependent variable in both tables is $\Delta [{({\rm{Government}}\,{\rm{Seats}})_{{\rm{it}}}} - {({\rm{Opposition}}\,{\rm{Seats}})_{{\rm{it}}}}]$
The main explanatory variable for Models 9 and 10 presented in Table A3 is the interacted term presented in Equation (1). For Models 11 and 12 presented in Table A4, the explanatory variable takes the form expressed in Equation (2). $[{({\rm{EU}}{\mkern 1mu} {\rm{Transfers}})_{{\rm{it}}}}{\rm{/}}{({\rm{Population}})_{{\rm{it}}}}] \times {({\rm{ECI}})_{{\rm{it}}}}$ $[{({\rm{EU}}{\mkern 1mu} {\rm{Transfers}})_{{\rm{it}}}}{\rm{/}}{({\rm{Gov}}{\mkern 1mu} {\rm{Spending}})_{{\rm{it}}}}] \times {({\rm{ECI}})_{{\rm{it}}}}$
As shown in Tables A3 and A4, the effect of the interacted term on the difference in seat shares between governing and opposition parties maintains the predicted positive direction and is significant at the 5% and 1% levels, respectively.
Second, I estimate the effect of the interacted term on the incumbents’ number of seats. I estimate this relationship by taking into account both different measures of fund allocations – that is, EU funds per capita (Table A5) and EU funds relative to government spending (Table A6). As in earlier tests, the interactive term maintains its predicted direction and statistical significance (at the 5% level).
Lastly, I assess whether fiscal transfers have a greater influence on governing parties’ political payoffs in the EU’s transitioning versus established democracies. This test is motivated by the variation in patterns of EU allocations and degree of executive corruption within the EU’s political space, as seen earlier in Figures 2 and 3. To test whether the effect of the interacted term on the governing parties’ seat shares varies across MS with distinct democratic experiences, I separate the countries into transitioning (post-communist states) and non-transitioning democracies. Transitioning democracies include all post-socialist member states of the EU.Footnote 87 The non-transitioning cluster includes all MS that have not undergone a change in political regime in the post-1990s period. This variable is coded 1 for the post-socialist states and 0 for the non-transitioning EU states. The results, presented in Table A7, show that the coefficients on the interacted term preserve the expected positive direction and statistical significance in the cases of both transitioning and non-transitioning states. In the case of the Western, non-transitioning democracies, the degree of significance declines slightly, although it still persists at the 1% level. These findings suggest that despite a recipient country’s democratic experience, higher fiscal inflows have a positive impact on incumbents’ vote shares, as long as the governing parties of recipient states demonstrate higher levels of executive and political corruption.
V. Conclusions
One of the primary objectives of the European Union (EU) is to narrow the wealth gap between its MS and to promote economic development across the region. Fiscal transfers made through the EU’s fiscal budget serve as a key mechanism for achieving these outcomes. Designed to promote economic and policy initiatives that boost recipient states’ economic performance, the funds’ long-term objective is to promote recipient states’ institutional effectiveness and advance the EU’s democratic values across the region. These expectations, however, are consistently challenged. The distinct patterns of economic growth among EU states point to continued economic disparities between the EU’s developed and developing states, including Bulgaria, Romania and other post-socialist members. In parallel with these developments, the rise of political corruption and authoritarian tendencies of governing parties in several EU states, particularly Hungary and Poland, further challenge the success of EU fiscal allocations in enhancing institutional performance and reinforcing democratic norms. The limited impact of EU funding and conditionality on forging long-term democratisationFootnote 88 , Footnote 89 has also been observed in non-EU-member recipient countries. For instance, in the Western Balkans and former Soviet republics, the capture of state institutions,Footnote 90 parliaments, and political parties by corrupt and clientelist networksFootnote 91 has allowed governing elites to use their position to cut the power resources of their political opponents.Footnote 92
These developments raise important questions about the ways in which EU fiscal allocations impact the domestic politics of recipient states. This article has sought to advance our understanding of this impact. It examines what happens to EU resources when allocated to systems where governing authorities control procurement, appointments and oversight. By following fiscal conditionality’s design to implementation, it shows that resources can still be channelled toward loyal networks, entrenching incumbents and diluting rule-of-law objectives. The analysis therefore both confirms the current move toward using financial tools for rule-of-law protection and adds the political warning that, in post-communist MS, such tools run the risk of empowering the very actors they are meant to discipline. In assessing the link between EU transfers, political corruption and the electoral outcomes of recipient states’ incumbent parties, this article has examined, both theoretically and empirically, whether fiscal funds allocated by the EU to its MS deliver an electoral advantage to corrupt incumbent parties. Whereas previous works have examined the effect of EU funds on political corruption in recipient states, my approach examines the impact of funds on incumbent parties’ political and electoral outcomes, taking into account the degree of executive corruption in recipient states. By analysing new data on EU fiscal allocations over the period 2000–2015, I have tested and confirmed my theory that fiscal flows to corrupt EU states deliver political latitude and an electoral advantage to recipient states’ governing parties.
These findings are relevant for purposes of both democratic theory and distributive policy. The aid literature finds that corrupt governments with underperforming institutions are equally likely to receive the same amounts of aid as their less corrupt counterparts.Footnote 93 Understanding whether funds allocated to the EU’s highly corrupt MS serve to promote or jeopardise the EU’s economic interests and democratic values is essential for the formulation of EU-level anti-corruption policies.
The implication is that recalibrating the EU’s allocation calculus to corrupt member states could undercut the political momentum of corrupt governing parties. Limiting the funds to corrupt MS would constrain governing parties’ ability to replenish their coffers and utilise the EU transfers as a resource pool for advancing personal, political, and policy objectives that garner voters’ electoral support.
These findings underscore the need for risk-aware fiscal governance within the EU. While cohesion policies remain key for addressing regional inequality, greater insulation of allocation channels from partisan control, enhanced monitoring of implementing agencies, and sequencing of disbursements help limit the unintended political reinforcement of corrupt incumbents. The EU’s evolving rule-of-law measures reflect growing recognition of these risks, yet the evidence presented here cautions that fiscal instruments can empower, rather than constrain, illiberal governance when institutional safeguards remain incomplete.
Building on these findings, further research should test the link between EU funds, political corruption, and governing parties’ political behavior, including authoritarian and populist tendencies. Examining the range of these influences will enhance our understanding of the continued disparities in patterns of economic and democratic developments across EU states. By providing insight into the source of challenges faced by the EU and its MS, these findings would serve as a foundation for policy remedies to control their proliferation.
Supplementary material
The supplementary material for this article can be found at https://doi.org/10.1017/err.2026.10085


 Open access