


Introduction
Public policy to mitigate climate change has long faced opposition from powerful business interests (Downie Reference Downie2019). One major explanation for business opposition points to the distributional effects of mitigation policies: they impose costs on firms. Consequently, carbon-intensive firms are more likely to oppose policy than less carbon-intensive ones (Colgan et al. Reference Colgan, Green and Hale2020; Genovese and Tvinnereim Reference Genovese and Tvinnereim2019). Yet, while climate policy entails costs for companies, it can also generate benefits in the form increased innovation, market opportunities, resource productivity, and reputation (Aghion et al. Reference Aghion, Dechezleprêtre, Hémous, Martin and Van Reenen2016; Ambec and Lanoie Reference Ambec and Lanoie2008; Dechezleprêtre and Sato Reference Dechezleprêtre and Sato2017; Porter and van der Linde Reference Porter and van der Linde1995). The challenge, however, is that the costs and benefits are not temporally aligned for a polluting company. Costs are borne today to comply with policy and transition the firm onto a low-carbon trajectory, while the associated benefits are enjoyed primarily in the longer term. The result is that climate policy confronts firms with an intertemporal trade-off.
We bring time into the study of business opposition to climate policy by theorizing the conditions under which firms can make this trade-off. To date, scholars have focused exclusively on the present-day distributional effects of climate policy on firms (Aklin and Mildenberger Reference Aklin and Mildenberger2020; Cory et al. Reference Cory, Lerner and Osgood2021; Downie Reference Downie2017; Genovese Reference Genovese2019; Meckling Reference Meckling2015). Business is seen as responding only to the short-term costs of policy sticks, such as carbon pricing or regulation. We shift the focus to an explanation centered on the intertemporal distribution of costs and benefits. A company’s climate policy preference depends on its ability to absorb short-term costs in pursuit of long-term gains. Our approach thus does not discount the role of short-term costs but rather expands the political theory of the firm to better fit the temporal structure of decarbonization policy.
To build our theory, we pay close attention to a rich literature in management studies on ownership, corporate governance, and time horizons. Scholars in this tradition have long been concerned with how investors vary in their degree of long-term orientation and the extent to which they pressure managers to maximize short-term profits (Hill et al. Reference Hill, Hitt and Hoskisson1988; Porter Reference Porter1992). By bringing these findings into political science, we show that this myopic market pressure translates into political behavior. When companies are owned by impatient capital providers, managers face intense pressure to deliver short-term profits at the expense of long-term gains, and are therefore unable to make the intertemporal trade-off required by climate policy. As a consequence, they oppose policy reform.
We consider three dimensions of impatient capital: stock markets, ownership concentration, and owner type. Managers of firms listed on stock markets face greater pressure to deliver short-term profits (Asker et al. Reference Asker, Farre-Mensa and Ljungqvist2015; Bernstein Reference Bernstein2022) and should therefore be more likely to oppose policy compared to their counterparts in privately held companies. Secondly, because capital tends to be more patient when ownership is concentrated in the hands of blockholders (Edmans Reference Edmans2009; Gourevitch and Shinn Reference Gourevitch and Shinn2005), we expect firms with blockholders to oppose climate policy less. Finally, certain types of owners tend to be more impatient than others (Deeg and Hardie Reference Deeg and Hardie2016; Jackson and Petraki Reference Jackson and Petraki2011). Firms owned by these impatient investors should oppose more.
We test our argument using the case of business opposition in the United States. We leverage the very high levels of polarization surrounding climate policy between the Democrats and Republicans between 2012 and 2020 and campaign contribution data to develop an original measure of firm-level climate policy opposition for energy-related companies. Using entropy balancing to match on observables and fixed-effects models, we find that ownership significantly shapes firms’ climate policy preferences. Publicly traded companies oppose climate policy more than observably similar privately owned firms. Across both public and private firms, those with high ownership concentration are less likely to oppose compared to observably similar firms with dispersed ownership. Amongst publicly traded companies, those owned by impatient investors, such as actively managed funds, and passive investors, such as Blackrock, Vanguard, or State Street, oppose policy more.
We test whether our proposed mechanism – time horizons – is driving the results by using shareholder payouts as a proxy for firm-level time horizons. Firms that make larger payouts to shareholders, in the form of dividends and share buybacks, are more focused on offering short-term financial rewards to their investors with no direct benefit for the long-term health of the firm (Lazonick and Shin Reference Lazonick and Shin2019). As expected, we find that higher shareholder payouts are associated with higher opposition.
To ensure that our results do not rely on our measure of firm-level opposition, we perform supplemental analyses of two additional corporate political behaviors: membership in anti-climate business coalitions (Cory et al. Reference Cory, Lerner and Osgood2021) and lobbying expenditure on climate-related issues. Our findings do not change. Across multiple measures of ownership and firm-level policy position, companies with impatient owners oppose climate policy more.
By highlighting the intertemporal trade-off at the heart of decarbonization policy, our paper brings time to the fore and builds on insights from management studies to contribute a new theory to the study of business and climate politics. Our approach shows how business opposition is shaped not only by the present-day distributional effects of policy (Colgan et al. Reference Colgan, Green and Hale2020; Cory et al. Reference Cory, Lerner and Osgood2021; Downie Reference Downie2017; Genovese Reference Genovese2019; Meckling Reference Meckling2015; Mildenberger Reference Mildenberger2020), but also the ability of polluting firms to make intertemporal trade-offs – absorb short-term costs today in pursuit of long-term gains. Furthermore, by emphasizing how ownership shapes firms’ time horizons, we highlight the critical role that capital markets play in shaping climate change politics. Finally, recent scholarship has explored how ownership – specifically domestic versus foreign – influences the way firms are treated by governments (Bayer Reference Bayer2023). Here we show that it also affects the way they behave towards governments.
More broadly, the paper advances our understanding of the microfoundations of long-term policy making. From education, pensions, and infrastructure to biodiversity loss and climate change, long-term societal challenges are everywhere (Finnegan Reference Finnegan2022; Hale Reference Hale2024). In addressing these policy problems, governments are confronted with intertemporal trade-offs: impose costs on society today for greater benefits in the future (Jacobs Reference Jacobs2011). Our findings explain how ownership institutions shape the preferences of firm managers over these types of policies, and therefore, why opposition to long-term policy varies across firms.
Our argument also has important cross-national implications. The aggregate ownership structure of an economy – and thus the patience of capital – tends to vary systematically across the high-income democracies due to institutions like corporate governance rules, tax law, and financial regulation (Deeg and Hardie Reference Deeg and Hardie2016; Hall and Soskice Reference Hall and Soskice2001). Some economies are more dependent on impatient, stock market capital while others are undergirded by patient capital from banks, families, and industrial foundations. As a result, governments in countries with more patient capital provision are likely to face less vociferous business opposition to stringent climate policy than those in countries dominated by impatient owners. While future research on cross-national variation is needed, this reasoning provides a complementary explanation for why, for example, Scandinavia and Germany, where patient capital has predominated, have tended to lead on climate policy since the 1980s (Finnegan Reference Finnegan2022).
Finally, our findings have implications for politics and policy. They raise questions about the role of financial investors in climate politics specifically and the role of corporate governance reform in long-term policy making more generally. We discuss these in the conclusion.
Corporate Ownership and Business Opposition to Climate Policy
The Intertemporal Trade-Off that Climate Mitigation Policy Entails
Businesses oppose climate policies that impose costs on them (Meckling Reference Meckling2011,Reference Meckling2015; Mildenberger Reference Mildenberger2020; Stokes Reference Stokes2020). Key factors that shape their opposition include the carbon-intensity of their assets (Colgan et al. Reference Colgan, Green and Hale2020; Downie Reference Downie2017; Meckling and Trachtman Reference Meckling and Trachtman2024), trade exposure (Genovese Reference Genovese2019), the stringency of policy (Genovese and Tvinnereim Reference Genovese and Tvinnereim2019), the relative carbon intensity of competitors (Kennard Reference Kennard2020; Meckling Reference Meckling2015), and their embeddedness in fossil fuel supply chains (Cory et al. Reference Cory, Lerner and Osgood2021).
These findings reflect a broader understanding of the ways in which the present-day distributional impact of policy on companies’ profits shapes their preferences on environmental policy and beyond (see, for example, Falkner Reference Falkner2008; Gourevitch Reference Gourevitch1986; Martin Reference Martin1995; Prakash Reference Prakash2000; Rogowski Reference Rogowski1989). Managers tend to oppose policies that increase costs, and, conversely, tend to support policies that increase profits. Studies in international political economy have analyzed how factor endowments and sectoral differences influence material gains to business from trade, foreign, and macroeconomic policy, and therefore shape their political positions (see, for example, Rogowski Reference Rogowski1989). Welfare state scholars have pointed out how business preferences on social policy are shaped by the extent to which such policies impose costs or generate benefits (see, for example, Hacker and Pierson Reference Hacker and Pierson2002; Martin Reference Martin1995; Pierson Reference Pierson1996).
What has received less attention, however, is the way in which the temporal structure of policy shapes business’ political behavior. In the case of climate change, policy reforms tend to be long-term policy investments that impose short-term costs on society today in order to generate greater future benefits (Finnegan Reference Finnegan2022,Reference Finnegan2023; Hale Reference Hale2024; Jacobs Reference Jacobs2011). Importantly, we argue that this intertemporal trade-off occurs at the level of the firm itself. Firms incur short-term costs to comply with policy and to adjust to a low-carbon future, while over the long term, as we move towards a decarbonized economy, they can benefit from improved market performance as a result of reduced costs and greater revenues.
Before we discuss these costs and benefits in detail, it is important to point out that we aim to explain opposition to climate policies that impose costs on business, as opposed to policies that offer only ‘carrots’ (for example, subsidies). As such, we theorize firm behavior towards cost-imposing policies, notably regulation and market-based policies. The primary cost-bearing group is energy- and emissions-intensive firms (what we call ‘polluting firms’), which have historically been the most significant opponents.
Climate policy requires polluting companies to bear costs as they invest in regulatory compliance. This includes investments to decarbonize their production processes and products, including investments in R&D, the adoption of cleaner technologies, hiring of new staff, retooling factories, and developing zero-carbon products. Additionally, there are costs associated with investments in environmental management processes – such as carbon accounting and reporting.
At the same time, these investments over the short run can generate long-term benefits by improving market performance. Here, we draw on a large literature in management and economics that shows how investments undertaken to comply with environmental regulations can generate future benefits by reducing costs and increasing revenues (Ambec et al. Reference Ambec, Cohen, Elgie and Lanoie2013; Ambec and Lanoie Reference Ambec and Lanoie2008; Dechezleprêtre and Sato Reference Dechezleprêtre and Sato2017; Porter and van der Linde Reference Porter and van der Linde1995). Investments can generate innovation in the production process that leads to higher resource productivity, input savings, and profits – referred to as the Porter Hypothesis (Porter and van der Linde Reference Porter and van der Linde1995). Evidence suggests that environmental policy can increase firms’ multifactor productivity and resource efficiency, which in turn has a positive impact on profitability (Albrizio et al. Reference Albrizio, Koźluk and Zipperer2014; Rexhäuser and Rammer Reference Rexhäuser and Rammer2014). Furthermore, a greener business model can reduce the cost of capital by reducing a firm’s climate transition risks, which arise from policy shifts and new technologies, and physical climate risks associated with extreme weather events (Gianfrate et al. Reference Gianfrate, Schoenmaker, Wasama, Sundaram and Hansen2023). Finally, investments can improve a firm’s reputation and reduce future costs associated with external stakeholders, such as government, environmental groups, the media, and the public. This can take the form of, for example, less costly compliance with future regulation, fewer fines and less litigation, less likelihood of suffering a boycott, and quicker approvals from government and communities to build or expand facilities (Ambec and Lanoie Reference Ambec and Lanoie2008; Minor and Morgan Reference Minor and Morgan2011). Indeed, maintaining a good reputation and social license to operate is important, as the public is increasingly concerned with climate change (Shapira Reference Shapira2015).
Turning to revenue growth, climate policies can increase future revenue by stimulating innovation that enables firms to expand into growing markets for green products and services, such as renewable electricity, hydrogen, electric vehicles, green metals, and minerals for clean technologies. Studies find that carbon pricing has caused firms to innovate more in clean technologies, enabling them to expand into markets for low-carbon products (Aghion et al. Reference Aghion, Dechezleprêtre, Hémous, Martin and Van Reenen2016; Calel and Dechezleprêtre Reference Calel and Dechezleprêtre2016). A low-carbon business model can also give firms access to new segments of market demand, such as environmentally conscious consumers and green public procurement contracts (Ghisetti Reference Ghisetti2017). Finally, expansion into green markets can simply mean that a firm stays in business as the entire technology ecosystem changes, such as the shift from the internal combustion engine to electric vehicles.
In principle, all firms, even fossil fuel producers, can transition to low-carbon products and services through either investment in technological substitution or economic diversification. Technological substitution means that clean technologies replace dirty technologies (Kelsey Reference Kelsey2018; Kupzok and Nahm Reference Kupzok and Nahm2024). Currently, this is occurring in sectors like electricity generation (for example, through adoption of renewable energy), automobiles (for example, electric vehicles), and steel (for example, electric arc furnaces). In the absence of technological substitutes, firms can diversify into adjacent low-carbon lines of business. Fossil fuel producers are pursuing this path by exploring renewables, hydrogen, geothermal energy, and the mining of critical minerals for clean technologies (Shojaeddini et al. Reference Shojaeddini, Naimoli, Ladislaw and Bazilian2019).
The magnitude of future benefits is likely to vary across firms and sectors. For instance, reputational risks may be higher for firms in consumer-facing sectors compared to those in business-facing sectors (Bullock and van der Ven Reference Bullock and van der Ven2020). Similarly, market opportunities vary across firms and sectors. For firms in carbon-intensive sectors, increased revenue from future market opportunities may not always outweigh short-term costs. For example, dirty technologies often generate greater profit margins than clean technologies (Christophers Reference Christophers2024). However, when the future benefit is the firm’s survival, it should outweigh short-term adjustment costs. This is the case when policy and market environments no longer allow firms to offer carbon-intensive products and services. There is substantial uncertainty as to when this will be the case in a given sector, and it likely depends on technology, market, and policy trends. Automakers, for instance, have realized that investing in electric vehicles is essential for future survival in a global auto market with a new technology paradigm and growing carbon constraints (Vormedal and Meckling Reference Vormedal and Meckling2024). Steel, chemical, and cement companies, by contrast, are not yet at this point, but will likely be soon. The magnitude of the future benefits of corporate decarbonization thus grow over time as sectors and economies decarbonize. In this way, the intertemporal trade-off of climate policy arises for firms at different points in time along the low-carbon transition.
There are two sets of firms for which climate policy poses no intertemporal trade-off. The first set are pure-play clean technology companies. They benefit from climate policy both in the short and long term as it increases demand for their products and services. The second are those that face short-term costs substantially lower than those of their competitors, thus gaining a competitive advantage (Kennard Reference Kennard2020; Meckling Reference Meckling2015). Both of these types of firms would be expected to support climate policy. They are, however, likely the minority of politically active firms in climate politics. Research shows that business opposition is pervasive across broad sectors of the economy (Cory et al. Reference Cory, Lerner and Osgood2021), indicating that most polluting firms face short-term costs.
Corporate Ownership and Firms’ Time Horizons
When should firms be able to undertake the intertemporal trade-off that climate policy requires? Scholars of management and comparative political economy (CPE) have long argued that corporate ownership shapes the degree of short- versus long-term orientation of firms’ market behavior. Owners can supply firms with patient or impatient capital (Culpepper Reference Culpepper2005; Deeg and Hardie Reference Deeg and Hardie2016; Gourevitch and Shinn Reference Gourevitch and Shinn2005; Hall and Soskice Reference Hall and Soskice2001). Patient capital is ‘equity or debt whose providers aim to capture benefits (both financial and otherwise) specific to long-term investments and do not exit their investment or loan if … managers do not respond to short-term market pressures’ (Deeg and Hardie Reference Deeg and Hardie2016, 629). In this way, patient capital shields managers from ‘the need to react to the short-term vicissitudes of financial and product markets or to focus on short-term financial gains at the expense of long-term gains’ (Deeg and Hardie Reference Deeg and Hardie2016, 629). Conversely, impatient capital puts pressure on managers to produce short-term returns, as these are both more immediate for investors and more certain compared to long-term returns (Laverty Reference Laverty1996; Shelley Reference Shelley1994), and exits if profit expectations are not met. Management scholars have uncovered broad patterns of capital patience, identifying three sources of variation: public versus private markets, concentrated ownership versus dispersed ownership, and specific owner type.
First, public capital markets tend to provide firms with impatient capital, and as a result, managers of publicly listed companies tend to be more short-term oriented than their counterparts in privately held companies (Asker et al. Reference Asker, Farre-Mensa and Ljungqvist2015; Bernstein Reference Bernstein2015,Reference Bernstein2022; Gajurel Reference Gajurel2021). There are a number of structural features of stock markets that foster short-termism, including the shareholder-value model of the firm, which views maximizing the wealth of shareholders as the overriding objective of managers and corporate governance (Lazonick and Shin Reference Lazonick and Shin2019), as well as the arm’s length relationship investors have to companies rather than a commitment to any one’s long-term performance (Gourevitch and Shinn Reference Gourevitch and Shinn2005; Hall and Soskice Reference Hall and Soskice2001).
Though, as mentioned above, perhaps the most consequential is the threat of investor exit. The high liquidity of stock markets means that investors dissatisfied with short-term financial results can sell their shares and exit the firm quickly (Bourveau et al. Reference Bourveau, Li, Macciocchi and Sun2023). Managers fear this market punishment because it reduces the share price, which can mean less pay (as pay is often tied to the share price), removal by the board, and a hostile takeover and restructuring. In response, managers strive to meet or beat earnings expectations to boost stock prices, their pay, and their careers (Coates et al. Reference Coates, Davis and Stacey1995; Graham et al. Reference Graham, Harvey and Rajgopal2005; Matsunaga and Park Reference Matsunaga and Park2001; Shin Reference Shin2012). To hit expectations, managers have been shown to reduce investment in the near term (Almeida et al. Reference Almeida, Fos and Kronlund2016).
A second dimension of capital patience is ownership concentration. Capital tends to be more patient when ownership is concentrated in the hands of blockholders – owners with a large number of shares (Culpepper Reference Culpepper2005; Deeg and Hardie Reference Deeg and Hardie2016; Gourevitch and Shinn Reference Gourevitch and Shinn2005; Hall and Soskice Reference Hall and Soskice2001). Given their large stakes, blockholders (who tend to also be board members, directors, and managers) have an incentive to invest in a close relationship with the firm (Edmans Reference Edmans2014; Gourevitch and Shinn Reference Gourevitch and Shinn2005). They gather information about its fundamental value and can know whether reduced profits in the short run are the result of a desirable long-term investment or poor management (Edmans Reference Edmans2009; Edmans and Holderness Reference Edmans, Holderness, Hermalin and Weisbach2017). If it is the former, the blockholder can attenuate stock price decline by holding the stock. If it is the latter, blockholders can exert influence over managers using voice rather than exit. The result is that managers are better insulated from market pressures and can seek to invest in long-run growth rather than focus exclusively on short-term profits (Aghion et al. Reference Aghion, Van Reenen and Zingales2013; Edmans Reference Edmans2009).
The third dimension is owner type. Certain types of owners tend to be more patient than others (Deeg and Hardie Reference Deeg and Hardie2016; Jackson and Petraki Reference Jackson and Petraki2011). Actively managed funds, hedge funds, and investment banks tend to be the most impatient as they themselves are under intense pressure from their clients to perform each quarter (Bourveau et al. Reference Bourveau, Li, Macciocchi and Sun2023; Bushee Reference Bushee2001; Chaganti and Damanpour Reference Chaganti and Damanpour1991; Deeg and Hardie Reference Deeg and Hardie2016; Hansen and Hill Reference Hansen and Hill1991; Jackson and Petraki Reference Jackson and Petraki2011). When these owners predominate, CEO turnover is higher as managers are fired for underperformance (Goyal and Low Reference Goyal and Low2019) and companies invest less in R&D (Bushee Reference Bushee1998), have lower patent activity (Agarwal et al. Reference Agarwal, Vashishtha and Venkatachalam2018), and downsize more frequently (Jung Reference Jung2015). At the other end of the spectrum are patient owners like families, foundations, relationship banks, and the state. Family-owned firms tend to have longer-term orientations (Kappes and Schmid Reference Kappes and Schmid2013; Miller et al. Reference Miller, Breton-Miller and Scholnick2008) and are more likely to tolerate short-term losses in pursuit of longer-term goals (Alessandri et al. Reference Alessandri, Mammen and Eddleston2018). Similarly, firms owned by independent non-profit organizations, such as industrial foundations, display more long-term oriented business behavior (Thomsen et al. Reference Thomsen, Poulsen, Børsting and Kuhn2018).
There is debate as to where passive asset managers fit along the capital patience spectrum. Because they cannot sell shares as long as a firm is part of an index, they cannot exit if short-term earnings disappoint. For this reason, some argue they are permanent owners that provide patient capital (Deeg and Hardie Reference Deeg and Hardie2016; Fichtner and Heemskerk Reference Fichtner and Heemskerk2020). However, in practice, the evidence suggests they tend to be impatient (Baines and Hager Reference Baines and Hager2022; Braun Reference Braun, Hacker, Hertel-Fernandez, Pierson and Thelen2022a, Reference Braun2022b; Voss Reference Voss2024). For example, Fichtner and Heemskerk (Reference Fichtner and Heemskerk2020) find that they overwhelmingly vote with management when it comes to indicators of short-termism like share buybacks and merger and acquisition deals. We shed additional empirical light on this question in our analysis below.
Corporate Ownership and Firms’ Climate Policy Preferences
It is clear from the rich literature in management and CPE that corporate ownership shapes the time horizons of firms and their corresponding market behavior. We now consider the political implications of these insights.
As explained in the previous section, climate policy requires polluting firms to make an intertemporal trade-off. The extent to which managers can do so should depend in part on the ownership of the firm. When impatient capital predominates in a polluting firm, managers should have shorter time horizons as they focus myopically on meeting quarterly earnings expectations. They should be unable, and therefore unwilling, to incur costs today for long-term gains. As a consequence, these conditions should tilt their preferences against climate policy and they should oppose government action that is costly to them, all else equal.
Our arguments yield a number of observable implications. First, given their exposure to stock market pressures, managers of publicly listed polluting firms should find it more difficult to make intertemporal trade-offs compared to their counterparts in private companies. We therefore expect public companies to be more opposed to climate policy than private ones.
Hypothesis 1a: Publicly listed polluting firms are more likely to oppose climate policy than privately held polluting firms, all else equal.
Additionally, we expect heterogeneity in time horizons within the broad categories of public and private companies. First, polluting firms with a high degree of blockholding should be shielded from capital market pressures and therefore less opposed to climate policy than companies dominated by dispersed, minority owners.
Hypothesis 1b: The higher the ownership concentration of a polluting firm, the less likely it will be to oppose climate policy, all else equal.
Second, we hypothesize the effect of owner type. Polluting firms that are heavily owned by impatient owners, such as active investment managers and investment banks, should be less able to trade off short-term profits for long-term goals and therefore more opposed to climate policy.
Hypothesis 1c: The higher a polluting firm’s ownership share by impatient investors, the more likely it will be to oppose climate policy, all else equal.
Finally, we formulate a hypothesis around the proposed causal mechanism – corporate time horizons – that we argue links ownership to climate policy opposition.
Hypothesis 2: The shorter the time horizon of a polluting firm, the more likely it will be to oppose climate policy, all else equal.
In sum, ownership structure conditions polluting firms’ ability to absorb short-term policy costs. If owners have short time horizons, firm managers have limited ability to absorb policy costs and are more likely to oppose reform. In this way, ownership shapes not only the market behavior of companies, but also their political behavior.
Research Design
We expect our arguments to hold for companies around the world, though we choose to test them using the case of the United States. We do this for two reasons. First, while on the whole capital is argued to be impatient in liberal market economies like the United States (Hall and Soskice Reference Hall and Soskice2001), with managers having shorter time horizons compared to managers in other high-income democracies (see, for example, Porter Reference Porter1992; Poterba and Summers Reference Poterba and Summers1995), there is still substantial variation in firm ownership. Second, the case enables us to leverage partisan polarization to develop a measure of firm-level climate policy preferences.
Measuring Firms’ Opposition to Climate Policy
Our theory predicts firms’ opposition. To test it, we therefore require a measure of firms’ position on climate policy. Firms sometimes state their climate positions publicly in press releases, evidence to committees, and public consultations. However, measuring these in a comparable way for a large number of companies presents challenges. Moreover, relying on what firms say is problematic, as businesses often strive to obscure or camouflage their true preferences via elaborate and well-financed public relations and greenwashing campaigns. Another possibility is lobbying expenditure data, which is available from lobbying disclosure reports. However, disclosure rules do not require companies to say whether they lobbied for or against a particular policy, and therefore a firm’s position is not observable.
Our approach is to measure business preferences as revealed by their actions; specifically, their campaign contributions. These data can be directly measured in a comparable way for a large sample of businesses using records filed with the Federal Election Commission. Most importantly for our purposes, they can reveal opposition to climate policy. Given these advantages, using campaign contribution data is our preferred approach and we describe it in detail below. That said, we also analyze two additional measures in Section A4.1 of the Supplementary Information – membership in ad hoc coalitions opposed to climate policy and lobbying expenditures on climate-related issues – and our findings do not change.
Campaign contributions are a major part of US politics and companies are an important source of political funds. There is a large literature on US corporate campaign giving, with scholars having explored several explanations for why firms donate, including for quid pro quo favors and as a form of investment that secures access to legislators (see, for example, Fowler et al. Reference Fowler, Garro and Spenkuch2020; Stuckatz Reference Stuckatz2022). While important, the reason for why firms donate is not directly relevant for our purposes. As mentioned, we are instead seeking a measure that can reliably reflect a firm’s underlying policy position. For that, we simply assume that campaign contributions reflect a company’s support for the policy positions of the political party to whom they are donating.
The first step in developing our measure is to examine the climate policy positions of the Democrats and Republicans. The two parties have inhabited opposite policy positions, with the Republicans largely opposing mitigation policy since the late 1980s and the Democrats tending to support it (Mildenberger Reference Mildenberger2020, Chs. 4–5). To confirm this, we measure each party’s position using their presidential election year manifestos. We extract every sentence in each party’s manifesto that mentions a climate change-related keyword. We then code the stance of each extracted sentence as either pro-climate policy (if it would decrease greenhouse gas (GHG) emissions), anti-climate policy (if it would increase GHG emissions), or neutral (for example, if it is a statement of fact) (Carter et al. Reference Carter, Ladrech, Little and Tsagkroni2017). A full list of keywords and detailed explanation of the coding is available in Section A6 of the Supplementary Information.
Figure 1 presents party positions for the Republicans and Democrats between 1992 and 2020. The Republicans are less pro-climate than the Democrats throughout the entire period, though in 2008 the gulf between the parties begins to widen as polarization on the issue sets in. The Democrats become increasingly pro-climate, while the Republicans become more opposed. By 2020, there is substantial divergence. The parties are over three times further apart on the issue than they were in 1992.
Party positions on climate change policy. Note: difference between the number of pro- and anti-climate policy sentences in each presidential election year manifesto normalized by the total number of sentences in each manifesto from 1992 to 2020. Positive values indicate a pro-climate policy position. Negative values indicate an anti-climate policy position. The vertical line indicates the 2012 election year. See Section A6 of the SI for method and data.

We leverage the hyperpolarized political environment surrounding climate policy between 2012 and 2020 for our analysis. A brief timeline of climate policy making during this period puts the differences between the parties in stark relief. The second Obama administration (2013–17) enacted the Clean Power Plan to reduce emissions from electricity generation, adopted tougher vehicle emissions standards and new standards for methane emissions, signed the Paris Agreement, and banned offshore oil and gas drilling in some waters. However, all of these policies were either repealed or weakened during the first Trump administration (2017–21).
Given each party’s manifesto positions and the real-world policy making of party leaders, firms concerned about climate policy during this period would have two very clear choices about who to support at election time. Those that oppose action should prefer that Republicans are (re)elected, while those that support climate policy should prefer that Democrats are (re)elected, all else equal. This conceptualization straightforwardly yields a parsimonious measure of climate policy opposition as campaign giving to Republicans as a percent of each firm’s giving to Democrats and Republicans (see Equation (1) below). Note that while the focus is on giving to Republicans, this conceptualization also accounts for each firm’s giving to Democrats.
While our approach is related to Kennard (Reference Kennard2020), who uses campaign contributions by Fortune 500 executives to relevant Democratic and Republican committee members to measure firm-level preferences towards the 2009 Waxman-Markey cap-and-trade bill, there is an important difference. Our conceptualization is not about lobbying around one particular policy, but rather supporting the election or re-election of a political party and their broader climate policy platform. In this way, it is similar to Bonica (Reference Bonica2014), who uses campaign contribution data to measure revealed political preferences for political actors, including firm managers.
An important threat to the validity of our approach is that firms may make campaign contributions in support of or opposition to a bundle of policies, not only one. If this is the case, our variable would measure preferences over a wider set of policies than climate. We take two steps to attenuate this type of measurement error.
First, we restrict our analysis to companies in energy- and emissions-intensive sectors or sectors reliant on these (hereafter called ‘polluting sectors’). Polluting sectors would have borne direct and concentrated short-term costs from climate policies that were adopted or proposed during the sample period. As a consequence, climate policy should be very salient for firms in these sectors, and these firms should have the strongest material incentive to seek to influence climate policy making, including via campaign contributions. By focusing on polluting sectors, we also limit our analysis to a set of industries that face an intertemporal trade-off. As mentioned above, clean technology sectors are not exposed to short-term policy costs.
Secondly, we validate our measure using two other variables related to firms’ opposition – membership in anti-climate ad hoc business coalitions and lobbying expenditures on climate-related issues. We compile the coalition data from Cory et al. (Reference Cory, Lerner and Osgood2021), who identify all firms that are, or have been, members of anti-climate business coalitions. It is the only other firm-level measure of the climate policy position of US firms of which we are aware. For lobbying, we use the Lobby View dataset (Kim Reference Kim2018) to collect firm-level expenditures on three climate-related issues: environment, energy, and fuels. As mentioned, lobbying data is not our preferred measure because it does not reveal firms’ policy positions. Still, because our sample is limited to polluting sectors, it is plausible to assume firms in it will be generally opposed. In which case, lobbying expenditures can measure the intensity of opposition. Given their theoretical relationship, our measure should predict both membership in anti-climate coalitions and lobbying expenditures, and vice versa. In Section A1 of the Supplementary Information, we find robust associations in the expected directions.
Employing these strategies together should reduce concerns that our measure includes substantial measurement error. To further assuage such concerns, we perform supplemental analyses using membership in anti-climate coalitions and lobbying expenditures as alternative dependent variables (see Section A4.1 of the Supplementary Information). Our findings do not change. Lastly, it is important to mention that measurement error in the dependent variable should not necessarily bias our estimates but rather make them less precise by inflating the standard errors. As such, any residual measurement error in our dependent variable should reduce the likelihood that we recover statistically significant estimates below.
Next, we provide an overview of how we construct our measure. For full details, please see Section A2.1 of the Supplementary Information. We utilize data from the Center for Responsive Politics (CRP). Because we are interested in measuring the preferences of firms, we focus on firms’ soft money donations and their donations to 527 groups, which represent the direct use of corporate funds for political ends (Aggarwal et al. Reference Aggarwal, Meschke and Wang2012). We collect data for all firms coded as energy-related (‘RealCode E’) by CRP, which includes firms in energy sectors (energy producers and electric utilities), but also energy-intensive manufacturers, fuel retailers, and companies that provide services to the energy sector. We next identify polluting sectors for our sample inductively, choosing the most energy- and/or emissions-intensive industries. These are: oil and gas, mining, utilities, utility construction, petroleum wholesalers, and manufacturing (food, paper, petroleum and coal products, and chemicals) (see Figure 2 for a list of sectors at the four-digit NAICS code). Once a firm has made a campaign contribution, it enters our dataset. We code any year that the firm did not contribute as 0.
Average climate policy opposition across polluting sectors. Note: polluting sectors are disaggregated at the four-digit NAICS code.

The resulting dataset contains the soft money and 527 political giving by US firms in polluting sectors for each year from 2012 to 2020. It consists of 744 companies and 5,278 firm-year observations. We refer to this sample as ‘giving’ firms.
We generate a measure of climate policy opposition using the following formula
 $${{{\rm{Giving}}\;{\rm{to}}\;{\rm{Republican}}{{\rm{s}}_{i,s,t}}} \over {{\rm{Giving}}\;{\rm{to}}\;{\rm{Republican}}{{\rm{s}}_{i,s,t}}{\rm{ \;+ \; Giving}}\;{\rm{to}}\;{\rm{Democrat}}{{\rm{s}}_{i,s,t}}}}$$
to calculate the per cent of two-party campaign giving by firm i in polluting sector s in year t that is directed to Republicans. We multiply the quotient by 100 for ease of interpretation. It is important to note that, by calculating the percent of two-party giving, our measure accounts for giving to both the Republicans and Democrats.
Mean opposition for giving firms is 25.21 and the standard deviation is 42.65 (see Table 1). In around 23 per cent of firm-years, all giving goes to Republicans, while in around 7 per cent, all giving goes to Democrats. In around 5 per cent, giving goes to both parties in varying proportions. Finally, no giving is done in around 66 per cent of firm-years. This distribution indicates substantial variation in climate policy position across our sample of polluting firms. As we might expect, these companies are more likely to oppose by giving exclusively to Republicans. Across sectors, average opposition is generally higher for fossil fuel-related sectors, followed by electric utilities (see Figure 2). Energy-intensive manufacturing (for example, food and pulp and paper) is lower. By broadly conforming to expectations, this variation provides evidence against the presence of severe measurement error, and therefore helps to further validate our measurement approach.
Descriptive statistics

Generating a Comparison Sample
The CRP data allow us to observe only firms that make campaign donations. To generate inferences about the population of US companies as a whole, we need to also include in our sample firms that do not give. To do this, we use Bureau van Dijk’s Orbis to generate a random sample of ‘non-giving’ firms stratified by sector and size. To produce a deep pool of control units for our matching method (described below), we draw 11,881 firms from emissions- and energy-intensive sectors (see Section A2.2 of the Supplementary Information for full details). Because the non-giving sample is randomly drawn, it should be representative of the population of US firms within each selected sector and firm size category, and therefore balanced across unobserved covariates.
Adding so many non-giving firms introduces many zeros for climate policy opposition.Footnote 1 As a result, mean opposition for the combined sample of giving and non-giving firms decreases to 1.19 (see Table 1). Since this is the sample we analyze, the estimates we recover in our empirical analysis below should be interpreted in relation to this mean.
Measuring Firm Ownership
We measure four dimensions of firm ownership (see Section A2.3 of the Supplementary Information for full details). First, we use Orbis to measure whether a company or its global ultimate owner (GUO) is publicly listed in each year. Secondly, we measure ownership concentration using Orbis’ ‘Independence Indicator’. We code companies in which one shareholder owns over a 25 per cent stake (those rated ‘B’, ‘C’, or ‘D’ by Orbis) as having a blockholder.
Thirdly, we measure ownership by impatient investors using data from S&P Capital IQ on the percent of shares owned by active investment managers (short ‘active investors’). These are the prototypical impatient investor since they are under intense pressure to generate quarterly financial gains (Deeg and Hardie Reference Deeg and Hardie2016; Jackson and Petraki Reference Jackson and Petraki2011). Last, we measure passive asset managers (short ‘passive investors’) to test mixed theoretical expectations and evidence as to the effect of these types of owners. We collect data from S&P Capital IQ on the combined percentage of shares owned by the Big Three passive asset managers, BlackRock, Vanguard, and State Street, who together manage 80–90 per cent of all passive equity fund assets (Fichtner et al. Reference Fichtner, Heemskerk and Garcia-Bernardo2017). Data for both active and passive investors is only available for publicly traded companies.
See Table 1 for descriptive statistics. In all cases, our measures of ownership vary little within firms over time. For this reason, our empirical analyses below rely primarily on cross-sectional variation across firms.
Method
An ideal empirical strategy would be to randomize ownership structure and then analyze its effect on firms’ climate policy positions. However, this strategy is not feasible for obvious reasons. We therefore instead seek to uncover correlations between ownership and policy opposition. Our approach utilizes entropy balancing to control for observable differences between firms with different ownership structures (Hainmueller Reference Hainmueller2012). Entropy balancing is similar to other matching methods in that it seeks to reduce bias from observed differences between groups. To do this, it estimates non-negative weights for each observation in the comparison sample such that the covariate distribution of the weighted comparison group is nearly identical to that of the group of interest. One drawback of the method is that it is suited for a dichotomous group indicator. We therefore use it to analyze the influence of public listing and blockholders (which are dichotomous variables) on climate policy preferences. For the analysis of specific owner types and our mechanism, which are continuous variables, we do not employ entropy balancing.Footnote 2 We balance our group of interest with the comparison group based on variables that are likely to predict public listing or having blockholders (Gangl Reference Gangl, Best and Wolf2014).
Firm decisions to go public with an initial public offering (IPO) are complex. The management literature has identified several factors that are theorized to shape this decision, as well as identified correlates of public firms (for a review see Brau Reference Brau and Cumming2012). For example, there is evidence that firms go public to raise capital for future growth, to reduce the cost of capital, to establish a market value for the firm, and to mimic peers (Aghamolla and Thakor Reference Aghamolla and Thakor2022; Brau Reference Brau and Cumming2012; Brau and Fawcett Reference Brau and Fawcett2006; Ewens and Farre-Mensa Reference Ewens and Farre-Mensa2020). Moreover, publicly traded firms tend to be larger than private ones (Pagano et al. Reference Pagano, Panetta and Zingales1998). As far as possible, we aim to measure and balance on these variables.
We measure firm size using Orbis’ four category size classification (very large, large, medium, and small). Costs of capital vary year to year depending in part on interest rates and the corporate tax rate. We balance on year to account for national changes in interest and tax rates and on the state in which each company is headquartered, as corporate tax rates vary across states. Including year as a predictor also accounts for the secular decline in IPOs in the United States since 2000 (Ewens and Farre-Mensa Reference Ewens and Farre-Mensa2020). We also balance on sector at the four-digit NAICS codes to account for peer effects. In the case of blockholding, the literature has not, to our knowledge, identified a key set of predictors (Edmans and Holderness Reference Edmans, Holderness, Hermalin and Weisbach2017). For this reason, we balance on the same covariates for blockholding as we do for public listing.
In addition to the variables mentioned, we use sector-year fixed effects (at the four-digit NAICS code) and state-year fixed effects to balance on time-varying unobserved heterogeneity at the sectoral and state levels that could affect ownership. This could result from common features to all firms in a particular sector (for example, changes in capital intensity over time) or all firms in a particular state (for example, changes in tax or corporate governance policy over time).
Our covariates and fixed effects also control for many of the predictors of business’ climate preferences and lobbying identified by previous research, including sectoral differences in GHG emissions intensity (Cory et al. Reference Cory, Lerner and Osgood2021) and trade exposure (Genovese Reference Genovese2019), state and national climate policy stringency (Genovese and Tvinnereim Reference Genovese and Tvinnereim2019; Meckling and Trachtman Reference Meckling and Trachtman2024), and firm size (Cory et al. Reference Cory, Lerner and Osgood2021). Moreover, our approach controls for sector-specific trends in technology, markets, and policy that are likely to shape the magnitude of each sector’s intertemporal trade-off as it grows over time.
While our design is not causal, we are still concerned about potential confounding. For omitted variables to cause confounding in our approach, they must be firm-level factors that are either time-varying or time-invariant. The potential confounder of greatest concern is firm size. There is substantial evidence that large firms are more likely to be publicly traded and more likely to engage in political behavior, including opposing climate policy (Akguc and Choi Reference Akguc and Choi2025; Cory et al. Reference Cory, Lerner and Osgood2021; Drope and Hansen Reference Drope and Hansen2006; Hill et al. Reference Hill, Kelly, Lockhart and Van Ness2013; Huneeus and Kim Reference Huneeus and Kim2024; Kim and Osgood Reference Kim and Osgood2019; Lux et al. Reference Lux, Crook and Woehr2011; Pagano et al. Reference Pagano, Panetta and Zingales1998). We observe and include firm size in our analysis using Orbis’ firm size indicator, which is available for both public and private firms.
A second potential confounder is firm performance. There is some evidence that publicly traded companies, for example, are less profitable than private ones (Akguc and Choi Reference Akguc and Choi2025; Fed Reference Fed2024). If less profitable polluting firms are also more likely to oppose policy, profitability could be a source of confounding. However, theoretically, the relationship between profitability and opposition is not clear. It may be that less profitable firms are more sensitive to costly climate policies that could further reduce their bottom line, and they therefore oppose more. Though at the same time, these firms would likely have fewer resources to spend on political activities. Conversely, more profitable firms are likely to have more resources to spend and have a strong incentive to protect their lucrative business model. Empirically, we know of no study that examines profitability and opposition to climate policy. More broadly, work on profitability and corporate lobbying shows mixed findings (Hill et al. Reference Hill, Kelly, Lockhart and Van Ness2013; Lux et al. Reference Lux, Crook and Woehr2011; Sadrieh and Annavarjula Reference Sadrieh and Annavarjula2005). We do not observe profitability due to missingness, especially for private firms. However, given its indeterminate relationship to policy opposition, we are less concerned that it is as strong a confounder as firm size. Below we analyze the sensitivity of our results to possible unmeasured confounding using the approach from Cinelli and Hazlett (Reference Cinelli and Hazlett2020).
We use the ebalance package from Hainmueller and Xu (Reference Hainmueller and Xu2013) in Stata to balance sample means and variance for each covariate. After balancing, covariate means and variances are nearly identical across the groups of interest and the comparison groups (see Figure 3). The maximum weight assigned to one observation is 15.3 for the publicly listed analysis and 53.2 for the blockholding analysis. Neither value is extreme, indicating that our results are unlikely to overly rely on any one observation in the control sample (McMullin and Schonberger Reference McMullin and Schonberger2022).
Covariate balance plot. Notes: this balance plot compares publicly listed companies (our group of interest) to private companies (our comparison group). The plot for blockholding is virtually identical and reported in Section A3 of the Supplementary Information. Covariate names are omitted because their large number makes them unreadable when plotted on the y-axis.

To estimate the association between ownership and climate policy opposition, we use ordinary least squares (OLS) models that include the weights for each comparison-unit observation from the entropy balancing algorithm. Because we analyze the same firms over time, we cluster standard errors at the firm level to correct for potential correlation of the error terms.
Results: Ownership and Climate Policy Opposition
Public Versus Private Markets
We first analyze differences between publicly listed and privately held companies (Table 2 – Model 1). As expected, we see that opposition is 0.90 points higher on average for publicly listed companies than for observably similar private firms (Model 1). When considered in the context of sample mean opposition of 1.19, the coefficient is large. Publicly listed companies oppose climate policy much more than otherwise similar privately held firms. This result is not only predicted by our theory, but also points in the same direction as previous research. For example, in their study of emissions intensity and business opposition, Cory et al. (Reference Cory, Lerner and Osgood2021) include public listing as a covariate, and it is a reliably positive and statistically significant predictor of opposition. Similarly, in a recent study from management, Shive and Forster (Reference Shive and Forster2020) find that publicly traded US firms exhibit less pro-climate behavior – they have higher GHG emissions and incur more Environmental Protection Agency (EPA) penalties – than otherwise similar privately held companies.
Corporate ownership and opposition to climate policy – entropy balancing models

Notes: ordinary least squares (OLS) models with weights from entropy balancing. The dependent variable is opposition to climate change policy. Covariates for entropy balancing are: firm size, state in which firm is headquartered, year, four-digit NAICS sector code, sector-year fixed effects (at four-digit NAICS), and state-year fixed effects. Sample period is 2012–20. The number of observations declines in models 2 and 3 due to missingness in the blockholding data. Robust standard errors in parentheses clustered at the firm level. * p < 0.05 ** p < 0.01 *** p < 0.001.
Ownership Concentration
We next examine the role of ownership concentration. The benefit of analyzing blockholding is that it varies across public and private firms, allowing us to explore heterogeneity within both groups. We expect that blockholding will reduce opposition across all firms, as well as amongst public and private firms separately (that is, private firms with blockholders should be less opposed than private firms without blockholders, and similarly for public firms).
Model 2 in Table 2 presents the results. Firms with blockholders oppose climate policy less than observably similar firms with dispersed ownership, as our arguments predict. The coefficient suggests that firms owned by blockholders are around 1 point less opposed to climate policy. Again, it is a large coefficient when compared to sample mean opposition of 1.19.
Additionally, we investigate heterogeneity across public and private firms. In our sample, around 85 per cent of public companies and 64 per cent of private ones have blockholders according to our definition. We expect both types of firms to be less opposed to climate policy when owned by blockholders. To test this, Model 3 includes an interaction between blockholding and public listing. The coefficients for blockholding and for the interaction term are negative and significant at conventional levels. Plotting the marginal effects of blockholding for public and private firms separately reveals a negative and statistically significant coefficient for both, as expected (Figure 4). Both private and public firms are less opposed to climate policy when they are owned by blockholders. However, the coefficient magnitude varies considerably for each type of company. The coefficient for public companies is more than ten times the size of that for private firms, suggesting that blockholders play a larger role in shielding publicly listed companies from short-term market pressures than privately held companies.
Marginal effects of blockholding for private and public firms with 95 per cent CIs.

Type of Owner
For the next step in our analysis, we analyze variation by owner type amongst publicly listed companies. We examine two types of owners: active investors and passive investors. Firms with larger ownership stakes by active investors should be more opposed to climate policy. In the case of passive investors, our expectations are indeterminate.
To carry out our tests, we rely on OLS models, as our continuous measures of ownership are not suited to entropy balancing (as described above). We estimate models of the form
 $${Y_{i,t}} = {\beta _0} + {\beta _1}{X_{i,t}} + {\beta _2}{\Theta _i} + {\beta _3}{\gamma _i} + {\beta _4}{A_i} + {\beta _5}{\Omega _t} + {\beta _5}{\lambda _{i,t}} + {\beta _5}{\mu _{i,t}} + {e_{i,t}}$$
where Y is climate policy opposition for firm i in year t; ß 0 is the Y intercept; X i,t is our measure of ownership; Θ i is firm size; γ i are sector fixed effects at the four-digit NAICS code; A i are state fixed effects; Ω t are year fixed effects; λ i, t are sector-year fixed effects at the four-digit NAICS code; μ i, t are state-year fixed effects; and e i,t is the error term. Similar to the analysis above, our approach here relies primarily on cross-sectional variation in ownership across firms.
Table 3 presents the results. Looking first at active investors, we see a positive and statistically significant relationship (Model 1). Publicly listed firms with higher ownership by impatient, active investors oppose policy more. Again, the magnitude of the coefficient is large. A one standard deviation (22.54) increase in active ownership is associated with around a 1.1-point increase in opposition, relative to a sample mean of 1.19.
Type of owner and business opposition to climate policy

Notes: ordinary least squares (OLS) models. The dependent variable is opposition to climate change policy. Sector and sector-year fixed effects are at the four-digit NAICS code. Sample period is 2012–20. Robust standard errors in parentheses clustered at the firm level. * p < 0.05 ** p < 0.01 *** p < 0.001.
In the case of passive investors, we again find a positive and significant association (Table 3 – Model 2). Publicly listed companies with larger shares of ownership by passive investors oppose policy more. A one standard deviation (7.51) increase in passive ownership is associated with around a 0.9-point increase in opposition. Again, a substantively large coefficient. The result is consistent with an emerging body of work that is skeptical of the willingness and ability of passive owners to encourage managers to take a longer-term perspective or adopt more ambitious climate and environmental policies (Baines and Hager Reference Baines and Hager2022; Braun Reference Braun2022b; Fichtner and Heemskerk Reference Fichtner and Heemskerk2020; Voss Reference Voss2024).
Testing the Mechanism
For the last step in our analysis, we test the causal mechanism – short-termism amongst managers – that we propose is driving the relationship between ownership and climate policy opposition observed above. The ideal measure for this would be firm-specific hurdle rates, that is, the minimum rate of return managers expect for an investment (Poterba and Summers Reference Poterba and Summers1995). However, this data is not readily available. As a proxy, we use shareholder payout to construct a measure of short-termism at the firm level. High shareholder payout sends money to investors instead of making investments in the long-term health of the firm, leading to what Lazonick and Shin (Reference Lazonick and Shin2019) call ‘predatory value extraction’. Research finds that managers increase share repurchases to prevent declines in the stock price, and that doing so pays off, as share repurchases mitigate investor outflows (Bourveau et al. Reference Bourveau, Li, Macciocchi and Sun2023). Furthermore, payouts are associated with indicators of short-termism like decreased investment (Almeida et al. Reference Almeida, Fos and Kronlund2016) and lower innovation (Wang et al. Reference Wang, Yin and Yu2021). Based on these findings, we assume that managers that send company money to shareholders instead of using it for investment are more short-term oriented than managers not making high shareholder payouts.
Management scholars have struggled to identify a relationship between ownership and payouts due to endogeneity – investors pick companies based in part on their payouts (Crane et al. Reference Crane, Michenaud and Weston2016). Our data does not enable a research design that can address this endogeneity. Therefore, to establish a link between ownership and payouts we rely on recent work in management that employs causal designs and finds that impatient ownership causes an increase in payouts (Bourveau et al. Reference Bourveau, Li, Macciocchi and Sun2023; Crane et al. Reference Crane, Michenaud and Weston2016; Gutiérrez and Philippon Reference Gutiérrez and Philippon2018).
For our analysis, we then test the relationship between payouts and climate policy opposition. We measure shareholder payout using Orbis data on annual dividends and share repurchases, which is available from 2013 to 2020. Dividends send profits directly back to shareholders, while share repurchases generate value for shareholders in an indirect way. By buying back shares in the market, firms can reduce the supply of outstanding shares, and by doing so, increase the share price. Before 1982, share buybacks were an illegal form of market manipulation in the United States. They are now a widespread corporate practice, especially since the 2008 financial crisis (Fichtner and Heemskerk Reference Fichtner and Heemskerk2020; Lazonick and Shin Reference Lazonick and Shin2019).
We sum the amount of money each firm spends on dividends and repurchases in each year. We then normalize the measure by dividing this sum by total assets. Lastly, we multiply the quotient by 100 for ease of interpretation. However, much data is missing. To enable analysis, we assume that public companies with no data for dividends or repurchases in a given year did not make such transactions and code these firm-years as 0. Lastly, we drop a small number of outliers with values over 100. Because the measure of payouts is continuous, we employ the same empirical setup as the previous section – OLS model with controls (see Equation (2)).
Table 4 presents the results. As expected, we observe that firms that are more short-term oriented, as proxied by their level of shareholder payouts, oppose climate policy more. Again, the magnitude of the coefficient is substantively large. A one standard deviation (2.22) increase in payouts is associated with a 0.7-point increase in opposition, relative to mean opposition of 1.19.
Corporate time horizons and opposition to climate policy

Notes: ordinary least squares (OLS) model. The dependent variable is opposition to climate change policy. Sector and sector-year fixed effects are at the four-digit NAICS code. Sample period is 2013–20. Robust standard errors in parentheses clustered at the firm level. * p < 0.05 ** p < 0.01 *** p < 0.001.
Additional Mechanisms, Robustness, and Sensitivity Analysis
While our results are consistent with a time horizon mechanism that links ownership to policy opposition, a potential concern is that they are also plausibly consistent with other mechanisms as well. Theoretically, public versus private ownership could impact firm behavior through several mechanisms, including norms. Privately owned companies may have not only longer time horizons, but also more pro-climate corporate norms or goals – for instance, due to family ownership. Empirically, the binary nature of our measure of public versus private would make it difficult to distinguish between time horizon and norm mechanisms. We seek to address this concern by triangulating evidence across four separate measures of ownership, as well as deploying a proxy for time horizons. For an additional mechanism to be valid, it would need to be correlated with each of our four ownership variables. While we think this is implausible, our research design and data structure cannot completely rule it out. Future research could investigate the role of additional mechanisms.
Turning next to the robustness of our results, we analyze this in several ways (for full details see Section A4 of the Supplementary Information). First, to ensure our results are not reliant on our measure of firm opposition, we consider two alternative measures: membership in anti-climate coalitions (from Cory et al. (Reference Cory, Lerner and Osgood2021)) and lobbying expenditure on climate-related issues. Using these alternative measures does not change our findings.
Next, we add additional controls, including total absolute political giving (to further control for firm size), more granular sector fixed effects at the six-digit NAICS level (including sector-year fixed effects at this level), and for the entropy balancing models, the covariates that were used to balance the samples. Additionally, for the entropy balancing models we estimate simple OLS models without entropy balancing. Furthermore, we expand our sample beyond the narrow focus on emissions- and energy-intensive sectors to include all energy-related sectors as identified by CRP. Importantly, this approach also tests the broader external validity of our findings. In all cases, our findings do not substantively change.
Last, we explore heterogeneity by dividing polluting firms into fossil fuel and non-fossil fuel sectors. While we argue that all polluting firms can ultimately decarbonize, we expect this to vary over time by sector as technology, markets, and policies shift. Given these trends in fossil fuel sectors during our sample period, they are likely to be less willing and able to decarbonize compared to non-fossil fuel sectors. As a result, managers of fossil fuel-related companies are more likely to see climate policy as an existential threat and oppose it outright, regardless of ownership. Empirical tests confirm that ownership plays little role in driving opposition in fossil fuel sectors, suggesting that our results are driven primarily by polluting firms in non-fossil fuel sectors.
We conduct a sensitivity analysis using the approach suggested by Cinelli and Hazlett (Reference Cinelli and Hazlett2020) (See Section A5 of the Supplementary Information). While this approach is intended for researchers using linear regression models for causal inference with observational data (Hazlett and Parente Reference Hazlett and Parente2023), which our research design and models do not do, it is still useful in a correlational study to examine how severe confounding would have to be to substantively alter one’s research conclusions. We benchmark the results of the sensitivity analysis against what we believe is the most significant confounder in our analysis: firm size. We use two variables for firm size as benchmarks: Orbis’ size classification and total absolute campaign donations.
In the case of public listing, an unobserved confounder that is five times as strong as either measure of firm size would not change our conclusions. In the case of our results for passive ownership and shareholder payouts, it would take a confounder twice as strong as firm size (benchmarked against Orbis’ size classification) or more than three times as strong (benchmarked against total giving) to change our conclusions. In the case of blockholding and active investor ownership, it would take a confounder as strong as firm size (benchmarked against Orbis’ size classification) or more than three times as strong (benchmarked against total giving) to change our conclusions.
While we cannot rule out the possibility of an unmeasured confounder as strong as size (as measured by Orbis’ size classification), it is not obvious that one is plausible. Remember, any confounder would need to be a firm-level factor (time-varying or time-invariant). As we discuss above, factors related to firm performance, for example profitability, are a possibility. However, the theoretical relationship between profitability and climate policy opposition is indeterminate, reducing the likelihood that it would be as strong a predictor of both ownership and opposition as firm size. See Section A5 of the Supplementary Information for a more detailed discussion.
Conclusion
In this article we set out to explain why some firms are more opposed to climate policy than others. To do so, we bring previously overlooked insights from management studies into political science to theorize how ownership shapes firms’ political opposition. We argue that companies with short-term, impatient investors are more likely to oppose climate policy than their counterparts with more patient owners. Short-term investors pressure managers to maximize profits in the near term. This reduces managerial time horizons and makes firms unable to trade off the short-term costs of climate policy for the long-term gains of transitioning to cleaner operations and products. As a consequence, firms’ policy preferences are tilted against decarbonization policy that is costly to them.
We theorize the effects of three categories of ownership: public versus private markets, ownership concentration, and type of owner. We expect firms to be more short-term oriented, and therefore more opposed to climate policy, when they are publicly listed, have dispersed ownership, or have high levels of ownership by impatient investors.
We test our hypotheses with a dataset of US firms. Using an original measure of firm-level opposition to climate policy based on firms’ campaign donations to Republicans versus Democrats between 2012 and 2020, we show that a firm’s ownership is significantly associated with its political behavior. Using entropy balancing to match on observables, we present evidence that publicly traded companies oppose climate policy more than otherwise similar private ones.
We explore heterogeneity by blockholding and by type of owner. Firms with blockholders oppose less than observably similar ones with dispersed ownership. Firms with high levels of ownership by active investors oppose policy more. Importantly, we find that ownership by passive investors is also significantly associated with opposition. Finally, we provide evidence that firms’ time horizons are driving the relationship between ownership and opposition. As expected, companies that are more short-term oriented, as proxied by their level of shareholder payouts, are more opposed to climate policy. We undertake supplemental analyses using alternative measures of opposition – membership in anti-climate coalitions and lobbying expenditures on climate-related issues – as well as a battery of robustness checks, and our findings do not change.
This article advances our understanding of the microfoundations of long-term policy making by explaining why firms vary in their opposition to long-term policies that require intertemporal trade-offs. By showing how corporate ownership affects firm preferences for long-term policy, we extend key findings in management studies and CPE. Scholars in these fields have shown that ownership shapes the market behavior of firms. We show for the first time, to our knowledge, that it also shapes their political behavior. Importantly, we identify firms’ time horizons as the key mechanism. This opens up a new space in the study of firm preferences and adds to recent scholarship on ownership structure and climate politics (Bayer Reference Bayer2023). It suggests that the short-term distributional effects of policies – the central focus of much firm preference research – intersect with firms’ ability to make intertemporal trade-offs.
Our findings also raise a central question for future research. Firms in liberal market economies like the United States, UK, Canada, and Australia tend to rely on impatient, stock market capital while those in co-ordinated markets economies like Germany, Sweden, and Denmark often rely on patient capital from banks, families, and industrial organizations. We suggest that domestic institutions that shape corporate ownership structures, including corporate governance rules, financial regulation, and tax law, could account for cross-national variation in long-term policy making, including on climate change. We expect that in countries with more patient capital provision, governments are likely to face less intense business opposition as companies are better able to absorb the short-term costs of long-term climate policy making. In countries dominated by impatient owners, we expect the opposite. Business is likely to vigorously fight costly mitigation policy as firm managers strive to maintain short-term profits for their shareholders. Initial evidence points in this direction and shows that capital patience, as proxied by stock market capitalization, is positively correlated with a country’s climate policy stringency. The United States, for instance, is an ideal-type liberal market economy. It has failed at multiple attempts to adopt federal climate policy that would impose short-term costs on firms, such as an energy tax or a cap-and-trade system. The United States eventually adopted the Inflation Reduction Act (IRA) in 2022. However, the policy did not impose short-term costs on polluting firms but rather provided them with carrots in the form of subsidies.
Additional research is needed to examine this question in detail. If it holds true, it would provide a complementary explanation for why countries in Scandinavia, for example, have led on climate policy since the 1980s, while liberal market economies have by and large lagged (Finnegan Reference Finnegan2022). Additionally, it would extend our understanding of how domestic institutions influence long-term policy making beyond, for example, corporatism and electoral rules to institutions that shape corporate ownership and firm preferences (Finnegan Reference Finnegan2022; Finnegan et al. Reference Finnegan, Lipscy, Meckling and Metz2025). It would thus also expand our understanding of the institutional sources of corporate political behavior (Busemeyer and Thelen Reference Busemeyer and Thelen2020; Hacker and Pierson Reference Hacker and Pierson2002; Martin Reference Martin1995; Martin and Swank Reference Martin and Swank2012; Woll Reference Woll2008).
Our results also have important implications for politics and policy. First, they highlight the centrality of investors in shaping business opposition to climate policy. This stands in stark contrast to the predominant view that financial investors are a positive force for decarbonization. The theory of change underlying environmental, social, and governance (ESG) investment sees investors in the driving seat of corporate efforts to reduce GHGs. Our findings, however, suggest that only a subset of owners have time horizons compatible with firm managers accommodating climate policy. This points to fundamental tensions between short-termism and corporate political behavior consistent with ESG goals. Recent findings support this: 60 per cent of companies with net-zero or similar emission targets, which can improve ESG scores, use lobbying and other tactics to undermine climate policy making by governments (InfluenceMap 2023).
Secondly, and relatedly, our findings raise questions about the role of institutional reform, including of corporate governance, to strengthen long-termism in corporate political behavior. Scholars, business, and civil society have called for reforms of capital markets to better incentivize firms to focus on long-term societal challenges (Jacobs and Mazzucato Reference Jacobs and Mazzucato2016; Lazonick and Shin Reference Lazonick and Shin2019). In recent years, for example, US policymakers have sought the reform of corporate governance to strengthen the voice of labor, thus moving corporate governance into debates on social policy. Consistent with these efforts, our findings suggest that corporate governance reform is likely central to a broad range of long-term policy areas, including climate change.
Supplementary material
The supplementary material for this article can be found at https://doi.org/10.1017/S0007123426101422.
Data availability statement
Replication data for this paper can be found at https://doi.org/10.7910/DVN/ZRI0TW.
Acknowledgments
We thank Nicholas Goedeking, Zach Lou, and Clayton Munnings for research assistance. For their helpful feedback, we thank Michaël Aklin, Sarah Anzia, and three anonymous reviewers, as well as audiences at UCL, LSE, Harvard University, the Max Planck Institute for the Study of Societies, the Hertie School of Governance, the Environmental Politics and Governance Workshop, the Political Economy of Climate and Environment Annual Conference, the Greening the Economy Workshop, the Climate Futures Workshop, the APSA Annual Meeting, the SASE Annual Meeting, and the Consortium on the American Political Economy Annual Conference.
Financial support
We gratefully acknowledge funding from the Berkeley Institute for Young Americans.
Competing interests
None to disclose.


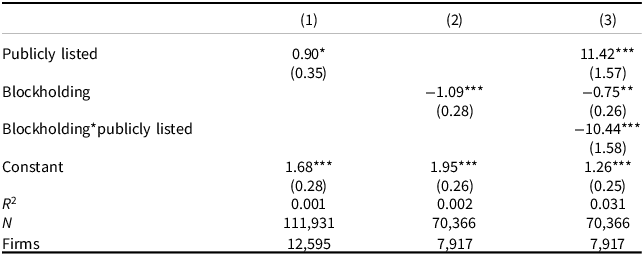


 Open access