


Introduction
In early 2022, Florida Governor Ron DeSantis signed into law the Florida Parental Rights in Education Act (HB 1557), restricting instruction on sexual orientation or gender identity in Florida public schools. The same day, The Walt Disney Company released a public statement, stating in part:
Florida’s HB 1557, also known as the “Don’t Say Gay” bill, should never have passed and should never have been signed into law. Our goal as a company is for this law to be repealed by the legislature or struck down in the courts…Footnote 1
In response to Disney’s criticism, Governor DeSantis threatened to seize the special jurisdiction surrounding the Walt Disney World Resort land (2023), which had been established five decades earlier to provide the company with governance and tax benefits, and shortly thereafter signed a bill dissolving the district. The Walt Disney Company filed suit, claiming that the governor and his administration had violated the company’s First Amendment rights, using government power to exact political retaliation.Footnote 2
The protracted political and legal battle that unfolded between Disney and Gov. DeSantis received considerable attention, but it is not the only recent example of elected officials threatening or insinuating use of their powers of office against companies voicing a political position. In response to companies including Coca-Cola, Delta Airlines, and Major League Baseball publicly denouncing a Georgia voting law, Senate Minority Leader Mitch McConnell said in a 2021 press conference:
My advice to the corporate CEOs of America is to stay out of politics. Don’t pick sides in these big fights.Footnote 3
In a concurrent press release, Senator McConnell castigated businesses for weighing in, warning that “Corporations will invite serious consequences” for taking sides.Footnote 4 From the other end of the ideological spectrum, Senator Elizabeth Warren of Massachusetts engaged in a public spat with Amazon over tax loopholes, writing that in addition to fighting to make sure the company paid its fair share, she would also “fight to break up Big Tech so you’re not powerful enough to heckle senators with snotty tweets.”Footnote 5
Political retribution has typically been considered beyond the pale in American politics. Carey and coauthors report that 80% of the public and 97% of political experts say that it is “important” or “essential” that government agencies not be used to attack political opponents.Footnote 6 And Lawson finds that career bureaucrats and subordinate political officials report considerable (though variable) resistance to orders that could appear to involve the use of government apparatuses against political opponents.Footnote 7 Nevertheless, evidence of US officials wielding the powers of their office against political adversaries has been found both by scholarsFootnote 8 and courts of lawFootnote 9—with the executive office appearing especially prone to abusing power.Footnote 10
In recent years, this concept ostensibly repugnant to American democratic values has bubbled to the surface of political discourse. Both DemocraticFootnote 11 and RepublicanFootnote 12 campaign rallies have erupted into chants of “lock [him/her] up” aimed at the candidate’s political rival, and both parties accuse their opponents of using impeachment proceedings Footnote 13,Footnote 14 and prosecutions Footnote 15,Footnote 16 as political weapons. In a decision that reflects heightened watchfulness against the specter of political retribution, while simultaneously expanding the potential for presidential abuse of power, the Supreme Court’s finding of broad presidential immunity in Trump v. United States (2024) turns largely on the argument that presidents should be protected from fear that political enemies will use the president’s official decisions to charge them with crimes.Footnote 17
In the study presented here, we are interested in the electoral effects of an elected official’s use of political retribution. Taking the particular case of companies using political voice to express opposition, we ask: is political retribution an electorally strategic response? If politicians are increasingly overt in issuing intimations or outright threats of political retaliation, it suggests they do not expect such statements to cause them electoral harm.
When elected officials do use the powers of their office to threaten or punish companies for exercising political speech, how do voters respond? Are such actions seen as an appropriate show of strength that keeps business from meddling in politics, providing politicians with a general boost in voter support? Are they seen as unacceptable abuse of governmental power, and met with broad voter disapproval? Or, as might be expected to occur within the current political landscape—characterized by partisan rancor and a seemingly invulnerable link between partisanship and vote choice—do voter responses depend entirely on whether the elected official is a member of their own or the opposing party?
When considering how voters respond to instances of political retribution, the case of corporate political speech is useful to examine in several respects. The American public exhibits “a profound ambivalence” about the role of business in politics.Footnote 18 Because voters are concerned about corporate influence in politics and exhibit relatively weak support for corporate freedom of speech,Footnote 19 the wielding of political power to “keep business in its place” is an opportune setting in which to observe voter openness to political retribution; a context in which we might expect voters to feel more accepting of the use of political power to suppress political voice.
While President Trump has stood out for his threats of political retaliation against individual political adversaries,Footnote 20 public threats of political retaliation by US officials against individuals are uncommon. More common, as with the examples of Gov. DeSantis and Sens. McConnell and Warren above, is for such public threats to be directed at corporations. Perhaps attuned to the public’s ambivalence about business in politics and about corporate political speech in particular, Footnote 21,Footnote 22 elected officials may presume that a strong reaction warning business to stay out of politics will be acceptable to voters, or potentially provide strategic electoral advantage.
The case of political retaliation against corporate political speech also provides an interesting vantage point into the changing nature of relations between the business community and the two major political parties in the United States. The Republican Party has shifted balance from its historical prioritization of business interests toward populism,Footnote 23 with elements leaning toward authoritarianismFootnote 24—a hallmark of which is the wielding of governmental power against political opponents. This shifting orientation within the GOP coincides with changing trends in corporations’ use of political voice, as companies have become more likely to make explicitly political public statements.Footnote 25
These various and potentially countervailing forces—the changing nature of business-party relations; bipartisan ambivalence about corporate political voice; increasingly commonplace public references to political retribution; and the contentious and influential nature of partisanship in shaping voter evaluations—mean there are no obvious answers to questions about how voters will respond to an executive using the powers of their office to retaliate against a corporation’s use of political voice.
Background
Ambivalence about corporate political speech in the United States
The Supreme Court decision in Citizens United v. FEC (2010) established that a corporation’s political speech, by way of messaging or spending, is constitutionally protected.Footnote 26 This decision represented a reversal in the previously dominant ideological alignment on freedom of speech. The Citizens United decision espoused the libertarian perspective on freedom of speech, championed by the ideological right, rather than the egalitarian perspective on speech that had been championed by the ideological left.Footnote 27
The decision in Citizens United raised concern that corporations’ financial resources would allow them to exert outsize, undemocratic influence on the political process.Footnote 28 However, evidence is mixed on the impact of corporate speech via spending on political outcomes. Klumpp and coauthors find striking evidence of an increase in Republican electoral probabilities after Citizens United,Footnote 29 but other scholars have noted there was little indication of an increase in corporate political spending per se in the wake of the decision. Footnote 30,Footnote 31 Some theorists argue that any involvement of corporations in the democratic process is a form of political corruption.Footnote 32
Among the public, majorities in both parties agree that business should be less involved in political advocacy—though a majority of Democrats simultaneously state that business should be more involved on certain issues.Footnote 33 Overall, the public expresses ambivalence on corporate political speech, recognizing corporations’ rights to freedom of speech to some degree and under some conditions, but not equivalent to those rights afforded to individuals.Footnote 34
The bulk of scholarship on corporate political speech has focused on monetary contributions or lobbying, as these have long represented the predominant forms of corporate political activity.Footnote 35 However, in recent years, companies have increasingly engaged in political speech by way of public messaging on political topics.Footnote 36
We focus on this public messaging form of corporate political speech: direct political statements by corporations. The public’s ambivalence about corporate political speech is magnified when it comes to direct political statements: predictably, consumer responses are strongly divergent dependent upon alignment with the expressed statement—but overall, negative responses to these statements appear to outweigh the positive.Footnote 37 As direct political statements by corporations have increased, public support for such position-taking has declined, such that just over one-third of Americans agree that businesses should take a public stance on current events.Footnote 38
Changing dynamics of partisan and corporate ideology
The Republican party has long been considered the party of business. Writing in 1960, E. E. Schattschneider remarked on the business community’s dependence on the GOP in representing their interests, noting that “…Republican members of Congress are committed in advance to a general pro-business attitude” and that the means through which the business community “has retained great influence in American politics has been due chiefly to the overall-mediating role played by the Republican party.”Footnote 39
Miller and Schofield write that although the Republican Party’s identity had consolidated around a pro-business position as early as 1896, a populist element has also been present within the party’s coalition for decades. Beginning in the 1960s and increasing with the 1980 election of Ronald Reagan, “the Republican Party has managed to maintain a coalition that includes both Populists and pro-business interests…by simultaneously serving the economic interests of business while advancing the agenda of the social-conservative wing of the party.”Footnote 40
As social conservatives gained power within the Republican party from the 1980s onward, the strategic accommodation of each group’s individual, non-conflicting interests increasingly gave way to “conflict between moderate pro-business Republicans and hardcore social conservative activists.”Footnote 41 Nearly 20 years ago, Miller and Schofield predicted that the result of this intra-party shifting balance of power between pro-business economic conservatism and social conservatism was “likely to be as significant a transformation in the Republican Party as the one that occurred in the Democratic Party” during the 1960s, when the Democratic Party definitively emerged as the party of social liberalism.Footnote 42
As the balance of power in the Republican party has shifted from business interests toward social conservatism and right-wing populism, the business community has faced contemporaneously increasing pressures toward social liberalism via corporate social responsibility (CSR). Although the concepts of corporate social responsibility, rooted in classical liberalism, are essentially conservative in nature,Footnote 43 in practice CSR tends toward social liberalism in the American political context.Footnote 44 Pressures to engage in CSR arise both externally—from activists,Footnote 45 shareholders,Footnote 46 and consumer behavior,Footnote 47—and from within, through the personal political ideology of employees and corporate leadership.Footnote 48 The rise in visibility of CSR and the concomitant growth of corporate political position-taking exacerbates the internal tensions between the pro-business and social-conservative/right-wing populist elements of the Republican party.
Populism is described as a “thin-centered” ideology, meaning that it can attach to a range of ideological forms and characteristics, left and right.Footnote 49 Gagnon and coauthors write that, “if populism has a single defining characteristic, it may be the invocation of ‘the people’ who are betrayed, wronged, or otherwise left vulnerable to forces outside their control.”Footnote 50 This is consistent with the rise of “grievance” politics—the use of anger, resentment, and provocation as a political tool—embodied on the political right in politicians like Donald Trump and Boris Johnson.Footnote 51
Populism and grievance politics point a natural trajectory toward retaliation against political opponents. Urbinati characterizes populism in power as “an authoritarian rendering of how democracy should be implemented… [with] an elected leader who rules as a leader of his majority in disdain of… the principle of a legitimate opposition.”Footnote 52 Abts and Rummens further articulate how populism’s claim of representing the unified will of the people ultimately implies suppressing political opposition:
Populist leaders who advocate the rule of the people and claim to embody the will of the people in their own person have to consider their political opponents… as obstacles to be ignored or even removed….the survival of such a regime depends on the successful preservation of the fictitious image of the people-as-one that brought them to power. This requires a continuous effort to delegitimize all possible opponents and to suppress all possible political divergence.Footnote 53
All of this can occur within the confines of the legal structure of government, in the form of “abusive legalism.” Abusive legalism consists of “legitimately elected governments using procedures provided by the democratic framework itself and consistent with a nominal respect for the rule of law to undermine the integrity of democratic institutions.”Footnote 54
Voter response to anti-democratic actions
Research on voter response to violations of democratic norms by political figures provides mixed evidence regarding electoral constraints on such behavior. In principle, the American public overwhelmingly opposes violation of democratic norms.Footnote 55 However, a number of studies suggest that partisan alignment plays a decisive role in whether voters care about transgressive behavior by politicians or the erosion of democratic norms. Graham and Svolik report that when forced to choose between two candidates in a survey experiment, both Democratic and Republican respondents prioritize party over democratic principles.Footnote 56 Krishnarajan finds that survey respondents in the United States (as well as citizens in 21 other democracies) rationalize undemocratic behaviors by politicians who promote the respondent’s favored policies.Footnote 57
Other scholars report finding little indication of greater tolerance for anti-democratic actions within one’s preferred party. Using the serendipitous timing of survey data collected during an extraordinary real-world event, Frye finds that respondents who reported voting for Donald Trump show a greater drop in favorability toward Trump from immediately before to immediately after the January 6th attack on the US Capitol than do respondents who did not self-report as Trump voters.Footnote 58 Carey and coauthors conduct a candidate choice experiment that finds respondents “are not more willing to forgive transgressions by co-partisan candidates” regarding any of the democratic principles they investigate. Footnote 59,Footnote 60
Over the past several decades, Republican party identification and presidential vote choice has become increasingly associated with measures of authoritarian worldview.Footnote 61 Luttig presents over-time survey evidence suggesting this has occurred not as a result of authoritarians sorting into the Republican party, but rather that “the rhetoric of Republican opinion leaders increasingly leads strong Republicans to become more authoritarian over time.”Footnote 62 The shift towards populism and authoritarianism in the Republican party in particular could render Republican leaders especially inclined toward—and Republican voters especially amenable to—the use of retaliation against political opponents.
Hypotheses
A variety of factors are likely to influence how voters respond to an elected official’s political retaliation against a corporation voicing public criticism. In this study, we are primarily interested in how the partisan alignment (or mismatch) between the voter and the elected official affects voter response to the official’s use of political retribution. In other words, how does partisan identification shape how the voter evaluates the elected official’s behavior?
Our baseline hypothesis is that partisan alignment with the elected official—i.e., whether the official shares the same political party affiliation as the voter or is from an out-party—will be the predominant factor influencing support for the official’s actions. In the United States, partisanship remains the strongest predictor of support for a candidate or politician.Footnote 63 As such, we expect that party affiliation will supersede all other factors when it comes to voting and support for the official.
H1: Party alignment will be the primary determinant of willingness to vote and support of the elected official’s actions.
Moreover, we anticipate that party alignment will interact with the effect of the politician’s actions: we expect that how a voter reacts to the politician’s response will depend on whether that official shares the voter’s party affiliation or is an out-partisan. In particular, we expect that voters will be more accepting of political retribution by an in-party official than the same action by an out-party official. Our reasoning is that if respondents already disapprove of the opposite party’s politicians, then the out-party official’s “weaponization” of their political power will seem even more damaging. An elected official’s resort to retribution against a business voicing political opposition will be viewed more critically by voters when that elected official is a member of the opposing political party than when the official shares the voter’s party affiliation.
H2: The effect of political retaliation on voter support will be more negative for an out-party official than for an in-party official.
Finally, we expect Democratic voters to respond differently from Republican voters to the use of political retribution by an in-party elected official. The shift towards populism and authoritarianism in the Republican party in particular may render Republican voters especially amenable to the use of retaliation against political opponents. In conjunction with the socially liberal tilt of CSR and the increase in direct political messaging from corporations, these contextual dynamics may predispose Republican respondents toward greater acceptance of an in-party politician’s use of retaliatory actions to keep business out of politics.
H3: The effects of political retaliation by an in-party elected official will be heterogeneous by party: Republican voters will be more accepting of political retaliation against a business voicing political opposition than will Democratic voters.
Experimental design & procedure
To test these hypotheses, we designed a 2 (in-party/out-party) × 3 (response severity) factorial survey experiment. Participants were randomly assigned to a condition featuring either an in-party or out-party governor, and were independently randomized to one of three response-severity conditions, representing the governor’s actions in response to public criticism from an in-state business. All participants were assigned to only one condition and were presented with a single scenario (i.e., completed only one set of responses).
We chose to represent the elected official as a governor because the executive office holds the requisite power to exact overt political retribution against an in-state business; because situating the scenario at the state level allows reference to the executive while maintaining the abstraction of an unnamed state and unnamed official (in contrast to the federal level); and because the office of governor is familiar to participants.
All conditions present participants with a brief mock newspaper report about the governor of a state encountering public criticism from the largest business in the state regarding a recently-passed bill, which the governor intends to sign into law. All conditions state the party affiliation of the governor as either Democratic or Republican, with party affiliation randomly assigned to reflect either the same party identification as the participant or the opposing party identification.
The governor’s response to criticism from the in-state business was independently randomly assigned. Participants assigned to the control condition do not learn about any actions taken by the governor in response to criticism by the business, and the mock newspaper report ends by stating, “The Governor remains unwavering in his support of the bill and is expected to sign it into law as early as next week.” Participants assigned to the tempered-response condition received the same mock newspaper text with the insertion of the following sentence into the control text, immediately preceding the final sentence (quoted above): “The Governor is not taking these criticisms lightly and has publicly spoken out against the business and decried their interference.” For participants assigned to the retributive-response condition, the following penultimate sentence was instead inserted into the control text: “The Governor is not taking these criticisms lightly and has removed tax benefits in order to hurt the business’ profits, publicly spoken out against the business, and urged a state-wide boycott. Finally, just yesterday the Governor introduced new legislation intended to block emerging business opportunities for the company, significantly hurting their future prospects.”
As a stimulus check, at the end of the survey (after all outcome measures had been collected) we included a multiple choice question asking respondents to identify the actions taken by the Governor, with descriptions from the control, tempered, and retributive texts as response options. 90% of respondents assigned to the retributive-response condition correctly selected the retributive option as reflecting the actions taken by the Governor, in contrast to 9% selecting the retributive response in the control condition and 9% in the tempered condition. A difference-in-means comparing assignment to retributive versus control/tempered shows a statistically significant (
 $p \lt 0.000$
) and very large (Cohen’s
$p \lt 0.000$
) and very large (Cohen’s
 $d = 2.8$
) effect on probability of selecting the retributive rather than neutral or tempered descriptions, indicating that treatment delivery was successful (see Appendix Table A1 for means).
$d = 2.8$
) effect on probability of selecting the retributive rather than neutral or tempered descriptions, indicating that treatment delivery was successful (see Appendix Table A1 for means).
After presenting the mock newspaper article, we collected two primary outcome variables. First, we asked respondents about their willingness to vote for the governor’s re-election, as measured on a 20-point scale (
 $ - 10$
indicating “Extremely unlikely” and +10 indicating “Extremely likely”).
$ - 10$
indicating “Extremely unlikely” and +10 indicating “Extremely likely”).
Because vote choice is a voter’s primary means of expression in a democratic system, willingness to vote is an important outcome to measure. However, given the strength of party identification in determining vote choice, we anticipated that respondents might indicate that they would vote for an in-party politician even if they did not truly support the governor’s actions towards the business (i.e., were unsupportive of political attacks on business as a principle).
To better assess whether there was genuine support for the governor’s tactics or whether a respondent was begrudgingly indicating a vote for the governor based on partisanship, we included a second outcome measure intended to obtain a more sensitive gauge of attitude towards the governor’s behavior. Partisans may be more willing to express dissatisfaction with a specific action from an in-party official than to shift their willingness to vote for the official. As a more sensitive measure, we asked participants to rate their support for the governor’s response to the business’s vocal opposition of the bill. Support for the governor’s response was also measured on a 20-point scale (
 $ - 10$
indicating “Strongly oppose,” +10 indicating “Strongly support”).
$ - 10$
indicating “Strongly oppose,” +10 indicating “Strongly support”).
After these two main outcome measures, we included a multiple choice question presenting six options describing reasons for supporting or opposing the governor’s actions. Participants were asked to select the one option that most closely reflected their reasoning. Following this, participants were given the option to provide further explanation of the reasoning behind their choices in an open-ended response question.
Participants were recruited through the Prolific survey platform, filtered for voting eligible US citizens, with quotas set to provide an even distribution on gender and a sample primarily composed of respondents who self-identified with the Democratic or Republican party. A power calculation shows that to detect a moderate effect size of
 ${f^2} = 0.10$
within each of the four party alignment conditions (i.e., Democratic/In-party, Republican/In-party, etc., as shown in Table 2), each of the four party-alignment conditions should have n = 99 (
${f^2} = 0.10$
within each of the four party alignment conditions (i.e., Democratic/In-party, Republican/In-party, etc., as shown in Table 2), each of the four party-alignment conditions should have n = 99 (
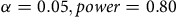 $\alpha = 0.05,power = 0.80$
). As such, each sample aimed for approximately 200 self-identified Republican respondents and 200 self-identified Democratic respondents.
$\alpha = 0.05,power = 0.80$
). As such, each sample aimed for approximately 200 self-identified Republican respondents and 200 self-identified Democratic respondents.
The first round of data was collected in February 2024, with N=528 participants. The sample was 47% women, with 29% between the ages of 18–29, 49% between 30–49, and 21% between 50–69. 49% of this sample reported identifying with the Democratic party, 40% with the Republican party, 11% as not leaning towards one party or the other. Participants were paid $1.00 via Prolific for completing the experiment. The median time for completion was roughly four and a half minutes.
A replication was conducted in April 2024 using the same methods, survey, and tools described above. We collected a sample of 490 participants in the replication round. The sample was 48% women, 25% aged 18–29, 52% aged 30–49, 20% 50–69. 50% of these respondents identified as Democrats, 41% as Republicans, and 10% as Independents.
Results
Results from both the original and replication experiments showed consistent, bipartisan aversion to an elected official using their political power, within the bounds of a legal framework, to punish a corporation’s use of political speech. This appeared across all of the outcome variables we examined: in reduced willingness to vote for the governor’s re-election, in expressed opposition to the governor’s action, and in the reasoning indicated for feelings about the governor’s actions.
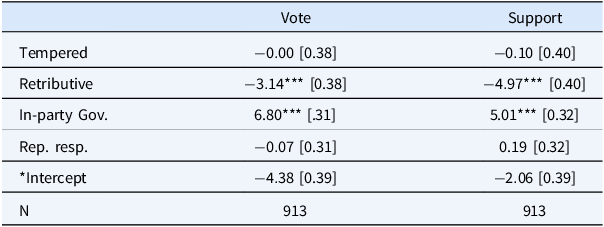
Table 1 shows the average direct effect of the governor’s response to the business’s criticism, and the average direct effect of in-party alignment with the governor (both of which were randomly assigned). The first column shows estimated effects on willingness to vote for the governor’s re-election, the second column shows estimated effects on expressed support for the governor’s actions. Results are estimated using ordinary least-squares regression, pooled across the original and replication rounds, with fixed effects for round of data collection and robust standard errors.
Effect of governor response on willingness to vote and on support for governor’s actions. Results are pooled across the original and replication, with fixed effects for data collection round. Appendix Tables A2 & A3 show results for each round separately

Pooled OLS regression with fixed effects for round of data collection.
Robust standard errors in brackets. ***
 $p \lt 0.000$
.
$p \lt 0.000$
.
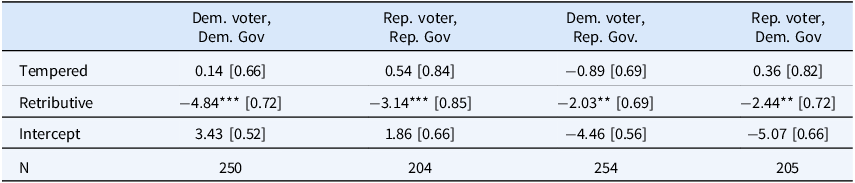
Effect of governor response on willingness to vote by partisanship & alignment. In-party responses are shown in the first two columns; out-party responses in the last two columns. Results are pooled across the original and replication, with fixed effects for data collection round. The same pattern of results appears for both Democratic and Republican voters and for in-party and out-party governors, with the tempered response appearing indistinguishable from taking no action, and the retributive response significantly decreasing willingness to vote for the governor’s re-election

Pooled OLS regression with fixed effects for round of data collection.
Robust standard errors in brackets. ***
 $p \lt 0.000$
; **
$p \lt 0.000$
; **
 $p \lt 0.01$
.
$p \lt 0.01$
.
Both the political retribution response (Retributive) and shared party identification with the governor (In-party Gov.) exert strong, significant effects on willingness to vote and on expressed support for the governor’s response. In partial support of our baseline hypothesis (H1), column 1 shows that the largest-magnitude effect on willingness to vote for the governor’s re-election comes from party alignment with the governor: random assignment to a scenario featuring an in-party governor increased willingness to vote by nearly 7 scale points.
Strikingly, H1 was not supported with respect to support for the governor’s actions. As Table 1 shows, when considering in-party status and retributive behavior together, party swamps the effect of the Governor’s behavior on reported willingness to vote, but not with respect to stated support for the Governor’s actions: the negative effect of political retribution (
 $ - 4.97$
scale points) was equal in magnitude to the positive effect of partisan alignment with the governor (
$ - 4.97$
scale points) was equal in magnitude to the positive effect of partisan alignment with the governor (
 $ + 5.01$
scale points; F-test for equality of coefficients: F(1,907)=0.01, p=0.935)).
$ + 5.01$
scale points; F-test for equality of coefficients: F(1,907)=0.01, p=0.935)).
This finding is notable for two reasons: (1) it indicates that our support measure effectively captures a more nuanced reaction to the governor’s actions that is not picked up through willingness to vote; and (2) using this more sensitive measure reveals the negative effect of an elected official’s use of political retribution to be on par with the effect of party identification, a variable that commonly exerts an overpowering influence on measures of political attitudes and behavior.
Examining the treatment effects separately across the conditions shows considerable consistency of response among Democratic and Republican respondents and across in-party/out-party governor. Table 2 shows these estimates for the willingness to vote variable. The first two columns present estimates in response to an in-party governor and the last two columns present estimates in response to an out-party governor (among Democrats and Republicans, respectively).
In all cases, regardless of respondent partisanship or party alignment with the governor, respondents treat a tempered response from the governor as indistinguishable from the control response of no action taken by the governor. In contrast, the political retaliation represented in the retributive condition significantly decreases willingness to vote for the governor among all four groups. Democrats’ willingness to vote for an in-party governor drops nearly 5 scale points (
 $\beta = - 4.84$
, 95% CI(
$\beta = - 4.84$
, 95% CI(
 $ - 6.27, - 3.42$
)), and Republicans show a decrease of more than 3 scale points (
$ - 6.27, - 3.42$
)), and Republicans show a decrease of more than 3 scale points (
 $\beta = - 3.14$
, 95% CI(
$\beta = - 3.14$
, 95% CI(
 $ - 4.82, - 1.46$
)). Both Democrats and Republicans move from indicating a positive vote intention on average for the in-party governor’s re-election within the control and tempered-response conditions, to a negative response on average in the retributive condition (Dem:
$ - 4.82, - 1.46$
)). Both Democrats and Republicans move from indicating a positive vote intention on average for the in-party governor’s re-election within the control and tempered-response conditions, to a negative response on average in the retributive condition (Dem:
 $ - 1.57$
, 95% CI(
$ - 1.57$
, 95% CI(
 $ - 2.67, - 0.47$
); Rep:
$ - 2.67, - 0.47$
); Rep:
 $ - 1.06$
, 95% CI(
$ - 1.06$
, 95% CI(
 $ - 2.34,0.21$
)), indicating being “unlikely” to vote for the governor’s re-election.
$ - 2.34,0.21$
)), indicating being “unlikely” to vote for the governor’s re-election.
Columns 3 and 4 show that, while baseline willingness to vote for an out-party governor is much lower, the same pattern of voter response is apparent. For both Democrats and Republicans, the tempered action has no effect on willingness to vote for the out-party governor, while the retributive response significantly decreases willingness to vote (Dem. out-party
 $\beta = - 2.03$
, 95% CI (
$\beta = - 2.03$
, 95% CI (
 $ - 3.41, - 0.67$
); Rep. out-party
$ - 3.41, - 0.67$
); Rep. out-party
 $\beta = - 2.44$
, 95% CI (
$\beta = - 2.44$
, 95% CI (
 $ - 3.87, - 1.01$
)). Taking Democratic and Republican respondents together, the effect size with respect to willingness to vote is considerable for an out-party governor (
$ - 3.87, - 1.01$
)). Taking Democratic and Republican respondents together, the effect size with respect to willingness to vote is considerable for an out-party governor (
 $ - 2.22$
scale points; Hedge’s
$ - 2.22$
scale points; Hedge’s
 $g = 0.51$
) and even larger in response to an in-party governor (
$g = 0.51$
) and even larger in response to an in-party governor (
 $ - 4.07$
scale points, Hedge’s
$ - 4.07$
scale points, Hedge’s
 $g = 0.84$
).
$g = 0.84$
).
The retributive action elicited a strong negative reaction from voters of both parties, whether the governor was from their own party or the opposing party. Indeed, the results run counter to our hypothesis (H2) that respondents would be more critical of political retribution by an out-party official than they would be of the same actions by an in-party official. Contrary to our expectations, the negative reaction to the governor’s use of political retribution is not muted by shared partisanship or magnified by partisan antipathy. On average, the penalty on willingness to vote is slightly larger for a governor from one’s own party, though this pattern is only suggestive (in the initial round, the in-party/out-party difference is in the correct direction but not significant; Appendix Tables A4–A6 show interaction estimates together and for each round separately).
Figure 1 provides a picture of the responses with regard to partisans’ expressed support for the governor’s actions. The left panel shows mean responses among experimental conditions in the original experiment, and the right panel shows means from the replication round. Estimates are shown separately for Republican and Democratic respondents: within both partisan groups, mean responses to an in-party governor are shown in the left-hand column and mean responses to an out-party governor in the right-hand column. Points plot mean support for the governor’s actions within each experimental condition, with the retributive-response conditions denoted with an X. Lines plot 95% confidence intervals estimated using robust standard errors.
Mean support for governor response within experimental condition. Points plot mean support for the governor’s actions within control, tempered-response, and retributive-response experimental conditions. Means are plotted separately for Republican and Democratic respondents, with in-party governor conditions shown in the left-hand column and out-party governor conditions shown in the right-hand column for each partisan group. The first point in each column shows the control group mean, the middle point shows the tempered-response mean, and the third point, marked with an X, plots the mean in the retributive-response condition. 95% confidence intervals are plotted using robust standard errors. The first panel shows data from the original experiment (Round 1), and the second panel shows data from the replication (Round 2).

As with willingness to vote, within each partisan group, the retributive-response condition significantly decreases expressed support for the governor’s actions, while support for the tempered response remains indistinguishable from support in the control group.
For both Republican and Democratic voters, the effect of a retaliatory response from an in-party governor drops support for that in-party governor to the same level as partisans’ support for an out-party governor in the control group. This is apparent in both the original and replication rounds. This shows that, for both Democratic and Republican voters, a Democratic (Republican) governor’s use of political retribution against a vocally critical business renders him as objectionable as an official from the opposing party who exhibits a more tempered response to the criticism.
Comparing the “In-party” columns for Republican and Democratic respondents in both panels of Figure 1 also shows that, contrary to our expectation in H3, Republican respondents are no more accepting of retribution by an in-party governor than are Democratic respondents. There is no indication of an interaction for vote or support in either the original or replication (see Appendix Tables A11–A13).
We also find a great deal of consonance in how partisans respond in terms of the explanations they give for their indicated level of support for the governor’s action. After indicating their degree of support for the governor’s actions, all respondents were asked to select which one option from a list best reflected the reason for their response. The list included reasons for supporting and reasons for opposing the governor’s action. Figure 2 plots the proportion of partisans choosing a given reason for their response.
Reported reasoning behind support for/opposition to governor’s actions. Bars show proportion of partisans selecting the indicated explanation for their support/opposition within each experimental condition. The top row shows conditions presented with a Democratic governor and the bottom row shows conditions presented with a Republican governor. Within each panel, bars on the left side of each pair (blue bars) show proportion of Democratic respondents selecting that explanation, and bars on the right side of each pair (red bars) show proportion of Republican respondents selecting that explanation. Proportions are calculated within party, within experimental condition, so that in each panel blue bars sum to 1 and red bars sum to 1. Original and replication rounds are pooled.

In Figure 2, the top three panels show the reasoning indicated within each condition presented with a Republican governor; the bottom panels show the conditions that were presented with a Democratic governor. Proportions are shown separately for each party: red bars represent the proportion of Republicans in that condition reporting that the indicated explanation best reflects their reasoning; blue bars show the analogous proportion for Democratic respondents assigned to that condition.
Within each condition, reasons for support of the governor’s actions are shown in the left-side (lighter) panel, reasons for opposition shown in the right-side (darker) panel. Across the panel from left to right, the explanations are ordered from most active support to most active opposition, with more passive support/opposition closest to the dividing line at the center of each panel. This forms the following ordering of explanations in each panel:
-
“The Governor has the right to defend themselves against criticism.”
-
“Businesses should not interfere with politics and deserve to be put in their place.”
-
“Democratic [Republican] politicians are often too weak against their opponents and should use their political power to respond.”
-
“Democratic [Republican] politicians too often abuse the powers and authority of their office.”
-
“A Governor should take seriously and listen to the concerns and complaints of businesses in their state.”
-
“A Governor should not use their political power and authority to hurt businesses in their state.”
Examination of the reasons given show a dichotomy between the first two panels in each row (control/tempered conditions) and the last panel in each row (retributive conditions). Comparing control and tempered conditions side-to-side, both panels show largely the same pattern of response, highly reflective of partisan alignment. Within each of these four panels, the two halves are nearly mirror images with colors inverted. Coordinating colors (e.g., red on red) are higher on the lighter (left-hand) side, which displays reasons in support, than on the darker (right-hand) side showing reasons in opposition. Contrasting colors (e.g., red on blue) are higher on the darker (opposition) side than on the lighter (supporting) side.
When comparing those four panels top to bottom—i.e., Republican governor (top) vs. Democratic governor (bottom) within condition—we again see very similar patterns with the colors inverted, showing that Democrats and Republicans exhibit very similar in-party/out-party reasoning within the control and tempered-response conditions. In both rows, the control and tempered panels depict in-party partisans providing active support of the governor’s actions, declining toward the middle, with out-party partisans indicating a relatively uniform distribution of reasons opposing the governor’s actions. In-party respondents in these two conditions exhibit considerable support for the idea that a governor has the right to defend themself against criticism and that the business is out of line [“defense” and “stayout”], while that reasoning is much lower among out-partisans.
Together, these four panels indicate that within the control and tempered-response conditions, Democrats and Republicans show predictable and largely interchangable patterns of in-party/out-party reasoning, and that the responses given in these conditions appear to be shaped primarily by partisanship.
In contrast, in both rows the third panel shows a strikingly bipartisan plurality of respondents indicating active opposition to an elected official using their political power for retaliatory purposes. Whether presented with an in-party or out-party governor, respondents of both parties flock to the right-most, most-active opposition reasoning (“no harm”) in response to the governor’s retributive action.
Overall, these patterns of reported reasoning appear to reflect partisanship as the dominant influence in shaping evaluations at a baseline, business-as-usual level—but that partisans show a strong bipartisan consensus when it comes to an elected official of either party wielding the power of their office against a business in retaliation for voicing political criticism.
Discussion
Among both Democratic and Republican voters, a governor’s political retaliation against a business voicing political criticism drastically decreases willingness to vote for the governor’s re-election, exerting a sizable negative effect regardless of whether the governor is from the respondent’s own party or the opposing party. Indeed, this effect appears slightly larger within party, pushing in-party voters to switch from a positive to a negative vote intention. The negative effect of political retribution on support for the governor is of the same magnitude as the effect of partisanship, the single-most potent political variable across a variety of contexts in the current political landscape.
The finding that the negative effects of political retribution are on par with the effects of partisanship is especially striking due to party-cue-based inferences that respondents could make about the nature of the firm’s criticism. Although our design intentionally left the content of the issue and criticism abstract, a partisan respondent assigned to an in-party condition might reasonably presume that their personal opinion would go against the company’s stance on the issue—that is, respondents might infer that if a company is criticizing a policy strongly supported by a governor from the respondent’s own party, the company is likely taking a position on the issue that the respondent would disagree with. Open-ended responses indicate that these cue-based inferences do occur. For example, one Democratic respondent wrote, “historically, democratic policies typically support worker protections, so I would assume I agree with the governor over the business”; a Republican respondent commented, “In recent times, the most likely reasons for Republicans being in conflict with large businesses are good ones.” To the extent that participants make this cue-based inference of non-alignment with the company’s issue position when assigned to an in-party condition, this makes the strong voter rebuke of an in-party governor’s use of political retribution all the more notable. Voters appear willing to defend corporate political speech even under some presumption of disagreement with the company’s position on the issue.
What accounts for the finding at odds with our hypothesis (H2) that voters would react more negatively to retribution by an out-party governor compared to an in-party governor? While this result contrasts with some prior scholarship—e.g., Krishnarajan’s finding that respondents are less judgmental of undemocratic actions when taken in support of their preferred policiesFootnote 64—it closely mirrors Frye’s finding in the context of Trump voters’ real-time response to the January 6 attack.Footnote 65 In that data and in the results here, the penalty is bigger within party; but in both cases, the in-party baseline is sufficiently high that the larger penalty doesn’t drop support below that felt towards an out-party official. In our data, an in-party governor who abuses their power is seen as on par with a business-as-usual out-party governor (and never as bad as an out-party governor who abuses their power).
Indeed, the unexpected finding of a larger penalty applied to the in-party official may even be a product of the dismal views partisans hold of out-party politicians. If partisans already assume the worst of the out-party, it would be no great surprise to learn an out-party official has blatantly abused their political power—but learning the same of an in-party official could dash considerably higher expectations of that figure’s behavior, with a larger drop in favorability as a result (though still not viewing the in-party figure as worse than the other party). This greater degree of disappointment could also be compounded by concern that the official’s behavior not damage the party brand. Filindra and Harbridge-Yong find tentative evidence that when a party leader’s violation of norms is serious enough, partisans recognize the behavior as a potential threat to the integrity and standing of the party.Footnote 66
Our experiment is not designed to investigate what drives this unexpected finding, and so we can only speculate about the mechanism at work. But some further insight is provided by the reasoning respondents report for their choices (Figure 2). The distribution of reasons given for support/opposition shows the same trends observed in willingness to vote and in support for the official: While partisanship determines levels of response (e.g., Democratic respondents indicate greater willingness to vote for a Democratic governor than for a Republican governor at baseline), partisans’ reaction to retributive behavior is very similar for Democrats and Republicans, in-party and out-party.
In the “business-as-usual” scenarios of the control and tempered-response conditions, which depict corporate criticism of the policy and non-response or verbal pushback from the governor, explanations for support/opposition of the governor reflect partisanship, with reasons in support selected by the in-party and reasons in opposition selected by the out-party with almost mirror-image regularity. Within party, respondents reason that the governor has a right to defend themself against criticism and that the business is out of line. But once the governor turns to retribution, any good-faith assumptions that may have colored in-party reasoning give way to bipartisan consensus that political power should not be used to retaliate against criticism. Because of the shape of the baseline distributions, the shift towards censure is more dramatic within one’s own party.
Partisans appear to largely overcome the influence of partisanship when confronted by an elected official of either party engaging in political retribution. Even though opinion polling indicates a general distaste for corporations engaging in public position-taking on political issues,Footnote 67 partisans do not justify an in-party governor’s retributive actions by reasoning that “Businesses should not interfere with politics and deserve to be put in their place.” Instead, voters exhibit bipartisan consensus in opposing the use of political power to retaliate against a business voicing political criticism.
The explanations provided when respondents were given an opportunity to further articulate their reasoning in the open-ended response questions cast some additional light into underlying motivations. In the retributive condition, these explanations frequently referred to democratic principles. For example, respondents stated that “The governor should not be acting like a dictator. Businesses have rights too…” and “Simply criticizing a politician shouldn’t be enough for them to go after your business. It’s unamerican,” and simply, “It seems more like what [a] tyrant would do.” In a post-hoc exercise, analysis of the open-ended responses by Claude.ai produced an independent assessment that corresponded closely with our broader findings. Regarding the open-ended responses in the retributive condition, “The most striking pattern is that concerns about abuse of power and retaliation emerge as the dominant theme across all groups, even when respondents share the governor’s party affiliation. This suggests that in severe conditions, the principle of appropriate use of governmental power tends to override partisan considerations. However, out-party responses tend to use stronger language about authoritarianism and abuse, while in-party responses often express their concerns in more measured terms about appropriateness and proper governance.”Footnote 68
Throughout our results, we find more similarity than difference in how Democrats and Republicans respond to an elected official abusing their powers of office, and strikingly little evidence of in-party bias. Respondents may have their reasons for preferring one party over the other, as revealed by different baseline levels of support, but the results here show that retribution moves them in similar ways whether the official is a member of their party or not. In-party bias, which has been documented extensively in experimental evidence in a wide range of contexts, undoubtedly influences partisans’ political judgments. But in some contexts these biases could be quite marginal in comparison to a bigger picture of bipartisan consensus, as appears to be the case in these experiments. For example, among Republican respondents in the retributive condition, the proportion who reason that, “A Governor should not use their political power and authority to hurt business,” is significantly lower for an in-party governor than for an out-party governor (i.e., comparing the third panel, right-most red bars in Figure 2 [“no harm”] from top to bottom). This is a valid comparison to make—response severity and in-party status are randomly assigned within party—but the partisan bias evidenced is negligible compared to the bigger picture of bipartisan censure, as shown in both parties converging on this “no harm” response relative to the tempered and control conditions.
The findings from these experiments defied our expectations in interesting and important ways, presenting a picture of partisan voters that is more heartening than some recent literature on voter responses to anti-democratic behavior by elected officials. The bipartisan opprobrium apparent in the results presented here contrasts with many findings showing partisanship to trump democratic norms. Moreover, despite the presence of authoritarian and right-wing populist elements within the current Republican party, Republican voters appear no more accommodating of political retribution than Democratic voters.
The abstract nature of this experimental investigation is important to identifying the causal effects of retribution and partisanship—but contextual factors inevitably shape how voters behave in the real political world. These findings cannot tell us how willingness-to-vote translates to vote choice in a true electoral context, or what the steep drop in in-party support would mean in practical terms for an incumbent elected official.
Consider the example of Governor DeSantis with which we opened this paper. The governor’s favorability polling declined markedly across 2023, the year during which Disney’s lawsuit took place. National opinion polling shows that the proportion of respondents reporting an unfavorable opinion of DeSantis climbed from 36% in January of that year to 49% by December.Footnote 69 The Governor also saw a steady decline in support among his base: the proportion of Florida Republican voters reporting strong approval of his performance dropped 17 percentage points over the course of the year.Footnote 70 Of course, it is not possible to attribute these changes to the Governor’s quarrel with Disney. Many other consequential events took place during that time—most notably Gov. DeSantis’s unsuccessful bid for the Republican presidential nomination.
Future work could investigate how factors like the surrounding electoral context or the specific issues in question affect how voters weigh the elected official’s actions. But the results reported here provide insight into partisan response to such behavior from an elected official at a fundamental level. These findings suggest that, even with regard to a right that Americans feel as ambivalent about as corporate freedom of speech, partisans hold a shared belief that political retribution remains outside the bounds of acceptability, regardless of party.
Supplementary material
The supplementary material for this article can be found at https://doi.org/10.1017/bap.2025.10
Competing interests
The authors declare none.


 Open access