




Introduction
Clay-rich sediments are recognized as significant hosts of Li (Teng et al., Reference Teng, McDonough, Rudnick, Dalpé, Tomascak, Chappell and Gao2004) which is in high demand as an alternative energy resource (Starkey, Reference Starkey1982; Bradley et al., Reference Bradley, Stillings, Jaskula, Munk and McCauley2017; Zhao et al., Reference Zhao, Wang and Cheng2023; Emproto et al., Reference Emproto, Benson, Gagnon, Baek, Ibarra and Simon2025). Lithium substitutes in the octahedral sheets of clay minerals (smectite, illite, kaolinite, chlorite), replacing Mg and Al in trioctahedral clays and occupying vacant sites of dioctahedral smectite (Greene-Kelly, Reference Greene-Kelly1955; Starkey, Reference Starkey1982). However, ore-grade amounts of Li can be adsorbed on expandable clay surfaces (Decarreau et al., Reference Decarreau, Vigier, Pálková, Petit, Vieillard and Fontaine2012; Li and Liu, Reference Li and Liu2022) with variable Li-isotopic compositions (δ7Li) depending on the fluid composition and temperature. Because adsorbed Li may not be in equilibrium with the mineral that crystallized from paleofluids, it must be removed from samples before analyzing the δ7Li of structural Li (Chan and Edwards, Reference Chan and Edwards1988).
The use of mannitol to remove adsorbed-B contaminants from minerals before isotopic analysis is well established (Leeman and Sisson, Reference Leeman, Sisson, Grew and Anovitz1996; Tonarini et al., Reference Tonarini, Pennisi and Leeman1997). Mannitol (C6H14O6) is a polyhydric alcohol (polyol) that is a linear chain of six carbons, with a hydroxyl group attached to each carbon atom. Because of the success of mannitol at removing B contaminants from minerals, and given the geochemical similarity of Li and B, both light incompatible elements that substitute in clays, this study examined the efficacy of mannitol for extracting surface adsorbed-Li from clays and isolating interlayer-Li for isotopic (δ7Li) comparison with structural Li (Williams and Hervig, Reference Williams and Hervig2005; Williams et al., Reference Williams, Turner and Hervig2007).
Mannitol complexation with boron and lithium
Mannitol is one of the most common biomolecules found in nature (Godswill, Reference Godswill2017). It is a non-toxic biomolecule that is easily decomposed to carbon in the environment, which benefits microbial communities involved in nitrogen fixation and ureolysis (Yu et al., Reference Yu, Shao, Xu, Xie, Yang, Gao and Si2023). Mannitol is used as a dietary sugar, and in medical applications as a diuretic and osmotic agent to reduce intracranial pressure after brain trauma (Wakai et al., Reference Wakai, McCabe, Roberts and Schierhout2013), and for acute liver failure (Saraswat et al., Reference Saraswat, Saksena, Nath, Mandal, Singh, Thomas, Rathore and Gupta2008). The nature of the mannitol complex with alkali metal ions has been studied extensively (e.g. Dolezal et al., Reference Dolezal, Klausen and Langmyer1973; Gyurcsik and Nagy, Reference Gyurcsik and Nagy2000; Gaidamauskas et al., Reference Gaidamauskas, Norkus, Vaiciuniene, Crans, Vuorinen, Jaciauskiene and Baltrunas2005) as it relates to carbohydrate storage (Soloman et al., Reference Soloman, Waters and Oliver2007).
In geological applications, mannitol has commonly been used to prevent boron volatilization during isotopic analysis by thermal ionization mass spectrometry (Ishikawa and Nakamura, Reference Ishikawa and Nakamura1990; Nakamura et al., Reference Nakamura, Ishikawa, Birck and Allégre1992; Leeman and Sisson, Reference Leeman, Sisson, Grew and Anovitz1996). Boron bonds with mannitol through a Lewis acid-base reaction, forming stable cyclic borate esters by chelation on the adjacent hydroxyl groups (Belcher et al., Reference Belcher, Tully and Svehla1970; Makkee et al., Reference Makkee, Kieboom and van Bekkum1985; Geffen et al., Reference Geffen, Semiat, Eisen, Balazs, Katz and Dosoretz2006). The borate anion acts as a Lewis acid, accepting electron pairs from the oxygen atoms of the mannitol hydroxyl groups (Magnusson, Reference Magnusson1971). This results in the formation of covalent B–O bonds, displacing water molecules, and creates stable negatively charged cyclic complexes (Bull et al., Reference Bull, Davidson, Van den Elsen, Fossey, Jenkins, Jiang, Kubo, Marken, Sakurai, Zhao and James2013). The boron-mannitol complex formation has been demonstrated to extract surface-B contaminants from minerals (Tonarini et al., Reference Tonarini, Pennisi and Leeman1997; Williams et al., Reference Williams, Hervig, Holloway and Hutcheon2001).
The mechanism of Li bonding to mannitol has been studied less. Mannitol does not form a strong, covalent bond with Li+, but has a more electrostatic interaction (Chen et al., Reference Chen, Shen, Luo, Cao, Feng, Chen, Fang and Cao2023). Lithium ions interact with the partial negative charge on oxygen atoms of polar molecules like water or the hydroxyl groups of mannitol. This electrostatic attraction is the fundamental force in solvation. Due to its specific stereoscopic configuration, mannitol can form strong ion-dipole interactions with Li+, effectively integrating itself into the Li⁺ solvation sheath (Chen et al., Reference Chen, Shen, Luo, Cao, Feng, Chen, Fang and Cao2023). Because of the small ionic radius of Li+ (0.76 Å) and its high charge density, Li+ forms a strong electrostatic attraction to polar water molecules leading to a tightly bound hydration shell consisting of four inner and two outer coordinated waters (Rempe et al., Reference Rempe, Pratt, Hummer, Kress, Martin and Redondo2000) that give Li+ a relatively large, hydrated radius (1.38 Å). In a water-based solution, Li+ is primarily solvated by water molecules; however, when mannitol is present, the polyol competes with water to enter the solvation shell of the Li+ due to the high density of oxygen-rich functional groups in mannitol (Politi et al., Reference Politi, Sapir and Harries2009). Generally, polyols capable of forming stable five- or six-membered chelate rings with Li+ tend to exhibit the strongest interactions (Martell and Hancock, Reference Martell, Hancock and Fackler1996).
Both Li and B are commonly concentrated in geological fluids, including hydrothermal fluids (Millot and Negrel, Reference Millot and Negrel2007; Tomascak et al., Reference Tomascak, Magna and Dohmen2016) and oilfield brines (Collins, Reference Collins1976; Williams et al., Reference Williams, Elliott and Hervig2015; Yu et al., Reference Yu, Wang, Huang and Yan2024). They are incompatible elements, like rare earths, with a partition coefficient of <<1 (Albarède, Reference Albarède2003). Hingston (Reference Hingston1964) reported the use of mannitol to remove B [B(OH)3 and B(OH)4–] from clay-mineral surfaces and showed that the amount of B adsorbed to clay is a function of the mineralogy and fluid pH. More B is adsorbed to clays at high pH where OH– dominates. Similarly, mannitol complexes with B most efficiently at high pH, forming alkali-borate complexes (Tsuzuki, Reference Tsuzuki1941). The concentration of mannitol that best stabilizes the B-mannitol complex was shown to be an approximate equimolar concentration (Ishikawa and Nakamura, Reference Ishikawa and Nakamura1990); thus higher concentrations of mannitol are needed to chelate higher concentrations of adsorbed B on minerals.
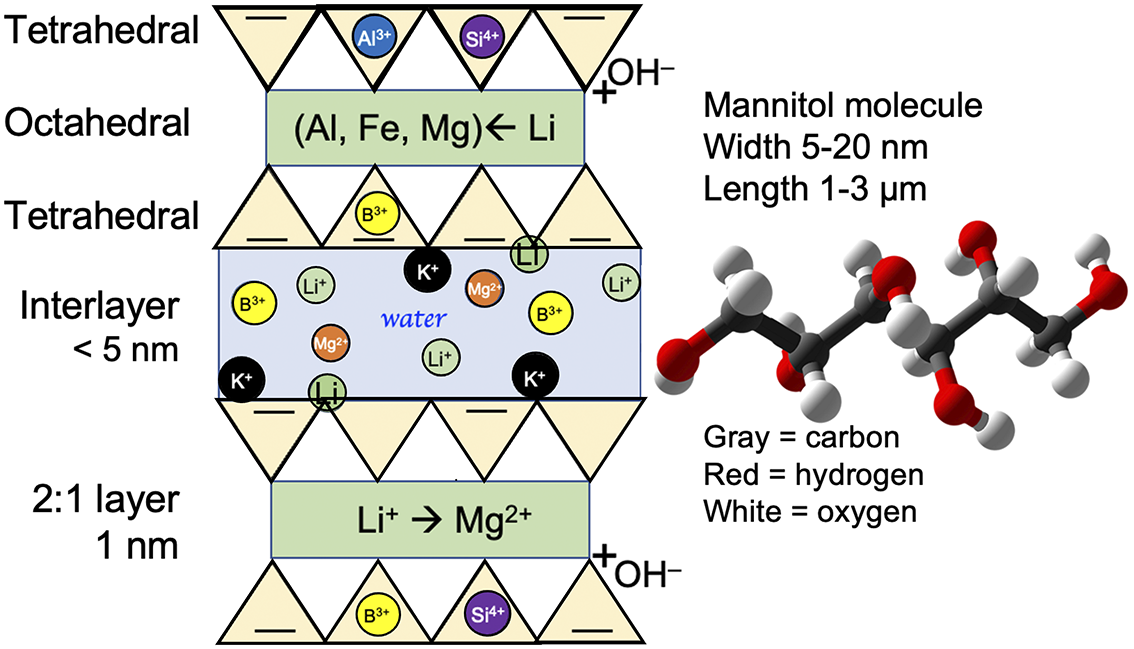
Structurally, B substitutes for Si and Al in tetrahedral sheets of 2:1 clays (e.g. smectite and illite), but it is also trapped in the clay interlayers (Williams and Hervig, Reference Williams and Hervig2002). Following methods developed by Ishikawa and Nakamura (Reference Ishikawa and Nakamura1990) and later modified (Nakamura et al., Reference Nakamura, Ishikawa, Birck and Allégre1992; Tonarini et al., Reference Tonarini, Pennisi and Leeman1997), mannitol was applied to remove surface-adsorbed B from expandable clays (illite-smectite; Williams et al., Reference Williams, Hervig, Holloway and Hutcheon2001). Clays containing >100 μg g–1 B rinsed with 0.1 M mannitol lost up to 10% B but left some adsorbed B interpreted to be in the smectite interlayers (Williams and Hervig, Reference Williams and Hervig2002). The B–OH ligands bridge to surface-adsorbed H+ (Keren and Mezuman, Reference Keren and Mezuman1981; Leeman and Sisson, Reference Leeman, Sisson, Grew and Anovitz1996; Ring et al., Reference Ring, Henehan, Blukis and von Blanckenburg2025) along the basal siloxane surfaces of the negatively charged tetrahedral (Si-O) clay layer (Fig. 1). Cation exchange (Jackson, Reference Jackson1979; Moore and Reynolds, Reference Moore and Reynolds1997) removed the remaining interlayer B and changed the B isotopic composition (δ11B) of smectite by ~10‰.
Schematic cross-section of smectite showing the mineral structure, with oxygen located at tetrahedral apices. Cation substitutions in the tetrahedral and octahedral sheets affect the charge on the basal interlayer surfaces, attracting hydrated cations. A mannitol molecule is shown for size comparison (https://en.wikipedia.org/wiki/Mannitol).

Figure 1. Long description
The diagram illustrates a 2:1 layer mineral structure with a total thickness of 1 nanometer.
From top to bottom, the layers are:
- A Tetrahedral sheet composed of inverted triangles containing Al3+ and Si4+ cations. Negative charges are at the apices, and an OH_group is attached at edges.
- An Octahedral sheet shown as a green rectangle containing (Al, Fe, Mg) with an arrow indicating Li substitution.
- A second Tetrahedral sheet with upright triangles the structural location of B3+ cation.
- An Interlayer space less than 5 nanometers thick, labeled ‘water’ in blue text. It contains various hydrated cations including B3+, Li+, K+, Mg2+.
- A repeating 2:1 layer structure below the interlayer, starting with a Tetrahedral sheet, followed by an Octahedral sheet labeled Li+arrow Mg2+, and a final Tetrahedral sheet at the base.
To the right of the mineral structure is a Mannitol molecule. Text indicates a width of 5 to 20 nanometers and a length of 1 to 3 micrometers. A ball-and-stick model shows the molecule where gray spheres represent carbon, red spheres represent hydrogen, and white spheres represent oxygen.
As clay minerals grow over time, each size fraction records equilibrium with new fluids, and can be used to document fluid compositional changes over geological time (e.g. Williams et al., Reference Williams, Środoń, Huff, Clauer and Hervig2013; Clauer et al., Reference Clauer, Williams and Fallick2014). However, after mineral authigenesis, lower-temperature fluids may enter the expandable clay interlayers as the samples are exhumed (mined) or transported in sedimentary rocks on Earth or on extraterrestrial bodies (e.g. asteroids). Those more recent fluids may incorporate Li with a different isotopic composition in the clay interlayers (Williams et al., Reference Williams, Turner and Hervig2007).
A comparison is shown (Fig. 1) of the dimensions of a mannitol molecule (5–20 nm wide) vs the d spacing (Środoń, Reference Środoń1980) between basal surfaces of most expandable clays (commonly <2 nm; Szczerba and Ufer, Reference Szczerba and Ufer2018). Due to the size difference, a mannitol molecule does not fit readily in the interlayer space; therefore, it was hypothesized that mannitol could only complex with Li on exterior mineral surfaces (Williams and Hervig, Reference Williams and Hervig2005). Alternatively, if mannitol extracts soluble adsorbed Li (exchangeable) electrostatically attracted to clay surfaces, then interlayer-bound Li (fixed) may be isolated subsequently by extraction using standard cation exchange methods (Jackson, Reference Jackson1979). The isotopic composition of interlayer-bound Li has recently been shown to reflect the δ7Li of aqueous solutions with no significant isotopic fractionation (Li et al., Reference Li, Lu, Chen, Zhang, Cheng, Liu and Yin2023; Li et al., Reference Li, Liu, Wang, Cheng, Yin, Wang and Lu2025).
Isotopic equilibrium vs adsorption
Similar trends are observed for B and Li adsorption in smectite interlayers as the layer charge increases during illitization (Williams and Hervig, Reference Williams and Hervig2005). Below is a brief review of interlayer adsorption vs substitution in the mineral stucture (Pistiner and Henderson, Reference Pistiner and Henderson2003; Vigier et al., Reference Vigier, Decarreau, Millot, Carignan, Petit and France-Lanord2008). Hydrothermal experiments (Williams et al., Reference Williams, Hervig, Holloway and Hutcheon2001) were conducted to determine equilibrium B-isotope fractionation between illite-smectite (I-S) and water as a function of temperature (Fig. 2). Similar experiments were also conducted to determine equilibrium Li-isotope fractionation factors (Williams and Hervig, Reference Williams and Hervig2005). Starting with a smectite reference sample (SWy-1; obtained from the Source Clays Repository of The Clay Minerals Society), the <2 μm size fraction was K-saturated using 1 M KCl as a source of K+ to drive the illitization reaction to equilibrium over ~5 months. In nature, illitization of smectite occurring between 50 and 250°C, requires a K+ supply, and generally does not reach equilibrium for millions of years (Hower et al., Reference Hower, Eslinger, Hower and Perry1976; Lanson et al., Reference Lanson, Sakharov, Claret and Drits2009).
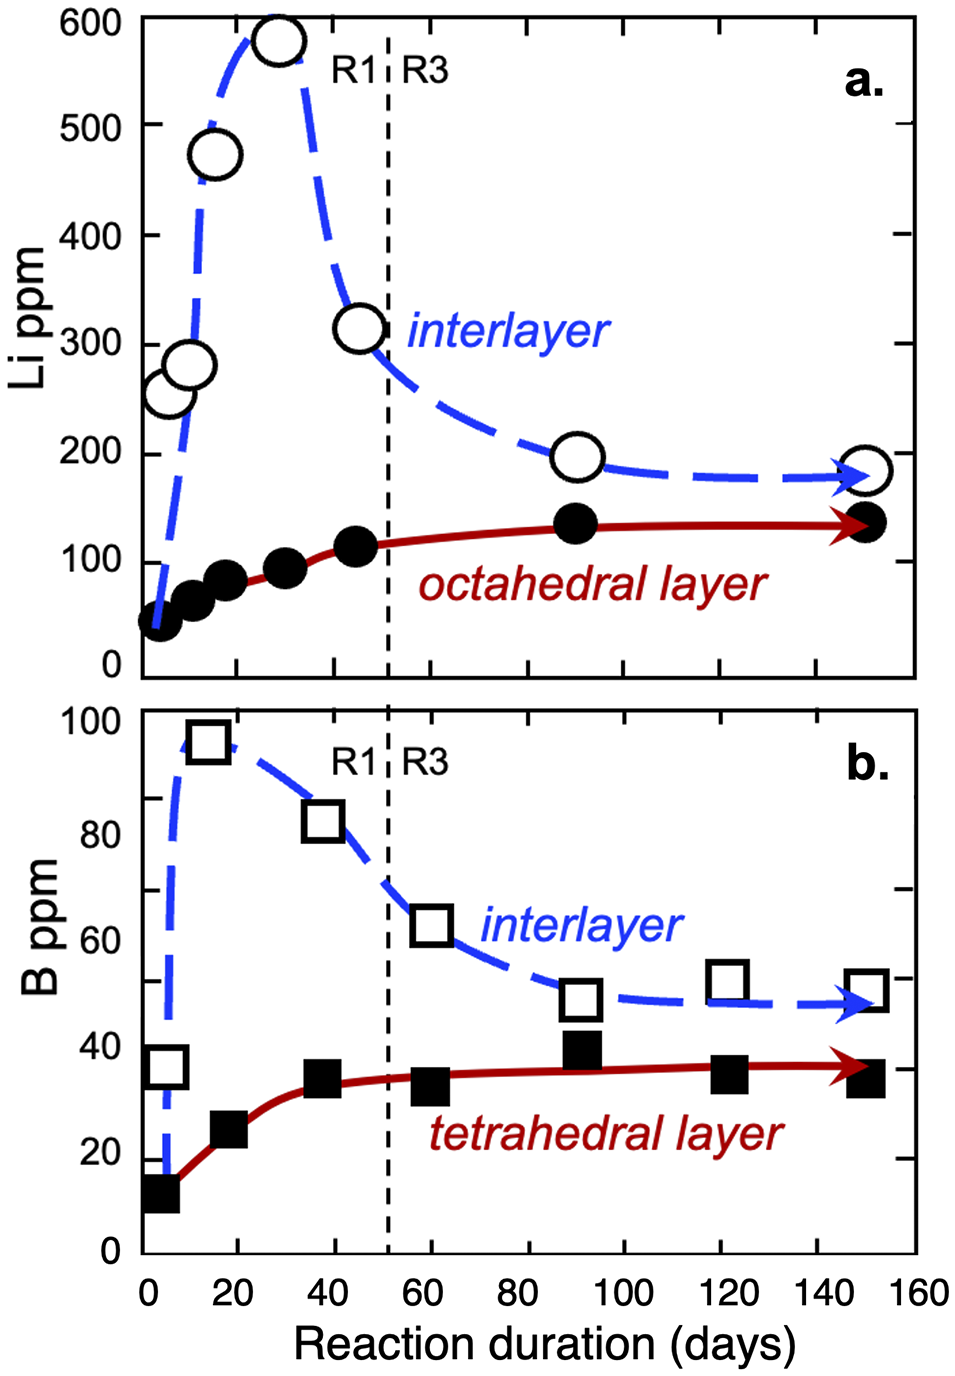
Hydrothermal experiment results (300°C; 100 MPa) showing changes in: (a) the interlayer and structurally bound Li; (b) similar trends in the B content of smectite during illitization. Blue = interlayer; red = structural sites (Williams and Hervig, Reference Williams and Hervig2005).

Figure 2. Long description
Two vertically stacked line graphs share a common x-axis titled Reaction duration in days, ranging from 0 to 160 d. A vertical dashed line at approximately 52 days separates regions labeled R 1 and R 3.
Panel a, the top graph, plots Li ppm on the y-axis from 0 to 600.
- The interlayer data, shown as a blue dashed line with open circles, rises sharply from 50 to a peak of nearly 600 ppm p pmat 25 days, then declines through the R 1 to R 3 transition, leveling off at 180 ppm.
- The octahedral layer data, shown as a solid red line with black circles, shows a gradual, steady increase from near 40 ppm to approximately 130 ppm by 150 days.
Panel b, the bottom graph, plots B ppm on the y-axis from 0 to 100.
- The interlayer data, shown as a blue dashed line with open squares, spikes from 35 to nearly 100 ppm within 15 days, then decreases steadily across the R 1 and R 3 boundary to plateau around 50 ppm.
- The tetrahedral layer data, shown as a solid red line with black squares, increases from 12 p p m and plateaus early at approximately 35 p p m around the 40-day mark, remaining stable through the end of the experiment.
Substituting temperature for time, the cold-seal vessel experiments were conducted in gold tubing, hydrothermally pressurized at 300°C, 100 MPa (Williams et al., Reference Williams, Hervig, Holloway and Hutcheon2001; Williams and Hervig, Reference Williams and Hervig2005). Smectite was suspended in 0.1 M B and Li solutions (B(OH)3 or LiOH) buffered to pH 6 at reaction temperature using a 1:1 fluid:mineral ratio. The samples were quenched in time series over 160 days to evaluate changes in the B or Li content of the smectite interlayer and structural sites, during the approach to equilibrium as smectite reacts to illite. Equilibrium was evaluated by monitoring the fractionation of O isotopes between the mineral and water (at 300°C) until the theoretical value was achieved (Savin and Lee, Reference Savin, Lee and Bailey1988). It is assumed that when (Si, Al)–O bonds approach equilibrium, the rest of the aluminosilicate cations do likewise (Williams et al., Reference Williams, Hervig, Holloway and Hutcheon2001). The changes in B and Li contents of the mineral over time (Fig. 2) show similar trends during progressive illitization of smectite. First, total B and Li contents were measured on the clay fraction; then, cation exchange (using 1 M NH4Cl) removed interlayer B and Li, leaving only the structural B and Li (tetrahedral and octahedral, respectively). Finally, the interlayer δ7Li was determined by mass balance (e.g. Hayes, Reference Hayes2004).
The increase in interlayer B and Li during the R1 ordering of I-S (ISIS; Reynolds, Reference Reynolds, Brindley and Brown1980) reflects the increasing layer charge during illitization. While B3+ substitutes in the tetrahedral sheets, and Li+ substitutes in the octahedral sheets, K+ substitutes primarily in the interlayer, along with minor B, Li, and other cations. However, during R3 ordering (IIIS; Reynolds, Reference Reynolds, Brindley and Brown1980) the mineral restructuring (dissolution/precipitation) to form illite releases exchangeable interlayer B and Li and fixes the preferred K+ cation. While structural B and Li represent an equilibrium isotopic composition as a function of the fluid composition and crystallization temperature, the interlayer B and Li do not (Li and Liu, Reference Li and Liu2020; Li and Liu, Reference Li and Liu2022). Rather, the increasing interlayer B and Li during R1 ordering (Fig. 2) relates to gradual inner-sphere bonding of some interlayer cations and the electrostatic attraction of exchangeable cations as surface charge increases. The small amount of insoluble (fixed) cations preserves the isotopic composition of fluids that are not necessarily in equilibrium with the clay mineral structure (Williams et al., Reference Williams, Turner and Hervig2007; Wimpenny et al., Reference Wimpenny, Colla, Yu, Yin, Rustad and Casey2015; Li et al., Reference Li, Lu, Chen, Zhang, Cheng, Liu and Yin2023). In nature, low-layer-charge expandable clays (e.g. smectite) preserve the isotopic composition of fluids that enter the interlayer after structural Li equilibration occurred during neoformation.
Mannitol extraction of adsorbed Li from hectorite
A preliminary study was conducted on hectorite (Mg, Li-smectite) from a playa deposit (San Bernardino, CA, USA) to evaluate the potential for mannitol to extract adsorbed Li from a natural, Li ore-grade smectite (Chipera and Bish, Reference Chipera and Bish2001), and its effect on the δ7Li. Treatment of hectorite (SHCa-1; obtained from the Source Clays Repository of The Clay Minerals Society) using 0.1 M mannitol (0.5 g clay per 40 mL equilibrated for 24 h) showed a reduction in Li content from 6091 μg g–1 (±10%; n=3) to 926 μg g–1 (±5%; n=4). This 84% removal of Li from the hectorite showed that mannitol is effective for the extraction of significant amounts of adsorbed-Li from clay-rich sediments, but the mannitol concentration needs to be increased for more complete Li extraction. The Li isotopic composition (δ7Li) of the bulk hectorite sample was isotopically light, –14±0.9‰ (n=9), but after mannitol extraction of soluble Li, the hectorite δ7Li increased to –4.4±0.9‰ (n=6). These results inspired questions about how much adsorbed Li could be extracted easily from Li-rich clays prior to acidification and thermal treatments to extract structural-Li (Zhao et al., Reference Zhao, Wang and Cheng2023; Liu et al., Reference Liu, Xu, Sun, Wang and Zhang2024). This study also highlights how much surface-adsorbed Li can contaminate Li isotopic compositions of bulk sediments if not removed.
Materials and methods
Experimental methods
Three common sedimentary minerals (quartz, kaolinite, smectite) were initially cation exchanged using 1.0 M NH4Cl (Zhang et al., Reference Zhang, Chan and Gieskes1998) to remove inherent adsorbed Li (external and interlayer-Li). All reagents were supplied by Sigma-Aldrich (St Louis, MO, USA). The 1.0 M NH4+ preferentially replaces Li+ because of its high concentration, similar charge, and preferred hydrated radius (Jackson, Reference Jackson1979; Eberl, Reference Eberl1980; Moore and Reynolds, Reference Moore and Reynolds1997). The Li content and δ7Li measured after cation exchange represents the structural Li (octahedral + di-trigonal cavities; Hindshaw et al., Reference Hindshaw, Tosca, Gout, Farnan, Tosca and Tipper2019). Each mineral was then evaluated for Li adsorption capacity from a 1.0 M LiCl solution (Sigma-Aldrich 213223), and the effectiveness of mannitol (Sigma-Aldrich M9546) at various concentrations, for removal of the adsorbed Li. The amount of Li extracted by mannitol was compared with the total amount of adsorbed Li on each mineral, and the δ7Li was measured after each treatment. Mineral sources were quartz sand (Sigma-Aldrich 204358), kaolinite (KGa-1), and smectite (SWy-1) obtained from the Source Clays Repository of The Clay Minerals Society. The <2 μm clay minerals were evaluated for purity using X-ray diffraction (Chipera and Bish, Reference Chipera and Bish2001), and mineral separates were >95% pure. The clay minerals were isolated using centrifugation to select the <2 μm particles (Jackson, Reference Jackson1979; Moore and Reynolds, Reference Moore and Reynolds1997). The quartz sand was sieved to <0.4 mm, then wet ground in a McCrone Mill with ethanol to a particle size of ~20 μm (Środoń et al., Reference Środoń, Drits, McCarty, Hseigh and Eberl2001). The powder was dried (60°C) and rinsed in triplicate using resin-filtered deionized water before analysis of the solid by secondary ion mass spectrometry (SIMS).
Boron and Li are common contaminants in geochemical laboratories due to laboratory usage of lithium tetraborate for preparation of X-ray fluorescence (XRF) fused pellets, grinding of borosilicate glass for preparing rock thin sections, and atmospheric dust. Therefore, even ultra-purified distilled-deionized water (18 MΩ cm resistance) must be filtered through resin specific for removal of B (Amberlite™ IRA743; Dupont) and Li (AmberSep™ G26H; Dupont) when studying minerals with low B and Li contents. As a precaution, B- and Li-filtered deionized water (filtered-DIW) was used in the present study for sample rinsing and in preparation of all chemicals used (e.g. mannitol, NH4Cl, LiCl, LiOH). The choice of NH4Cl for cation exchange is based on nuclear magnetic resonance (NMR) studies (Theng et al., Reference Theng, Hayashi, Soma and Seyama1997; Hindshaw et al., Reference Hindshaw, Tosca, Gout, Farnan, Tosca and Tipper2019) showing that NH4+ preferentially replaces interlayer Li and does not remove Li from octahedral sites or pseudohexagonal (di-trigonal) sites in the smectite structure (Sposito et al., Reference Sposito, Skipper, Sutton, Park, Soper and Greathouse1999).
After the initial cation exchange with 1.0 M NH4Cl (initial [Li]; Table 1), the mineral powders were saturated with 1.0 M LiCl having a δ7Li of –25.1±1.2‰. In a polypropylene falcon tube, a 1 g mineral per 40 mL solution was shaken overnight in a wrist-action shaker, then rinsed in triplicate in filtered-DIW. Removal of the Cl– was evaluated using the standard AgNO3 test method for chloride ions in water (Szabadváry and Chalmers, Reference Szabadváry and Chalmers1979; ASTM D4458-15, 2023).
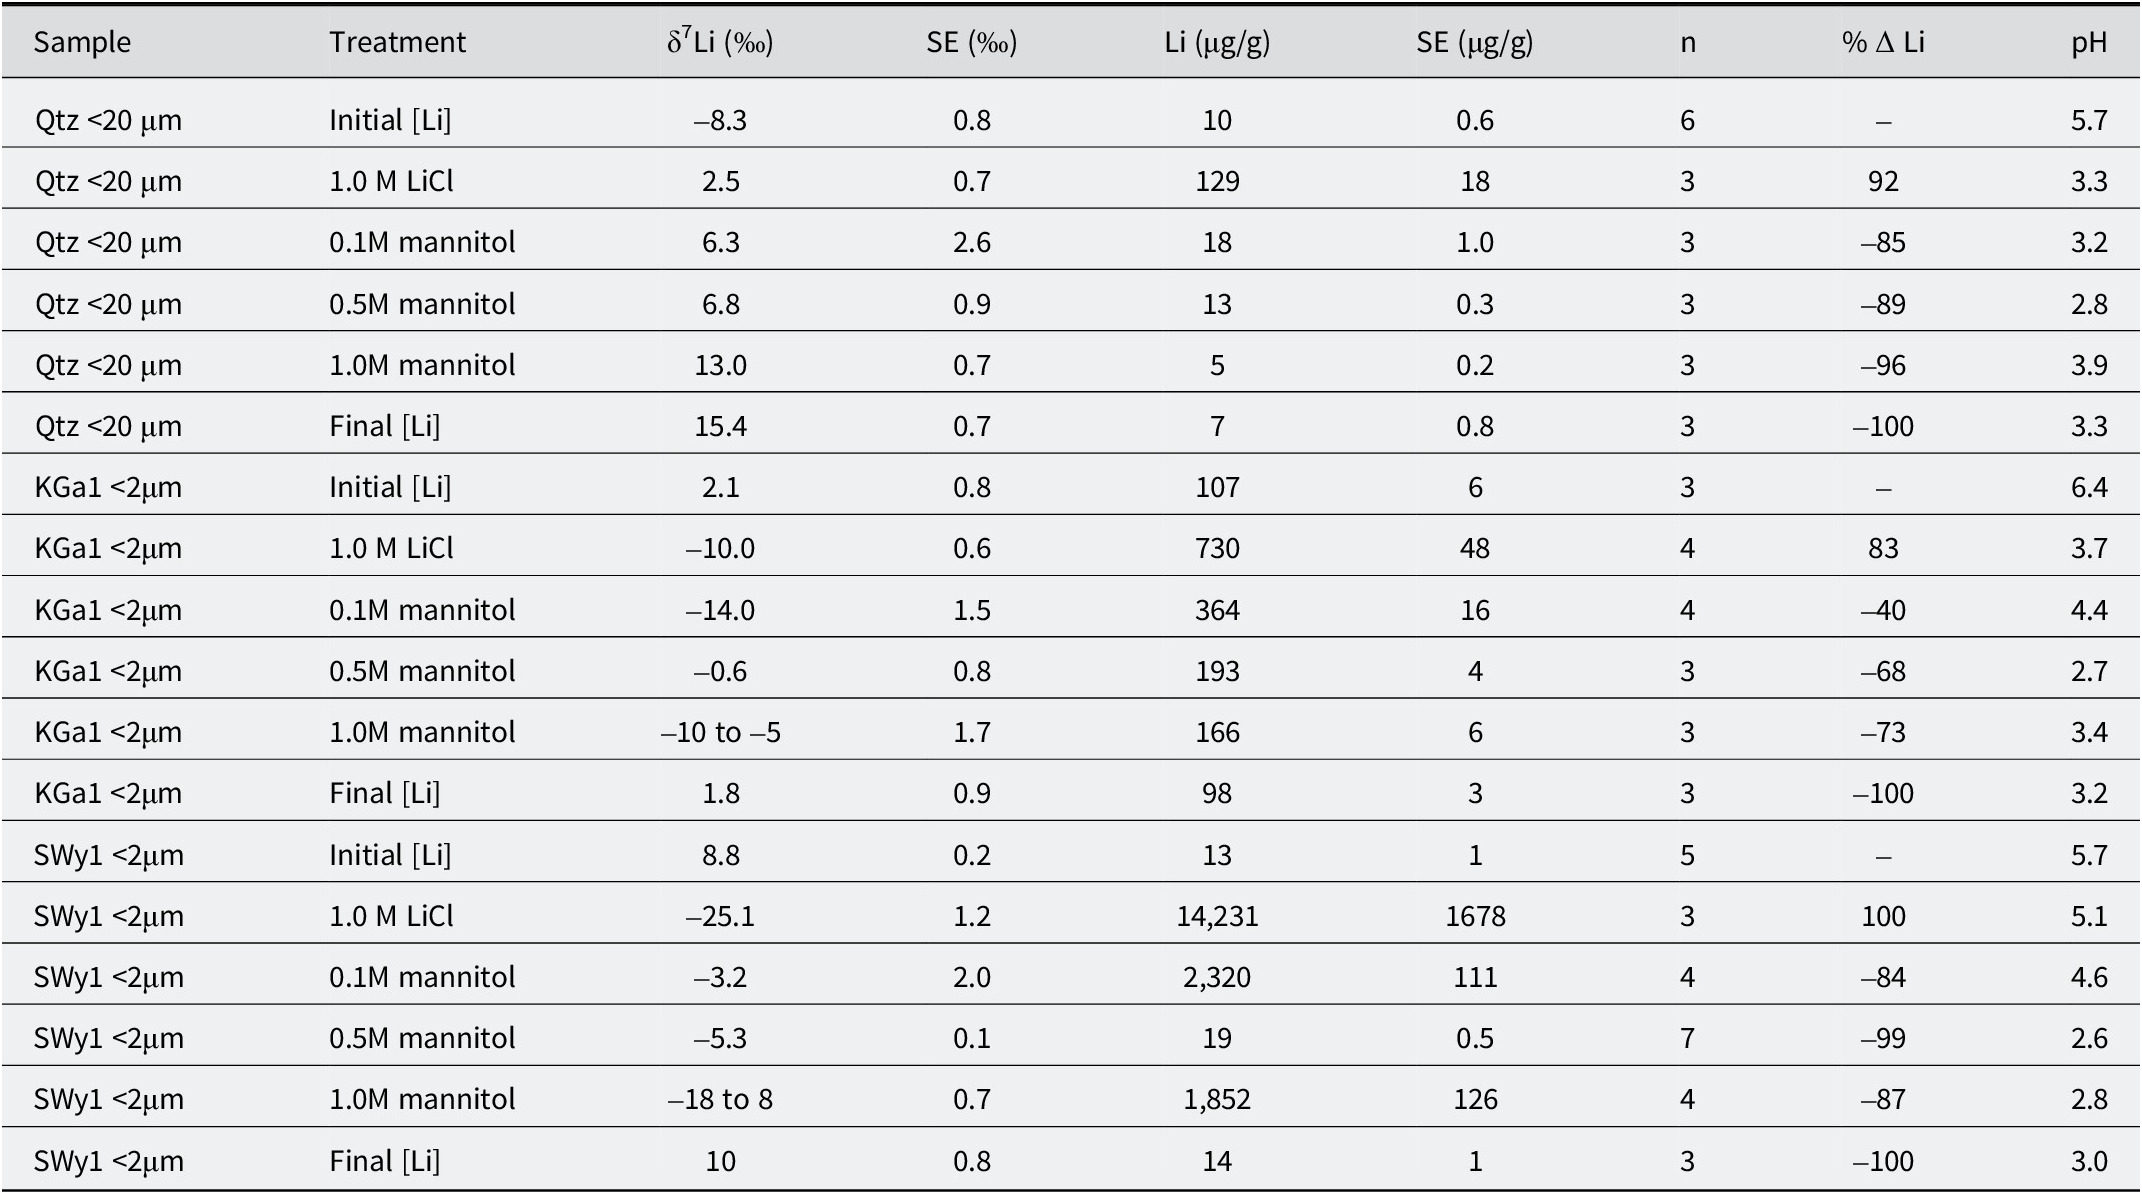
Summary of Li content and δ7Liδ measured by SIMS after each treatment to add or remove Li (treatments were made on separate aliquots of each mineral, not in series)

Table 1. Long description
The table contains 9 columns: Sample, Treatment, delta 7 L i (per mil), S E (per mil), L i (micrograms per gram), S E (micrograms per gram), n, percent Delta L i, and p H.
1. Qtz less than 20 micrometers group:
- Initial [L i]: delta 7 L i -8.3, L i 10, p H 5.7.
- 1.0 M L i Cl: delta 7 L i 2.5, L i 129, p H 3.3.
- 0.1 M mannitol: delta 7 L i 6.3, L i 18, p H 3.2.
- 0.5 M mannitol: delta 7 L i 6.8, L i 13, p H 2.8.
- 1.0 M mannitol: delta 7 L i 13.0, L i 5, p H 3.9.
- Final [L i]: delta 7 L i 15.4, L i 7, p H 3.3.
2. KGa1 less than 2 micrometers group:
- Initial [L i]: delta 7 L i 2.1, L i 107, p H 6.4.
- 1.0 M L i Cl: delta 7 L i -10.0, L i 730, p H 3.7.
- 0.1 M mannitol: delta 7 L i -14.0, L i 364, p H 4.4.
- 0.5 M mannitol: delta 7 L i -0.6, L i 193, p H 2.7.
- 1.0 M mannitol: delta 7 L i -10 to -5, L i 166, p H 3.4.
- Final [L i]: delta 7 L i 1.8, L i 98, p H 3.2.
3. SWy1 less than 2 micrometers group:
- Initial [L i]: delta 7 L i 8.8, L i 13, p H 5.7.
- 1.0 M L i Cl: delta 7 L i -25.1, L i 14,231, p H 5.1.
- 0.1 M mannitol: delta 7 L i -3.2, L i 2,320, p H 4.6.
- 0.5 M mannitol: delta 7 L i -5.3, L i 19, p H 2.6.
- 1.0 M mannitol: delta 7 L i -18 to 8, L i 1,852, p H 2.8.
- Final [L i]: delta 7 L i 10, L i 14, p H 3.0.
Analytical errors are reported as standard error (SE) = (standard deviation, √n), where n is the number of analyses on each sample. All SE values are within 2 σ of predicted error based on counting statistics.
Lithium adsorbed to the minerals from the 1.0 M LiCl solution was measured using SIMS. An aliquot of each of the Li-saturated minerals was then equilibrated with 0.1 M, 0.5 M, and 1.0 M mannitol solutions for 24 h, at 25°C. Samples in mannitol were initially dispersed using a Branson 450 ultrasonic disaggregator with microtip at maximum power for 30–60 s, then shaken for 24 h at room temperature, and rinsed in filtered-DIW at least in triplicate before mounting for SIMS analyses. The Li contents and δ7Li were measured after each treatment to determine the efficiency of each mannitol concentration for Li extraction, and the effect on the adsorbed-Li isotopic composition.
Finally, the samples were treated a second time with 1.0 M NH4Cl to remove all adsorbed Li (including interlayer Li; final [Li], Table 1). After each chemical treatment the minerals were rinsed until the clays dispersed. Final rinses of the clay minerals required centrifugation at 20,000 rpm (~50K RCF) for ~45 min to settle the ≥0.02 μm clay particles (Jackson, Reference Jackson1979). The 20 μm quartz samples settled quickly, leaving a clear Cl– free supernatant indicated by the AgNO3 test (ASTM D4458-15, 2023).
Analytical methods
SIMS was used to measure the Li content and δ7Li of mineral separates. A CAMECA IMS 6f solid-state mass spectrometer was used at the Arizona State University SIMS Laboratory. Methods have been described previously in detail by Williams et al. (Reference Williams, Clauer, Hervig and Sylvester2012). Briefly, ~5 mL of mineral suspensions (~20–50 mg mL–1) were dropped onto nominally Li-free, 25 mm round glass slides (Buehler p/n 408011100). The surface tension of the hydrated suspension orients the clay platelets parallel to the surface as they dry onto the slide. The δ7Li of the Li-saturation solutions (LiCl, Li,OH) were analyzed by evaporating onto the clay mounts. Very dilute suspensions of the quartz allowed particles to stick to the glass surface as well. Samples were gold coated to compensate for charging during analysis. An internal reference standard (IMt-1 Silver Hill illite; obtained from the Source Clays Repository of The Clay Minerals Society) of known Li content and isotopic composition was used to evaluate instrumental mass fractionation and drift (Williams et al., Reference Williams, Clauer, Hervig and Sylvester2012). Sample-standard bracketing was used to monitor instrumental drift with 3–5 analyses of the internal reference (IMt-1) between analyses of unknowns.
The analyses were conducted using a –12.5 keV primary ion beam of O2– and a sample voltage of +5 keV for a total impact energy of –7.5 keV. The primary beam was defocused to ~30 μm to promote slower ion sputtering and a more stable secondary ion signal. Where Li contents were high (>1000 μg g–1), an aperture of 15 to 4 μm diameter was used to limit the secondary ion counts, allowing detection of all ions using an electron multiplier. The mass resolving power (mass/Dmass) was adjusted to ~1200 to eliminate interferences from 14N2+ and 6LiH, on 7Li, and 12C2+ and 24Mg4+, on 6Li (Teichert et al., Reference Teichert, Bose, Williams, Hervig and Williams2022).
Results
Li content and δ7Li changes during adsorption and extraction
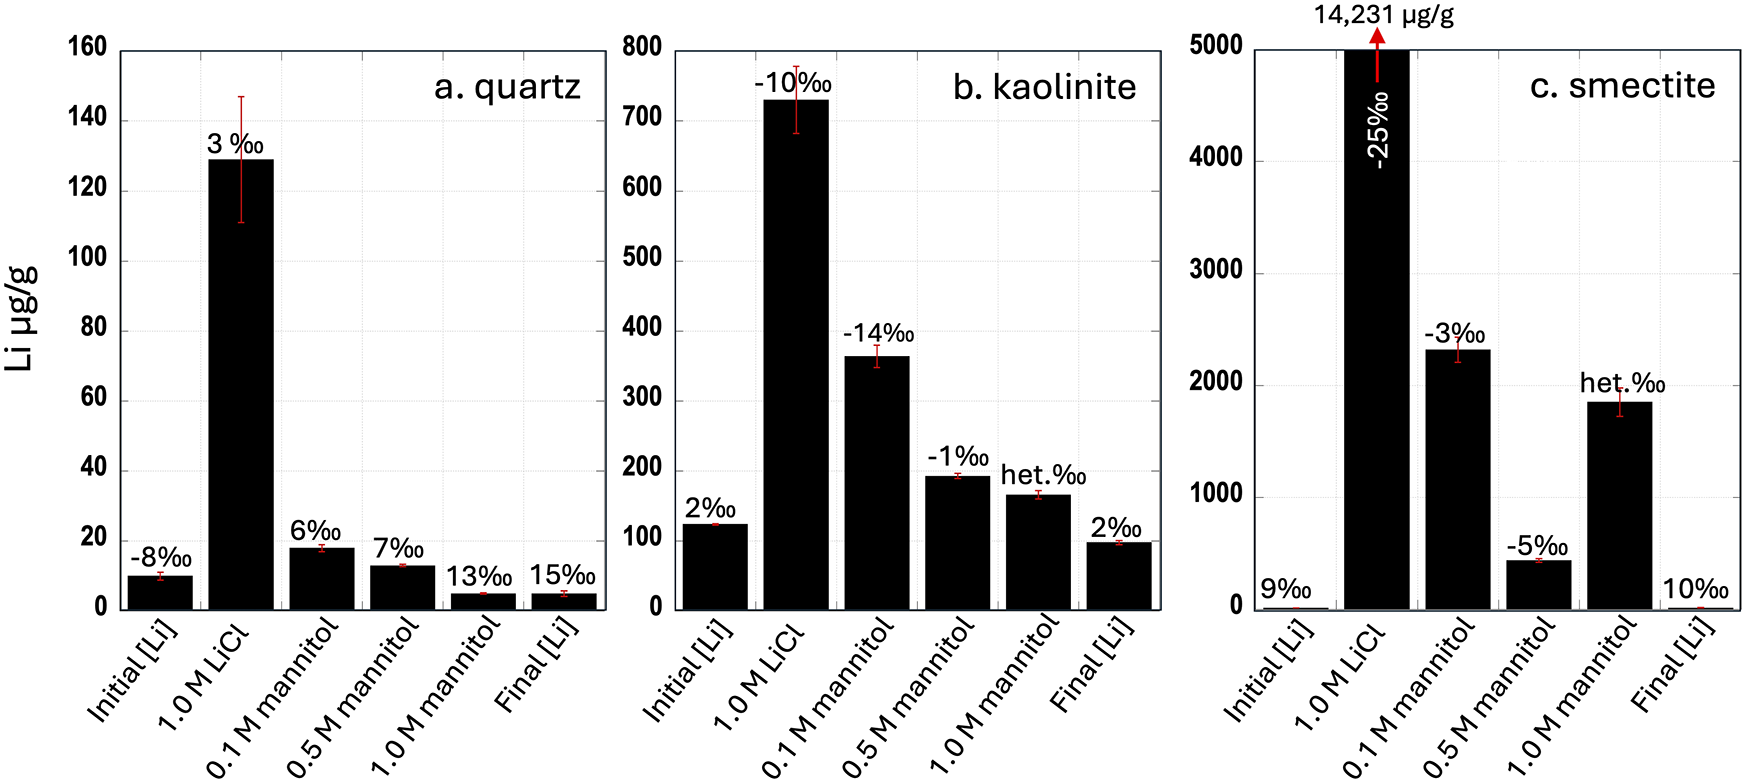
The Li content and δ7Li were measured on multiple spots (n) on each sample mount and averaged for the values reported (Table 1; Fig. 3). Analytical errors reported are based on a comparison of standard error (SE) to predicted error (PE). Only analyses where SE and PE are within 2 σ are reported. Results show that after removal of adsorbed Li by 1.0 M NH4Cl cation exchange (initial [Li]) the 20 μm size fraction of quartz contained 10 μg g–1 Li with an initial δ7Li of –8.3±0.8‰. Li saturation (1.0 M LiCl treatment) increased the Li content on quartz to 129 μg g–1, adding 119 μg g–1 of adsorbed Li to the 10 μg g–1 initial Li, and the δ7Li increased to +2.5±0.7‰, showing a preference of the quartz surface for 7Li. Next, various concentrations of mannitol were tested for removal of the adsorbed Li from quartz. The 0.1 M mannitol removed 85% of the 129 μg g–1 Li adsorbed, the 0.5 M mannitol removed 89%, and 1.0 M mannitol removed 96% (Table 1; Fig. 3). Notably, the δ7Li of the quartz got heavier as 6Li was preferentially removed. The second cation exchange with 1.0 M NH4Cl (final [Li]; Table 1) removed 100% of the adsorbed Li on quartz (within error of initial value) and left the δ7Li of the sample heavier (15.4±0.7‰) than the initial δ7Li. This indicates that the quartz contained an exchangeable form of Li (~10 μg g–1) that was not removed by the initial NH4Cl treatment but was replaced with isotopically heavier Li during Li saturation. The pH of the LiCl solution containing suspended quartz decreased from 5.7 to ~3 during Li adsorption (Table 1). The mannitol solutions did not change the pH (~3) significantly, even after removal of adsorbed Li (final [Li]; Table 1).
Bar plots showing Li content and δ7Li (from Table 1) after each treatment for: (a) quartz, (b) kaolinite, and (c) smectite. For each mineral, surface-adsorbed Li decreases with mannitol treatments, but only cation exchange (1.0 M NH4Cl) removes the inner-sphere bound interlayer Li (het. ‰ = heterogeneous δ7Li spot to spot).

Figure 3. Long description
A multi-panel figure containing three bar plots labeled a, b, and c. All plots share a common X-axis with six treatment stages: Initial [L i], 1.0 M L i C l, 0.1 M mannitol, 0.5 M mannitol, 1.0 M mannitol, and Final [L i]. The Y-axis represents L i concentration in micrograms per gram.
* Panel a (quartz): Y-axis ranges from 0 to 160. L i concentration peaks at 1.0 M L i C l (approximately 130) and decreases through mannitol treatments to a final value near 5. δ7Livalues are labeled above bars: -8 per mil, 3 per mil, 6 per mil, 7 per mil, 13 per mil, and 15 per mil.
* Panel b (kaolinite): Y-axis ranges from 0 to 800. Concentration peaks at 1.0 M L i C l (approximately 730) and steps down through mannitol treatments. δ7Li values: 2 per mil, -10 per mil, -14 per mil, -1 per mil, het. per mil, and 2 per mil.
* Panel c (smectite): Y-axis ranges from 0 to 5000. The 1.0 M L i C l bar is truncated with a red arrow pointing to a value of 14,231 micrograms per gram. Concentrations decrease significantly after mannitol treatments. δ7Li values: 9 per mil, -25 per mil, -3 per mil, -5 per mil, het. per mil, and 10 per mil.
Red error bars are present on all data columns. The term het. per mil indicates heterogeneous δ7Lispots.
Structural Li in kaolinite was initially 107 μg g–1 (initial [Li]) with a δ7Li of 2.1±0.8‰. Kaolinite has a greater external surface area (24 m2 g–1; Sanders et al., Reference Sanders, Washton and Mueller2010) than the 20 μm quartz (~2 m2 g–1) and adsorbed more Li during Li saturation (Table 1; Fig. 3), which increased the Li-content by 83% to 730 μg g–1 and shifted the δ7Li to lighter values (–10±0.6‰). Preferential adsorption of 6Li from solution is expected for kaolinite (Chan et al., Reference Chan, Gieskes, You and Edmond1994; Fairén et al., Reference Fairén, Losa-Adams, Gil-Lozano, Gago-Duport, Uceda, Squyres, Rodrigues, Davila and McCay2015; Li and Liu, Reference Li and Liu2020). The 0.1 M, 0.5 M, and 1.0 M mannitol solutions reduced the Li content by 40%, 68% and 73%, respectively, leaving the mineral isotopically lighter (Fig. 3). The δ7Li of the adsorbed Li on kaolinite remained negative but generally became heavier as mannitol preferentially extracted 6Li. However, significant heterogeneity was observed from spot to spot in samples treated with 1.0 M mannitol, ranging from –10.3±1.3 to –4.8±0.4‰. This indicates incomplete removal of adsorbed Li by mannitol as the solution approaches saturation. Again, only the second cation exchange with 1.0 M NH4Cl (final [Li]) removed 100% of the adsorbed-Li, returning the δ7Li to the initial value of ~2‰ (Table 1; Fig. 3).
Smectite has an exceptionally large surface area due to the interlayer surfaces; therefore, it adsorbs the greatest amount of Li. Środoń and McCarty (Reference Środoń and McCarty2008) measured the total specific surface area of SWy-1 smectite using the ethylene glycol monoethyl ether (EGME) method that includes the interlayer surface, reporting a value of 781 m2 g–1. The external surface area of SWy-1 measured using BET (Brunauer et al., Reference Brunauer, Emmett and Teller1938) was 34 m2 g–1 (Sanders et al., Reference Sanders, Washton and Mueller2010) leaving an interlayer surface area of ~747 m2 g–1. The initial Li content of the smectite (13±1 μg g–1 structural Li) increased after LiCl saturation, to an average of 14,231 μg g–1 (~14.2 wt.%). The δ7Li decreased significantly from +8.8±0.2‰ to –25.1±1.2‰ (Table 1), essentially the δ7Li of the LiCl solution. Treatment with 0.1 M mannitol reduced the Li by 84‰ to 2320 μg g–1 and increased the δ7Li to –3.2±2‰. This low mannitol concentration was not effective at removing the great amount of adsorbed Li (1.4 wt.%). However, treatments with 0.5 M mannitol reduced the Li-content to 19±0.5 μg g–1, with a δ7Li change to –5.3±0.1, within error of the 0.1 M mannitol extraction.
As observed for kaolinite, treatment of the smectite with 1.0 M mannitol was not as effective at removing adsorbed Li as the lower mannitol concentrations, and showed δ7Li heterogeneity from one spot to another (Table 1). Although the 1.0 M mannitol removed the small amount of Li adsorbed on quartz, it only removed 73% of the adsorbed-Li on kaolinite and 87% on smectite. Saturation of mannitol in water occurs at ~1.2 M at 25°C (Braham, Reference Braham1919); therefore it is possible that in the presence of clay minerals, the 1.0 M mannitol partially precipitated, making it difficult to remove from the suspension and causing the variable δ7Li observed. Highly concentrated mannitol solutions used for brain infusions after trauma are reportedly destabilized in the presence of Na+ and K+ (common exchangeable cations in clay interlayers) causing precipitation (Kavanagh et al., Reference Kavanagh, Hogan, Murphy, Croker and Walker2020). Notably, after the final NH4Cl treatment (final [Li]), the Li content of smectite returned to 14 μg g–1 (within error of the initial value) and the δ7Li returned to the initial value (+10.0±0.8‰) of the structural Li demonstrating complete extraction of the adsorbed Li.
Discussion
Lithium attraction to mannitol vs mineral surfaces
Lithium in aqueous solutions may complex with various anions to form salts (e.g. LiCl), which are removed from minerals by rinsing samples in deionized water or by dialysis before separating clay size fractions (Jackson, Reference Jackson1979; Moore and Reynolds, Reference Moore and Reynolds1997). In mannitol-mineral suspensions, alkali metals (e.g. Li, B) are attracted to the hydroxyl ligands on the backbone carbon structure of mannitol (Fig. 1), competing with the attraction to mineral surfaces. Lithium adsorbed to clay minerals forms a hydroxyl (OH–) bond attracted to H+ adsorbed to the negative interlayer surfaces of clays, as documented for B–OH bonds in minerals (Leeman and Sisson, Reference Leeman, Sisson, Grew and Anovitz1996; Köster et al., Reference Köster, Williams, Kudejovac and Gilg2019). The attraction of H+ or OH– to mineral surfaces affects the solution pH and is related to the mineral’s point of zero charge (PZC; Cristiano et al., Reference Cristiano, Hu, Siegfried, Kaplan and Nitsche2011). PZC is the pH at which a mineral surface has zero net electrical charge (Sposito, Reference Sposito1998); thus, the total positive charges on the mineral surface equal the total negative charges (zeta potential = 0). A small change in pH can greatly affect the electrostatic interaction between hydrated ions and the ionizable surface sites of each mineral (Cristiano et al., Reference Cristiano, Hu, Siegfried, Kaplan and Nitsche2011). The minerals chosen for this study span a range of PZC: quartz = pH 1.8 to 2.5 (Komulski, Reference Komulski2009); kaolinite = pH 2.7 to 3.2 (Appel et al., Reference Appel, Ma, Rhue and Kenelley2003); smectite (montmorillonite) = pH 7.6 to 9.4 (Komulski, Reference Komulski2009). It is expected, therefore, that the amount of Li adsorption will vary by mineral and solution pH, as observed by Hingston (Reference Hingston1964) for B adsorption to illite, kaolinite, and smectite.
If the mineral PZC is less than the pH of the solution, surface-adsorbed H+ enters the solution, leaving the mineral surface more negatively charged. Alternatively, where the solution pH is less than the mineral PZC, the H+ resides on the mineral surface (Railsback, Reference Railsback and Railsback2006). To evaluate the variables affecting the H+ and OH– concentrations in the mannitol-mineral suspension, the pH of the solutions (supernatant) was measured after each treatment had equilibrated for 24 h at 25°C (Table 1).
The quartz adsorbed 119 μg g–1 of Li during Li saturation with LiCl (Fig. 3). Mannitol (1.0 M) removed 96% of the adsorbed Li, but the δ7Li increased to 13±0.7‰, indicating isotopic exchange. The final cation exchange with NH4Cl returned Li contents to the initial 10 μg g–1 Li, but the δ7Li remained heavy (15.4±0.7‰). Because quartz has a low PZC (pH ~2), there is a large pH difference between the initial solution (pH ~6; Table 1) and the mineral surface, creating a strong electrostatic attraction for Li+. During Li saturation, the solution pH decreased to ~3, indicating that surface-adsorbed H+ enters solution, and Li+ was tightly adsorbed showing a preference for 7Li. The solution pH remained at ~3 during subsequent mannitol treatments, reducing the quartz attraction for Li+, which instead complexed with mannitol. The change in δ7Li from the initial to final cation exchange treatments (Table 1) suggests that the ~10 μg g–1 Li remaining is not structural but forms a strong inner-sphere bond (Stumm, Reference Stumm1995) at the quartz surface.
The pH of clay mineral suspensions after the initial cation exchange with NH4Cl (initial [Li]) was also ~6 (Table 1). After Li saturation, the pH of the kaolinite suspension dropped to ~3, while the smectite suspension pH was ~5. The lowering of the pH for kaolinite suspended in LiCl solution suggests that H+ is released from the clay surface and is replaced by Li+. Kaolinite has a PZC near 3, close to the solution pH, so the surface attraction for Li+ is less than that of quartz.
Smectite showed the greatest Li adsorption, but the solutions showed little change in pH after Li saturation. The high PZC of smectite (pH = 7.6 to 9.4) compared with the solution pH (~5) leaves H+ on the mineral surface (Railsback, Reference Railsback and Railsback2006); thus the solution pH did not change greatly. However, once mannitol solutions were added, the pH decreased as mannitol chelated Li+. The smectite in 0.5 M mannitol produced the lowest pH solution (pH = 2.6) and was most effective at extracting Li, removing >99% of the adsorbed Li. To summarize, the solution pH relative to the mineral PZC, dictates the preference for Li+ adsorption to the mineral surface or complexation with mannitol.
The role of hydration in interlayer–Li bond strengths
Lithium has been shown to form both outer-sphere and inner-sphere bonds at the surface of certain smectite interlayers (Greathouse and Sposito, Reference Greathouse and Sposito1998; Sposito et al., Reference Sposito, Skipper, Sutton, Park, Soper and Greathouse1999). Outer-sphere bonds are weak electrostatic attractions where the cation is separated from the mineral surface by the hydration shell (3.2–4.5 Å; Persson, Reference Persson2022). Outer sphere cations are considered soluble and exchangeable (Strawn, Reference Strawn2021). However, inner-sphere cations bond directly to the mineral surface having a Li–O bond length of ~1.94 Å (Persson, Reference Persson2022). Most recently, Li et al. (Reference Li, Lu, Chen, Zhang, Cheng, Liu and Yin2023, Reference Li, Liu, Wang, Cheng, Yin, Wang and Lu2025) confirmed the existence of inner-sphere Li bonds in smectite using classical molecular dynamics simulations and thermodynamic modeling. Their studies show negligible isotopic fractionation between inner-sphere-bound monolayer-hydrated Li and the aqueous solution, supporting the suggestion that interlayer-bound Li reflects the δ7Li of the most recent fluid. Whether LiOH is more attracted to H+ on smectite interlayers or Li+ to OH– on mannitol molecules, was tested by Li-saturation using 1.0 M LiOH, compared with saturation using 1.0 M LiCl (Table 1). This experiment was to test if more Li would be adsorbed by SWy-1 smectite from a LiOH solution (pH ~14) than the LiCl solution, and if the interlayer Li would record the new δ7Li of the fluid (–78.1±0.6‰). After LiOH-saturation (shaken 24 h at 25°C), the Li adsorbed on smectite averaged 22,170 μg g–1 (n=3), showing much greater Li adsorption than from the LiCl solution (14,231 μg g–1), and consistent with previously observed increases in B adsorption at high pH (Hingston, Reference Hingston1964).
Mannitol (0.5 M) treatments repeated in triplicate on smectite (SWy-1) extracted most of the adsorbed Li, leaving only 23 μg g–1 of Li. Because 11 μg g–1 was determined to be structural Li, the interlayer retained only 12 μg g–1 of Li. Although the interlayer surface area was estimated to be 747 m2 g–1, the fixed interlayer-Li coverage is just 0.02 μg of Li m–2 after mannitol extraction. This is an important value because it is consistent with the amount of interlayer B (μg m–2) measured in montmorillonite after mannitol extraction (Hingston, Reference Hingston1964) and may be characteristic of the smectite interlayer surface charge. This implies that most of the Li in the interlayer is soluble and can diffuse out of the interlayer when attracted to mannitol (whether it is in the interlayer or on exterior surfaces) while only the inner-sphere bound-Li (Li et al., Reference Li, Lu, Chen, Zhang, Cheng, Liu and Yin2023) is retained after mannitol treatments. Mass-balance calculations show that the isotopic composition of the 12 μg g–1 of interlayer Li is within error of the LiOH solution δ7Li (–78.2‰). This experiment supports the hypothesis that mannitol can isolate the interlayer inner-sphere bound Li, that requires cation exchange to remove. Measurement of the clay δ7Li before and after mannitol treatment, followed by cation exchange to isolate structural δ7Li, is essential to calculate the interlayer δ7Li by mass balance.
Testing for complete isolation of interlayer-bound Li
Although mannitol was shown to remove large amounts of adsorbed Li from the smectite interlayer (747 m2 g–1) and exterior surfaces (34 m2 g–1; Sanders et al., Reference Sanders, Washton and Mueller2010), determining the amount of mannitol needed to isolate the interlayer bound Li cannot be pre-determined. In this study, increasing the mannitol concentrations increased the amount of adsorbed-Li extracted; however, the remaining Li is a combination of interlayer-bound Li and structurally bound Li. Considering that: (1) the mannitol concentrations in solution did not always match the molar amount of Li adsorbed; (2) the treatment time (24 h) may have been insufficient for complete Li extraction of such large amounts of adsorbed-Li; and (3) there may be competition with other alkali-hydroxyl groups adsorbed to mannitol, decreasing the extraction efficiency; it is recommended that each sample be tested for complete isolation of interlayer-bound Li from the extractable Li.
In the present study, the smectite samples which were saturated with Li using LiCl (Table 1; Fig. 3), were initially extracted only once over 24 h using mannitol treatments (at various concentrations) then rinsed until there was no detectable Cl–. However, to test for complete removal of adsorbed Li, additional treatments with 0.5 M mannitol were performed, which reduced the ‘remaining Li’ to 19 μg g–1 (Table 1). Therefore, in the follow-up experiment testing Li adsorption on smectite from LiOH, the 2.2 wt.% adsorbed-Li was extracted using 0.5 M mannitol treatments performed in triplicate, before rinsing. This reduced the remaining Li (inner sphere bound Li) to 12 μg g–1. Therefore, to insure complete extraction of adsorbed, soluble-Li from exterior and interlayer surfaces, it is recommended that the mannitol volume:mineral mass ratio be increased or to repeat the mannitol extraction step until the Li content is minimized and reaches a steady state. This approach should eliminate the uncertainties discussed.
Applications beyond Earth
Clay minerals are abundant and widespread in asteroids Ryugu and Bennu where samples were collected and returned to Earth. The clay minerals indicate extensive aqueous alteration on their parent bodies (Matsumoto et al., Reference Matsumoto, Miyake, Igami, Haruta, Saito and Hata2023; Lauretta et al., Reference Lauretta, Connolly, Simon, Bosak and Dworkin2024). Spectroscopic analyses and X-ray diffraction of the returned samples show that these asteroids are dominated by Mg-, Fe-, and Al-bearing phyllosilicates, primarily saponite and serpentines (e.g. cronstedtite), often intermixed with minor smectite and tochilinite phases (Matsumoto et al., Reference Matsumoto, Miyake, Igami, Haruta, Saito and Hata2023; Viennet et al., Reference Viennet, Roskosz, Nakamura, Beck and Baptiste2023; Lauretta et al., Reference Lauretta, Connolly, Simon, Bosak and Dworkin2024). The high degree of phyllosilicate hydration, typically corresponding to 4–6 wt.% structural water, suggests that both bodies experienced low-temperature (<100°C) water–rock interactions under reducing conditions (Matsumoto et al., Reference Matsumoto, Miyake, Igami, Haruta, Saito and Hata2023; Zega et al., Reference Zega, McCoy, Russell, Keller and Gainsforth2025). In asteroid Ryugu, the clays are trioctahedral, containing metal cations (Mg, Fe) in the octahedral sites (Mouloud et al., Reference Mouloud, Roskosz, Viennet, Nakamura and Beck2024; Viennet et al., Reference Viennet, Roskosz, Nakamura, Beck and Baptiste2023). Expandable layers in saponite are monohydrated, showing low interlayer water content (<0.3 wt.%) in many Ryugu grains, suggesting partial dehydration of the interlayers (Matsumoto et al., Reference Matsumoto, Miyake, Igami, Haruta, Saito and Hata2023; Mouloud et al., Reference Mouloud, Roskosz, Viennet, Nakamura and Beck2024). Finally, the relative Fe-oxidation states (Fe³⁺/Fe-total) in Ryugu clays indicate that serpentine is less oxidized (<35%) than smectite (>65%), with ferric iron mainly occupying octahedral sites. This indicates that the fluids forming these clays experienced heterogeneous redox conditions and/or evolving fluid compositions during hydrothermal alteration (Roskosz et al., Reference Roskosz, Beck, Viennet, Nakamura and Bernard2024; Viennet et al., Reference Viennet, Roskosz, Nakamura, Beck and Baptiste2023). Building on these observations, structural-Li isotopic compositions would provide valuable information regarding the original Li sources in fluids that equilibrated with the authigenic clays. Post-crystallization interlayer-Li, isolated using the methods described in this study, may document more recent fluid alteration or changing Li-sources on these asteroids.
Conclusions
Clay-rich sediments are an emerging focus of Li mining for alternative energy resources. This study demonstrates that mannitol, a non-toxic and biodegradable organic compound, can extract adsorbed Li effectively from clay minerals, and that expandable clays (e.g. smectite) can adsorb ore-grade concentrations of Li, commonly thought to be only structurally bound in the octahedral sheets. In 24 h at 25°C, mannitol (0.5 M) removed >99% of surface-adsorbed Li from smectite (~2.2 wt.%), leaving only 12 μg g–1 of interlayer Li, most likely bound as inner-sphere complexes (Li et al., Reference Li, Lu, Chen, Zhang, Cheng, Liu and Yin2023; Li et al., Reference Li, Liu, Wang, Cheng, Yin, Wang and Lu2025) which are not soluble. Using mannitol to extract adsorbed Li from clays would minimize the volume of toxic acids (Zhao et al., Reference Zhao, Wang and Cheng2023; Wu et al., Reference Wu, He, Kuai, Zhang, Wang, Li and Cheng2024) needed to process Li clay deposits. Cation exchange removes all interlayer Li (including both outer-sphere and inner-sphere bound Li) from the clays studied as demonstrated by the return of structural Li contents and δ7Li to the initial values. However, cation exchange destroys valuable isotopic information preserved by the interlayer inner-sphere bound Li. Whether or not there is a physical exclusion of mannitol from the interlayer as hypothesized, the force of attraction of mannitol for Li+ is great enough to extract both exterior and interlayer soluble Li (including outer-sphere-bound Li). The isotopic composition of inner-sphere bound Li shows negligible fractionation from the interlayer fluid (Li et al., Reference Li, Lu, Chen, Zhang, Cheng, Liu and Yin2023; Li et al., Reference Li, Liu, Wang, Cheng, Yin, Wang and Lu2025); therefore it reflects the δ7Li of the most recent fluids to enter the interlayer. Using mannitol to extract surface-adsorbed, soluble Li (outer-sphere Li) allows isolation of the interlayer bound Li (inner-sphere Li) that can then be extracted using cation exchange, for δ7Li analysis or calculations by mass balance to determine the δ7Li of recent fluids.
The use of mannitol provides a new methodological framework for isolating different reservoirs of Li in clay deposits: structural Li, interlayer bound Li, and soluble adsorbed Li. This framework can also be utilized to probe fluids in other water-rich extraterrestrial bodies (e.g. asteroids), where hydrothermal alteration is ubiquitous and leads to the formation of clays. Structural Li in clay minerals records isotopic equilibrium with the original fluids present at the temperature of clay neoformation, while the interlayer bound Li, where Li forms an inner-sphere complex, reflects the δ7Li of the most recent fluids, thus recording fluid δ7Li changes from past to present.
Data availability statement
Data available from corresponding author.
Acknowledgments and Financial Support
This study was conducted using the Arizona State University Secondary Ion Mass Spectrometry Community Facility supported by the US National Science Foundation (NSF Grant EAR 1819550; R.L. Hervig, PI). SV acknowledges summer funding for this work from Amherst College John Mason Clarke 1879 Fellowship.
Author contribution
LW conducted experiments and wrote the text. MB and SV contributed to interpretation and writing equally.
Competing interests
The authors declare none.

 Open access

