

1. Introduction
An objective of central banks trying to keep inflation close to their targets is to manage inflation expectations (King et al., Reference King, Lu and Pastén2008). The idea is that when expectations remain anchored, decision-makers in the economy take actions (such as price setting and wage demands) that are consistent with inflation at the target and, as a result, inflation is close to the target. To manage expectations, the central bank tries to communicate to a broad cross section of society ranging from technical financial market specialists to the broader public (Haldane and McMahon, Reference Haldane and McMahon2018).
A central bank ideally has different constituents credibly expecting inflation to be close to the target rate. While this has been broadly true on average in many OECD economies in the last decades (including the United Kingdom), it is often found that women have higher inflation expectations than men (D’Acunto et al., Reference D’Acunto, Malmendier and Weber2021; Reiche, Reference Reiche2024). Such gender differences may hamper the effectiveness of monetary policy communication and could have important economic implications given that women tend to control the lion’s share of consumer spending; Silverstein and Sayre (Reference Silverstein and Sayre2009) estimate that about two-thirds of all spending decisions in the United Kingdom are made by women. Differential understanding and attitudes to inflation may also have consequences for women on a micro-level by impacting investment and savings behaviour (Lusardi and Mitchell, Reference Lusardi and Mitchell2008).
In this paper, we use the Inflation Attitudes Survey (IAS) to examine UK gender differences in inflation expectations, uncertainty and attitudes about inflation, and how these translate into satisfaction with the Bank of England’s (BoE) policies. We also explore whether gender differences relate to differences in information sources. Ultimately, we want to know whether the BoE (and potentially other central banks) need gendered communication to more effectively manage inflation expectations and retain public support for independent monetary policy.
Such a policy would be a natural response to the growing evidence of ingroup effects in information acquisition and processing, meaning that information tends to resonate more strongly when the sender shares a common prominent characteristic with the receiver (Malmendier and Veldkamp, Reference Malmendier and Veldkamp2022). These characteristics include nationality (Wabitsch, Reference Wabitsch2024), but also gender (D’Acunto et al., Reference D’Acunto, Fuster and Weber2022). Given that the policy committees tend to be dominated by male decision-makers, communication that more actively targeted women might be helpful to policy outcomes and the United Kingdom may be well-placed to implement such a strategy as, since July 2024, with Clare Lombardelli’s appointment as Deputy Governor, the BoE Monetary Policy Committee (MPC) has a female majority for the first time in its 25-year history.
Our analysis results in eight claims with implications for how central banks should think about their communication. A main takeaway of our results is that we do not see the need for a gendered communication along the lines of the distinction between the traditional communication aimed at financial markets and the layered content for the wider public. However, we do identify specific communication challenges that suggest careful policies aimed to ensure better engagement and education for women with lower financial knowledge and understanding. This includes ensuring that a wide range of communication channels are used, and that the Bank ensures a diverse range of senior speakers spreading the message on policy decisions and institutional setup.
Turning to our specific results, our first contribution relates to the literature on gender gaps in inflation beliefs. It has been observed that women tend to have different inflation expectations from men; Jonung (Reference Jonung1981) made the observation for Sweden, D’Acunto et al. (Reference D’Acunto, Malmendier and Weber2021) examined the US data and evidence for the United Kingdom can be found, for example, in Blanchflower and Maccoille (Reference Blanchflower and Maccoille2009) and Arioli et al. (Reference Arioli, Lim, Sek, Easaw, Golinelli, Malgarini, Morvan, Jenkins, Carroll, Axtell, Branch, Christ, Dickens, Dotsey, Epstein, Goodfriend, Manning, Mccallum, Mehra, Ng, Kirsch, Jungeblut, Jenkins, Kolstad, Curtin, Easaw, Golinelli, Malgarini, Meyler, Vellekoop, Lindén, Bates, Dieden, Duca, Friz, Gayer, Kaplan and Schulhofer-Wohl2017), where the gender gap is estimated to be 4 percentage points during the period 2001–2009 controlling for other demographics such as education and income. A prominent explanation for the gender gap relates to gender roles in grocery shopping and high food prices (Jonung, Reference Jonung1981; D’Acunto et al., Reference D’Acunto, Malmendier and Weber2021). We, however, find little difference in inflation perceptions and expectations (Claim 1). We argue that this is because of the design of the IAS and thus our results support the argument in Reiche (Reference Reiche2024) that differential expectations in level may be driven by higher uncertainty and lower financial confidence of women. Given the survey, we are indeed able to show that women, on average, are less certain in their answers (Claim 2).
Despite the similarities in expectations and perceptions, we find that women dislike inflation more than men (Claim 3) and, relatedly, they react differently to high inflation (Claim 4). Women are more likely to increase savings when inflation is high, while men are more willing to ask their employer for a higher wage. This means that, despite similarities in expectations, there may still be consequences for gender gaps in income and wealth. In addition, these findings contribute to the literature on gender gaps in trust and satisfaction with the Bank of England. Garriga (Reference Garriga2023) highlights that women trust the Bank less, a fact that we connect to the negative attitudes about inflation.
Also of consequence for the BoE, we find that women have lower knowledge of the institutions of monetary policy (Claim 5). Such knowledge has been shown to correlate with trust in the institution (Haldane et al., Reference Haldane, Macaulay, Mcmahon, Pastén and Reis2021). Our results show that the aversion to inflation and the lower knowledge give rise to a greater sense of dissatisfaction with the Bank among females even after controlling for the direct effect of these drivers on satisfaction (Claim 6). We also find that the link between knowledge and satisfaction is especially strong for women.
Finally, we investigate whether the observed gender differences might be driven by gender differences in information sources about the bank and inflation. While we find similarities in sources about inflation and no persistent differences in those sources (Claim 7), we find that women and men choose to inform themselves from somewhat different sources about the BoE. This shows that for gender gaps in monetary policy understanding and interpretation, the role of messenger may, in fact, be important as women are more likely to opt out of receiving financial news from traditional news channels in line with the “News is for men”-Hypothesis (Toff and Palmer, Reference Toff and Palmer2018). These findings present a challenge for policymakers. It is not enough to appear in traditional news media to distribute communication but central banks need to investigate more closely where the population is looking for information and target audiences more directly. Improved female representation in central banks may help (D’Acunto et al., Reference D’Acunto, Fuster and Weber2022).
Our paper is related to the growing literature about communication with the wider public. There is growing acceptance that monetary policymakers should pay attention to the public’s perceptions and expectations of inflation (Yellen, Reference Yellen2018), and central banks have increased their attempts to communicate directly with the public (see Blinder (Reference Blinder2018) and Haldane (Reference Haldane2017) for a historical summary, and McMahon (Reference McMahon2024) for a recent summary). This is to increase credibility and trust (Ehrmann et al., Reference Ehrmann, Holton, Kedan and Phelan2023), which helps anchor expectations (Van Der Cruijsen et al., Reference Van Der Cruijsen, Jansen and De Haan2015). Istrefi and McMahon (Reference Istrefi, McMahon, Ascari and Trezzi2025) discuss the effects of communication on expectations. Furthermore, as technocratic institutions in a democratic landscape, central banks have to be accountable for their actions (Draghi, Reference Draghi2014; Jeanneau, Reference Jeanneau2009; Fridriksson, Reference Fridriksson2000; Stiglitz, Reference Stiglitz1998).
Haldane et al. (Reference Haldane, Macaulay, Mcmahon, Pastén and Reis2021) highlight the challenges of explanation, engagement and education. There have been recent proposals for more effective design focusing on clarity of messages and simplicity of language (Ferrara and Angino, Reference Ferrara and Angino2022; Haldane et al., Reference Haldane, Macaulay, Mcmahon, Pastén and Reis2021; Bholat et al., Reference Bholat, Broughton, Ter Meer and Walczak2019; Haldane and McMahon, Reference Haldane and McMahon2018). However, despite semantic complexity decreasing, McMahon and Naylor (Reference McMahon and Naylor2023) show that the conceptual complexity of the bank’s communication has been increasing. Experimental results, for example, in Coibion et al. (Reference Coibion, Gorodnichenko and Weber2020) show, however, that engagement is often low. A remaining question in this literature is what is driving the low public engagement. On the other hand, satisfaction with policy may also be driven by the choice of messenger. Blinder and Krueger (Reference Blinder and Krueger2004) show how individuals receive political and economic information mostly through TV. On the other hand, Coibion et al. (Reference Coibion, Gorodnichenko and Weber2022) find little evidence of differences in expectations between participants in an experiment, who received central bank statements directly, versus those who were presented newspaper articles.
2. Data
We make use of the BoE Inflation Attitudes Survey (IAS), which is a quarterly survey conducted since Q1 2001. We use data until Q3 2024. In the survey, respondents are asked about inflation perceptions and expectations, as well as beliefs and attitudes about inflation and the policy response, knowledge about policy institutions and information sources they use to make these assessments; all of the survey questions we use are reported in Supplementary Tables A.1–A.10. The survey records a range of demographics and the focus of this paper are the gaps between men and women. Gender in the survey is based on self-assessment. Respondents are given the options ‘Male’, ‘Female’, as well as ‘In another way/Non-binary’Footnote 1 and the option to refuse an answer (‘Prefer not to say’). We focus only on the 99.91% of respondents who self-identify as either male or female for the purpose of this paper. The share of women in our sample is close to 53%.
IAS respondents choose inflation perceptions and expectations in bins. Initially, they choose from 0%, or inflation that falls into 1 percentage point bins starting at 0%–1%, and going to 4%–5%, or they have the option to choose ‘higher than 5%’ or ‘lower than 0%’. If they choose these initial extreme values, they then proceed to new options with the limits at ‘lower than −5%’ and ‘higher than 15%’. This survey design differs from other household surveys on inflation with the effect that the initial options anchor expectations. To calculate point forecasts, we use the upper limits of the chosen bin away from zero (so for the 3%–4% bin, we use 4%). The most extreme choices are marked with −6% and +16%, respectively.
For every question, the survey gives respondents the option to choose ‘Don’t know’. We will use this question as a metric of genuine uncertainty as in Giavazzi and McMahon (Reference Giavazzi and McMahon2012). However, in the time-series analysis of the ‘Don’t know’ option, it is important to note a break in the series. In 2020 Q2 (survey conducted in May), the survey mode went online due to the pandemic. In the initial online survey, the ‘Don’t know’ answer only appeared when respondents attempted to continue without selecting another option. This initial unavailability reduces the use of the option (though perhaps makes it an even truer measure of the uncertainty). The effect is visible in all plots shown in this analysis and the respective quarter will be marked with a red, dashed line throughout.
3. Gender differences in views on inflation
3.1. Inflation perceptions and expectations
Claim 1 The gender gaps in inflation perceptions and expectations in the Bank of England’s Inflation Attitudes Survey are small (or even zero).
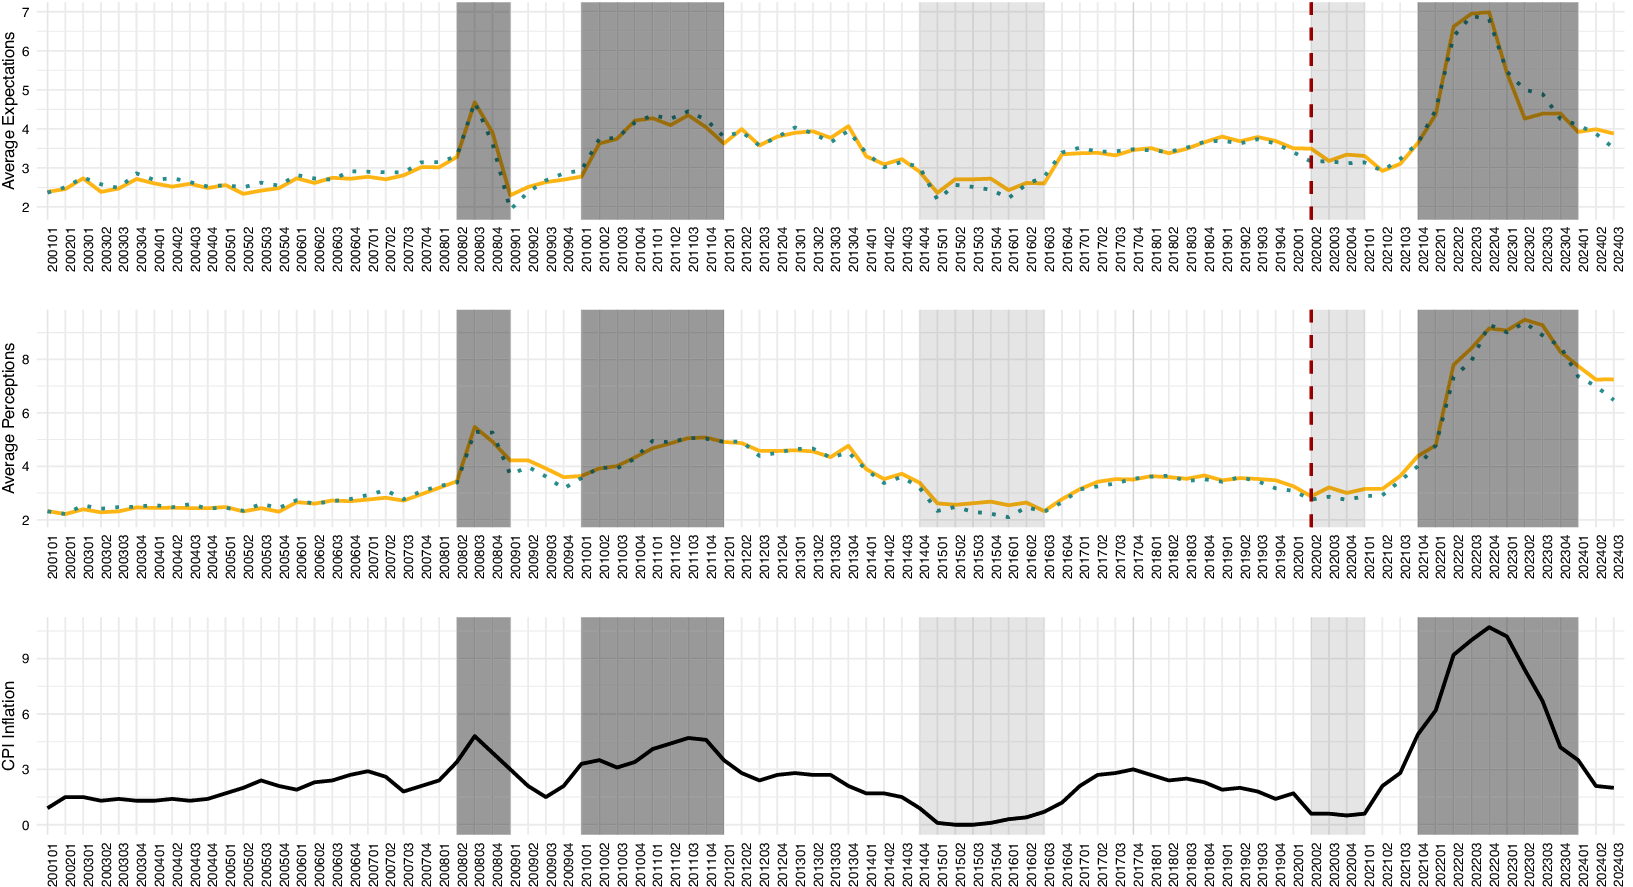
Figure 1 shows the average inflation perceptions and expectations for men and women over time. Both men and women’s inflation expectations co-move with CPI inflation, with expectations reducing quicker after inflationary periods than perceptions, consistent with an anchoring effect of current inflation. There is no gender gap in inflation expectations in the IAS—on average, women and men both had inflation expectations of 3.4% over the full period.
Historical inflation expectations and perceptions for men and women.
Note: The figure shows the mean inflation expectations and perceptions for men (in green, dotted) and women (in yellow) since Q1 2001. The red, dashed line marks 2020 Q2 when the survey went online due to the pandemic and the ‘Don’t know’ response was removed from the initially presented options. The black line below shows actual CPI Inflation in a given period. Periods when CPI inflation exceeded 3% are shaded dark and periods when CPI inflation was below 1% are shaded light.
Sources: Office for National Statistics CPI Annual Rate; BoE Inflation Attitudes Survey; authors’ own calculations.
Our finding that gender gaps do not appear important in the IAS is also confirmed via a simple baseline regression, which allows us to control for other demographic variables including income, education, age, employment, housing status and region (see Table 1).Footnote 2 Column (1) shows that there is no evidence of a gender gap in inflation expectations and Column (3) shows that the gender gap for perceptions is positive (i.e., women having higher perceptions on average) and significant but small in magnitude.
Drivers of inflation perceptions, expectations and uncertainty
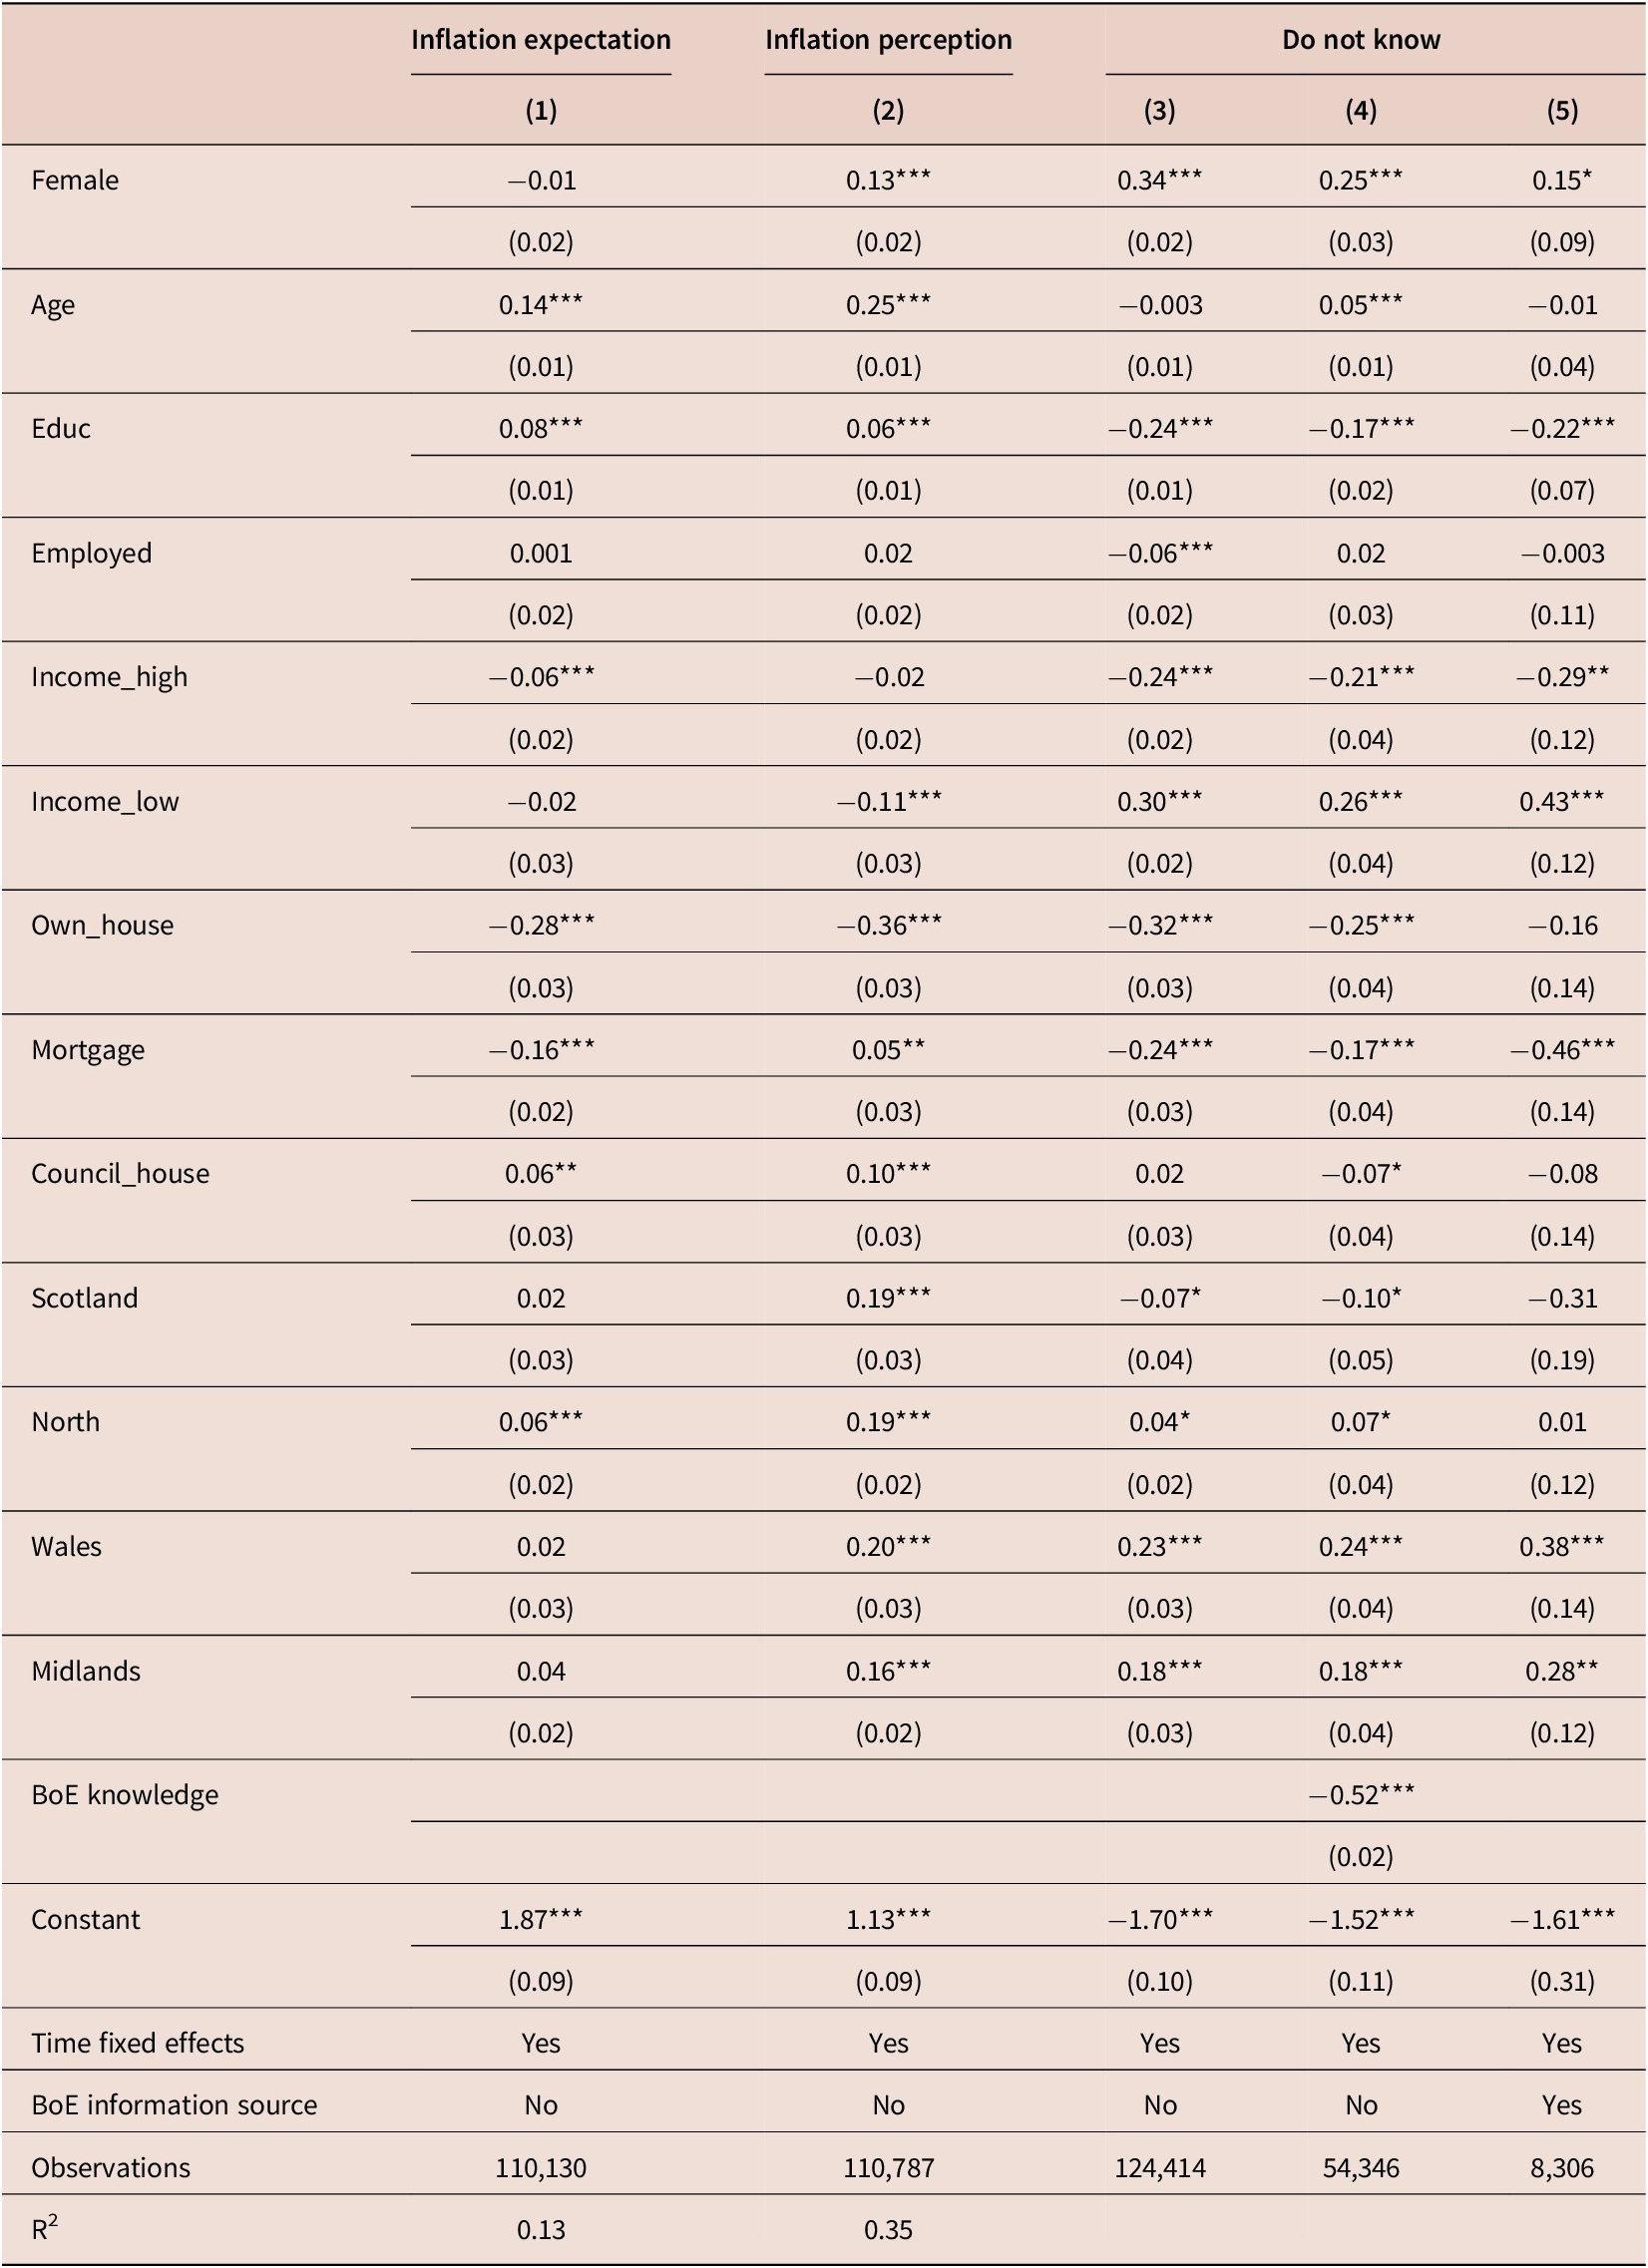
Notes: The table shows the result of a linear regression of inflation expectations or perceptions point estimates on a range of demographics in Columns 1–2. Columns 3–5 show the logistic regression of ticking the ‘Don’t know’ box on the same demographics. Significance levels are indicated by stars: *** $ p<0.01 $
, **
$ p<0.01 $
, ** $ p<0.05 $
and *
$ p<0.05 $
and * $ p<0.1 $
. Standard errors are reported in parentheses below the coefficient estimates.
$ p<0.1 $
. Standard errors are reported in parentheses below the coefficient estimates.
Sources: BoE Inflation Attitudes Survey; authors’ own calculations.
However, despite the small gender differences, other demographics do appear important in determining expectations. For instance, living in Northern England or Northern Ireland, as well as in council housing is significantly positive, while those in employment have significantly lower perceptions and expectations.
Some demographics interact with the female coefficient. This can be seen in Supplementary Table C.1 where conditioning on these interactions raises the gender gap in inflation expectations, but then interactions reduce the gap. For instance, Column (2) shows that women having a mortgage reduces the gap between men and women. This is also true for perceptions (Column (4)). Women with higher incomes tend to have lower expectations but higher perceptions than men. Younger women also have larger inflation perceptions than men their age but this gap reduces as they become older.
The fact that the IAS has no gender gap in inflation perceptions and expectations is important because it is different from other surveys in comparable economies. This helps us to understand the source of a perceived gender gap and how it is mitigated by the specific IAS survey design. Reiche (Reference Reiche2024) points out that in surveys with open expectation elicitation, gender gaps are caused by extreme outliers that can be classified as low financial confidence. These outliers are likely less prominent when respondents are given bins from 0% to 5% initially, as this anchors expectations. Those who were very uncertain about possible values are now suggested to remain within this range, while in an open field are likely to indicate higher values. Extreme outliers (i.e., beyond 15%) are not reported at all in the IAS but are quite common in other surveys such as the Michigan Survey of Consumers or the NY Fed SCE. In contrast, surveys that elicit point forecasts as open questions without suggested bins feature rounding (i.e., choosing an expectation that is a multiple of 5 or even 10), which can be used as a proxy for uncertainty (Binder, Reference Binder2017; Reiche and Meyler, Reference Reiche and Meyler2022). In these surveys, women are found to round more frequently, which biases their expectations upwards (Reiche and Meyler, Reference Reiche and Meyler2022; Reiche, Reference Reiche2024).
3.2. Uncertainty
The fact that the IAS shows demographic gaps consistent with the existing literatureFootnote 3, but not a gender gap, suggests that gender gaps may be caused by uncertainty as suggested by Reiche (Reference Reiche2024) and, thus, they disappear in the IAS where the survey design eliminates such uncertainty biases. We test this by examining uncertainty about inflation using the ‘Don’t know’ responses.
Claim 2 Women are less certain than men over their answers to questions on inflation perceptions and expectations.
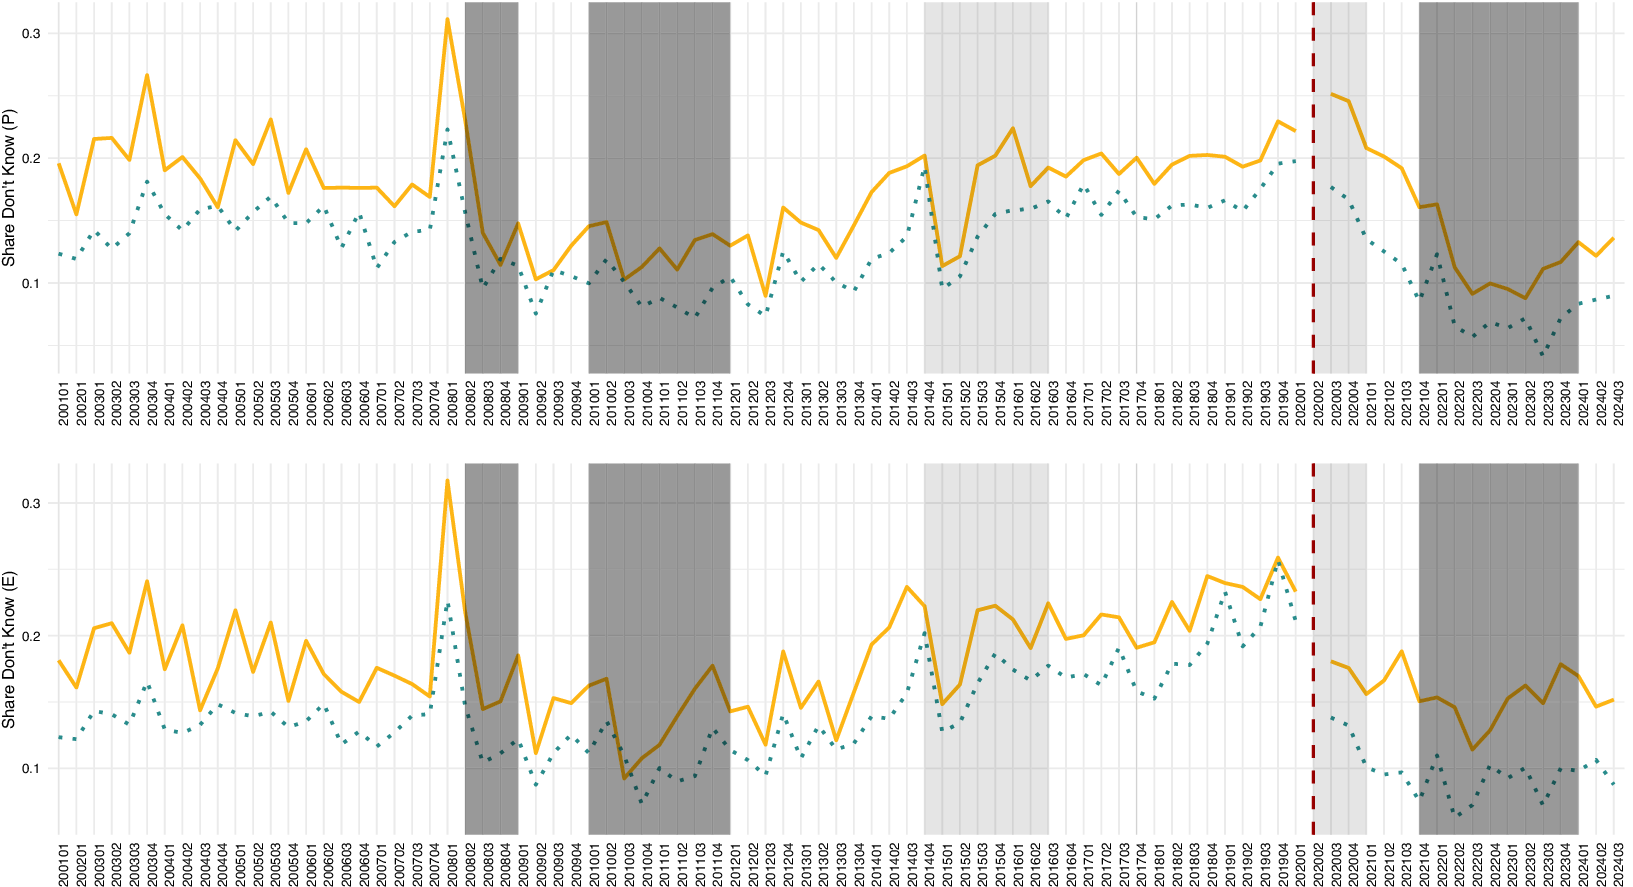
While inflation expectations move closely together for men and women, with no obvious gender gap, Figure 2 shows that the share of women who respond ‘Don’t know’ to either perceptions or expectations is much larger.Footnote 4 This indicates that women are either less certain about inflation or trust their own forecasting ability less (Bucher-Koenen et al., Reference Bucher-Koenen, Alessie, Lusardi and Rooij2024), which supports the claim in Reiche (Reference Reiche2024).Footnote 5 In Table 1, Columns (3)–(5), we report the coefficients from a simple logistic regression on the probability of answering ‘Don’t Know’ and find a significant uncertainty gender gap but this, unlike in other surveys, does not reflect in inflation expectations, which is likely because of the IAS survey design.
Inflation uncertainty for men and women.
Note: The figure shows the share of ‘Don’t know’ answers for perceptions (P) and expectations (E) for men (in green, dotted) and women (in yellow) since Q1 2001. The red, dashed line marks 2020 Q2 when the survey went online due to the pandemic and the ‘Don’t know’ response was removed from the initially presented options. Periods when CPI inflation exceeded 3% are shaded dark, periods when CPI inflation was below 1% are shaded light.
Sources: BoE Inflation Attitudes Survey; authors’ own calculations.
3.3. Attitude to inflation
Despite having the same point forecast as men, women have a different attitude towards inflation. Most respondents believe the economy would become weaker if prices were to rise faster.
Claim 3 On average, men and women think inflation is bad for the economy. Women generally think it is worse for the economy. There is time variation for both genders that is consistent with an optimal level of moderate inflation.
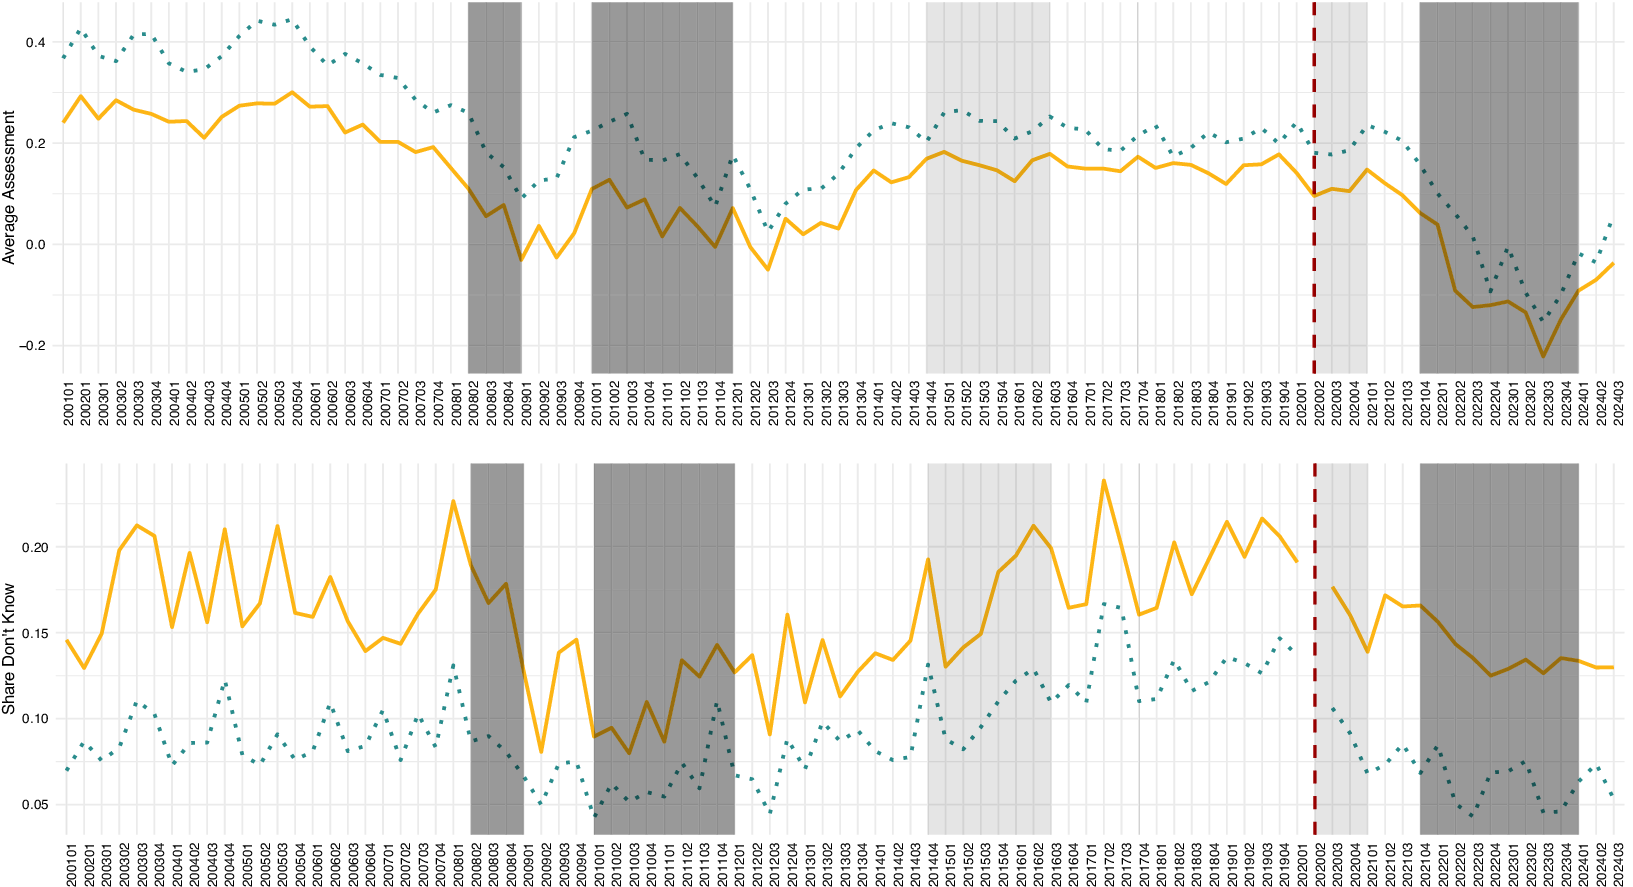
Figure 3 shows the share of respondents who believe that higher inflation worsens the economy for men and women for each quarter since 2001 Q1.Footnote 6 The share of those believing that high inflation would be detrimental to the economy is higher when inflation is at a higher level, consistent with agents perceiving an optimal level of inflation at a low level. For instance, during the Financial Crisis of 2008, almost 85% of women and 80% of men believed that higher inflation would be bad. In contrast, in the low inflation period after 2015, the shares dropped to 60% for women and 50% for men. Since the onset of the COVID-19 pandemic and inflation rising at higher levels than in previous years, the share of those thinking that higher inflation will make the economy weaker has again risen significantly to over 80% and 75%, respectively, in Q3 2023. Hence, the co-movement with actual inflation can be observed for both men and women, while women are always more negative about inflation.
If prices started to rise faster than they do now, do you think Britain’s economy would end up stronger or weaker, or would it make little difference?
Note: The figure shows the average assessment and share of ‘Don’t know’ responses for men (in green, dotted) and women (in yellow) since Q1 2001. The red, dashed line marks 2020 Q2 when the survey went online due to the pandemic and the ‘Don’t know’ response was removed from the initially presented options. Periods when CPI inflation exceeded 3% are shaded dark and periods when CPI inflation was below 1% are shaded light.
Sources: BoE Inflation Attitudes Survey; authors’ own calculations.

The gap between men and women has widened over time. Compared to women indicating more frequently that they do not know if the economy will be weaker or stronger, men are more likely to choose stronger and little difference; thus, women have a higher share of respondents who expect the economy to deteriorate with higher inflation. For instance, in 2021, up to 15% of men thought higher price increases would make the economy stronger while only 5% of women agreed. We confirm these results in a linear regression framework of the inflation assessment on a range of demographics.Footnote 7
3.4. Responses to inflation
We hypothesize that a gendered response to inflation can explain why women are more negative towards inflation. Once a year, the IAS survey elicits how individuals respond to their inflation expectations. They are given the options (1) Bring forward major purchases; (2) Cut back spending and save more; (3) Shop around more for better value goods and services; (4) Push for increased pay with the current employer; (5) Look to increase income in other ways; (6) Move savings out of banks or building societies into other assets; (7) Take no action and (8) None/ Don’t know.
Claim 4 Men and women claim that they would react to inflation in different ways. Men are more likely to reallocate assets and push for higher wages. Women are more likely to shop around and save extra.
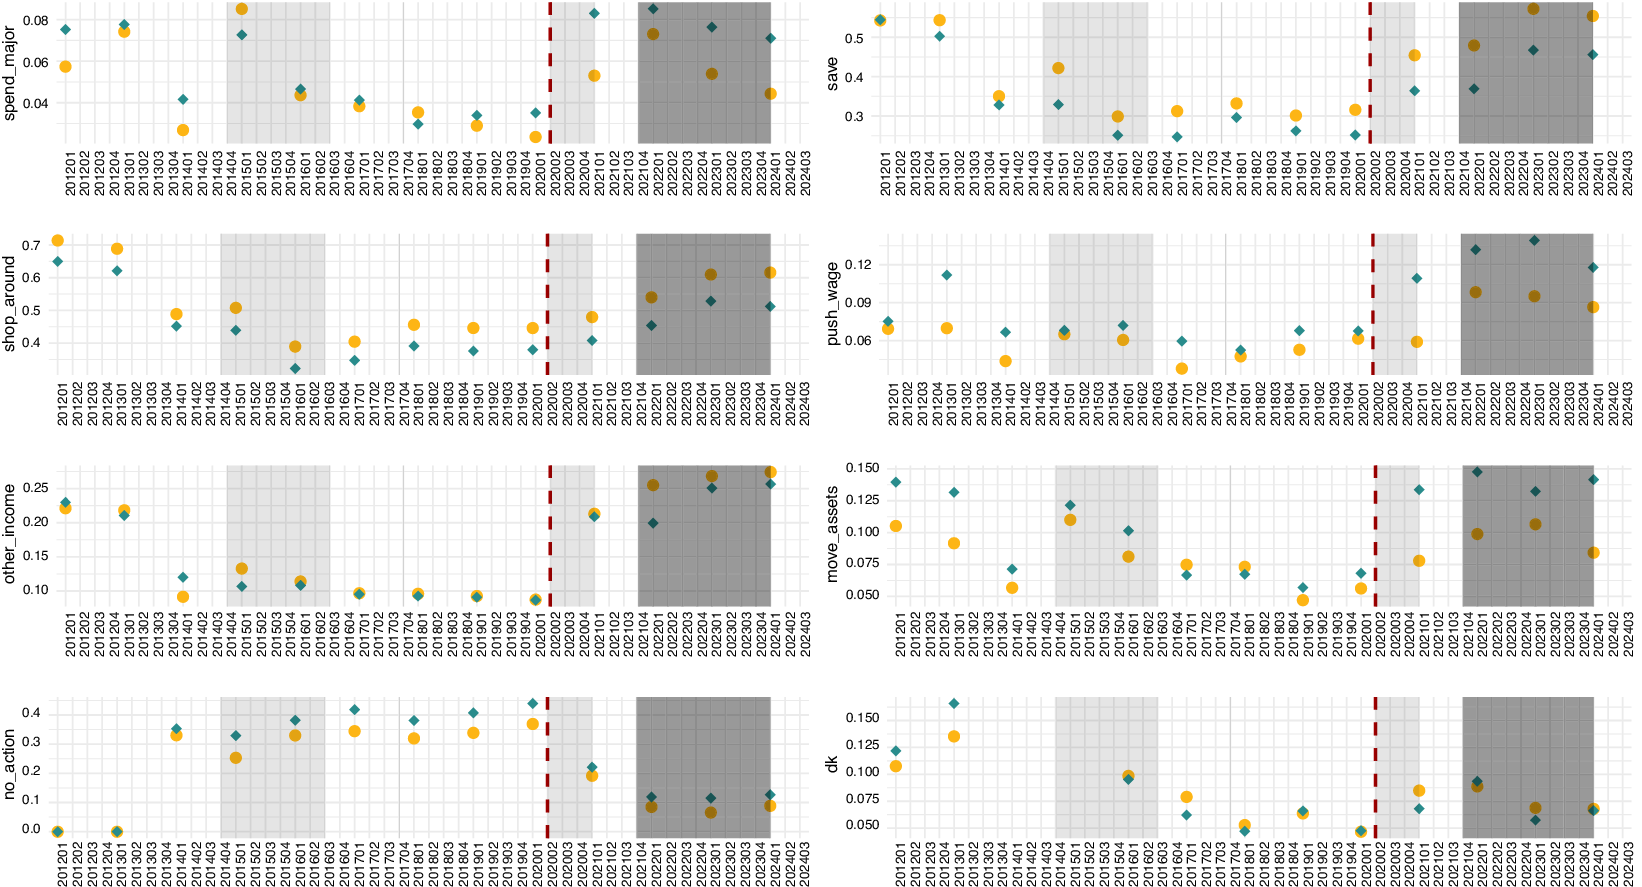
Figure 4 shows the responses to the question. Since the pandemic, the share of respondents who report taking no action has decreased while all other actions have increased in share. There are no clear gender gaps in the “Don’t know” response, but women are less likely to take no action. They tend to shop around more and increase savings. In contrast, men are more likely to ask for wage increases or move their assets if they take action. The differences between men and women in saving more and asking for higher wages increased during the pandemic substantially. Therefore, it appears that women feel more financially squeezed while men may try to proactively avoid financial losses due to inflation.
Which, if any, of the following actions are you taking, or planning to take, in the light of your expectations of price changes over the next 12 months? You can choose up to three.
Note: The figure shows the share of responses to each answer (see Supplementary Appendix for full details) for men (in green, dotted) and women (in yellow) since Q1 2012. The question is asked annually in the first quarter only. The red, dashed line marks 2020 Q2 when the survey went online due to the pandemic and the ‘Don’t know’ response was removed from the initially presented options. Periods when CPI inflation exceeded 3% are shaded dark and periods when CPI inflation was below 1% are shaded light.
Sources: BoE Inflation Attitudes Survey; authors’ own calculations.
One interesting dimension is that in the most recent data, the differences have become more apparent; this is true in the initial Covid period and also when inflation was actually very high. Before the recent period, the differences, while present, are mostly quantitatively small.
It might be tempting to think that these differential responses to dealing with inflation are the reason that there is a gendered response to how costly inflation is seen to be. However, we find that including inflation response controls in the regressions of inflation attitude does not alter the gender gap in attitude to inflation (Supplementary Table C.2, Columns (2) and (4)).
4. Satisfaction with and knowledge of the Bank of England
The consistently negative attitudes of women towards inflation in the United Kingdom could have consequences for their view of the Bank of England. We, therefore, test whether there is a gender dimension to satisfaction with the Bank, which would mean that targeted communication would be warranted even in the absence of a difference in inflation expectations.
The survey allows us to explore satisfaction with the Bank in terms of monetary policy. The specific question asks Overall, how satisfied or dissatisfied are you with the way the Bank of England is doing its job to set interest rates in order to control inflation? (see Supplementary Appendix Table A.9) with answers ranging from very satisfied to very dissatisfied. We compute a satisfaction score from −1 to 1 for each individual were as follows: −1 expresses very dissatisfied, 0 neither satisfied nor dissatisfied and 1 very satisfied. Answers in between are marked as ±0.5.
4.1. Knowledge about the Monetary Policy Committee
Before turning to satisfaction, it is worth noting that Haldane and McMahon (Reference Haldane and McMahon2018) highlight a systematic correlation between an individual’s understanding of the central bank’s policy objective, their trust in the institution and satisfaction with the institution’s performance, and the degree to which their expectations are likely to be close to the inflation target. Therefore, we first explore whether there exist gender gaps in knowledge about policymakers associated with controlling inflation. We can then explore satisfaction taking account of any knowledge differences.
The IAS includes three questions that allow us to measure knowledge about the MPC. All questions are shown in Supplementary Table A.7. We use the answers to these questions, to compute an MPC Knowledge Score where each correct answer adds a point to a respondent’s score (‘Don’t know’ and wrong answers equally provide zero points).Footnote 8
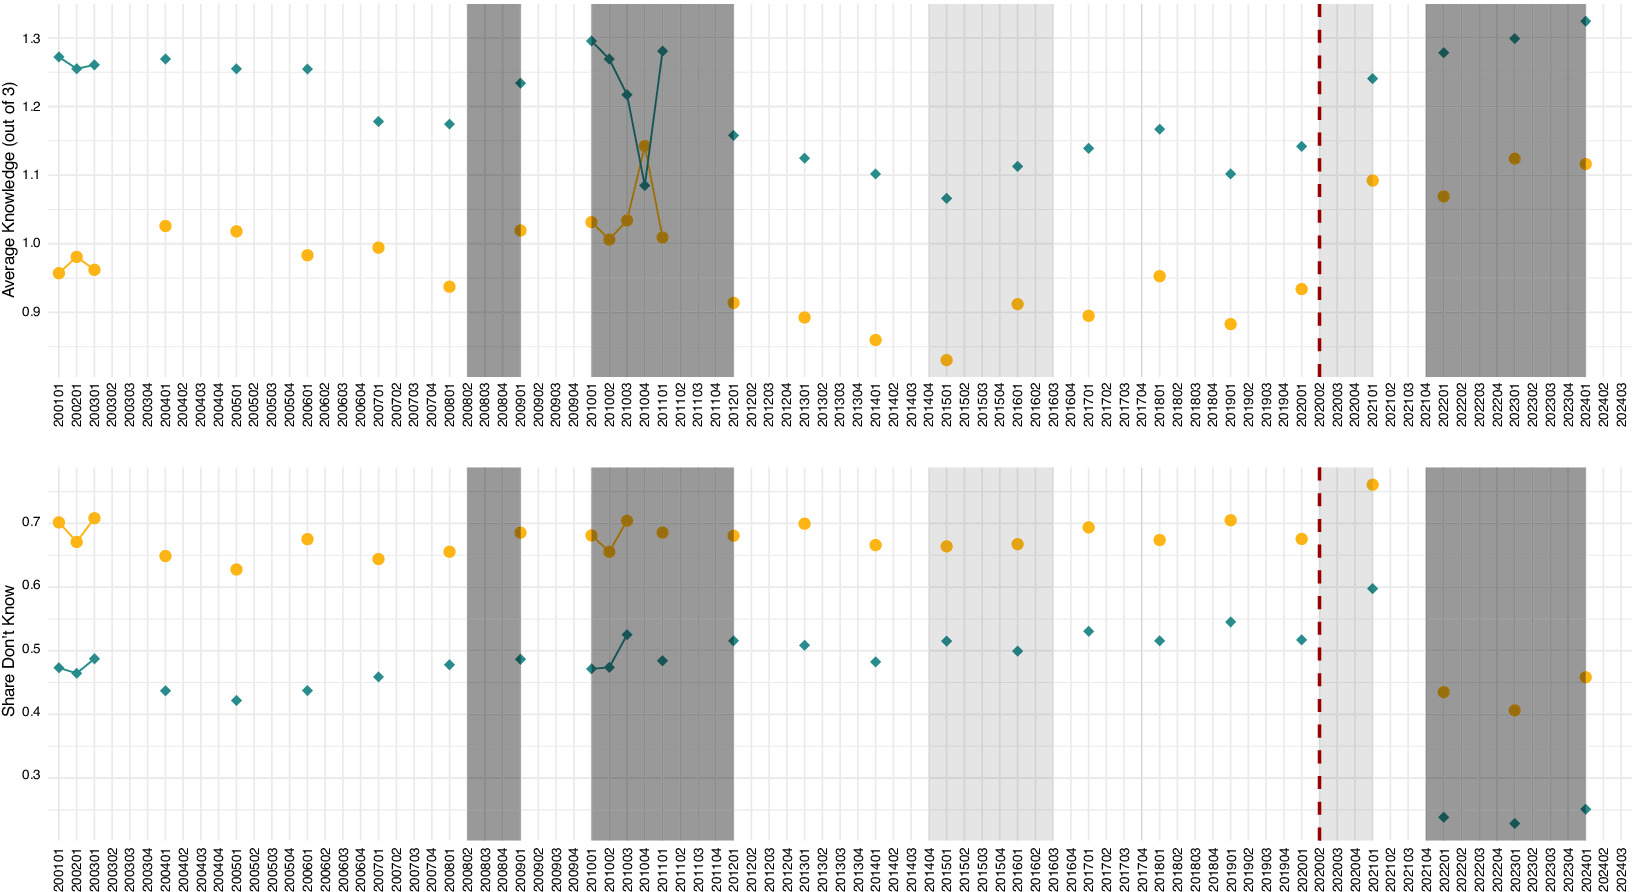
Claim 5 Women, on average, have lower knowledge of the monetary policy committee. Nonetheless, everyone displays more knowledge when inflation is high and monetary policy becomes more prominent.
Figure 5 shows that women have lower scores on average. This is also confirmed in a linear regression of the knowledge score on a range of demographics, including the female dummy (see Table 2). In a baseline specification in Column (1), women appear to have a score that is lower than men by 0.18 points on average, even when controlling for other demographics.Footnote 9 Further, women choose ‘Don’t know’ to at least one question at a higher frequency than men, which explains the smaller (though still significant) gender gap in the two alternative measures of knowledge (Columns (4) and (5)).Footnote 10
Knowledge about the BoE Monetary Policy Committee.
Note: The figure shows the computed knowledge score about the BoE’s Monetary Policy Committee for men (in green, squares) and women (in yellow, circles) since Q1 2001. The data are only annually available. The red, dashed line marks 2020 Q2 when the survey went online due to the pandemic and the ‘Don’t know’ response was removed from the initially presented options. Periods when CPI inflation exceeded 3% are shaded dark and periods when CPI inflation was below 1% are shaded light.
Sources: BoE Inflation Attitudes Survey; authors’ own calculations.
Drivers of knowledge about the BoE
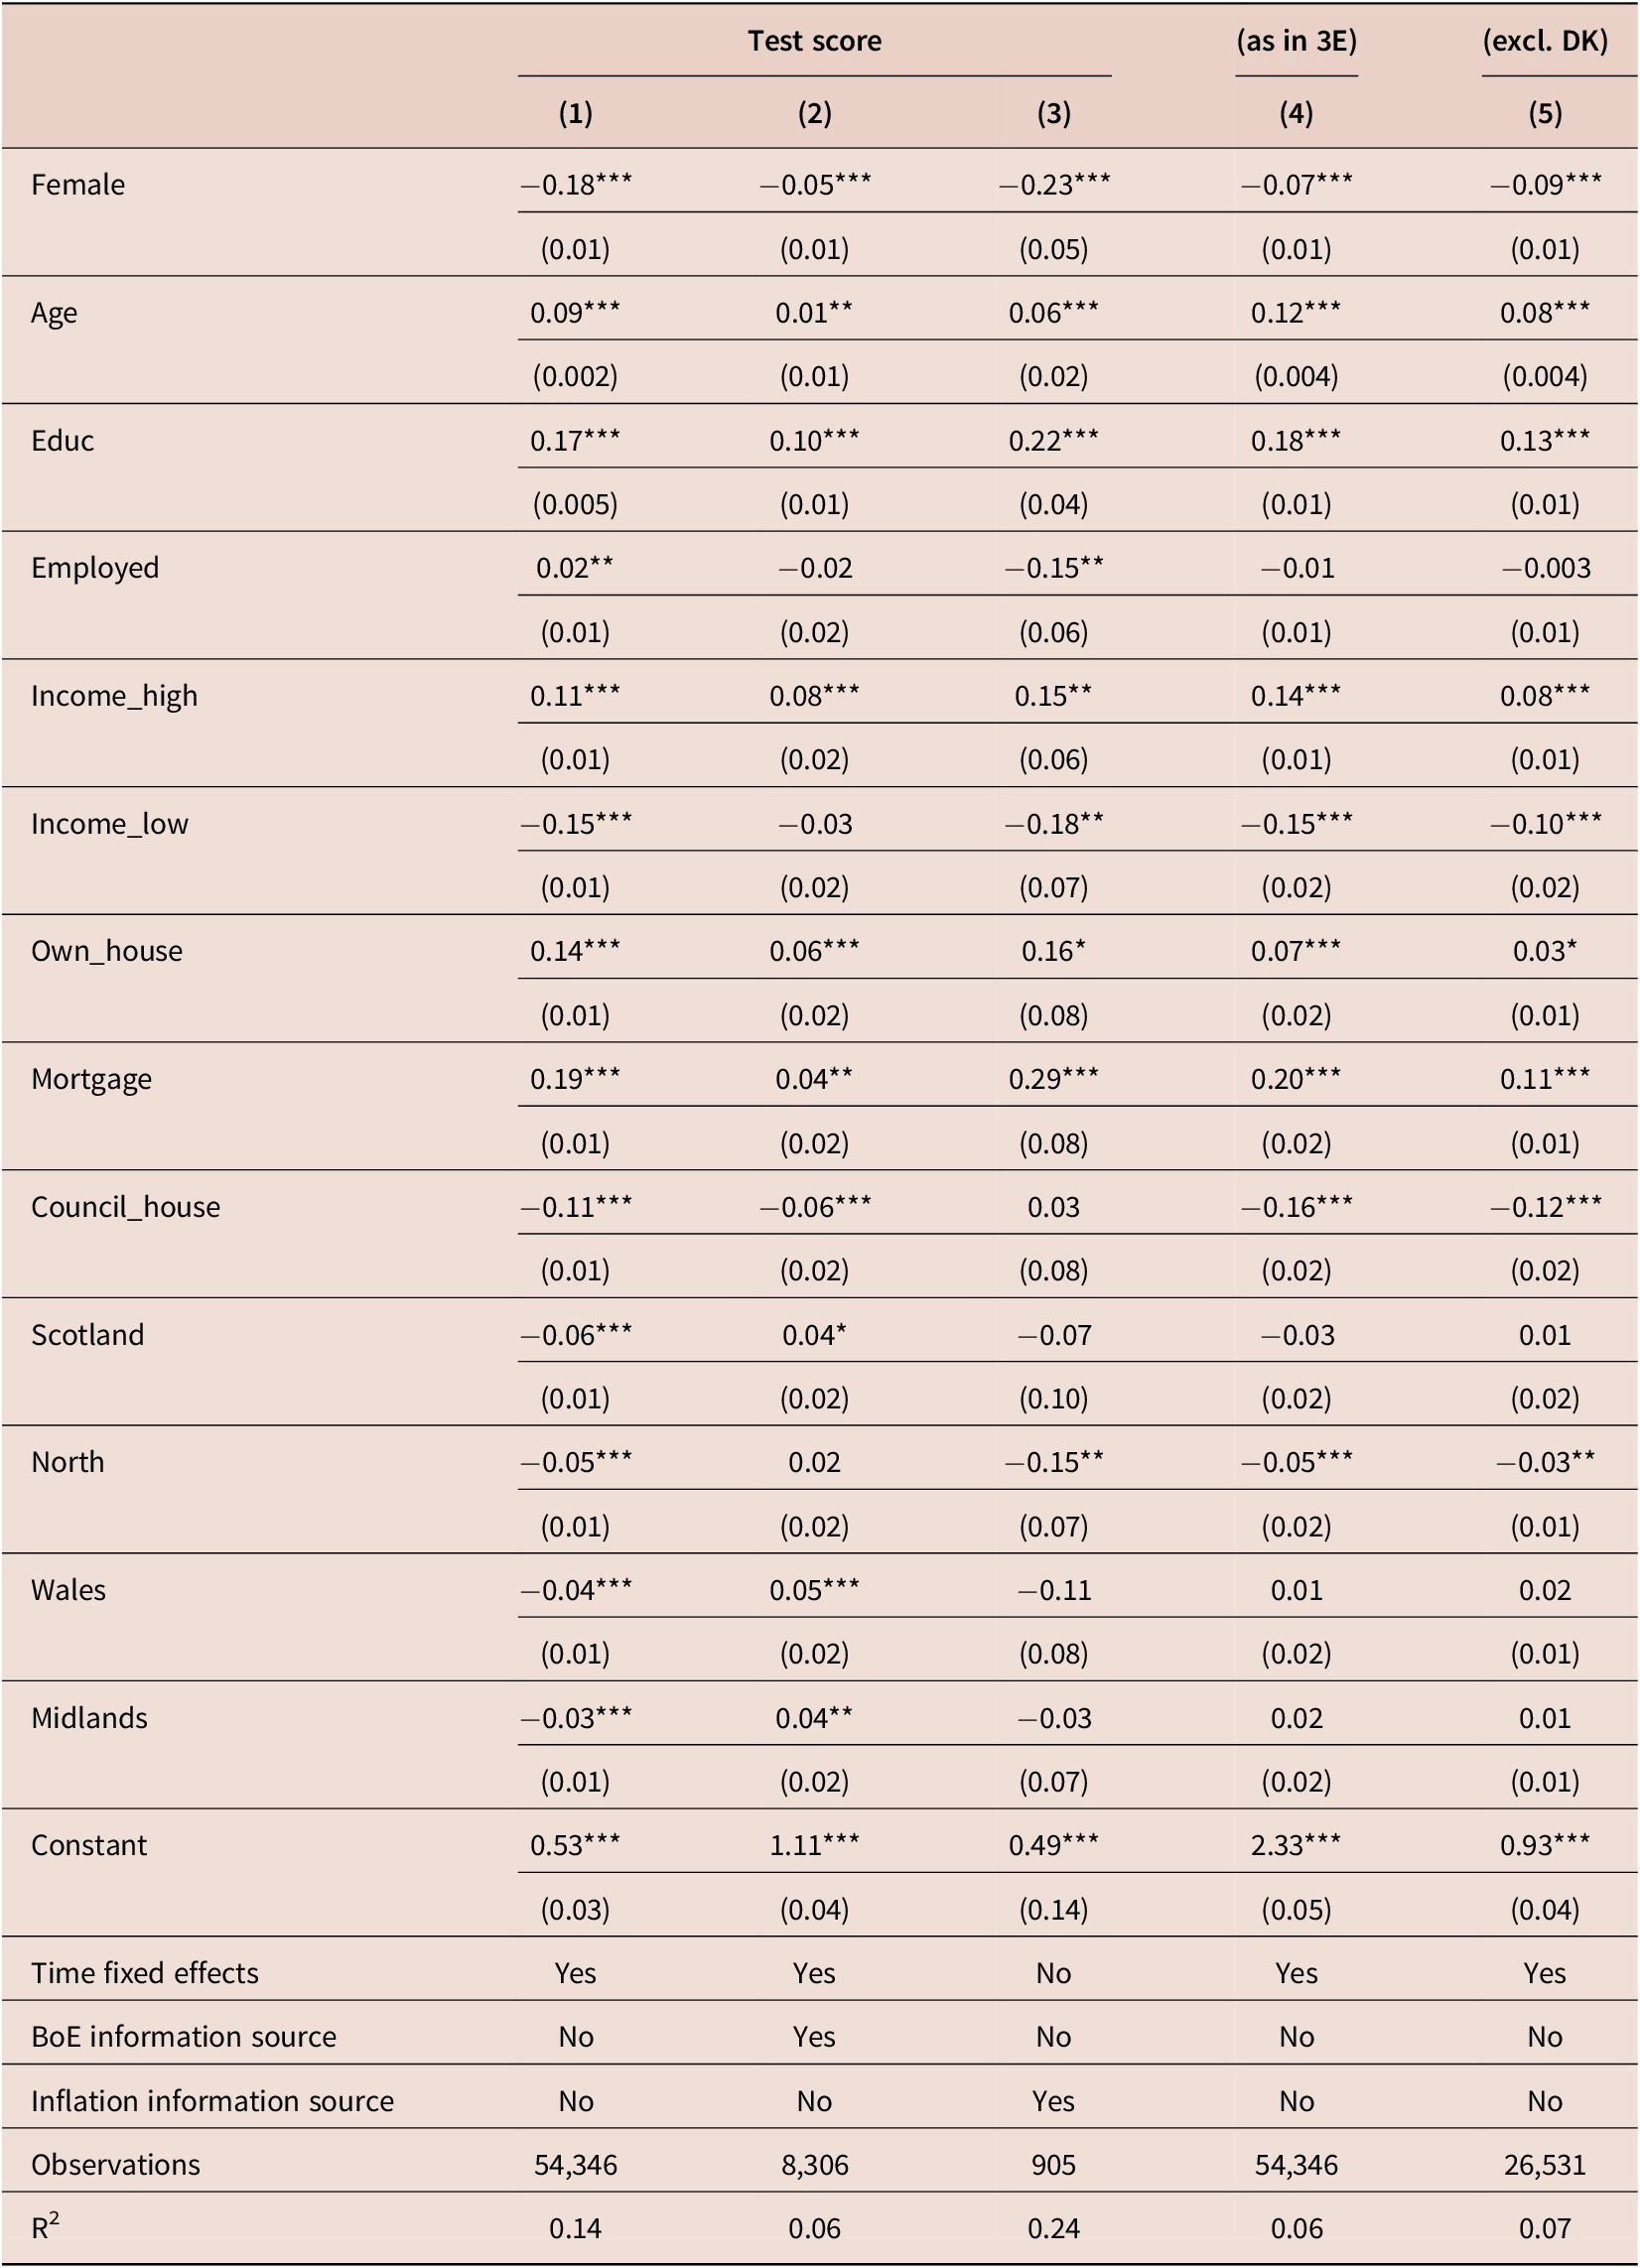
Note: The table shows the results of a linear regression of the computed knowledge score about the BoE’s Monetary Policy Committee on a range of demographics. Columns 4 and 5 use alternative measures of knowledge; in 4, DK answers yield half a point, and in 5, they are excluded. Significance levels are indicated by stars: *** $ p<0.01 $
, **
$ p<0.01 $
, ** $ p<0.05 $
and *
$ p<0.05 $
and * $ p<0.1 $
. Standard errors are reported in parentheses below the coefficient estimates.
$ p<0.1 $
. Standard errors are reported in parentheses below the coefficient estimates.
Sources: BoE Inflation Attitudes Survey; authors’ own calculations.
Figure 5 reveals that the recent spike in inflation has coincided with the knowledge scores for both men and women increasing substantially and the ‘Don’t know’ answers drastically reduced. This is consistent with periods of low inflation being associated with engagement with issues of monetary policy (and correspondingly low consumers’ knowledge about the BoE and monetary policy).Footnote 11 These findings make clear that engagement with the public is a double-edged sword; when central banks most need to be able to communicate with the public, they have chosen to become more aware of what the central bank does, but they become interested precisely at the time when the central bank is failing to achieve its mandate (see McMahon and Rholes (Reference McMahon and Rholes2024) for an illustration of the detrimental effects of such attention).
4.2. Satisfaction with the Bank
Claim 6 Women are generally less satisfied with the Bank of England than men. The recent high inflation has reduced satisfaction with the Bank for both genders.
Claim 6 emerges in Figure 6, which shows that for both men and women dissatisfaction with the BoE has increased significantly since the rise of inflation in recent years.Footnote 12 Columns (1)–(3) of Table 3 show that being a female significantly reduces BoE satisfaction while controlling for various demographics in a linear regression. The coefficient on the female dummy is slightly attenuated when the different response to inflation is controlled for (Column (2)). However, Columns (4) and (5) show that the negative attitude women have towards inflation reduces their satisfaction with the Bank.
Satisfaction with the Bank of England.
Note: The figure shows the mean score to the question Overall, how satisfied or dissatisfied are you with the way the Bank of England is doing its job to set interest rates in order to control inflation? as well as the share of ‘Don’t know’ responses for men (in green, dotted) and women (in yellow) since Q1 2001. Satisfaction is computed from 1 (satisfied) to −1 (dissatisfied). The red, dashed line marks 2020 Q2 when the survey went online due to the pandemic and the ‘Don’t know’ response was removed from the initially presented options. Periods when CPI inflation exceeded 3% are shaded dark and periods when CPI inflation was below 1% are shaded light.
Sources: BoE Inflation Attitudes Survey; authors’ own calculations.
Drivers of BoE satisfaction
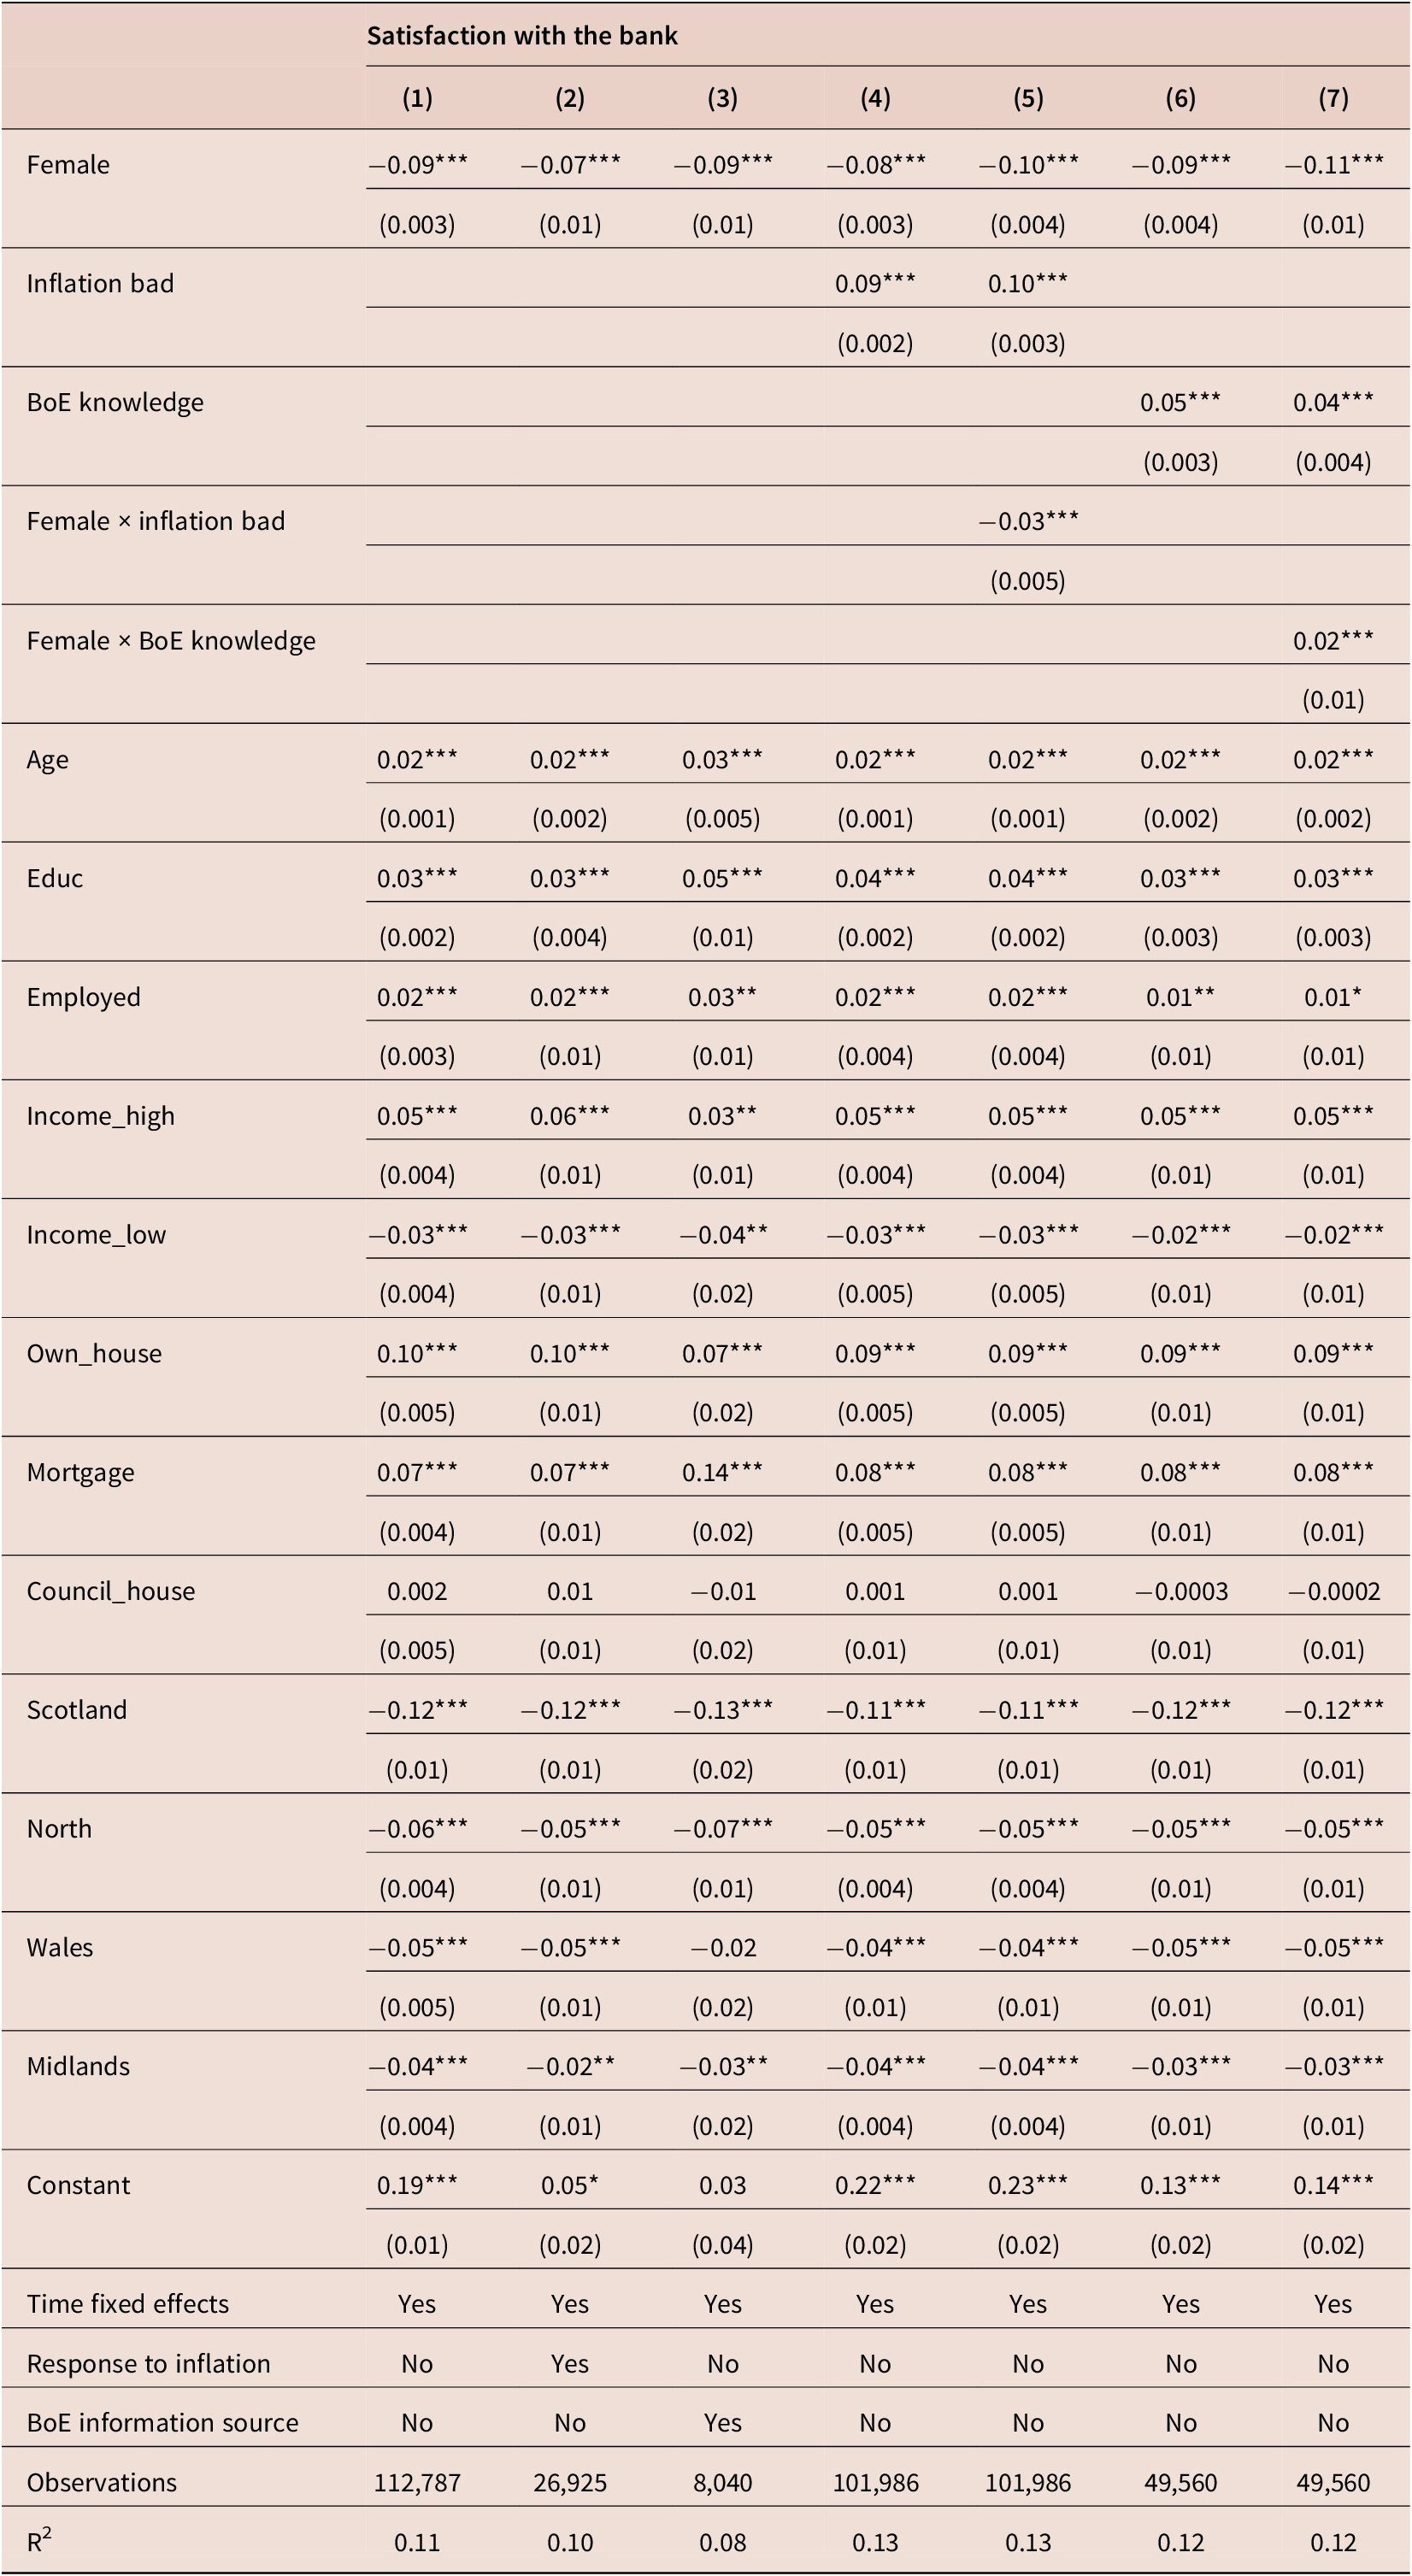
Notes: The table shows the result of a linear regression of the satisfaction with the BoE, that is, if the respondent is very satisfied with the bank (1), neutral (0) or very dissatisfied (−1) on a range of demographics. Significance levels are indicated by stars: *** $ p<0.01 $
, **
$ p<0.01 $
, ** $ p<0.05 $
and *
$ p<0.05 $
and * $ p<0.1 $
. Standard errors are reported in parentheses below the coefficient estimates.
$ p<0.1 $
. Standard errors are reported in parentheses below the coefficient estimates.
Sources: BoE Inflation Attitudes Survey; authors’ own calculations.
Controlling for the differences in knowledge does not change the negative gender effect on satisfaction. As expected, greater knowledge about the bank is associated with greater satisfaction (Columns (6) and (7)). Moreover, the positive effect of knowledge on satisfaction is stronger for women than for men (Column (7)). This suggests that improving knowledge about the Bank might help reduce the negative sentiment women on average appear to have towards it.
5. Sources of information
Finally, we explore whether different sources of information are a key cause of gender gaps in survey responses about knowledge about a concept such as inflation or about an institution such as the BoE. For instance, gender gaps in inflation expectations have been attributed to women being the prime grocery shopper and groceries shopping having typically higher (or at least more volatile) inflation (D’Acunto et al., Reference D’Acunto, Malmendier and Weber2021). While this has been questioned by showing how the gender gaps do not disappear when focusing on single-person households (Reiche, Reference Reiche2024), by occasionally asking which resources individuals use to form their inflation forecasts, the IAS allows us to directly investigate this information source hypothesis.
Claim 7 There is no persistent difference in the source of information for forming inflation expectations between men and women.
In two survey waves, 2017 Q1 and 2023 Q1, the IAS included the question What were the most important factors that led you to your expectation of prices in the shops over the next 12 months?. Respondents are given a range of options including grocery prices, discussions of inflation in the media, interest and exchange rates, the inflation target and the strength of the UK economy, as well as the options to select none or say ‘Don’t know’. In 2023, they could also choose prices of energy and petrol/diesel (further details in Supplementary Appendix Table A.5). Table 4 summarizes the responses to the question. Groceries (both options) are about the same in the 2017 wave, though women put slightly higher weight on groceries in the 2023 wave. Men put more weight on media in the 2017 wave but the gap closes for the 2023 wave. This shows that while over time the information sources change, there is no clear persistent difference between men and women. This is reassuring given that they then converge on similar inflation expectations (with the constraints of the survey design described earlier) and further reinforces that other potential differences between men and women are not caused solely by differential shopping behaviour.
Sources of inflation forecast
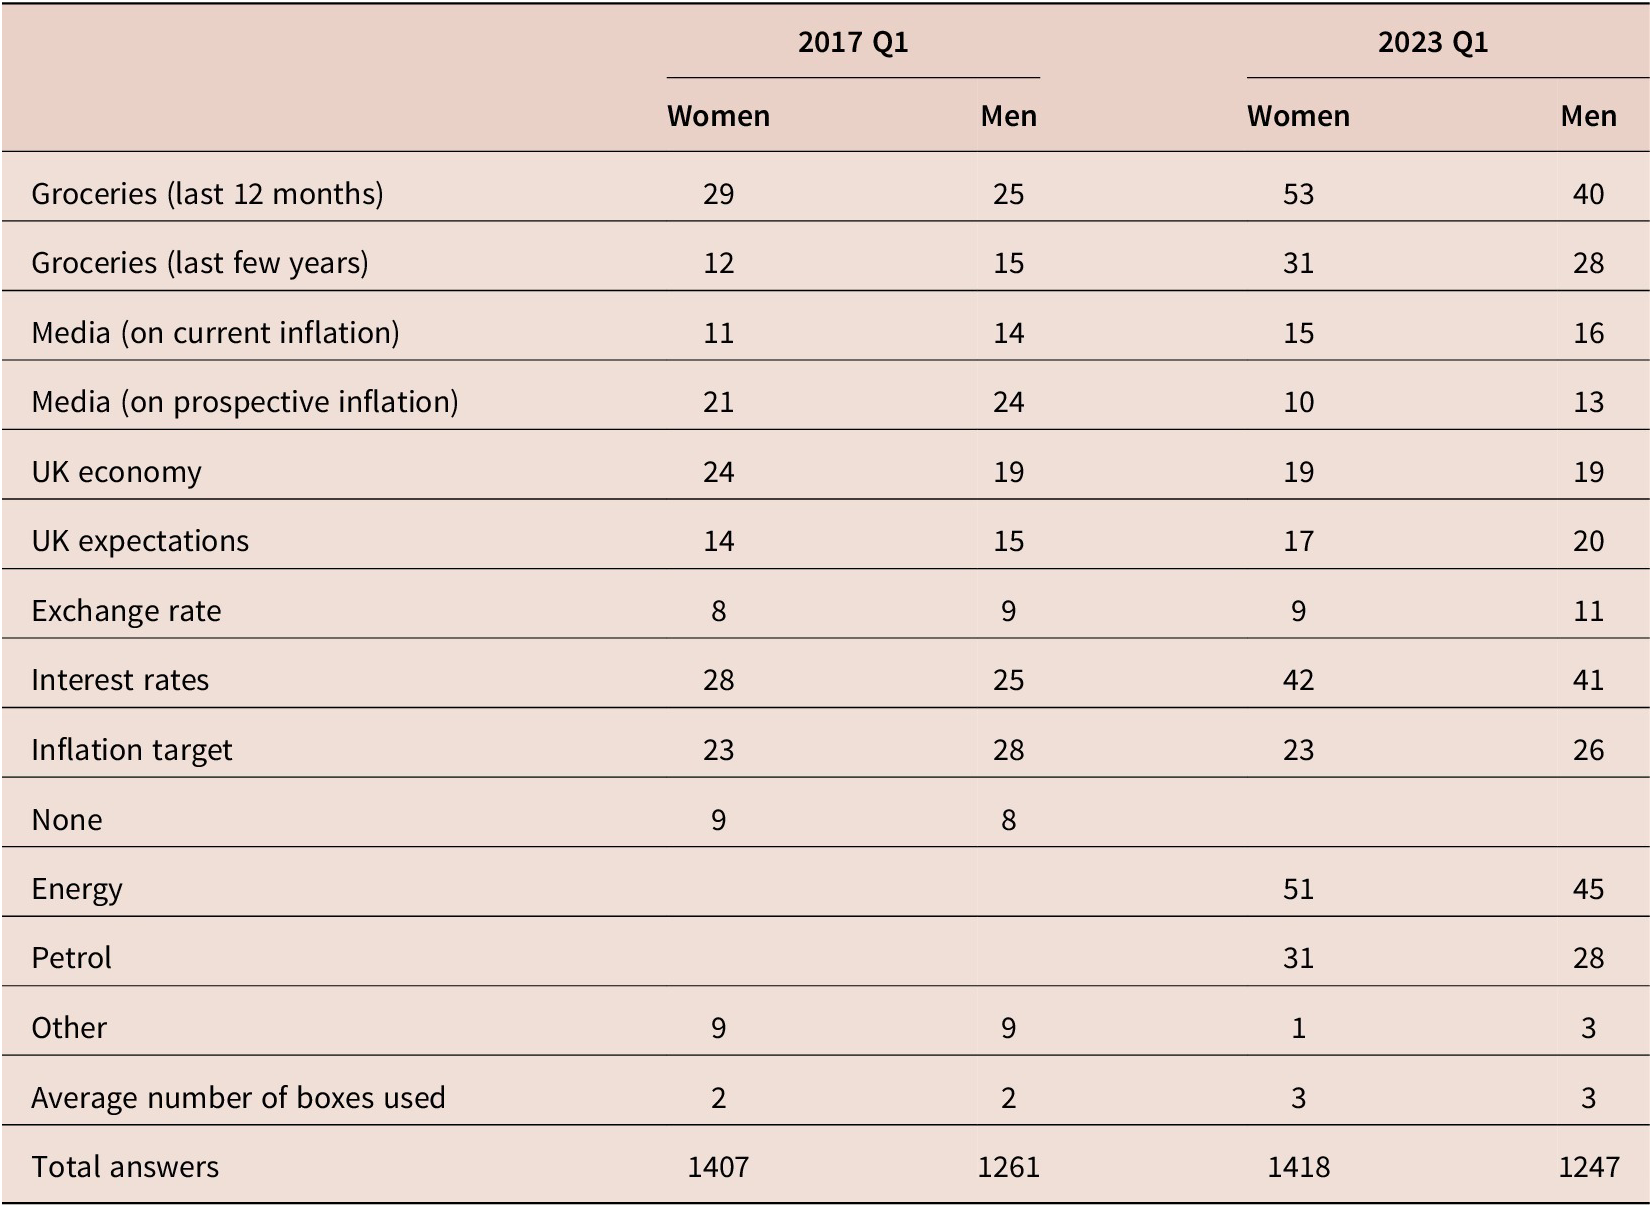
Note: The table compares the share of men and women that ticked the respective answer as a source for their inflation forecast. Up to four answers were allowed. The question was asked in 2017 Q1 and 2023 Q1, the latter included the additional options of energy and petrol prices.
Sources: BoE Inflation Attitudes Survey; authors’ own calculations.
The survey also asks where they gather their information about the Bank. The survey question is Have you got information about the Bank of England from any of the sources on this card? and the options include newspapers and magazines, TV and radio, the BoE website, other websites and search engines, BoE publications and BoE enquiries desk. There are also options to select none or say ‘Don’t know’ (further details in Supplementary Appendix Table A.8).
Claim 8 Men and women both predominantly get their information about the Bank of England from the media. But women are more likely to use non-traditional sources for information on the Bank.
Table 5 shows that the most common source of information is TV and radio followed closely by newspapers and magazines in usage by both men and women. All other sources are used less. In contrast, around 32% of women use none of the given options to inform themselves (compared to 25% of men). While there is little variation in information sources over time (see Supplementary Appendix Figure B.3), there are significant gender gaps present. Women are less likely to answer the question in the first place and are more likely to choose none of the options and ‘Don’t know’. This is in line with the ‘News are for men’ hypothesis in Toff and Palmer (Reference Toff and Palmer2018).
Sources of BoE information
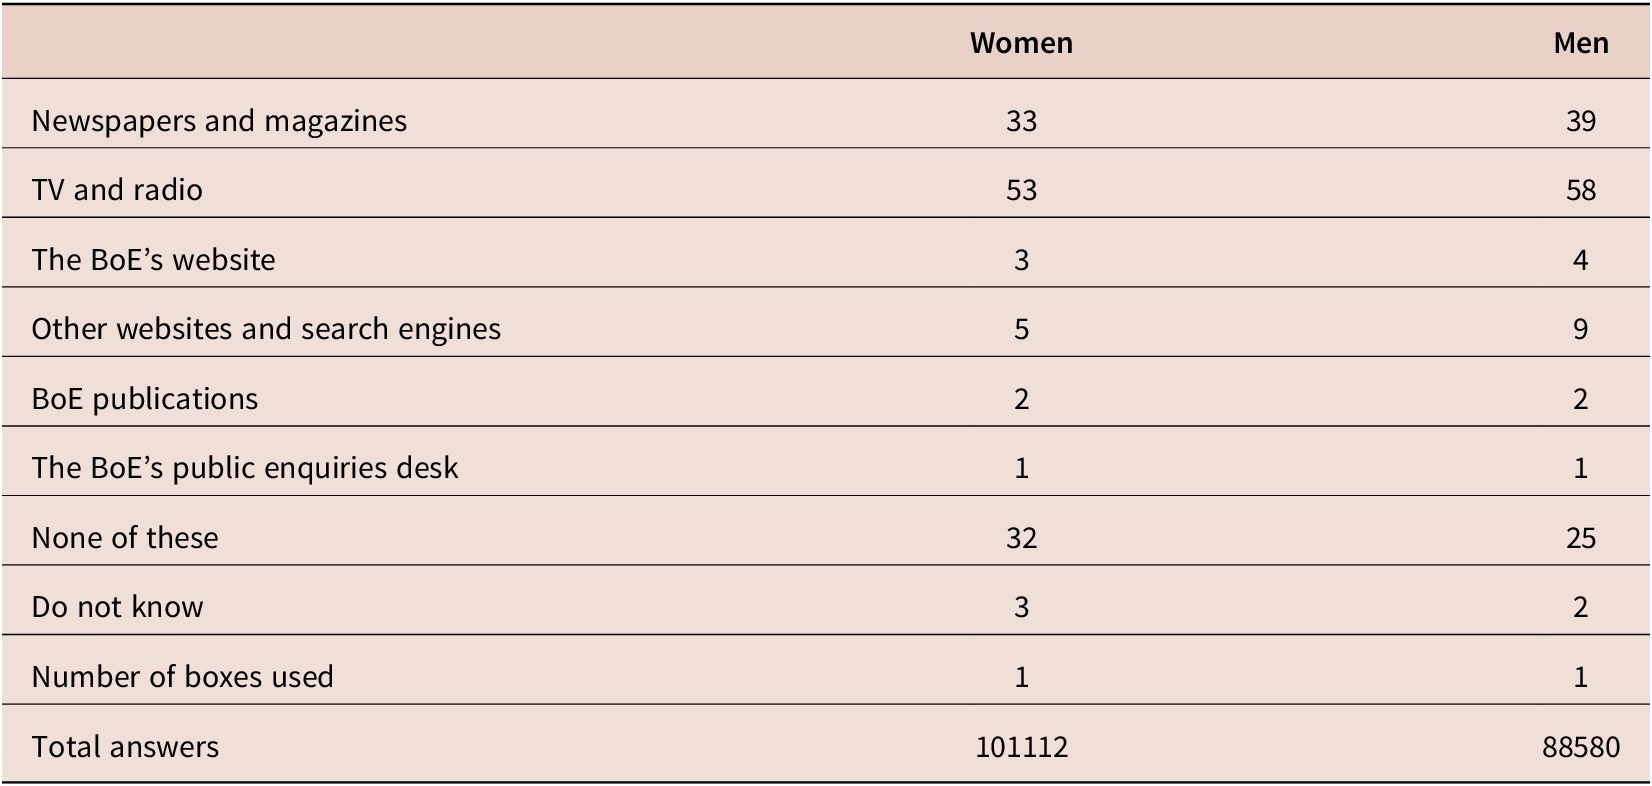
Note: The table compares the share of men and women that ticked the respective answer as a source for information about the BoE.
Sources: BoE Inflation Attitudes Survey; authors’ own calculations.
Sources about BoE information may be a driver of gender gaps in uncertainty about inflation and knowledge about the BoE and the MPC. In Column (2) of Table 2, we include the BoE information sources as controls and the gender gap on knowledge about the BoE reduces (though it remains negative and statistically significant).Footnote 13 By contrast, including controls for inflation information sources has no impact on the gender gap in knowledge about the Bank.
Controlling for informational sources about the BoE can eliminate the gender gap on inflation uncertainty measured by the likelihood of saying ‘Don’t know’. Column (7) in Table 1 shows that in a logistic regression when controlling for informational source, the female coefficient reduces by about 50% and drops in significance (though the smaller sample size makes comparison harder). This highlights the key role that engagement and education can play in building understanding about the central bank and monetary policy, and the positive impact that this can have on the wider public’s satisfaction.
6. Conclusion
We document eight observations about gender gaps from the Bank of England Attitudes to Inflation Survey. Our results show that different information sources are important, and that the composition and prior understanding of the audiences matters for central bankers. We identify specific communication challenges that suggest careful policies aimed at ensuring better engagement and education for women with lower financial knowledge and understanding. Widening the range of channels to new forms of media seems a promising avenue for future research given our results above. For example, knowledge gaps can be addressed with media designed by women for women. Further, contextualizing policy decisions with a greater justification of the logic of the decision might help gain trust among females who dislike inflation more.
However, we cannot completely explain the gaps in attitudes about inflation and the BoE. These may be rooted in a generally more pessimistic view of women on various issues (Jacobsen et al. (Reference Jacobsen, Lee, Marquering and Zhang2014) on consumer sentiment and stock market performance, Garbarino and Strahilevitz (Reference Garbarino and Strahilevitz2004) on online shopping, Lin and Raghubir (Reference Lin and Raghubir2005) on marriage,? on health and Gwartney-Gibbs and Lach (Reference Gwartney-Gibbs and Lach2016) and Stevens et al. (Reference Stevens, Bulmer, Banducci and Vaughan-Williams2021) on war and security threats). Interestingly, Stevens et al. (Reference Stevens, Bulmer, Banducci and Vaughan-Williams2021) found that a key driver of this phenomenon is that women often identify security threats ‘due to a greater capacity to consider security from perspectives beyond their own’. It could be a plausible explanation that these gender gaps in sentiment about inflation and BoE reflect a more general concern for others who may be affected by higher inflation and monetary policy. This is an avenue for future research, though since there is little conclusive evidence on what causes gender gaps in political news participation (see Benesch (Reference Benesch2012) for evidence on socialization, cognitive costs, as well as opportunity costs as potential drivers), it will be difficult to close the gender gap in central bank communication fully.
Supplementary material
The supplementary material for this article can be found at http://doi.org/10.1017/nie.2025.1.
Acknowledgements
The authors thank Ben Caswell for his discussion of the paper, as well as other workshop participants for their helpful comments, questions and suggestions on the paper. Michael McMahon gratefully acknowledges the financial support from the European Research Council (Consolidator Grant Agreement 819131). All errors are their own.


 Open access