

It is well known that polygenic scores (PGSs) for educational attainment, and more broadly for other traits, are sensitive to cross-ancestry comparisons, being generally less predictive of relevant trait variance among populations that are ancestrally more distant from the populations in which the PGSs were originally estimated (e.g., Belsky et al., Reference Belsky, Domingue, Wedow, Arseneault, Boardman, Caspi, Conley, Fletcher, Freese, Herd, Moffitt, Poulton, Sicinski, Wertz and Harris2018; Duncan et al., Reference Duncan, Shen, Gelaye, Meijsen, Ressler, Feldman, Peterson and Domingue2019; Guo et al., Reference Guo, Lin and Harris2019; Lee et al., Reference Lee, Wedow, Okbay, Kong, Maghzian, Nguyen-Viet, Bowers, Sidorenko, Karlsson Linnér, Fontana, Kundu, Lee, Li, Li, Royer, Timshel, Walters, Willoughby and Cesarini2018; Weissbrod et al., Reference Weissbrod, Kanai, Shi, Gazal, Peyrot, Khera, Okada, Japan Project, Martin, Finucane and Price2021). One explanation of this ‘portability problem’ is that it results from linkage disequilibrium (LD) decay, whereby genetic variants that are noncausal of the relevant phenotype, but are nevertheless in LD with causal variants in the discovery sample, will be ‘flagged’ as though they were causal. Once the same PGS is estimated in a more distantly related population, the apparent predictivity of the PGS diminishes, as many of its constituent variants are now no longer in LD with the causal variants owing to recombination (Zanetti & Weale, Reference Zanetti and Weale2018). Rabinowitz et al. (Reference Rabinowitz, Kuo, Felder, Musci, Bettencourt, Benke, Sisto, Smail, Uhl, Maher, Kouzis and Ialongo2019) proposed an interesting hypothesis, specifically that some of the PGS portability problems between socially identified racial and/or ethnic (SIRE Footnote 1 ) groups in the US context, specifically in comparisons involving African American and White groups using PGSs for educational attainment and related phenotypes, might stem from gene-by-environment interactions. They state that ‘[e]nvironmental experiences such as poverty, racial discrimination and attending under-resourced schools may influence whether genetic propensity for educational attainment confers benefits for achievement and college attendance’ (p. 2). Footnote 2
Rabinowitz et al. (Reference Rabinowitz, Kuo, Felder, Musci, Bettencourt, Benke, Sisto, Smail, Uhl, Maher, Kouzis and Ialongo2019) offer the Scarr–Rowe effect (or ‘hypothesis’ or ‘interaction’) as evidence for the plausibility of their idea. This effect is a gene-by-environment interaction characterized by reductions in the heritability of measures of general cognitive ability (GCA), such as IQ, among those exposed to social adversity associated with low socioeconomic status (SES). This is thought to in turn reduce GCA among individuals from low-SES backgrounds by effectively preventing them from realising their full genetic potential for GCA (Rowe et al., Reference Rowe, Jacobson and van den Oord1999; Scarr-Salapatek, Reference Scarr-Salapatek1971; Turkheimer et al., Reference Turkheimer, Haley, Waldron, D’Onofrio and Gottesman2003; Turkheimer et al., Reference Turkheimer, Harden, D’Onofrio, Gottesman, McCartney and Weinberg2009). Scarr-Salapatek (Reference Scarr-Salapatek1971, see also Scarr, Reference Scarr1981) and others (e.g., Flynn, Reference Flynn2018; Jensen, Reference Jensen1968; Lewontin, Reference Lewontin1970, Reference Lewontin, Block and Dworkin1976) also considered gene-by-environment interactions involving forms of social adversity specific to SIRE groups to be prospective moderators of heritability, and therefore potential causes of SIRE group differences in cognitive performance means.
One meta-analytic report indicates that the heritability of GCA varies as a function of level of SES, at least in light of apparently robust Scarr–Rowe effects in US cohorts (Tucker-Drob & Bates, Reference Tucker-Drob and Bates2015). Footnote 3 Consistent with this finding, Guo and Stearns (Reference Guo and Stearns2002) report evidence for the Scarr–Rowe effect in the Add Health dataset; however, they also identified an additional statistically significant negative impact on the proportion of heritable variance associated with Peabody Picture Vocabulary Test (PPVT) performance stemming from participant African American (relative to White) designation, even after controlling for a number of SES variables. In relation to this, they noted that:
[O]ne assumption for such consideration is that the environments for intellectual development of African American children are still more disadvantaged than those for white children after controlling for the included family SES variables. Recent work has documented the discrimination African Americans face, decades after the civil rights movements…, and the legacy discrimination has left hinders the development of the middle-class vocabularies that would allow children to score highly on the PPVT. (p. 905)
A key prediction therefore is that even if hypothetical PGSs could be constructed using only causal variants, such PGSs would still not be fully portable between populations (or even among subgroups of individuals of the same population exposed to different environments), as heritability-attenuating gene-by-environment interactions associated with racial discrimination, poverty and other forms of social adversity would cause them to fail to predict equal amounts of phenotypic variance when examined in the context of differentially socially advantaged groups. Some evidence consistent with this observation comes from two studies (Woodley of Menie et al., Reference Woodley, Pallesen and Sarraf2018; Woodley of Menie et al., Reference Woodley, Peñaherrera-Aguirre, Dunkel and Sarraf2021) that were able to recover Scarr–Rowe effects using childhood SES as a moderator of the expressivity of educational attainment PGSs on measures of GCA in two large genetically informed US samples (sourced from the Wisconsin Longitudinal and Health and Retirement Studies, respectively). In both cases, the effects were relatively small by the standards of psychological science (specifically ≤.l0, the average meta-analytic effect magnitude in psychology being around .20; Gignac & Szodorai, Reference Gignac and Szodorai2016), but they were statistically significant and robust to the use of different sets of controls and measurement models.
In the current study, an attempt is made to test the hypothesis of Rabinowitz et al. (Reference Rabinowitz, Kuo, Felder, Musci, Bettencourt, Benke, Sisto, Smail, Uhl, Maher, Kouzis and Ialongo2019) in relation to the impacts of two forms of social adversity, low SES and racial and ethnic discrimination, on the expressivity of a PGS for educational attainment (predicting GCA) using a sample composed of individuals from multiple SIRE groups. The study will also examine whether sources of social adversity associated with SIRE, such as racial and ethnic discrimination, modify PGS expressivity on GCA, independent of the effects of SES, which would effectively replicate Guo and Stearns’ (Reference Guo and Stearns2002) findings of distinct effects of these on the heritability of a cognition measure. The current effort uses individuals sourced from the US Adolescent Brain and Cognitive Development (ABCD) dataset (Jernigan et al., Reference Jernigan, Brown and Dowling2018), which is broadly representative of the US population, and contains a variety of SES variables, in addition to (multiple) measures self-reported racial and ethnic discrimination. These data are available for large numbers of (specifically parentally identified) Black, White and Hispanic children (Jernigan et al., Reference Jernigan, Brown and Dowling2018). As the sample is genotyped, PGSs predictive of GCA and other traits can also be estimated. As an additional step, in order to reduce confounding effects stemming from cross-ancestry comparisons, the interaction models are estimated using an educational attainment PGS generated via the new ‘PolyFun-Pred’ (POLYgenic FUNctionally-informed fine mapping PREDiction) method, which uses very large numbers of single nucleotide polymorphisms (SNPs) coupled with fine mapping-based functional area weighting to reduce between-population biases due to LD decay, via the identification of prospectively causal variants (Weissbrod et al., Reference Weissbrod, Kanai, Shi, Gazal, Peyrot, Khera, Okada, Japan Project, Martin, Finucane and Price2021). Furthermore, as a null-test of the model, another PolyFun-Pred-type PGS is estimated for a prospectively more socially neutral trait, specifically height, where gene-by-environment interactions involving social adversity might be substantially weaker to nonexistent, at least in relatively modernized social contexts where serious malnutrition is uncommon. Footnote 4
Interestingly, thus far no research on gene-by-environment interactions has attempted to determine whether discrimination (measured directly, rather than crudely proxied via the use of SIRE, as in Guo & Stearns, Reference Guo and Stearns2002) uniquely impacts, through adverse gene-by-environment interactions, GCA (contrast this with the extensive body of research into the adverse effects of low SES on the additive heritability of GCA; e.g., Tucker-Drob & Bates, Reference Tucker-Drob and Bates2015). This is an interesting oversight, as (within the US context) self-reported experiences of racial discrimination are quite prevalent, especially among minority populations (e.g., Boutwell et al., Reference Boutwell, Nedelec, Winegard, Shakelford, Beaver, Vaughn, Barnes and Wright2017; Lee et al., Reference Lee, Perez, Boykin and Mendoza-Denton2019). Moreover, there has been considerable academic debate concerning the mechanisms through which discrimination might adversely affect GCA among minority populations in the US (for discussion on the plausibility of skin reflectance or color-based prejudice mediated by sociostructural factors, see Cooper, Reference Cooper2005 and Rowe, Reference Rowe2005).
To bring some clarity to this debate, discrimination itself will be examined using behavior-genetic techniques (on data from the ABCD twin subsample) in order to determine whether it is merely proxying some underlying heritable phenotypic variation (with which it would then be associated), or whether it functions instead as a purely environmental, and therefore almost certainly social, force. In the case of the former, it would be expected that it exhibits significantly nonzero heritability, but in the latter case it would be expected that discrimination is not significantly heritable, being instead a function of shared and/or nonshared environmentality. To the authorship’s knowledge, no direct behavior-genetic analysis of self-reported discrimination has ever been carried out, despite the fact that such efforts have the potential to substantially clarify the empirical foundations of arguments about the means by which discrimination might affect GCA.
Methods
Cohort
The subjects employed here were sourced from the ABCD (v. 3.01) data release. This large longitudinal study involves collaboration between 21 different sites across the US. ABCD sourced its data from over 11,000 children, aged 9-10 years, who mostly came from a mixture of public and private elementary school contexts. ABCD offers data that are broadly representative of this age range of healthy children from the US via probabilistic sampling and the exclusion of those exhibiting severe medical and psychiatric conditions (Jernigan et al., Reference Jernigan, Brown and Dowling2018). The sample employed in the current analysis includes those who fall into the Black, White and Hispanic SIRE categories. Although Black and White SIRE groups are most germane to historical discussion on the impacts of different forms of social adversity on the heritability of GCA (e.g., Guo & Stearns, Reference Guo and Stearns2002; Scarr-Salapatek, Reference Scarr-Salapatek1971), those who were identified as ethnically Hispanic were also included, as such individuals are also likely to have experienced higher levels of discrimination, relative to non-Hispanic Whites. In the case of ABCD, an 18-item questionnaire is given to the parents asking ‘What race do you consider the child to be? Please check all that apply’. This allowed for participants to be assigned to either the Black (element name: demo_race_a_p__11, N = 1282), or White (demo_race_a_p__10, N = 5413) racial categories. The following additional question was asked: ‘Do you consider the child Hispanic/Latino/Latina?’. This allowed individuals to be assigned to the Hispanic ethnic category (demo_ethn_v2, N = 1185). Participants were coded as Hispanic if they were categorized as ethnically Hispanic, irrespective of their racial identification (Black or White). Only non-Hispanic participants were coded as either Black or White for the purposes of the current study. This yielded a total sample size of 7,880 individuals with complete data on all of the following variables.
Variables
Genetic data
ABCD provides microarray data on genotyped individuals, where imputation was performed employing the TOPMed imputation server. The following preimputation steps were utilized (by ABCD). First, PLINK v1.9 (Purcell et al., Reference Purcell, Neale, Todd-Brown, Thomas, Ferreira, Bender, Maller, Sklar, de Bakker, Daly and Sham2007) was used to calculate allele frequencies. Second, .bim files were checked against two reference datasets, the Haplotype Reference Consortium and the 1000 Genomes project. Third, PLINK v1.9 was used to convert everything to VCF files; and fourth, checkVCF.py was used to determine whether this conversion was successful. ABCD then uploaded the VCF files to the TOPMed Imputation Server, where imputation was performed using Eagle v2.4 phasing and mixed ancestry. Postimputation quality filtering was performed by excluding SNPs with an imputation quality score of r 2 < .40 using bcftools (v.1.7.2; Li, Reference Li2011). The total number of variants that remained after filtering was 103,382,718 for 11,101 participants.
PGSs
Two PGSs were generated, one for educational attainment (PGSEDU) and a second one for height (PGSHEIGHT). Both were generated using PolyFun-Pred, a novel method for polygenic prediction, developed by Weissbrod et al. (Reference Weissbrod, Kanai, Shi, Gazal, Peyrot, Khera, Okada, Japan Project, Martin, Finucane and Price2021), which they describe as follows:
PolyFun-Pred is a new predictor that leverages genome wide functionally informed fine-mapping… to estimate posterior mean causal effects (instead of tagging effects…) for all SNPs with European MAF≥0.1% (accounting for MAF-dependent architectures… 18 million SNPs in this study) by applying PolyFun + SuSiE35 to European training data across 2,763 overlapping 3Mb loci. Leveraging fine-mapped posterior mean causal effects for cross-population polygenic prediction aims to address LD differences between populations; to our knowledge, the application of PolyFun + SuSiE (or any other fine-mapping method) to polygenic prediction has not previously been explored. (p. 2–3)
Weissbrod et al. (Reference Weissbrod, Kanai, Shi, Gazal, Peyrot, Khera, Okada, Japan Project, Martin, Finucane and Price2021) provide methods for estimating PolyPred-Fun type PGSs for a large number of traits with summary statistics, based on the UKBioBank. They make all weighting terms for all analyzed SNPs in the UKBioBank publicly available, which allows for the equivalent variants in ABCD to be identified and weighted accordingly for use in generating the relevant equivalent PGSs in this cohort. The PGSs were scored using PLINK (v1.90b6.17). For educational attainment, there was an average (across participants) of 1,013,790.05 (N = 7880; SE = .002) variants that overlapped with those identified by Weissbrod et al. (Reference Weissbrod, Kanai, Shi, Gazal, Peyrot, Khera, Okada, Japan Project, Martin, Finucane and Price2021). For height, there was an average of 850,474.59 (N = 7880; SE = .002) overlapping variants.
Ancestral principal components
All SNPs were used (in PLINK) to generate 10 ancestral principal components (PCs). These correspond to genome wide patterns of covariation among the frequencies of alleles, which capture, in the form of distinct dimensions, different ancestral population structures among (in this case) the ABCD participants. These can be used as simple and effective controls for the effects of population stratification on the results of studies employing the outputs of GWASs, such as PGSs in mixed ancestry samples (Price et al., Reference Price, Patterson, Plenge, Weinblatt, Shadick and Reich2006). Population stratification can potentially confound the results of such studies by generating spurious patterns of association between PGSs and their outcomes.
GCA
The ABCD contains data on 11 cognitive ability measures. The first seven comprise the NIH Toolbox® cognitive battery. This battery includes picture vocabulary, flanker, list sorting, card sorting, pattern comparison, picture sequence memory, and oral reading recognition subtests. Also included are the matrix reasoning subtest from the Wechsler Intelligence Scale for Children, the efficiency score from the Little Man test, and the Rey Auditory Verbal Learning (immediate recall and delayed recall memory) Tasks (RAVLT; for details of these, see Luciana et al., Reference Luciana, Bjork, Nagel, Barch, Gonzalez, Nixon and Banich2018 and Thompson et al., Reference Thompson, Barch, Bjork, Gonzalez, Nagel, Nixon and Luciana2019).
To construct a GCA factor for the participant pool, we employed unit-weighted factor estimation (Gorsuch, Reference Gorsuch1983). This form of exploratory factor scoring involves standardizing each participant’s score on each subtest and then averaging across them to generate a unit-weighted factor. Unit-weighted estimation has the advantage of potentially yielding latent variables that generalize to a far greater degree across samples that are heterogeneous with respect to sampling error than the results of other dimension-reduction techniques (Gorsuch, Reference Gorsuch1983). Part-whole correlations between each subtest and the unit-weighted factor yield factor loadings. Squaring the factor loadings and then averaging them allows for the proportion of variance accounted for by that factor to be estimated. In the total participant pool, GCA was found to account for 32.7% of the variance (N = 7880). Factor loadings (λ) ranged from .64 (in the case of RAVLT short-term memory and RAVLT long-term memory) to .43 (in the case of the Little Man test). The full set of factor loadings is reported in Table 9 in the Results section. Factorial invariance with respect to both SIRE and sex was determined via the estimation of Tucker’s congruence coefficients (CC), which index factor similarity. Based on the unit-weighted factor loadings, it was found that GCA exhibited strong consistency in terms of factor structure across sex and SIRE groups (average CC = .997). Coefficients of .95 or greater indicate virtual identicality among factors (Lorenzo-Seva & Ten Berge, Reference Lorenzo-Seva and Ten Berge2006).
The predictive validity of PGSEDU on GCA was examined disaggregated by SIRE in order to determine the patterns of portability (Table 1). Prior to entry into the model, PGSEDU was residualized for the fixed effects of the following confounds: family ID (rel_family_ID); within- and between-family singleton, twin, and triplet status (rel group id and rel ingroup_order); relationship of the participant in their family (rel_relationship); and collection site ID (site id 1). In the combined sample, these confounds account for 8% of the variance in PGSEDU. Each main effect of PGSEDU on GCA was then estimated with controls for the first 10 ancestral PCs (results for these not shown). This (and subsequent) portability analysis was conducted using SAS v. 9.4.
Results of running the regression analyses predicting GCA using PGSEDU separately by SIRE group, along with Bonferroni-corrected significances of differences
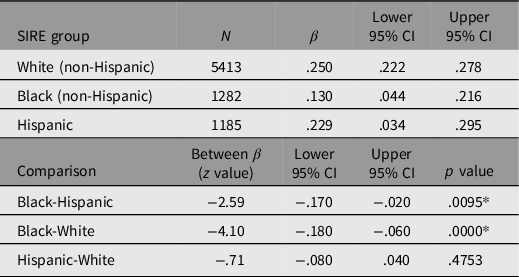
Note: *Significant based on Bonferroni adjusted p = .0166.
Running regressions using PGSEDU predicting GCA in each SIRE group separately (controlling for the 10 PCs in each case) indicates that despite the use of a technique that is designed to increase the portability of PGSs derived from one population to others, cross-ancestry comparisons employing this PGS still exhibit significant portability problems when the regression parameters among the SIRE groups are compared. Portability between the White and Hispanic groups appears to be high, however, since there is no (Bonferroni-adjusted) significant difference in the variance in GCA explained by the PGS between the two groups.
Height
Three height measurements were collected per participant (anthro_1_height_in to anthro_3_height_in, all measurements are in inches). The average of all three measures (where available) was used to assign a phenotypic height value to each participant. As with PGSEDU, the portability of PGSHEIGHT was examined in relation to the three SIRE groups (results presented in Table 2).
Results of running the regression analyses predicting height using PGSHEIGHT separately by SIRE group, along with Bonferroni-corrected significances of differences

As with PGSEDU, prior to entry into the model, PGSHEIGHT was residualized for the fixed effects of the following confounds: family ID; within- and between-family singleton, twin, and triplet status; relationship of the participant in their family; and collection site ID. In the combined sample, these confounds account for 2% of the variance in PGSHEIGHT. Each main effect of PGSHEIGHT on GCA was then estimated with controls for the first 10 ancestral PCs (results for these not shown).
Running regressions using PGSHEIGHT predicting height in each SIRE group separately (controlling for the 10 PCs in each case) indicates that cross-ancestry comparisons are associated with fewer significant portability problems (relative to PGSEDU), with PGSHEIGHT accounting for similar amounts of variance in phenotypic height in all three SIRE groups. Only the Black-White portability difference reached (Bonferroni-adjusted) significance.
Socioeconomic status
Six SES measures were chosen to capture a broad range of environments relevant to participant exposure to childhood economic and social adversity. These include seven items assessing financial adversity in different contexts, which were reverse-scored and then summed into an index score. Additionally included is a measure of neighborhood safety (a three-item index asking about different aspects of neighborhood safety, scaled 1–5), parental marital status (recoded such that 1 = married, and 0 = any other arrangement) and employment status (1 = employed, 0 = not currently employed), parental educational attainment (both parents, measures highest level of educational attainment achieved rescaled in order to generate scores ranging from 0 to 18 approximate years of attained education as follows: Never attended/kindergarten only = 0; 1st grade = 1; 2nd grade = 2; 3rd grade = 3; 4th grade = 4; 5th grade = 5; 6th grade = 6; 7th grade = 7; 8th grade = 8; 9th grade = 9; 10th grade = 10; 11th grade = 11; 12th grade; High school graduate, GED or equivalent diploma = 12; Associate degree: occupational program, associate degree: academic program = 14; Bachelor’s degree = 16; Master’s degree, professional school and doctoral degree = 18), and family income (parentally reported total dollar amount income over the past 12 months, recoded using the lowest reported amount within a range of earnings [except for 1, where the low end was $0, so $500 was subtracted from the high end] as follows: 1 = $4500, 2 = $5000, 3 = $12,000, 4 = $16,000, 5 = $25,000, 6 = $35,000, 7 = $50,000, 8 = $75,000, 9 = $100,000, and 10 = $200,000). A general SES dimension was extracted from among these items using unit-weighted estimation. All variables along with their element names and associated factor loadings (ranging from .534 to .757) are listed in Table 3. CCs revealed virtual identicality in factor structures across sexes and all three SIRE groups (average CC = .996).
Unit-weighted factor loadings of six SES indicators. All λ values are statistically significant

Discrimination
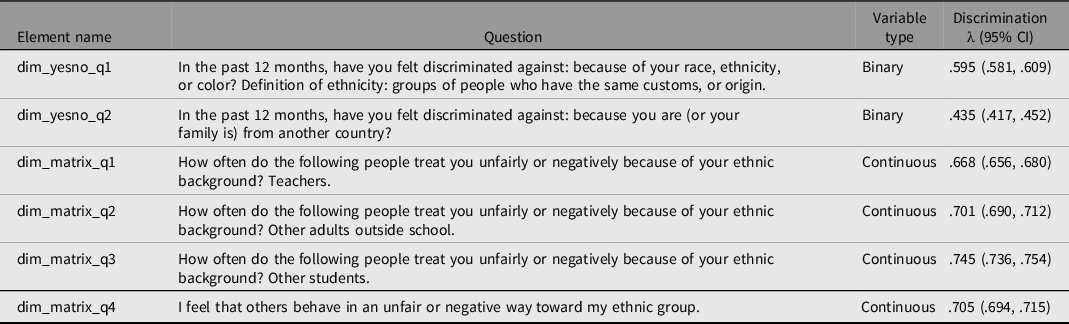
ABCD administered a variety of items at the year 1 follow-up mark to determine participant self-reported experience of various forms of discrimination. Six of these items clearly tap some aspect of racial, ethnic, or national-origin discrimination. These are listed in Table 4 along with their variable codes, whether they are continuous (Likert) or binary. Also displayed are the results of unit-weighted estimation, coupled with the use of the mice package (van Buuren & Groothuis-Oudshoorn, Reference van Buuren and Groothuis-Oudshoorn2011) in R with a maximum of 50 iterations to account for missingness, which was used to extract a common discrimination dimension from among the six items (factor loadings ranged from .435 to .745). CCs revealed virtual identicality in factor structures across sexes and the three SIRE groups (average CC = .998).
Unit-weighted factor loadings of six discrimination indicators. All λ values are statistically significant
The discrimination variable was found to be strongly positively skewed, with large numbers of individuals having reported no experience of discrimination (skewness = 3.390). As gene-by-environment interaction effects involving continuous measures are (partially) scale dependent, meaning that they can result from nonnormality and can be attenuated once appropriate transformations are made to the data (Martin, Reference Martin, Spector, Sneider and MacGregor2000), the discrimination measure was double log-transformed, which reduced its skewness to 1.815 (bringing it into the −2 to +2 range considered generally acceptable; e.g., George & Mallery, Reference George and Mallery2010). The SES factor was also examined for problematic skewness, but none was found (skewness = −1.034).
In order to determine whether discrimination was functioning as expected, means of (double log-transformed) discrimination along with standard errors and (multiple-comparison-corrected) significances of the differences among the means were estimated for all SIRE groups. These are presented in Table 5.
Self-reported double log discrimination means disaggregated by SIRE group. Bonferroni-adjusted multiple comparisons examining the difference between SIRE groups
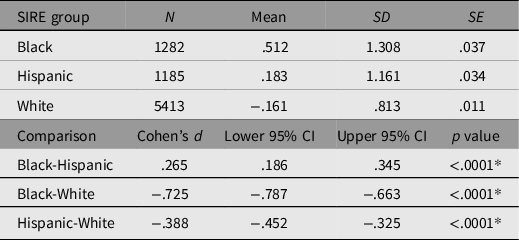
Note: *Bonferroni adjusted p = .0166.
As anticipated, discrimination means varied significantly between SIRE groups, such that Black participants reported experiencing discrimination to a significantly greater degree than did Hispanic participants, who in turn reported experiencing significantly greater discrimination than White participants.
Measurement model
General linear model
In the current analysis, GCA is used as the dependent variable. All GLMs were conducted in UniMult 2 (for documentation on an earlier version of this software, see Gorsuch, Reference Gorsuch1991) with the Type-I sum of squares procedure, which uses hierarchical partitioning of variance to estimate the effects of independent variables based on their hypothesized sequence of impacts on the dependent variable. In order to accurately report standardized effect sizes using this GLM approach, semipartial regression coefficients are estimated. These are presented along with 95% CIs, F-ratio test statistics, and significance levels. Hierarchical (rather than simultaneous) estimation of effects in models containing interaction terms is theoretically reasonable, as relevant interaction terms should be shown to be independent of main effects in addition to confounding interaction terms, after the estimation of the former (Nelder, Reference Nelder1994; Rodriguez et al., Reference Rodriguez, Tobias and Wolfinger1995). Consistent with this, in population genetics, it is standard to partition phenotypic trait variance as follows: $\rm V_P = V_G + V_E + V_{GE}$
Where VP is the phenotypic trait variance, VG is the variance associated with all genetic influences, VE is the variance associated with all environmental influences, and VGE is the variance associated with gene-by-environment interactions (Singh & Singh, Reference Singh, Singh, Vonk and Shackelford2018).
In line with the above equation, the predictors of GCA are entered into the model as follows. First, the main effects of genetic confounds and influences are estimated in the following sequence: (1) the main effects of the 10 ancestral PCs, (2) the main effect of (residualised) PGSEDU. Then the main effects of environmental influences are estimated in the following sequence: (3) the main effect of SES, (4) the main effect of discrimination. Finally, the interactions between the various genetic and environmental factors are estimated in the following sequence: (5) the interactions between the ancestral PCs and PGSEDU, (6) the interactions between the ancestral PCs and SES, (7) the Scarr–Rowe effect, which is operationalised as the interaction between PGSEDU and SES, (8) the interactions between the ancestral PCs and discrimination, and finally (9) the discrimination × PGSEDU interaction. The model is run separately on the combined sample, and for each sex, in order to determine whether sex differences in the interactions of interest are present. The same analysis (usnig the combined sample) is conducted using height as the criterion variable and PGSHEIGHT instead of PGSEDU. This yielded three different GLM models in total. In all cases, only the main effects of the PGSs, SES, and discrimination, and the SES × PGS and discrimination × PGS interactions are reported. Effect sizes associated with ancestry and other interactions are not reported.
Finally, all variables were standardized prior to entry into the regression (see Woodley of Menie et al., Reference Woodley, Peñaherrera-Aguirre, Dunkel and Sarraf2021 for the use of the same approach to estimating the Scarr–Rowe effect using PGS data in the Health and Retirement Study).
CPEM
A second method is also used to test the robustness of the interactions of interest, specifically the Continuous Parameter Estimation Model (CPEM; Gorsuch, Reference Gorsuch2005). This method uses the dot-product of the participant’s standardized dependent and the independent variable to generate a continuous parameter estimate (CPE) of the covariance among these, which can then be correlated with another variable in order to examine potential moderation effects. The method has the advantage of utilizing fewer model degrees of freedom than the more conventional approach to estimating two-way interactions — as the interaction term (the CPE) can be directly regressed against its moderator, without the requirement for estimating main effects. The major disadvantage to using this method is that the resultant effect size will be confounded with unmodeled effects, thus CPEM effect sizes tend to be larger than those generated using two-way interaction models. This approach has been used (along with a two-way interaction model) to test for the presence of the Scarr–Rowe effect in an analysis employing data from the Wisconsin Longitudinal Study (Woodley of Menie et al., Reference Woodley, Pallesen and Sarraf2018). In this study, a CPE was generated via the dot-product of the participant’s standardized PGSEDU and their IQ scores. This was then regressed against a composite measure of their childhood socioeconomic conditions. The resultant effect size was positive, meaning that as childhood SES improved, the participant’s PGS covaried more strongly with their IQ scores — suggesting increased expressivity of the former onto the latter in response to improved SES. Here, CPEs will be constructed using the participant’s PGSEDU along with their GCA scores, yielding two separate effect sizes, one with SES as the criterion and another with discrimination as the criterion. If the latter effect is present, it is expected that the resultant effect size will be negative in sign — meaning that PGSEDU is less expressive on GCA when self-reported discrimination is high.
Behavior-genetic analyses
ABCD contains data on both monozygotic (MZ) and dizygotic (DZ) twins, along with full siblings (with ages for correction), covering all SIRE groups currently considered. These will be used to estimate the additive heritability (A) and shared (C) and nonshared (E) environmentality of self-reported discrimination. This is to test whether discrimination is a proxy measure for heritable phenotypic variation of some sort, which could occur for any number of possible reasons, or whether it is purely environmental. If discrimination is associated with some underlying phenotype (a major candidate being skin reflectance; Cooper, Reference Cooper2005; Rowe, Reference Rowe2005), which is the actual factor that discriminatory behavior targets, then it might be expected that participant experiences of discrimination will exhibit a heritability >0%, as it will reflect (by statistical association) the heritability of this underlying trait. In the case of skin color, there is evidence that heritability is very high. Paik et al. (Reference Paik, Kim, Son, Lee, Im, Yeon, Jo, Eun, Seo, Kwon and Kim2011), for example, found in one human population that a constitutive skin color measure exhibited an additive heritability (h 2) of .82. As a reference trait, the heritability of GCA will also be estimated. These analyses are conducted using the behavior genetics R packages lavaan 0.6–9 (Rosseel, Reference Rosseel2012) and pacman 5.1 (Rinker & Kurkiewicz, Reference Rinker and Kurkiewicz2017).
Co-moderation analysis
An additional analysis is conducted in order to determine whether and how the GCA loadings among cognitive ability subtests moderate the effect magnitudes of (any) Scarr–Rowe and discrimination × PGSEDU interactions on the cognitive ability measures. For this analysis, the GLM model is estimated using each cognitive ability subtest separately (yielding 11 potential Scarr–Rowe and discrimination × PGSEDU interactions). Unit-weighted estimation is then used to composite these effect-size vectors into a common factor along with the vectors of the subtest GCA loadings, White–Black–Hispanic performance differences (expressed as r-statistics with weighted averaging) for each subtest, PGSEDU-by-subtest associations, and subtest additivity (A), shared environmentality (C), and nonshared environmentality (E) components estimated using the twin (plus full siblings) subset (also rescaled as r-statistics). This configuration allows for a determination of whether or not gene-by-environment interactions might contribute to the differences posited by modern versions of Spearman’s hypothesis, which hold that the magnitude of the differences in ability means between SIRE groups is positively moderated by GCA Footnote 5 (Jensen, Reference Jensen1980, Reference Jensen1998; Spearman, Reference Spearman1927; see also the more contemporary work of Frisby & Beaujean, Reference Frisby and Beaujean2015; te Nijenhuis & van den Hoek, Reference te Nijenhuis and van den Hoek2016; te Nijenhuis et al., Reference te Nijenhuis, van den Hoek and Dragt2019).
The results of vector correlation analyses involving clustering among multiple correlated vectors have been offered as evidence for the so-called hereditarian hypothesis Footnote 6 on the basis that the magnitudes of the impacts of ‘genetic’ factors (such as inbreeding depression) on IQ battery subtests have been found to cluster along with the vectors of subtest GCA loadings and (specifically) White-Black mean performance differences, whereas the vectors of probably largely, possibly entirely, environmental effects, such as the Flynn effect (the secular increase in IQ test scores across decades), do not cluster with these effects (Rushton, Reference Rushton1999). In an item-level analysis of Raven’s Progressive Matrices ‘puzzles’, Rushton et al. (Reference Rushton, Bons, Vernon and Čvorović2007) observed that in comparisons involving multiple SIRE groups, the group difference magnitudes in performance across items were correlated (positively) with their heritabilities, but not with their environmentalities (after controlling for item reliability and pass-rate variance). This finding has been interpreted as offering additional evidence for the hereditarian hypothesis (see also discussion in Rushton & Jensen [Reference Rushton and Jensen2010] and Warne [Reference Warne2021]). The hereditarian interpretation of results such as these has been critiqued, however (Flynn, Reference Flynn1999; Nisbett, Reference Nisbett2009; Wicherts & Johnson, Reference Wicherts and Johnson2009, for discussion on the problem of factorial identification in the results of vector correlation analyses see Ashton & Lee, [Reference Ashton and Lee2005]).
Utilizing a similar subtest-level co-moderation approach to Rushton (Reference Rushton1999), and incorporating behavior-genetic variance components (A, C, and E), hereditarian predictions can be easily tested, as (on Rushton et al.’s [Reference Rushton, Bons, Vernon and Čvorović2007] assumptions) it would be expected that Scarr–Rowe and discrimination × PGSEDU interactions, because they are thought to represent environmental influences on gene expression, should be more pronounced on subtests that are less GCA loaded, less additively heritable, less strongly associated with PGSEDU (this essentially being a weaker measure of subtest heritability), and less predictive of SIRE group differences (these four vectors should exhibit strong, positive intercorrelations by contrast), and correspondingly more strongly associated with various forms of environmentality. Deviations from this pattern would be problematic for the hereditarian model, since, if found consistently, they would indicate failure of one of its key lines of supporting evidence (Warne, Reference Warne2021).
Results
PGSEDU GLMs
Table 6 presents the results of the three GLMs (involving PGSEDU; combined sample, males, and females) and the CPEM analyses.
General linear models predicting GCA using PGSEDU residuals, SES, double log-transformed discrimination, and the corresponding interactions on GCA after controlling for the influence of ancestral principal components and confounding interactions (corresponding effect sizes not shown). All variables are standardized prior to regression. Results are for the combined sample, males, and females. Also presented are the results of two CPEM analyses, one examining the Scarr–Rowe effect, and a second examining the discrimination × PGSEDU interaction
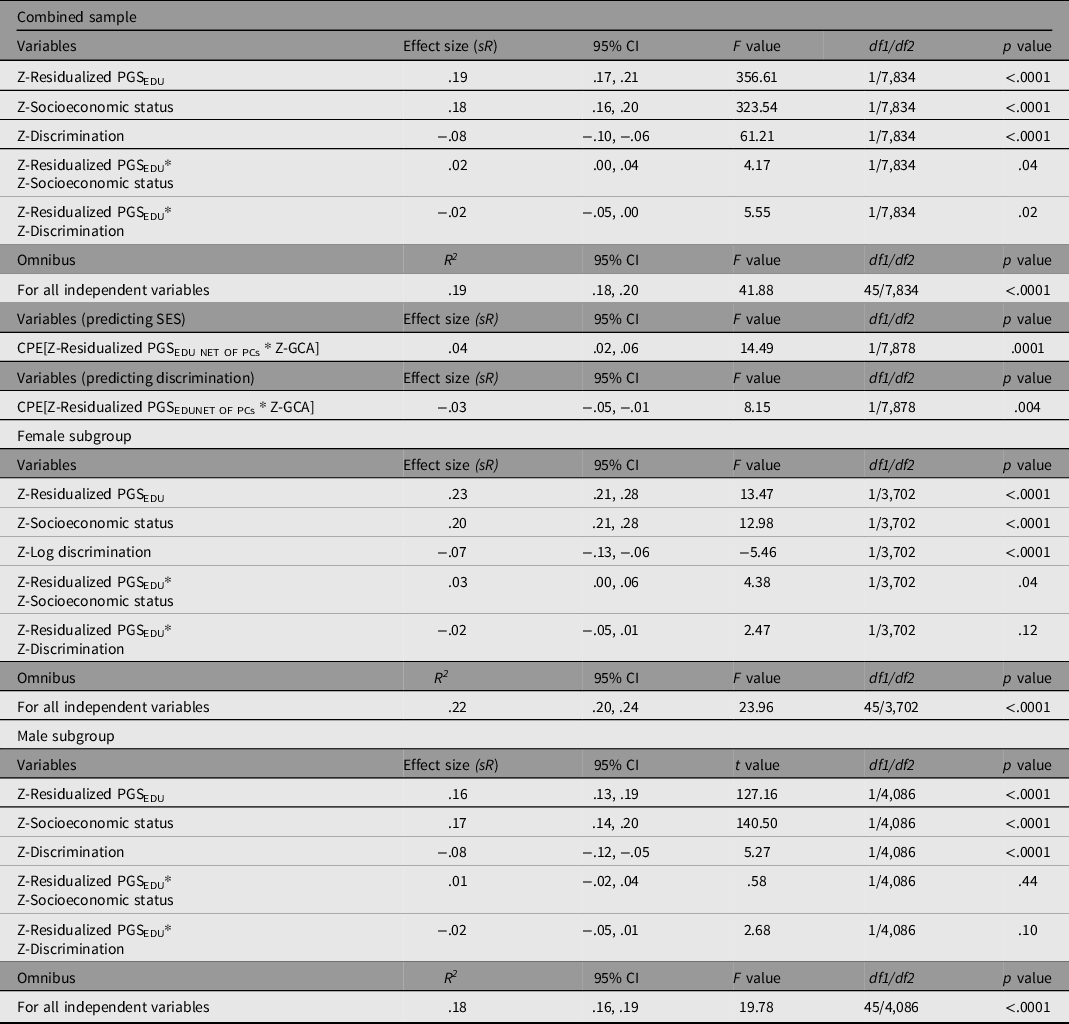
In the main analysis, the overall model fit (based on the Multiple R) is significant, with all independent variables accounting for 19% of the variance in GCA. PGSEDU was a significant predictor of GCA (independent of the PCs). SES and discrimination also had significant independent main effects on GCA in the theoretically anticipated directions. The model also revealed a significant Scarr–Rowe effect (specifically a positively signed interaction between PGSEDU and SES; graphed in Figure 1a). An independent, significant discrimination × PGSEDU interaction is also present in these data (graphed in Figure 1b).
(a). Regression plane plot visualising the interactions between PGSEDU and SES on GCA scores (the Scarr-Rowe effect) (b). Regression plane plot visualising the interactions between PGSEDU and discrimination on GCA scores (the discrimination×PGSEDU interaction).
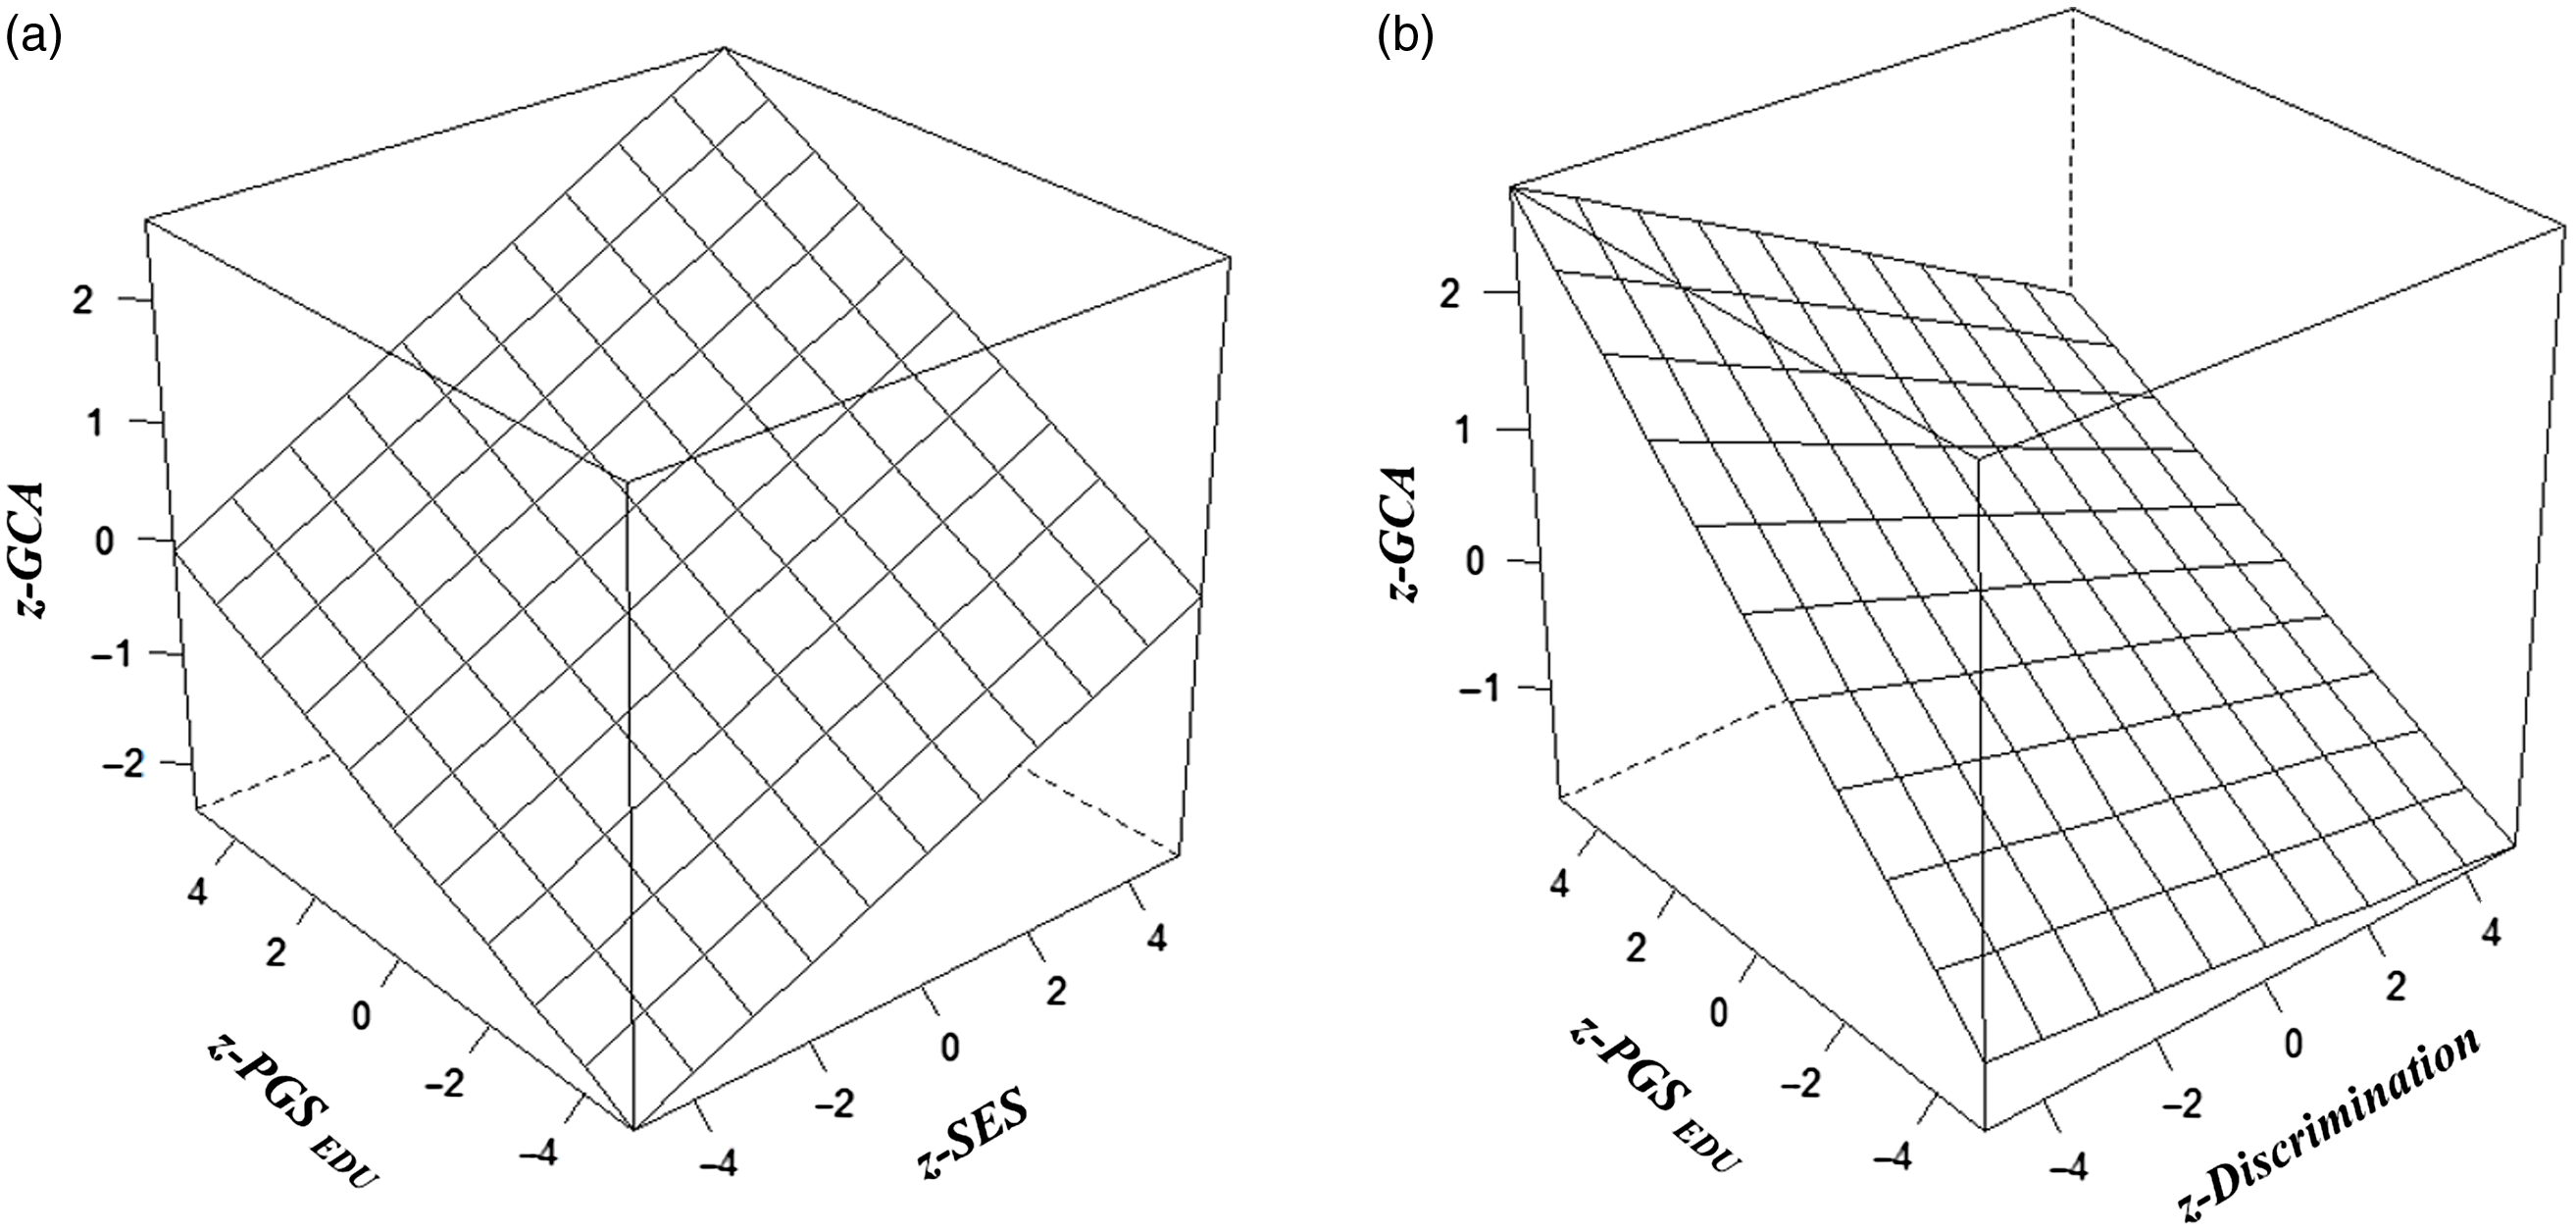
The CPEM analyses revealed (1) a significant Scarr–Rowe effect and (2) a significant discrimination × PGSEDU interaction (Table 6). In terms of the sex-disaggregated samples, the analysis revealed a significant Scarr–Rowe effect in the female subgroup but not in the male subgroup. The models did not detect discrimination×PGSEDU interactions in either the female or male subgroups (Table 6). There were no significant sex differences associated with either effect (Scarr–Rowe effect: z = .89, p = .3752; discrimination × PGSEDU interaction: z = .00, p = 1.000).
It should be noted that the effect sizes associated with the interaction terms are relatively small in magnitude (≤.10; Gignac & Szodorai, Reference Gignac and Szodorai2016), although this is anticipated given that gene-by-environment interactions are expected to be much smaller than main effects (McGue & Carey, Reference McGue, Carey, Tolan and Leventhal2017). Moreover, these estimates are very similar in terms of magnitude to those found in PGS-based studies of the Scarr–Rowe effect in other US samples, based on the use of both two-way interaction and CPEM modeling approaches (Woodley of Menie et al., Reference Woodley, Pallesen and Sarraf2018; Woodley of Menie et al., Reference Woodley, Peñaherrera-Aguirre, Dunkel and Sarraf2021), suggesting cross-study replicative consistency.
PGSHEIGHT GLM
The results of the GLM (involving PGSHEIGHT) are presented in Table 7.
General linear model evaluating the influence of PGSHEIGHT residuals, SES, double log-transformed discrimination, and the corresponding interactions on height controlling for ancestral principal components and confounding interactions (results not shown). All variables are standardised prior to regression
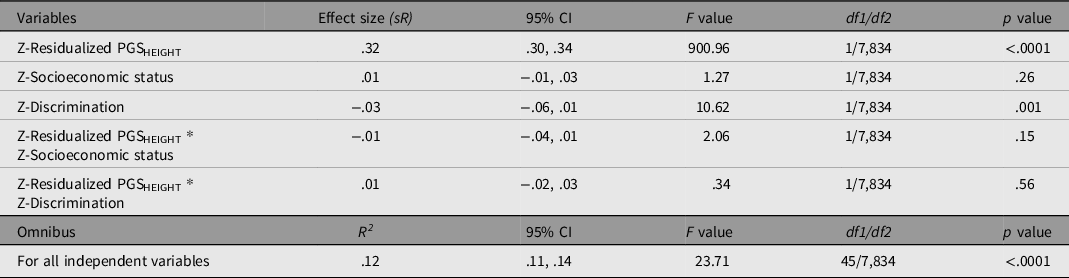
As with the previous models, the overall model fit (based on the Multiple R) is significant, with all independent variables accounting for 12% of the variance in height. PGSHEIGHT was a significant and positive predictor of height (independent of the PCs). Although there are no significant main effects of SES, discrimination had a relatively small magnitude negative effect on height. The model did not detect significant interactions between either PGSHEIGHT and SES, or between PGSHEIGHT and discrimination.
Heritability Analysis of Discrimination and GCA
The results of the heritability analyses of discrimination and GCA are presented in Table 8.
Variance component analyses estimating the proportion of additive genetic variance (A2), shared environmental variance (C2), and unshared environmental variance (E2) associated with discrimination and GCA along with 95% CIs

Note: *p < .05.
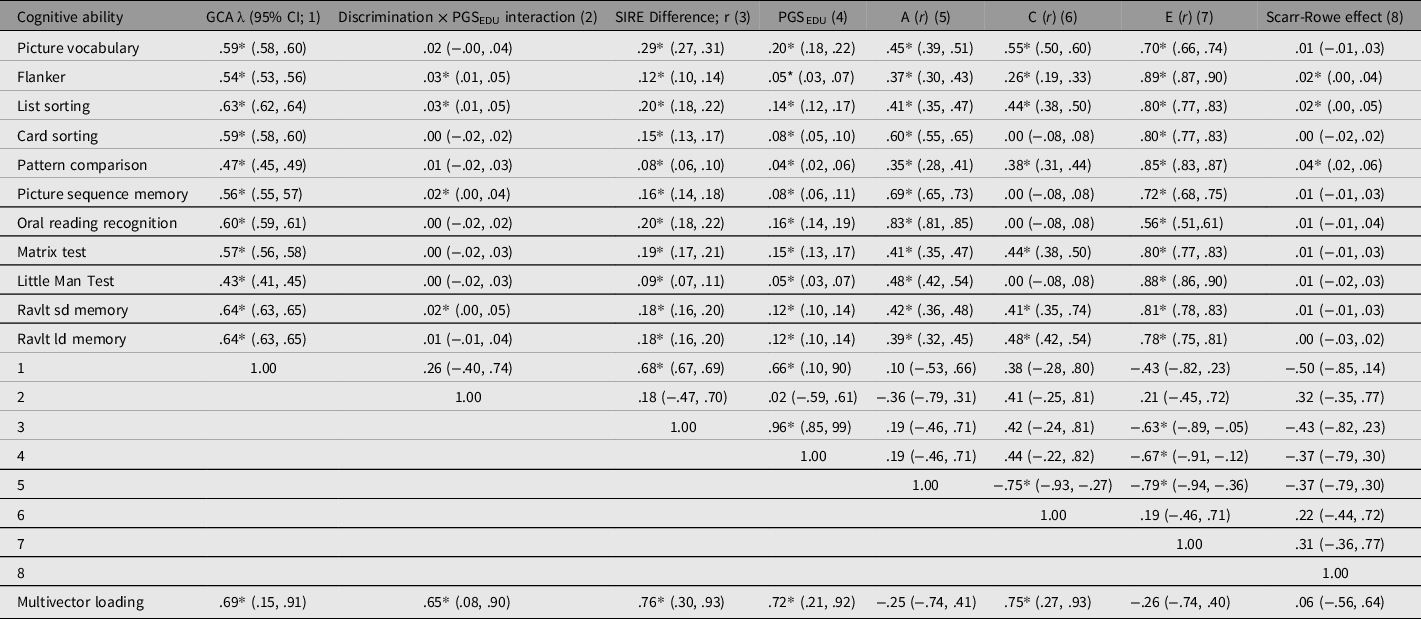
Loading of GCA on subtests along with (sign reversed) discrimination×PGSEDU interactions, (weighted) SIRE group difference in subtest score means (rescaled as r values), Scarr-Rowe effects, and A, C, and E variance components transformed as r values. The vector correlations among these are reported along with the results of the multivector co-moderation analysis
Note: A, Additivity; C, shared environmentality; E, nonshared environmentality.
*p ≤ .05,
The analyses indicate that GCA exhibits a (statistically significant) additive heritability of 49%. This is in line with previously reported heritability values for this trait in cohorts aged around 10 years (Bouchard, Reference Bouchard2013). There were also significant contributions stemming from shared and also nonshared environmentality (with the contribution of the latter being substantially greater, which is also consistent with the literature; Bouchard, Reference Bouchard2004). By contrast, discrimination exhibits no significant additive heritability, but is associated with significant shared and nonshared environmentality. This is inconsistent with theories positing that discrimination should proxy underlying phenotypes (such as skin reflectance or color, which, as was previously noted, appears to be very highly heritable), and indicates that participant experience of discrimination is purely a function of the action of both shared and (to a much greater degree) nonshared environmental factors.
Moderation Analysis
Table 9 lists the vectors of the subtest GCA loadings along with the discrimination × PGSEDU interaction vector (these were rescaled positively by multiplying each one by −1 in order to make the results of the vector correlation analyses more intuitive), the magnitude of the weighted averaged White-Black-Hispanic (SIRE) performance differences for each subtest, which were rescaled as r statistics in order to make them equivalent to the other effect sizes, the magnitude of the PGSEDU-by-subtest association, the Scarr–Rowe effect vector, and the vectors of additivity (A), shared environmentality (C), and nonshared environmentality (E) estimated for each subtest (also rescaled as r-statistics). The table also lists the correlations among these vectors, and the results of the unit-weighted co-moderation (multivector) analysis.
Consistent with extant meta-analytic work on the relevant SIRE group comparisons (te Nijenhuis & van den Hoek, Reference te Nijenhuis and van den Hoek2016; te Nijenhuis et al., Reference te Nijenhuis, van den Hoek and Dragt2019), the weighted (accounting for the dissimilar sample sizes) vector of the mean differences among the three SIRE groups was positively and significantly correlated with the vector of GCA factor loadings (r = .68), indicating that Spearman’s hypothesis holds in this cohort. There was a nonsignificant positive association between the vector of SIRE group differences and the subtest A vector (r = .19); by contrast, there was a strong, significant positive association between the vector of these differences and the PGSEDU-by-subtest association vector (r = .96). The latter vector correlated significantly and positively with the vector of GCA loadings (r = .66). The PGSEDU-by-subtest association vector is apparently only weakly (and nonsignificantly) proxying the A vector (r = .19). A significant negative association between the subtest E and the SIRE group differences vectors was also present (r = −.63). Unsurprisingly, both subtest C and E vectors were significantly negatively associated with the subtest A vector (r = −.75 and −.79, respectively). The E vector was also significantly negatively correlated with the PGSEDU-by-subtest association vector (r = −.67). The discrimination × PGSEDU and Scarr–Rowe interaction vectors were positively and negatively, but nonsignificantly, associated with the subtest GCA-loading vector (r = .26 and −.50, respectively).
The multivector unit-weighted factor loaded positively and significantly onto the GCA subtest loading vector (λ = .69), the discrimination × PGSEDU interaction vector (λ = .65), the SIRE group difference vector (λ = .76), the PGSEDU-by-subtest association vector (λ = .72), and the subtest C vector (λ = .75). In the case of the Scarr–Rowe effect vector, the loading was close to zero (λ = .06). Nonsignificant negative loadings were found in the case of the subtest A and E vectors (λ = −.25 and −.26, respectively). The multivector factor accounted for 34% of the variance across vectors.
Discussion
The presence of both the Scarr–Rowe and discrimination × PGSEDU interactions is evidenced using two methods, a GLM with a large number of controls and a more straightforward moderation analysis involving CPEM. In both cases, the former effect positively, and the latter negatively, predicts participant GCA, consistent with expectations that these sources of social adversity might contribute to reductions in the portability of PGSs for GCA in comparisons involving differentially socially advantaged groups.
The effects are found with the use of a PGSEDU, constructed using the PolyFun-Pred method, which attempts to increase the predictive validity of PGSs between different ancestral groups via incorporation of variants that have a higher probability of being causal. The fact that (in particular) a discrimination × PGSEDU interaction can be recovered despite these precautions reduces the likelihood that this result is purely a function of LD decay stemming from cross-ancestry comparisons involving different SIRE groups self-reporting different levels of discrimination, although the PGS still seems to have significantly lower portability as a predictor of GCA in the Black subsample compared to the White and Hispanic ones (Table 1). It seems likely that some of the difference in portability still stems from residual LD decay; however, it should also be kept in mind that this pattern of findings is very much in line with the expectation that reduced PGS portability between SIRE groups should be present owing to gene-by-environment interactions, even if hypothetically ‘perfect’ PGSs composed of only causal variants were to be used (Rabinowitz et al., Reference Rabinowitz, Kuo, Felder, Musci, Bettencourt, Benke, Sisto, Smail, Uhl, Maher, Kouzis and Ialongo2019). This interpretation is strengthened when considered in relation to PGSHEIGHT, which exhibits much greater between-SIRE group portability (Table 2), in addition to which interactions between SES, discrimination, and PGSHEIGHT are unambiguously absent when used to predict participant height (as is a main effect of SES; however, a relatively small main effect of discrimination is present in the theoretically expected direction). This suggests that among more socially neutral traits, such as height (relative to GCA), the forms of social adversity considered here have no (apparent) effects on PGSHEIGHT expressivity. By contrast, both low SES and high discrimination reduce PGSEDU expressivity on GCA. No sex differences were present for either interaction, but the subgroup analyses may have been underpowered to detect these.
The finding of the Scarr–Rowe effect in the current work is inconsistent with the outcome of one relatively recent study (Figlio et al., Reference Figlio, Freese, Karbownik and Roth2017), which failed to detect the effect using a very large sample of young (born in the 1990s and 2000s) US (specifically Floridian) twins and siblings. One possible reason for this discrepancy is that ABCD samples more broadly with respect to the US population than did the study of Figlio et al. (Reference Figlio, Freese, Karbownik and Roth2017), thus their findings may have been confounded by regional factors that do not generalize to the larger population of the US. Alternatively, as twin-based methods rely on phenotype-only resemblance among individuals of differing zygosity, there may be confounding phenotype-dependent effects in such models that can only be resolved with reference to direct measures of the relevant genotypes and their interactions. Figlio et al. (Reference Figlio, Freese, Karbownik and Roth2017) were unable to determine zygosity in their same-sex twin sample, Footnote 7 which further complicates interpretations of their results.
Interestingly, discrimination (unlike GCA) appears to show virtually no influence from additive genetic factors. This strongly militates against the idea that, for someone to report having experienced it, a heritable phenotypic locus of some sort is required in order to act as a basis for, for example, discriminative social sorting. The prime candidate for such a locus is skin reflectance or color (Cooper, Reference Cooper2005; Rowe, Reference Rowe2005). As there is evidence that this phenotype is very substantially heritable, where self-reported discrimination is strongly a function of skin color, some significant (association-based) heritability of self-reported discrimination would reasonably be expected. These findings indicate that discrimination acts primarily through shared and nonshared environmental factors. This means that cognitively impairing forms of discrimination are likely associated with the purely socially constructed aspects of SIRE (those that are wholly independent of heritable ancestry-related phenotypes such as skin reflectance or color). It has been found that ‘race’ as a concept may, to a substantial degree, be a byproduct of social coalitional categorization, the significance of which can be ‘erased’ once alternative social cues are presented that more accurately map onto relevant coalitional structure (Kurzban et al., Reference Kurzban, Tooby and Cosmides2001; for a meta-analysis of ‘erasing race’ effects, see Woodley of Menie et al., Reference Woodley, Heeney, Peñaherrera-Aguirre, Sarraf, Banner and Rindermann2020); thus, there is likely much about ‘race’ and related phenomena that exists purely in the psychological (and also sociological) realm and that is wholly divorced from outward markers of biogeographic ancestry. Elucidating the processes that go into the construction and persistence of such ‘social forces’ goes well beyond the current study. Footnote 8
It was found that a multivector composed of all vectors loads positively and significantly onto the discrimination × PGSEDU interaction vector, subtest GCA-loading vector, SIRE mean-differences vector, the PGSEDU-by-subtest association vector, and the subtest C vector. The exceptions were the subtest-level Scarr–Rowe effect and the subtest A and E vectors, on which the multivector loaded nonsignificantly in all cases (Table 9). This indicates that the discrimination × PGSEDU interaction is a potential contributing factor to the differences posited in modern versions of Spearman’s hypothesis. More broadly, these findings — in particular, the finding that the A vector is nonsignificantly negatively related, whereas the C vector is significantly positively related, to the multivector — runs contrary to the expectation of proponents of the hereditarian hypothesis, which predicts that vectors of strongly genetic factors and GCA loadings should cluster, and should be independent of vectors involving strongly environmental factors (e.g., Rushton, Reference Rushton1999; Warne, Reference Warne2021). The finding that the PGSEDU-by-subtest association vector is positively and significantly associated with the multivector might, by contrast, be taken to evidence the hereditarian hypothesis (on the basis that this counts as a ‘genetic effect’, as per Rushton, Reference Rushton1999); however, this interpretation is confounded by the aforesaid positive co-moderation effects associated with the discrimination × PGSEDU interaction and C vectors, both of which indicate environmental contributions. A plausible hypothesis is that where polygenic influences on subtest scores are generally higher, there is simply greater opportunity for (in particular) shared environmental factors to contribute via gene-by-environment interactions (involving discrimination) to group differences in GCA. It is notable in this regard also that the multivector actually loads negatively onto the A vector (which is the stronger measure of heritability). The finding that the A vector is a nonsignificant correlate of the SIRE differences vector further conflicts with the results of other studies that have used this parameter in vector correlation analyses to support the hereditarian position (Rushton et al., Reference Rushton, Bons, Vernon and Čvorović2007). On this basis, Rushton’s (Reference Rushton1999) argument may not hold true, and therefore, should be treated more cautiously.
It should also be noted that the Scarr–Rowe effect is apparently not contributing to SIRE group differences, as this vector is nonsignificantly (and negatively) correlated with the vectors of both GCA loadings and SIRE group differences. This finding reinforces the argument that the term ‘Scarr-Rowe effect’ (and related terms) should be used exclusively to describe influences on GCA stemming from the action of purely SES-related social factors that are not intrinsically coupled with SIRE and associated phenomena (such as the differences posited in modern versions of Spearman’s hypothesis and racial/ethnic discrimination; Giangrande & Turkheimer, Reference Giangrande and Turkheimer2021). The possibility that the Scarr–Rowe effect is not associated with cognitive performance at the level of GCA is furthermore consistent with a prediction of Woodley of Menie et al. (Reference Woodley, Pallesen and Sarraf2018), who noted that:
[I]f it is found that [GCA] loading negatively moderates ability measures’ sensitivity to the Scarr-Rowe effect, then the [GCA] loading of tests might be an important factor to control for in future meta-analyses. Moreover, it suggests that the Scarr-Rowe effect may help increase our understanding of the Flynn effect (which also occurs to the greatest extent on the least [GCA]-loaded abilities…), as reductions in the strength of the former effect may be a driver of the latter effect. (p. 500)
Critics of the current findings might object that the effect sizes of the interactions are relatively small (by the standards of findings in the psychological sciences); however, gene-by-environment interactions involving specific environmental measures are theoretically expected to be of relatively small magnitude when compared with main effects (McGue & Carey, Reference McGue, Carey, Tolan and Leventhal2017). Just as ‘[a] typical human behavioral trait is associated with very many genetic variants, each of which accounts for a very small percentage of the behavioral variability’ (the so-called fourth law of behavior genetics; Chabris et al., Reference Chabris, Lee, Cesarini, Benjamin and Laibson2015, p. 304), it may furthermore be the case that a typical human behavioral trait is also associated with very many gene-by-environment interactions, each of which accounts for a very small percentage of the behavioral variability (a possibility that McGue & Carey, Reference McGue, Carey, Tolan and Leventhal2017, p. 43 suggest). Moreover, the relatively small magnitudes of these effects may also in part be a function of the imperfect validity and reliability of the various constructs employed in these analyses, the effect of which would be expected to attenuate the associated effect sizes (see Schmidt & Hunter, Reference Schmidt and Hunter2015).
A final objection might be made on the grounds that the population assessed here is quite young and that the impact of the gene-by-environment interactions detected might be transient, eventually exhibiting the fadeout effect. This relates to the tendency for early-life environmental factors that raise (and presumably also those that lower) IQ to no longer exert these effects as individuals age. It has been hypothesized that this might reflect the action of the Wilson effect, the tendency for the additive heritability of IQ to increase over (much of) the life course (Bouchard, Reference Bouchard2013). While there are indications that the Scarr–Rowe effect ‘fades’ with age (Gottschling et al., Reference Gottschling, Hahn, Beam, Spinath, Carroll and Turkheimer2019), it does not appear to fade to zero. Possibly the most compelling evidence of this has been found in genetically informed studies employing cohorts that range from mid to late age in the Wisconsin Longitudinal and Health and Retirement Studies, where in both cases the Scarr–Rowe effect was detected specifically using various measures of participant childhood SES (Woodley of Menie et al., Reference Woodley, Pallesen and Sarraf2018, Woodley of Menie et al., Reference Woodley, Peñaherrera-Aguirre, Dunkel and Sarraf2021). On this basis, it might be reasonable to expect that the discrimination × PGSEDU interaction might not ‘fade out’ completely either, unless its apparently greater affinity for GCA makes it more sensitive to fading out than the Scarr–Rowe effect — continued longitudinal data collection on the ABCD cohort could help to resolve this uncertainty in the future. It might also be the case that the discrimination × PGSEDU interaction was generally stronger historically, as reductions in discrimination have been posited as a potential cause of (specifically) Black-White attainment gap closure on certain cognitive ability measures in the US (Rindermann & Thompson, Reference Rindermann and Thompson2013, p. 828).
In light of the theorizing of McGue and Carey (Reference McGue, Carey, Tolan and Leventhal2017) discussed above, it is possible that there are other as yet unknown gene-by-environment interactions that, together with the discrimination × PGSEDU interaction, could jointly substantially account for the SIRE group differences posited by modern versions of Spearman’s hypothesis, which would obviously provide a strong evidential basis for environmental as opposed to hereditarian accounts of Spearman’s hypothesis. A great deal of future research is required to adequately investigate this possibility. Footnote 9
Acknowledgments
All data were sourced from the Adolescent Brain Cognitive Development (ABCD) Study (https://abcdstudy.org), accessioned in the NIMH Data Archive (NDA). ABCD is supported by the National Institutes of Health and federal partners under the following award numbers U01DA041048, U01DA050989, U01DA051016, U01DA041022, U01DA051018, U01DA051037, U01DA050987, U01DA041174, U01DA041106, U01DA041117, U01DA041028, U01DA041134, U01DA050988, U01DA051039, U01DA041156, U01DA041025, U01DA041120, U01DA051038, U01DA041148, U01DA041093, U01DA041089, U24DA041123 and U24DA041147.
The full list of supporters is available at https://abcdstudy.org/federal-partners.html.
Participating sites and study investigators are listed at https://abcdstudy.org/consortium_members/.
ABCD consortium investigators did not participate in the analysis or writing of this report. The ABCD data used in this paper were sourced from Version 3.01. Raw data are available at https://nda.nih.gov/edit_collection.html?id=2573, and instructions on how to access these data can be found at https://nda.nih.gov/training/modules/study.html. Additional support for this work came from supplements to U24DA041123 and U24DA041147, the National Science Foundation (NSF 2028680) and Children and Screens: Institute of Digital Media and Child Development Inc.
Conflict of Interest
The authors declare no conflict of interest.
Financial Support
The authors received no financial support.


