

 ) are significant in one dimension (μ is the rate of mutation or long-range dispersal). Thus, in a two-dimensional population, barriers to gene flow can be detected through their effect on the spatial pattern of genetic marker alleles.
1. Introduction
Natural populations are not distributed uniformly: even a continuous habitat will usually be subdivided by local reductions in density or dispersal. On a larger scale, a biological species may be split into a mosaic of geographic races, separated by narrow zones of hybridization. The flow of genes between these races will be impeded by the reduced fitness of hybrids, or by adaptation to different environments: even if an allele is not itself disadvantageous in the new population, it will be associated with alleles at selected loci, and so will tend to be eliminated with them (Barton & Bengtsson, Reference Barton and Bengtsson1986).
The effects of such barriers to gene flow are of interest from several points of view. Local adaptations tend to be swamped by dispersal from different environments: divergence may be made possible by barriers (Slatkin, Reference Slatkin1973; Nagylaki, Reference Nagylaki1976). Conversely, populations may persist in marginal habitats only if they are sustained by immigration, which directly increases population size (Pulliam, Reference Pulliam1988), and also introduces genetic variation. Geographic races often remain distinct, despite the continual exchange of genes across hybrid zones. Thus, although they are members of the same biological species, it is not clear to what extent they evolve independently. The chance that favourable alleles that become established in one race arose as mutations in the other will depend on barrier strength, as will the degree of neutral molecular differentiation.
The strength of a barrier to gene exchange, whether due to a physical obstacle or to genetic incompatibility, can be measured by a quantity B. This has the dimensions of distance, and can be thought of as the length of habitat which would pose the same obstacle to the steady flow of a neutral allele. The effect of the barrier on gene flow depends on the ratio between barrier strength and dispersal rate (B/σ, where σ2 is the variance in distance between parent and offspring); (B/σ)2 has the dimensions of time. A neutral allele will be delayed by ≈(B/σ)2 generations, whilst an allele with advantage s will only be delayed significantly if (B/σ)2 is much greater than the timescale characteristic of selection, 1/s (Barton & Bengtsson, Reference Barton and Bengtsson1986; Pialek & Barton, Reference Pialek and Barton1997).
The rate of gene exchange between populations can, in principle, be measured directly, from the movements of individuals, and from the fitness of them and their offspring. However, such measurements are laborious, even with the most suitable organisms. Barrier strength can also be measured indirectly, from the shape of clines at selected loci: a barrier will produce a sharp step in allele frequency, whose size is the product of barrier strength and the gradient in gene frequency (Δp=B(∂p/∂x)) (Nagylaki, Reference Nagylaki1976; Barton & Bengtsson, Reference Barton and Bengtsson1986). However, such clines will only be found at a limited number of loci: a more general method for measuring barrier strength would be to use the pattern of random fluctuations in the frequencies of polymorphic marker alleles that are inevitably generated by random drift. Such measurements could be based on variation detected by enzyme electrophoresis or by DNA sequencing; since the effect of drift and dispersal on additive polygenic characters is formally identical to that on allele frequencies, morphological traits might in principle also be used (Felsenstein, Reference Felsenstein1986).
The aim of this paper is to develop theoretical predictions for the effect of a local barrier on fluctuations produced by random sampling drift. The results give the covariance between allele frequencies at different spatial positions; however, these can be interpreted in terms of the distribution of pairwise coalescence times, or the pattern of identity by descent.
An absolute barrier to gene flow is equivalent to a range boundary. Wilkins (Reference Wilkins2004) reviews earlier work on the effects of such absolute boundaries in allele frequencies in two-dimensional populations, and shows how this is related to the distribution of coalescence times. Nagylaki (Reference Nagylaki1988) and Nagylaki & Barcilon (Reference Nagylaki and Barcilon1988) have modelled the effects of a partial barrier on geographic patterns in a linear, one-dimensional population. However, most natural populations are distributed over two spatial dimensions; the effects of drift are then qualitatively different. In one dimension, drift produces smooth fluctuations, so that allele frequencies at points a few dispersal distances apart are strongly correlated. In two dimensions, however, frequencies can differ substantially even over short distances (Wright, Reference Wright1943; Malecot, Reference Malecot1948; Kimura & Weiss, Reference Kimura and Weiss1964).
Previous analyses of the effects of barriers to gene flow have assumed that individuals move along a line, in a one-dimensional habitat. However, the effects of random drift are qualitatively different when individuals can move in two dimensions, as is more usual in nature. In this paper, I extend previous results to the two-dimensional case, and show that because fluctuations are localized, barriers have effects which can be detected more readily than in a linear habitat. The existence of local fluctuations in two dimensions complicates the mathematical formulation, since the diffusion approximation breaks down over small scales (Nagylaki, Reference Nagylaki1978; Barton et al., Reference Barton, Depaulis and Etheridge2002). In the first part of the paper, I ignore this difficulty, and derive analytic results which apply over all but the shortest scales. In the Appendix, I derive exact results for this discrete model, and show how these converge to the continuous diffusion approximation.
2. Summary of results for a one-dimensional population
Nagylaki (Reference Nagylaki1988, eq. 14) gives a differential equation for the effects of mutation, drift and dispersal on the probability of identity F(x, x′). This is the chance that two genes at positions x and x′ in a linear habitat are identical in state; it increases as a result of inbreeding, and decreases as a result of mutation to new alleles. This quantity can also be interpreted as the standardized covariance between fluctuations in allele frequency at x, x′ (i.e. E[(p(x)−![]() )(p (x′)−
)(p (x′)−![]() )]/
)]/![]() (1−
(1−![]() ), where E(p)=
), where E(p)=![]() is the expected allele frequency, assumed to be everywhere the same). Nagylaki's equation allows for smooth variations in dispersal and density; he also gives formulae for the effects of discontinuous changes in density or dispersal, and of local regions of reduced density or dispersal (i.e. of local barriers). This paper only considers the simple case where the density of diploid individuals (ρ) and the dispersal rate (σ2) are uniform everywhere apart from a barrier at x=0. Then, for non-zero x, x′:
is the expected allele frequency, assumed to be everywhere the same). Nagylaki's equation allows for smooth variations in dispersal and density; he also gives formulae for the effects of discontinuous changes in density or dispersal, and of local regions of reduced density or dispersal (i.e. of local barriers). This paper only considers the simple case where the density of diploid individuals (ρ) and the dispersal rate (σ2) are uniform everywhere apart from a barrier at x=0. Then, for non-zero x, x′:
The terms on the right represent dispersal, mutation and drift, respectively. σ2 is the variance in distance between parent and offspring, and μ is the rate of mutation to new alleles, assuming the infinite alleles model. The equation also describes the effects of long-distance migration at a rate μ from a population with frequency ![]() ; it approximates balancing selection towards an equilibrium at
; it approximates balancing selection towards an equilibrium at ![]() , provided that fluctuations are small enough that changes due to selection are roughly linear in p(Δp≈−μ(p−
, provided that fluctuations are small enough that changes due to selection are roughly linear in p(Δp≈−μ(p−![]() )). The Dirac delta function δ(x−x′) represents the generation of uncorrelated fluctuations by random drift, with variance inversely proportional to the density of genes, 1/2ρ.
)). The Dirac delta function δ(x−x′) represents the generation of uncorrelated fluctuations by random drift, with variance inversely proportional to the density of genes, 1/2ρ.
Equation (1a) describes changes in identity across a plane with axes x, x′ (Fig. 1a); this represents the relation between pairs of individuals that live in a linear, one-dimensional habitat. The third term, representing sampling drift, increases F on a ridge along the diagonal x=x′. As a consequence, F is continuous across this diagonal, but its gradient changes abruptly from +(1−F)/(4ρσ2) to −(1−F)/(4ρσ2). A barrier at zero introduces discontinuities in F along the axes x=0 and x′=0, representing the decrease in identity between genes that are separated by the barrier. Although the gradient of F is continuous across the barrier, F itself drops by B(∂F/∂x) at x=0, and by B(∂F/∂x′) at x′=0 (from eq. 54, Nagylaki, Reference Nagylaki1988). Formally, these conditions give
(a) The probability of identity, F(x, x′), against x, x′, for a population in a one-dimensional habitat. Values are calculated from equation (2). F is standardized relative to its value far from the barrier, ![]() , and distance is scaled relative to
, and distance is scaled relative to ![]() . The barrier strength is twice the characteristic scale
. The barrier strength is twice the characteristic scale ![]() . The height of the ridge along the diagonal (x=x′) represents the probability of identity of nearby genes; this is 50% greater near the barrier than far away, as can be seen from the increased height of the ridge towards the centre
. The height of the ridge along the diagonal (x=x′) represents the probability of identity of nearby genes; this is 50% greater near the barrier than far away, as can be seen from the increased height of the ridge towards the centre ![]() ; equation 2a). The probability of identity falls abruptly when the two genes are separated by the barrier; this is shown by the sharp drop in F across the axes x=0, x′=0. For this example, the probability of identity of two nearby genes, just separated by the barrier, is one-third that of two nearby genes on the same side
; equation 2a). The probability of identity falls abruptly when the two genes are separated by the barrier; this is shown by the sharp drop in F across the axes x=0, x′=0. For this example, the probability of identity of two nearby genes, just separated by the barrier, is one-third that of two nearby genes on the same side ![]() ; equation 2b). (b) The analogous graph for a two-dimensional population. Values are calculated from equation (5). F is now standardized relative to the dimensionless parameter 1/(4πρσ2); it is given for points opposite each other (that is, y=y′). In a two-dimensional population, the continuous approximation breaks down for nearby genes; the value near the diagonal (x=x′, y=y′) is calculated with the aid of exact results for the stepping stone model, with m=0·4, μ=5×10⁻⁴.
; equation 2b). (b) The analogous graph for a two-dimensional population. Values are calculated from equation (5). F is now standardized relative to the dimensionless parameter 1/(4πρσ2); it is given for points opposite each other (that is, y=y′). In a two-dimensional population, the continuous approximation breaks down for nearby genes; the value near the diagonal (x=x′, y=y′) is calculated with the aid of exact results for the stepping stone model, with m=0·4, μ=5×10⁻⁴.

Nagylaki & Barcilon (Reference Nagylaki and Barcilon1988) give equilibrium solutions to this equation for the case of an impenetrable barrier. The exact solution for arbitrary B is a complicated integral (Nagylaki & Barcilon, Reference Nagylaki and Barcilon1988, eqs. 4.1, 4.4). However, when density and dispersal are large enough that fluctuations are small (![]() ), the term (1−F) in (1a) can be approximated to 1, and the equation can be solved explicitly:
), the term (1−F) in (1a) can be approximated to 1, and the equation can be solved explicitly:
For x, x′ on the same side of the barrier (x<0, x′<0 or x>0, x′>0):
For x, x′ on different sides of the barrier (x<0, x′>0 or x>0, x′<0):
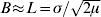
Here, ![]() is the characteristic scale, which is determined by the balance between mutation and dispersal (Slatkin, Reference Slatkin1973). When mutation is rare (μ<<1), then L>>σ. This separation between the characteristic scale, L, and the scale of local dispersal, σ, plays a central role in the analysis.
is the characteristic scale, which is determined by the balance between mutation and dispersal (Slatkin, Reference Slatkin1973). When mutation is rare (μ<<1), then L>>σ. This separation between the characteristic scale, L, and the scale of local dispersal, σ, plays a central role in the analysis.
3. The effect of a barrier in two dimensions
Nagylaki (Reference Nagylaki1988) derived his differential equation by writing a recurrence equation for F in a discrete stepping stone model, with deme size N and a rate of exchange m/2 between adjacent demes. (Nagylaki et al., Reference Nagylaki, Keenan and Dupont1993, and Ayatia et al., Reference Ayatia, Dupont and Nagylaki1999, deal directly with the diffusion limit). If the distance between demes is ε, then this corresponds to a continuous model with σ2=mε2, and density ρ=N/ε in one dimension, N/ε2 in two dimensions. In his one-dimensional model, Nagylaki (Reference Nagylaki1988) took the limit μ→0, N→∞, keeping m and ![]() fixed; this gives a continuous solution which applies over all scales. Unfortunately, this procedure fails in two dimensions. This is because the magnitude of random fluctuations then depends on the dimensionless parameter, neighbourhood size, which is the product of density and dispersal: Nb=4πρσ2=4πNm. If m is kept fixed, and N→∞, then Nb→∞, and fluctuations vanish. In contrast, fluctuations in one dimension depend on the dimensionless combination
fixed; this gives a continuous solution which applies over all scales. Unfortunately, this procedure fails in two dimensions. This is because the magnitude of random fluctuations then depends on the dimensionless parameter, neighbourhood size, which is the product of density and dispersal: Nb=4πρσ2=4πNm. If m is kept fixed, and N→∞, then Nb→∞, and fluctuations vanish. In contrast, fluctuations in one dimension depend on the dimensionless combination ![]() . This can remain of order one as N→∞, and μ→0 (see Fleming & Su, Reference Fleming and Su1974; Nagylaki, Reference Nagylaki1978; Barton et al., Reference Barton, Depaulis and Etheridge2002).
. This can remain of order one as N→∞, and μ→0 (see Fleming & Su, Reference Fleming and Su1974; Nagylaki, Reference Nagylaki1978; Barton et al., Reference Barton, Depaulis and Etheridge2002).
In this section, I ignore these difficulties, and use the obvious two-dimensional analogue of equation (1) to obtain an analytic expression for F, which applies in the limit where fluctuations are small (F<<1). The Appendix shows that though this expression diverges over small scales, it converges to the exact solution of the stepping stone model over scales larger than the deme spacing or dispersal range (ε, σ). Numerical results show that accurate predictions can be made by splicing together analytic results for small and large scales.
In a two-dimensional population, the probability of identity depends on the two coordinates of each of the two genes: F(x, y, x′, y′). The two-dimensional analogue of equation (1) is


The barrier is assumed to run along the line x=0; dispersal occurs at the same rate σ2 along the x- and y-axes. In the following, we only consider the case where the probability of identity between nearby genes is small (F(x, y, x, y)<<1), and so neglect the factor (1−F) in (3a).
Equation (3) can be solved by taking the Fourier transform along the y-axis. The method can be understood by thinking of the way fluctuations in allele frequency propagate across the barrier. Fluctuations which do not vary in the y direction will follow the one-dimensional solution given above. Fluctuations which vary sinusoidally in the y direction will propagate across the barrier, in the x direction, according to equation (1); however, as well as decaying at a rate μ as a result of mutation, they will also decay as a result of dispersal in the y direction. The net rate of decay will be (μ+σ2Y 2/2), where Y is the spatial frequency along the y-axis. Thus, the covariance of fluctuations with a given frequency can be found simply by modifying equation (2) to include the extra decay due to transverse dispersal. Random drift produces uncorrelated fluctuations, and so generates all frequencies with equal intensity: it produces ‘white noise’. Summing over frequencies gives the complete solution.
The Fourier transform of ∂2g/∂y 2 is −Y 2![]() . (The transform of g(y), denoted by
. (The transform of g(y), denoted by ![]() (Y), is defined in the Appendix). Applying the transform to equation (3a) with respect to y and y′, we have
(Y), is defined in the Appendix). Applying the transform to equation (3a) with respect to y and y′, we have
![\eqalign{{{\partial \tilde{F}} \over {\partial t}} \equals \tab {{\sigma ^{\setnum{2}} } \over 2}\left[ {{{\partial ^{\setnum{2}} \tilde{F}} \over {\partial x^{\setnum{2}} }} \plus {{\partial ^{\setnum{2}} \tilde{F}} \over {\partial x \prime^{\setnum{2}} }}} \right] \minus {{\sigma ^{\setnum{2}} } \over 2}\lpar Y^{\setnum{2}} \plus Y\prime^{\setnum{2}} \rpar \tilde{F} \minus 2\mu \tilde{F} \cr \tab\plus {{\delta \lpar x \minus x \prime\rpar \delta \lpar Y \plus Y\prime\rpar } \over {2\rho }}.}](https://static.cambridge.org/binary/version/id/urn:cambridge.org:id:binary:81559:20160714032943195-0100:S0016672307009081_eqn4.gif?pub-status=live)
This has the same form as equation (1), with 2μ being replaced by 2μ+(σ2/2)(Y 2+Y′2). The solution will be proportional to δ(Y+Y′), which ensures that F depends only the displacement along the y-axis, (y−y′), and that we need only consider Y=−Y′. The solution for ![]() is given by equation (2), with 2μ replaced by 2μ+σ2Y 2, and L replaced by
is given by equation (2), with 2μ replaced by 2μ+σ2Y 2, and L replaced by ![]() . Taking the inverse transform gives:
. Taking the inverse transform gives:
For x, x′ on the same side of the barrier (x<0, x′<0 or x>0, x′>0):

For x, x′ on different sides of the barrier (x<0, x′>0 or x>0, x′<0):

Though I can find no explicit form for these integrals, they can easily be calculated numerically.
In the case of two coincident genes (x=x′, y=y′), the contribution of high-frequency components only decreases with ![]() , so that the integral diverges logarithmically. Thus, in two spatial dimensions, most of the variation in allele frequencies is due to short-lived, local fluctuations. Since the continuous approximation does not describe the local structure of the population, it breaks down when the genes are very close together: F is in fact finite. The problem is to combine the local structure with the continuous approximation, so as to get predictions valid over all scales.
, so that the integral diverges logarithmically. Thus, in two spatial dimensions, most of the variation in allele frequencies is due to short-lived, local fluctuations. Since the continuous approximation does not describe the local structure of the population, it breaks down when the genes are very close together: F is in fact finite. The problem is to combine the local structure with the continuous approximation, so as to get predictions valid over all scales.
In the stepping stone model, with no barrier, F is given by an expression of the form

Since the population is confined to a discrete grid with spacing ε, fluctuations with frequency greater than π/ε do not contribute. High-frequency fluctuations are also damped by the term h(Y), which tends to 1 as Yε tends to zero (see Appendix). When the separation between the genes is large compared with the deme spacing (r>>ε), F* converges to the continuous approximation, given by equation (5a) with B=0. The probability of identity of nearby genes (and hence the standardized variance of allele frequency) depends on the local structure, and takes the form log (L/κ)/(4πρσ2) (Slatkin & Barton, Reference Slatkin and Barton1990; Barton et al., Reference Barton, Depaulis and Etheridge2002). Here, κ is a small distance, of the same order as the deme spacing, which summarizes the complications of local structure. In the stepping stone model, ![]() for small m, and decreases as m approaches its maximum of 1/2. An exact expression for κ can be derived from Kimura & Weiss (Reference Kimura and Weiss1964).
for small m, and decreases as m approaches its maximum of 1/2. An exact expression for κ can be derived from Kimura & Weiss (Reference Kimura and Weiss1964).
The model with a barrier converges to the same form for high frequencies, so that for genes on the same side of the barrier, F, can be calculated as:

This formula breaks down when the two genes are close together, and are close to the barrier. Then, the barrier influences local fluctuations. A barrier with strength B~L appears impenetrable to localized fluctuations, with a high spatial frequency Y>>1/L, and we have:

The function C[m] is calculated in the Appendix; it is π/2 for small m, ~−3 for m=0·4, and becomes large and negative as m approaches 1/2.
4. Results for two dimensions
The analytic results apply when dispersal and population density are high enough that F is small (F<<1). This is the case of most interest, since natural populations usually show low levels of spatial variation, at least for molecular markers (F ST≈0·1, say; Slatkin, Reference Slatkin1987; Rieseberg et al., Reference Rieseberg, Church and Morjan2003). (Higher values of F ST may be found in species-wide surveys, but such large-scale patterns are formed over very wide long times. Thus, it is doubtful that there is an equilibrium between drift, mutation and dispersal). I will therefore present the analytic results scaled relative to the dimensionless parameters ![]() in one dimension and Nb=4πρσ2 in two dimensions (Note that for a given neighbourhood size (proportional to ρσ, or
in one dimension and Nb=4πρσ2 in two dimensions (Note that for a given neighbourhood size (proportional to ρσ, or ![]() in one dimension, ρσ2 or Nm in two), random drift causes a much larger variance in allele frequencies in one dimension than in two, by a factor
in one dimension, ρσ2 or Nm in two), random drift causes a much larger variance in allele frequencies in one dimension than in two, by a factor ![]() . This is because fluctuations are dissipated less effectively by dispersal in one dimension than in two. However, throughout this paper results are scaled relative to the variance in the absence of the barrier, which is inversely proportional to
. This is because fluctuations are dissipated less effectively by dispersal in one dimension than in two. However, throughout this paper results are scaled relative to the variance in the absence of the barrier, which is inversely proportional to ![]() in one spatial dimension, and to 4πρσ2 in two).
in one spatial dimension, and to 4πρσ2 in two).
The overall form of the results is summarized in Fig. 1a and 1 b for one and two dimensions, respectively. Fig. 2 shows how the probability of identity between nearby genes (and hence the variance of allele frequency fluctuations) increases near a barrier (B=2L), where gene flow is less effective. The effect is much more pronounced and more localized in two dimensions than in one: for these parameters, identity increases by 50% near the barrier in both one and two dimensions, but this increase occurs much closer to the barrier in two dimensions than in one (compare upper curve and lower curves). In this and the following figures, the continuous approximation (curves) agrees closely with exact results for the stepping stone model (dots).
The probability of identity between two nearby genes as a function of distance, X=x/L, from a barrier of strength B=2L. The lower line gives results for one dimension, and the upper line for two dimensions. As before, F is scaled relative to the dimensionless parameter ![]() in one dimension, and to 1/(4πρσ2) in two dimensions; distance is scaled relative to
in one dimension, and to 1/(4πρσ2) in two dimensions; distance is scaled relative to ![]() . The dots show exact calculations from the stepping stone model, with m=0·4, μ=10−6, L=447.
. The dots show exact calculations from the stepping stone model, with m=0·4, μ=10−6, L=447.

Fig. 3 shows how barrier strength influences the probability of identity for two genes near the barrier, and either on the same side (upper curves) or on different sides (lower curves). Fig. 3a show that in one dimension, only barriers with strength comparable to the characteristic scale, ![]() , have a significant effect. In contrast, weak barriers have much more influence in two dimensions (Fig. 3b, left). In Fig. 3b, the upper curve shows the approximation of equation (7b) for the identity between nearby genes that are both at the barrier. This applies only for B~L; for weaker barriers, this approximation underestimates the effect of the barrier.
, have a significant effect. In contrast, weak barriers have much more influence in two dimensions (Fig. 3b, left). In Fig. 3b, the upper curve shows the approximation of equation (7b) for the identity between nearby genes that are both at the barrier. This applies only for B~L; for weaker barriers, this approximation underestimates the effect of the barrier.
The probability of identity between nearby genes on the same side of a barrier, and on different sides, as a function of scaled barrier strength, B/L Scaling is as in Figs 1, 2. (a) One-dimensional population. (b) Two-dimensional population. Dots show exact results for the stepping stone model with m=0·4, μ=10−6 and hence L=447.

We can understand the qualitative difference between one and two dimensions by developing simple analytical formulae for the probability of identity between nearby genes. First, consider one dimension. From equation (2):


A barrier much stronger than the characteristic scale (B>>L) will increase the probability of identity near the barrier by twofold (equation 8b).
In two dimensions, integration of equation (7a) gives:


When B<2L, arccos(2L/B) is replaced by arccosh (2L/B), and ![]() by
by ![]() . As in the one-dimensional case, the probability of identity approximately doubles near an impenetrable barrier: in the limit of large B, the second term in equation (9b) becomes negligible, and C[m] will be small relative to the first term when mutation rates are low and m is not close to 0·5. (Note that in two dimensions, m=0·5 implies that all individuals migrate in each generation – a pathological case.) However, much weaker barriers can cause a substantial increase. When mutation is weak, so that L>>κ, the first term in equation (9b) is much larger than the second, even for small B, and so F almost doubles. This can be understood by seeing it as a mixture of contributions from different spatial frequencies (Y). The effect of a barrier on the component with frequency Y depends on its strength relative to the ‘effective scale’,
. As in the one-dimensional case, the probability of identity approximately doubles near an impenetrable barrier: in the limit of large B, the second term in equation (9b) becomes negligible, and C[m] will be small relative to the first term when mutation rates are low and m is not close to 0·5. (Note that in two dimensions, m=0·5 implies that all individuals migrate in each generation – a pathological case.) However, much weaker barriers can cause a substantial increase. When mutation is weak, so that L>>κ, the first term in equation (9b) is much larger than the second, even for small B, and so F almost doubles. This can be understood by seeing it as a mixture of contributions from different spatial frequencies (Y). The effect of a barrier on the component with frequency Y depends on its strength relative to the ‘effective scale’, ![]() , which is small for high frequencies. Thus, even a weak barrier can prevent the propagation of high-frequency components. Since these dominate in two dimensions, barriers much weaker than the characteristic scale can have significant effects.
, which is small for high frequencies. Thus, even a weak barrier can prevent the propagation of high-frequency components. Since these dominate in two dimensions, barriers much weaker than the characteristic scale can have significant effects.
Fig. 4 shows the (scaled) probability of identity between a gene adjacent to the barrier, and a gene at x, in two dimensions; there is a barrier of strength B=2L at x=0. The upper curve is for points opposite each other (y=y′), and the lower curves are for displacements Δy=0·01L. 0·1L F falls away rapidly with distance, reflecting the dominant contribution of local fluctuations. As in Figs 2 and 3, there is good agreement with the stepping stone model.
(a) The probability of identity between a gene just next to the barrier, and a gene at X=x/l, for a barrier of strength 2L for two dimensions. The upper curve is for genes at the same transverse position (y=y′); the lower curves are for y′−y=0·01L, 0·1L. Scaling and simulation results are as in previous figures. (b) Detail for genes near the barrier. The upper curve shows the continuum approximation (equation 2a). This is accurate even for adjacent demes (upper dot, k=1), but diverges when the genes coincide (i.e. both next to the barrier; k=0).

The basic solution of equation (2) has the interesting property that the decrease in identity between genes on either side of the barrier is equal to the increase in identity between genes on the same side of the barrier, provided that |x′−x| equals |x+x′| in the two cases. This is reflected in the symmetry of the two curves in Fig. 3a and 3b. Another interesting symmetry is that the identity between two genes separated by a barrier is independent of where the barrier lies on the axis between them. In two dimensions, there is only a weak dependence on the angle of the barrier (Fig. 5).
The identity between two genes separated by a barrier is independent of the location of the barrier, and depends only weakly on the orientation of the barrier. The identity does not depend on where the barrier lies along the axis connecting the genes (i.e. in the vertical direction on (a). (b) In two dimensions, the identity increases somewhat with the angle of the barrier (θ in (a)); this is because when the barrier is close to one or other gene, local fluctuations are amplified. The barrier strength is B=2L; the three curves are for a separation 0·2L, 0·5L, L (top to bottom).

5. Discussion
This paper presents simple formulae for the effect of a barrier on random allele frequency fluctuations in one- and two-dimensional populations. A key result is that the effect of a barrier differs qualitatively between one and two dimensions. In one dimension, fluctuations are correlated over the characteristic scale, ![]() , and are only significantly affected by strong barriers (B≈L). In contrast, local fluctuations dominate spatial patterns in two dimensions and can be impeded by relatively weak barriers (B≈σ). This makes it possible to use spatial patterns of allele frequencies to detect weak barriers in two-dimensional populations. Moreover, because the effect of a barrier depends primarily on short-lived, localized fluctuations, inferences are more robust to historical effects and to weak selection than would be the case in a linear habitat.
, and are only significantly affected by strong barriers (B≈L). In contrast, local fluctuations dominate spatial patterns in two dimensions and can be impeded by relatively weak barriers (B≈σ). This makes it possible to use spatial patterns of allele frequencies to detect weak barriers in two-dimensional populations. Moreover, because the effect of a barrier depends primarily on short-lived, localized fluctuations, inferences are more robust to historical effects and to weak selection than would be the case in a linear habitat.
Since Wright (Reference Wright1931) first emphasized the importance of population structure in evolution, much effort has been expended in measurements of spatial patterns of genetic variation (Slatkin, Reference Slatkin1987). Quantitative analysis of such data has mainly consisted of calculation of some measure of allele frequency variation, such as F ST or Slatkin's (Reference Slatkin1985)p 0, the frequency of private alleles. This is then used to infer the number of migrants between demes (Nm), or equivalently, the, neighbourhood size in a continuous population (Nb=4πρσ2). However, spatial patterns contain much more information about population structure than this: in particular, the scale over which relationships decline (Wright, Reference Wright1943; Malecot, Reference Malecot1948; Epperson, Reference Epperson2003), and the change in relationship across a localized barrier to gene flow.
Barton & Gale (Reference Barton, Gale and Harrison1993, fig. 9) show how the pattern of allele frequencies across a chromosomal hybrid zone in the alpine grasshopper, Podisma pedestris, gives an estimate of its strength as a barrier, which agrees with independent estimates based on the chromosomal cline. A maximum-likelihood algorithm for estimating barrier strength is implemented within the package. Analyse (http://www.biology.ed.ac.uk/research/institutes/evolution/software/). Because a barrier mainly affects local fluctuations in two dimensions, its effect equilibrates rapidly. Therefore, allele frequency fluctuations should give a robust estimate of the rate of gene flow in the immediate past, which will not be sensitive to longer-term changes in population structure. This example shows that it is feasible to use readily collected data on molecular polymorphism to make quantitative estimates of the rate of gene flow across physical or genetic barriers. As a rough guide, samples that are large enough to comfortably detect significant variation in allele frequency (as measured by F ST) should also be able to detect the reduced correlation in allele frequency that is caused by a localized barrier. Since the focus is on recent ancestry, samples should be spread over a limited region, spanning the barrier and covering some tens of dispersal ranges.
This paper has followed the classical treatment of genetic variation in structured populations, by working in terms of the identity in allelic state. However, if this identity is regarded as a function of the mutation rate, then it gives a generating function for the distribution of pairwise coalescence times (Slatkin, Reference Slatkin1991; Barton & Wilson, Reference Barton, Wilson, Harvey, Brown and Smith1995). Charlesworth et al. (Reference Charlesworth, Charlesworth and Barton2003) and Wilkins (Reference Wilkins2004) use this relation to derive the long-term distribution of coalescence times from Maruyama's (Reference Maruyama1972) results. Wilkins (Reference Wilkins2004) gives analytical approximations for the distribution of coalescence times in finite two-dimensional populations, and shows how these relate to classical dimensional results on identity in state and allele frequency fluctuations. This paper treats an infinite population, in which the mean coalescence time is infinite. Therefore, it is not helpful to derive the moments of the distribution of coalescence time by differentiating the generating function near μ=0. It is, however, possible to find the distribution of coalescence times by numerically inverting the generating function.
It would be interesting to investigate the effects of barriers to gene flow on genealogical structure in more detail. However, it seems unlikely that genealogies at single loci (for example, mtDNA) would give much useful information. This is because in two dimensions, genealogical structure depends on the deep history of the population, and is in any case highly variable (Irwin, Reference Irwin2002; Wilkins, Reference Wilkins2004). In contrast, the effects of a localized barrier to gene flow in a two-dimensional population are mainly on recent ancestry, and so can best be detected from variations in the frequency of multiple marker alleles.
6. Appendix. Convergence of the discrete and continuous solutions
A continuous approximation for two dimensions was derived by splitting fluctuations into a spectrum of frequencies along the y-axis. Fluctuations of different frequencies are uncorrelated, and have a covariance ![]() (x, Y, x′, Y′) of the same form as the one-dimensional solution for F (equation 4). In this Appendix, I use the same method to derive the exact solution for F in a discrete stepping stone model, and show that it converges to the continuous approximation over all but very small scales.
(x, Y, x′, Y′) of the same form as the one-dimensional solution for F (equation 4). In this Appendix, I use the same method to derive the exact solution for F in a discrete stepping stone model, and show that it converges to the continuous approximation over all but very small scales.
I begin by deriving F in the absence of a barrier; this is an alternative derivation of the classical results of Malecot (Reference Malecot1948) and Kimura & Weiss (Reference Kimura and Weiss1964). First, consider a linear chain of demes, spaced ε apart. After migration and mutation, the probability of identity between demes j and j′ is

After random sampling of 2N genes, F must equal its original equilibrium value:
Subtracting F jj/2N from (A1b), and multiplying by (2N/(2N−1)) gives
The solution to these equations has the form
λ1, λ2 are the eigenvalues of the recurrence equation (A1a):


When μ<<1, ![]() . The coefficients A 1, A 2 are set by considering the equations for F (j+1)j and F jj. This leads to
. The coefficients A 1, A 2 are set by considering the equations for F (j+1)j and F jj. This leads to

As μ tends to zero F jj′ tends to ![]() , where
, where ![]() , and x is defined as jε. This tends to the continuous approximation of equation (2a) (with B=0) as N becomes large, and hence F jj small. (Then, the terms in λ2 decay more rapidly than those in λ1, and in any case,
, and x is defined as jε. This tends to the continuous approximation of equation (2a) (with B=0) as N becomes large, and hence F jj small. (Then, the terms in λ2 decay more rapidly than those in λ1, and in any case, ![]() . λ|j−j′| tends to exp(−|x−x′|/L), where
. λ|j−j′| tends to exp(−|x−x′|/L), where ![]() , and A 1 tends to
, and A 1 tends to ![]() ) These results are consistent with Kimura & Weiss (Reference Kimura and Weiss1964).
) These results are consistent with Kimura & Weiss (Reference Kimura and Weiss1964).
Now, consider the solution along the x-axis for fluctuations of frequency Y. In continuous space, the Fourier transform of a function g(y) is defined as

where Y is the spatial frequency along the y-axis. The definition of the discrete transform is the same, but with the integral ![]() being replaced by
being replaced by ![]() , and deme, k being at position y=kε.
, and deme, k being at position y=kε. ![]() (Y) is defined for −π/ε<Y<π/ε: a discrete grid cannot support high frequencies, with |Y|>π/ε.
(Y) is defined for −π/ε<Y<π/ε: a discrete grid cannot support high frequencies, with |Y|>π/ε.
The recursion for ![]() jj′(Y, Y′) is
jj′(Y, Y′) is

Since the solution must be proportional to δ(Y+Y′), Y′ is replaced by Y in (A6a). Equations (A6) have the same form as equation (A1): m is replaced by m/(1−2m sin2(εY/2)), and (1−μ) by (1−μ)(1−2m sin2(εY/2)). The exact solution to the two-dimensional case is therefore given by making these replacements in equations (A3), (A4), and taking the inverse Fourier transform. This leads to equation (7a).
As in the one-dimensional case, the Fourier transform given by these replacements converges to the continuous approximation (the integrand of (5) with B=0) as μ tends to zero, and N becomes large. However, for given μ, the exact and approximate transforms diverge at high frequencies: the discrepancy is of order 1/Yε for large Y. In two dimensions, these high frequencies do not affect F for genes separated by distances r>>ε, but do make a substantial contribution to F for nearby genes: for coincident genes, the continuous approximation diverges.
In the presence of a barrier, the one-dimensional solution takes a form analogous to equation (2). The barrier is between demes 0 and 1, and reduces gene flow by a factor γ. This is equivalent to a barrier of strength B=(1/γ−1)ε (Nagylaki, Reference Nagylaki1976). Because F jkjk now increases near the barrier, rather than being uniform, an explicit solution for small Nm and large F would be complex. (However, one could set bounds on the solution by using a uniform factor (1−F min) or (1−F max), F min and F max being the minimum and maximum of F jkjk.) For F<<1:
The terms |j+j′|−1 in (A7a) ensure that F 00=F 11. A 1 and A 2 have the same values as before, while D 1, D 2 are determined by the barrier:
Consider the limit where μ tends to zero and ![]() remains finite. Then, (1−λ1) tends to
remains finite. Then, (1−λ1) tends to ![]() , while (1−λ2) remains between 1 and 1·17 for m between 0 and 0·5 (equation A3). Then, terms involving λ2 become negligible relative to those involving λ1, and the solution converges to that of equation (2).
, while (1−λ2) remains between 1 and 1·17 for m between 0 and 0·5 (equation A3). Then, terms involving λ2 become negligible relative to those involving λ1, and the solution converges to that of equation (2).
The solution extends to two dimensions in the same way as in the uniform case. The solution for ![]() jj′(Y,Y′) is obtained by replacing m by m/(1−2m sin2(εY/2)), and (1−μ) by (1−μ)(1−2m sin2(εY/2)) in Eqs A3, A4, A7, A8. Over low frequencies (Y<<1/ε), 2m sin2(εY/2)≈mε2Y 2/2=μ(Y/L)2. Hence,
jj′(Y,Y′) is obtained by replacing m by m/(1−2m sin2(εY/2)), and (1−μ) by (1−μ)(1−2m sin2(εY/2)) in Eqs A3, A4, A7, A8. Over low frequencies (Y<<1/ε), 2m sin2(εY/2)≈mε2Y 2/2=μ(Y/L)2. Hence, ![]() converges to the continuous approximation given by the integrand of equation (5a) for Y<<1/ε. As Y approaches its upper limit of π/ε, the exact value of
converges to the continuous approximation given by the integrand of equation (5a) for Y<<1/ε. As Y approaches its upper limit of π/ε, the exact value of ![]() falls below the continuous approximation, ensuring that F jkjk remains finite.
falls below the continuous approximation, ensuring that F jkjk remains finite.
Finally, we must find the function, C[m], which describes the effects of fluctuations near a barrier of strength B~L. Recall that F* is the exact solution with no barrier. To justify equation (7b), we must show that the difference (F−2F*) converges to the continuous approximation over all scales with a suitable choice of the constant C. This is assured, since the Fourier transforms ![]() and
and ![]() * both decrease as 1/Y for large Y. We can therefore find some α such that (
* both decrease as 1/Y for large Y. We can therefore find some α such that (![]() −α
−α![]() *) decreases faster than 1/Y (in this case, as 1/Y 2), so that the high-frequency region makes a negligible contribution. This allows us to replace (F−αF*) by the continuous approximation, and calculate the residual effect of local population structure as a function C[m] that is independent of μ, B. Some tedious integration gives
*) decreases faster than 1/Y (in this case, as 1/Y 2), so that the high-frequency region makes a negligible contribution. This allows us to replace (F−αF*) by the continuous approximation, and calculate the residual effect of local population structure as a function C[m] that is independent of μ, B. Some tedious integration gives
![\eqalign{ C\lsqb m\rsqb \equals \tab {\pi \over 2} \plus {{Re}\nolimits} \left[ {{{2\lpar 1 \minus 2m\rpar } \over {1 \minus m}}\rmPi } \right.\left( {{m \over {1 \minus m}}\semi \arcsin \, \left( {{{1 \minus m} \over m}} \right)} \right.\semi \cr \tab \left. {\left. {{{m^{\setnum{2}} } \over {\lpar 1 \minus m\rpar ^{\setnum{2}} }}} \right) \minus {{3m} \over \sqrt {1 \minus 2m}}K\left( { \minus {{m^{\setnum{2}} } \over {1 \minus 2m}}} \right)} \right] \cr}](https://static.cambridge.org/binary/version/id/urn:cambridge.org:id:binary:44083:20160714032943195-0100:S0016672307009081_eqnA9.gif?pub-status=live)
where K, Π are elliptic integrals.
This work was supported by grants from the Science and Engineering Research Council, the Leverhulme Trust, the Natural Environment Research Council, and the Royal Society. This paper is dedicated to my colleague Deborah Charlesworth on her 65th birthday.


