


1. Introduction
Collaboration is crucial in modern design and management, evident in diverse contexts such as product design, innovation project management, and the co-creative engagement of various stakeholders (Reference FeastFeast, 2012; Reference Seguy, Noyes and ClermontSeguy et al., 2010). People expect to collaborate with others to generate novel ideas, solve complex problems, and make optimal decisions by integrating diverse knowledge and collective intelligence. In this context, behavior and affect analysis provides a valuable lens for examining collaborative dynamics and improving collaborative performance (Reference BarsadeBarsade, 2002; Reference Vinciarelli, Pantic and BourlardVinciarelli et al., 2009; Reference Paneth, Jeitziner, Rack, Opwis and ZahnPaneth et al., 2024). By analyzing the underlying behavior and affective states, researchers can gain a deeper insight into individuals’ experiences (Reference Feng, Yan, Zhao, Maldonado and GaševićFeng et al., 2024) and into the impact of social and environmental factors on collaboration (Reference Lin, He, Baruch and AshforthLin et al., 2017; Reference Small and AdlerSmall & Adler, 2019). These studies of user experience and impact mechanisms can then contribute to design practice for developing appropriate interventions that enhance collaboration and group dynamics (Reference Mathieu, Hollenbeck, van Knippenberg and IlgenMathieu et al., 2017; Reference Sanders and StappersSanders & Stappers, 2008).
Traditionally, researchers have examined collaboration through protocol studies, in which they observe and manually annotate participants’ behaviour, affect, speech, and interactions. Although effective, such methods are time-consuming and labour-intensive (Reference Brudy, Suwanwatcharachat, Zhang, Houben and MarquardtBrudy et al., 2018). Consequently, adopting AI-based methods for motion estimation and emotion recognition has received increasing attention. Despite their efficiency, most AI models in previous studies have relied solely on text-based or vision-based cues, lacking the multimodal reasoning necessary for a comprehensive understanding of context (Reference Nguyen, Bin, Xiao, Qu, Li, Wu, Nguyen, Ng, Luu, Ku, Martins and SrikumarNguyen et al., 2024). However, real-world activity is inherently multisensory and contextually complex, rather than confined to text- or vision-only environments. This mismatch may result in the loss of crucial context information, constraining nuanced observation and accurate interpretation (Reference Barrett, Adolphs, Marsella, Martinez and PollakBarrett et al., 2019; Reference Zellers, Bisk, Farhadi and ChoiZellers et al., 2019). Recent progress in vision-language models (VLMs) offers a promising automatic approach to address these challenges, as VLMs can jointly process visual and linguistic data to interpret behavior and affect with contextual awareness, reducing manual effort while improving analytical depth.
To this motivation, we integrate VLMs for analyzing collaboration, with a focus on detecting social behavior and group affect. This study aims to translate the VLM’s capabilities into a form that aligns with researchers’ needs for capturing how people collaborate and interact with the space, objects, and each other. Our research questions are as follows:
-
• RQ1: How can we integrate VLMs into design research workflows to capture and analyze human behavior and affect in collaborations?
-
• RQ2: How can this integration align with design researchers’ informational needs and data practices to support systematic observation?
-
• RQ3: What opportunities and limitations can emerge when applying the VLM-based analysis method in real-world design studies?
This research provides an automatic approach for design researchers to detect nuanced behaviors and emotions in people’s interactions. This task can be time-consuming and labour-intensive with traditional methods, such as protocol study and observation. Moreover, compared to text-based or computer vision-based analysis of behavior and emotion, the proposed VLM-based pipeline can facilitate not only efficient but also context-aware detection by integrating multimodal data. That can enable researchers to process larger datasets and identify interaction patterns that would be difficult to detect through manual viewing or single-modality analysis.
2. Related work
2.1. Traditional collaboration analysis and its limitations
Collaboration is a group activity in which multiple stakeholders participate in joint, interdependent tasks to achieve a shared goal (Reference FilipFilip, 2022). People’s postures, facial expressions, verbal cues, and interactions serve as key indicators of the group dynamics and collaboration quality (Reference Vinciarelli, Pantic and BourlardVinciarelli et al., 2009). Traditionally, researchers and designers have studied collaboration through protocol studies, which involve observing and annotating participants’ behavior, affect, and speech, captured in video or textual records (Reference BarronBarron, 2003; Reference Ryu and SandovalRyu & Sandoval, 2015). While widely used, protocol-based studies are time-consuming and labor-intensive, requiring researchers to repeatedly watch the video recording and observe the entire activity in fine detail (Reference Brudy, Suwanwatcharachat, Zhang, Houben and MarquardtBrudy et al., 2018). This intensive manual work can significantly limit both the scalability and depth of analysis (Reference Andrews-Todd and ForsythAndrews-Todd & Forsyth, 2020). Moreover, since protocol studies in design often rely on designers’ self-reports, they can inevitably introduce subjectivity and may overlook unanticipated findings (Reference Hay, Duffy, McTeague, Pidgeon, Vuletic and GrealyHay et al., 2017).
To address these challenges, researchers have increasingly turned to AI-based approaches to interpret social behaviours and emotions (Reference Luo, Ye, Adams, Li, Newman and WangLuo et al., 2020; Reference Ahmed, Bari and GavrilovaAhmed et al., 2020; Reference Canal, Müller, Matias, Scotton, De Sa Junior, Pozzebon and SobieranskiCanal et al., 2022; Reference Aruna Gladys and VetriselviAruna Gladys & Vetriselvi, 2023). For instance, text-based models such as BERT and GPT-2 have been used to classify social and cognitive processes in collaborative discourse (Reference Samadi, Jaquay, Lin, Tajik, Park and NixonSamadi et al., 2024). Moreover, vision-based models such as SAM2 and YOLO have enabled automated detection of movement, pose, interaction, and attention patterns in physical environments and design-related activities (Reference Liu, McTeague, Dreyer and ThoringLiu et al., 2025; Reference Shen, Li, Lou, Liu, Ji, Zhang and LiShen et al., 2025). These approaches offer significant advantages in automating analysis, processing large volumes of data, and providing a more objective perspective compared to manual observation. However, most existing studies rely on single-modality data, either textual or visual, resulting in a lack of a deep understanding of the nature of real-world collaboration, where behavior and affect are deeply intertwined with the surrounding environment and context.
2.2. State-of-the-art of vision-language models
VLMs are a class of multimodal AI models designed to jointly understand and associate visual and linguistic information (Reference Nguyen, Bin, Xiao, Qu, Li, Wu, Nguyen, Ng, Luu, Ku, Martins and SrikumarNguyen et al., 2024). Over the past five years, research on VLMs has expanded rapidly across a range of visual understanding tasks, driven by their advantages in zero-shot generalization, open-vocabulary transfer, and cross-task effectiveness (Reference Baltrusaitis, Ahuja and MorencyBaltrusaitis et al., 2019; Reference Zhang, Huang, Jin and LuZhang et al., 2024). These capabilities reduce the need for task-specific labelling, enable recognition of novel concepts defined through natural language, and allow a single pre-trained model to perform multiple tasks.
The development of VLMs has brought new opportunities for analyzing social interaction and group dynamics. For instance, Reference Chakraborty, Caplan and GoldwasserChakraborty et al. (2025) employed VLM to detect humans’ postures, interactions, and facial expressions, highlighting the VLM’s capability of social reasoning for activity understanding. Furthermore, many researchers have utilized VLM-based methods to recognize emotional and cognitive states within complex scenes and real-world collaborative activities (Reference Mou, Gunes and PatrasMou et al., 2019; Reference Teotia, Zhang, Mao and CambriaTeotia et al., 2024; Reference Xenos, Foteinopoulou, Ntinou, Patras and TzimiropoulosXenos et al., 2024). In summary, VLMs demonstrate great potential for zero-shot, context-sensitive, and cross-task analysis of interaction and collaboration by fusing multimodal cues through integrated reasoning.
3. Method
3.1. Study settings
Motivated by the findings above, we explored how to integrate VLMs to build an efficient and context-sensitive approach capable of detecting human behavior, affect, and interaction. We developed our research based on a real-world collaboration study. In this study, twenty-four participants with educational backgrounds in architecture design were divided into six groups of four. As illustrated in Figure 1, each group performed a decision-making task under three spatial conditions: 1) sitting with individual laptops, 2) sitting with a shared screen table, and 3) standing with a shared screen table. Each group experienced the spatial settings in a random order. In each setting, participants first reflected and organised their decisions individually, then engaged in a group discussion to refine and agree on a collective decision, and finally submitted a joint outcome.
Study settings

We collected video recordings of the collaboration process. The study received ethical approval from the relevant institutional review board, and all participants provided written informed consent. We analyzed the videos with the Qwen3-VL-235B, a state-of-the-art VLM that achieves leading performance on video understanding and multimodal reasoning benchmarks (Reference Yang, Li, Yang, Zhang, Hui, Zheng, Yu, Gao, Huang, Lv, Zheng, Liu, Zhou, Huang, Hu, Ge, Wei, Lin, Tang and QiuYang et al., 2025). We deployed the model in the Leibniz Supercomputing Centre (LRZ) infrastructure, which provides a secure, GDPR-compliant environment for data processing and storage. This measure ensured that participant privacy was protected and that all sensitive data remained under strict institutional control.
3.2. Pipeline
We developed a pipeline for utilizing VLMs to detect human behavior and affect (as illustrated in Figure 2). It comprises data processing, prompt development, VLM-based analysis, and data visualization.
At the data preparation stage, we first transferred audio tracks from the video recording into text. The transcribed text was then synchronised with the original videos as subtitles, providing the model with contextual information through verbal cues. Meanwhile, we overlaid the timestamps on the video to indicate temporal information. Secondly, we constructed a well-structured and sequential prompt that provides detailed descriptions of the background, task objectives, and key definitions, which ensure clear task guidance for the model.
Pipeline for integrating VLMs in behavior and affect analysis

During the data analysis stage, the VLM analyzed the processed video based on the instructions specified in the prompt and generated corresponding outputs. Sequentially, the resulting data were summarised and organised into a structured CSV file that contained interpretable records of detected events. Finally, we visualize the CSV data through an interactive chart, enabling intuitive exploration of behavioural and affective dynamics across the collaboration process. This pipeline integrates multimodal information in a systematic and interpretable manner. It provides a scalable, context-sensitive framework for analyzing complex human interactions and activities.
3.3. Prompt structure
To obtain targeted, consistent, and interpretable output, we developed our prompt structure following the strategy introduced by Reference Gu, Han, Chen, Beirami, He, Zhang, Liao, Qin, Tresp and TorrGu et al. (2023), which emphasizes decomposing complex tasks into hierarchical and semantically organized components. The proposed prompts comprise six functionally distinct components: Context, Task, Label, Condition Evaluation, Evidence, and Output Example (shown in Table 1).
Specification of the prompt structure

In the Context, we introduce relevant background information, such as an overview of the event and descriptions of participants and spatial settings, to define the overall context, features of presence, and analytical goals. In the Task, we decompose the tasks into coherent phases and provide detailed instructions for each stage. The Label defines the general categories and composition of the target affects and behaviors, such as emotions, posture, and interactions, to establish clear semantic boundaries for subsequent analysis. This component also contains specific affective and behavioral labels as examples, such as “critical,” “happy,” “speaking,” and “laughing.” The Condition Evaluation instructs the model to assess whether the given conditions are met and to determine the next steps accordingly. In the Evidence, we require the model to provide the arguments supporting its reasoning results to improve its interpretability. At last, the Output Example informs the model of the needed output information and its form schema, ensuring that the model’s responses are structured and aligned with the analytical objectives.
Unlike a single free-form instruction, the structured prompt integrates in-context information, sequential tasks, and output exemplars to guide the model through multimodal interpretation and reasoning. These features enhance the model’s ability to generate more accurate and consistent outputs.
4. Result
4.1. Interactive chart
Following the VLM-based analysis method, the results are exported as a structured CSV file and visualized through an interactive chart that supports data exploration and comparison. It enables the synchronized display of participants’ behavioral and affective states, along with their interpersonal interactions, providing a convenient and comprehensive overview of the data.
Figure 3 shows an overview of the interactive chart, illustrating the analysis results for a ten-minute video from our collaboration study. The Y-axis displays the participants and detected categories, while the X-axis represents time. The chart visualizes the temporal distribution of behavioral and affective elements across team members, with each team member represented by a distinct color. The arrows indicate the direction and target of social interactions. In this study, affect refers to the observable emotions and cognitive states, such as happy or confused. Behavior denotes concise, high-level labels that describe visible bodily actions, gestures, or interactions, such as speaking, listening, or pointing left. Interaction is defined as a behaviour directed towards a specific target (e.g., a person, screen, or object), specifying both the action and its recipient.
Overview of the interactive chart for a 10-minute collaboration session

To enable selective observation, we incorporated several interactive features into the visualisation interface. 1) The timeline navigator positioned below the time axis serves as a controller for zooming in and out, allowing for detailed observation in selected time intervals. 2) In addition, a filter panel located in the upper-right corner allows users to highlight the labels of interest for focused analysis. 3) When the mouse hovers over an element, a floating tooltip appears, displaying a brief description of the related event and conversations. The example shown in Figure 4 illustrates how these features can be used to analyze the frequency of shared laughter—when participants appeared amused—and to detect the events that elicited such responses.
Interactive features in the chart

Figure 4 Long description
The image contains a detailed timeline visualization with multiple panels and interactive features. Panel A: At the bottom, a timeline navigator spans from 05:40 to 06:20, showing a condensed overview of the timeline with color-coded segments representing different activities and affects. Panel B: Above the timeline navigator, four horizontal bars represent the behaviors and affects of four individuals (PersonA, PersonB, PersonC, and PersonD) over the same time period. Each bar is divided into segments labeled with specific behaviors and affects such as speaking, gesturing, amused, frustrated, and focused. The behaviors and affects are color-coded by individual: PersonA in blue, PersonB in orange, PersonC in green, and PersonD in red. Panel C: On the right side, a filter panel lists various affects and behaviors that can be highlighted or filtered. Panel D: A contextual tooltip appears in the middle of the image, providing detailed information about a specific segment of the timeline, explaining the context of the behaviors and affects of the individuals at that time. The tooltip describes PersonB continuing to smile and laugh as PersonC jokes about building a new spaceship, clearly enjoying the playful banter.
4.2. Evaluation
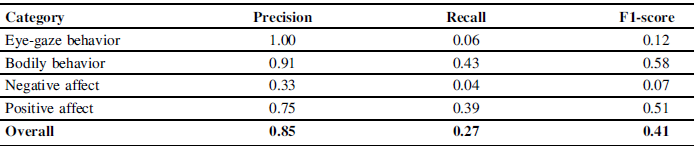
This section presents the evaluation of the semantic correctness of the model’s output by comparing it with human annotations. The researcher individually annotates observed behavioral and affective labels within a randomly selected three-minute segment from the full video, following the same guidance as the model. Meanwhile, he notes down the confidence (0.0-1.0) for each label. After that, we merge the annotated 18 kinds of behavioral labels into Eye-gaze and Bodily behavior, and 11 kinds of affective labels into Negative and Positive affect, to provide a clearer summary of the VLM’s performance (as shown in Table 2). We report the averaged precision (P.), recall (R.), and F1-scores (F1) over all labels, which reflect the performance of the VLM in each category. Precision measures the proportion of correctly identified labels among all labels produced by the model, reflecting the model’s semantic specificity. Recall quantifies the proportion of correctly detected labels by the model relative to all human researcher annotated labels by the researcher, representing the model’s semantic coverage.
Overall evaluation of VLM’s performance on 3-minute video segmentation

F1-score, defined as the harmonic mean of Precision and Recall, provides an overall indicator of the model’s performance (Equation 1). A higher F1-score reveals better performance of the model in behavior and affect recognition.

We also report the mean and standard deviation of the F1-score across four participants in the video, which reflects how consistently the VLM performs across individuals in the group. The results are illustrated in Figure 5.
Mean F1 of four participants and inter-participant variability across categories

5. Discussion
5.1. Insights from applying VLMs to study interaction
Integrating contextual information and multimodal cues can enable AI models to move beyond surface-level perception and achieve more context-aware results. For instance, from 02:39 to 02:44, Person A presented a smiling face with an uplifted mouth, which the model correctly interpreted as amusement in response to Person B’s joke:
“Person A laughs along with the group at PersonB’s joke about tying up rebels. Her body language is relaxed, and she clearly finds the humor in the comment.”
In contrast, from 03:12 to 03:22, Person A again displayed a smiling expression. However, the model inferred from the conversations that she feels confused rather than happy, and provides an appropriate description reflecting this distinction:
“Person A expresses a scientific doubt about jumping on the moon, asking if people would float away.”
Moreover, this study suggests that the structured prompt can lead to more coherent and consistent results, as it provides a hierarchical and semantically organized guidance for VLMs’ reasoning process. The reasoning and results of the VLM appear sensitive to the examples provided in the prompt, including label definitions and output exemplars. By modifying it, researchers can tailor the analysis focus to align with the research objectives. It highlighted the adaptability and generalizability of VLM-based methods across various studies. Meanwhile, it is worth noting that if the prompts are defined too narrowly or too broadly, they could limit the richness or specificity of the model’s output.
The developed interactive chart can help researchers examine behavioral and affective data more intuitively and conveniently. With temporal zooming and label filtering, the interactive chart enables researchers to gain both global insights into the data and local understandings of specific interest. It can serve as a navigation tool that allows researchers to identify segments of interest rather than watching entire recordings sequentially. Moreover, the synchronized visualization enables pattern discovery by displaying behavior and affect across multiple participants on the same timeline. This integrated view can enable design researchers to detect temporal dynamics and cross-participant patterns that would remain hidden through manual viewing alone. In this way, the visualization design translates the VLM’s capabilities into a form that aligns with researchers’ needs for systematic and scalable observation.
While this study focuses on assisting design researchers in analyzing people’s interactions in collaboration, the proposed pipeline has potential for broader application. For instance, designers who design for interactive experiences across people could use this behavioral and affective analysis approach for post-session reflection, identifying moments when user engagement dropped, who in the group dominated the discussion, or how spatial rearrangements can shift group dynamics. Educators analyzing collaborative learning activities could detect patterns of participation and affect across student groups, enabling more targeted pedagogical interventions. Moreover, educators analyzing collaborative learning activities could adopt the developed method to detect patterns of participation and affect across student groups. Furthermore, innovation managers could review and compare interaction patterns across project teams, using behavioral and affective insights to optimize team dynamics and collaboration processes. Across these applications, the pipeline can open new opportunities for converting hours of video into structured data that supports efficient, evidence-based analysis.
5.2. Performance of the VLM
In this section, we analyze the evaluation results and discuss the opportunities and limitations of VLM for detecting behavior and affect. Table 2 indicates that the adopted VLM achieves generally high precision across categories (overall P. = 0.85), but at the cost of low recall (overall R. = 0.27), resulting in a moderate overall F1-score of 0.41. In other words, when the VLM labels an event, it is usually correct, but it misses a large proportion of relevant events. This pattern is especially pronounced for eye-gaze and negative affect, leading to poor F1 despite non-trivial precision. By contrast, the model performs relatively better for bodily behavior and positive affect with a combination of high precision and substantially higher recall.
Together, these results suggest that the VLM can be more reliable for detecting bodily behavior and positive affect than for capturing gaze behavior or negative affect, and that its main limitation lies in under-detection rather than misclassification. This limitation can stem from the fact that the model can only export one label at a time, whereas human researchers can recognize multiple dominant labels simultaneously. Moreover, it remains challenging for the model to determine the dominant labels for a single event. In particular, gaze-related labels tend to be overlooked in favor of other behavioral labels.
As shown in Figure 5, the mean F1-scores can differ across participants for each category. It is worth noting that, despite its relatively high performance in bodily behavior, as indicated by a higher mean F1, the model’s performance varies considerably across participants. This challenge may arise from individual differences in the intensity and style of body expression. Participants with higher scores tend to show more frequent and larger body movements, whereas those with lower scores display fewer or very subtle movements that are difficult to detect. The confidence ratings of human researchers point in the same direction, as they report significantly higher confidence for some participants and significantly lower confidence for others, indicating that these subtle behavioral and affective cues are also challenging for humans to identify.
In summary, the VLM-based approach shows considerable potential for efficiently processing large volumes of video data and detecting a broad range of behaviors and affects. Compared to manual annotation, which requires repeated viewing of lengthy recordings, the VLM-based method can significantly reduce manual effort and analysis time, enabling researchers to identify patterns across larger datasets. However, its current limitations in recognizing eye gaze and negative affect, and potential omission of target events, handling individual differences, suggest that human verification remains crucial.
5.3. Limitations and future work
Several limitations should be acknowledged in this study. As VLMs are sensitive to the given prompts, always applying the same prompt structure across different studies may constrain the breadth and richness of the detected results. To address this, more diverse and modular prompt designs need to be developed—specifically tailored to design research contexts—to capture non-homogeneous outcomes and uncover unexpected insights. In addition, since the current detection results from VLM are based on a one-time model input, the scope for further inquiry was inherently limited. Future work could incorporate continuous conversations to facilitate a more detailed exploration of emerging patterns and interests.
Moving forward, we will refine the developed pipeline through several optimisation techniques, such as attention-based focus (Reference Meng, Zhao, Chang, Huang, Sun, Tung and SigalMeng et al., 2019) and bounding-box-based processes (Reference Hashmi, Pagani, Stricker and AfzalHashmi et al., 2023), to achieve more accurate and robust VLM-based analysis. Specifically, attention-based methods can direct the model toward regions of interest to improve detection of subtle cues such as eye-gaze, while bounding-box-based processes can enhance participant tracking in multi-person scenes. Moreover, building on our current work, we plan to develop a user-friendly analytical tool that leverages VLMs to detect human behavior, affect, and interaction patterns in design studies. This tool will feature adaptable prompt modules, flexible label filtering, multi-conversation support, and varied visualization options to make experience-focused research more efficient and informative. Users would be able to upload video recordings, select or customize prompt templates for their research context, and explore the analyzed results through interactive visualizations. We plan to make the tool open-source with a graphical interface, allowing users to connect with publicly available VLM services without requiring specialized technical infrastructure.
6. Conclusion
We developed a VLM-based pipeline to analyze the collaborative process. More specifically, it can help researchers automatically detect social behavior, group affect, and interactions, and synchronize these data in the interactive chart. The proposed pipeline integrates effective video processing methods, a fine-structured prompt template, and an interactive chart, providing a simplified workflow and intuitive visualization when using a VLM to detect behavior and affect in groups. This VLM-based analysis method opens new opportunities for evidence-based design and data-driven reflection, while also posing challenges related to the dataset bias and the opacity of model reasoning. This study highlights the potential of VLMs to reduce the manual work traditionally required in protocol-based studies and to offer a more context-sensitive and fine-grained approach for understanding human behavior and affect in groups. The efficiency of the VLM-based method enables researchers to extend their analysis to larger datasets, which can help them identify patterns, compare conditions, and generate insights that might remain hidden in smaller samples.
Acknowledgement
This work was funded by the German Federal Ministry of Research, Technology and Space (BMFTR) under the DATIpilot program, grant number 03DPS1279A. We gratefully acknowledge the scientific support and resources of the AI service infrastructure LRZ AI Systems provided by the Leibniz Supercomputing Centre (LRZ) of the Bavarian Academy of Sciences and Humanities (BAdW), funded by Bayerisches Staatsministerium für Wissenschaft und Kunst (StMWK).






 Open access

