


1. Introduction
Data-to-text generation, the process of converting structured data into readable human language, is a rapidly growing research area with significant applications in domains such as automated report generation and customer service (Gatt and Krahmer Reference Gatt and Krahmer2018). This complex transformation involves translating various data sources such as record databases, spreadsheets, and knowledge bases into natural language outputs (Gardent et al. Reference Gardent, Shimorina, Narayan and Perez-Beltrachini2017). For example, given two triples (Aarhus_Airport, cityServed, "Aarhus, Denmark”) and (Aarhus_Airport, runwayLength, 2,777 m), a data-to-text system should produce a sentence such as “Aarhus Airport, which serves the city of Aarhus in Denmark, has a runway that is 2,777 m long.”
The challenges in data-to-text generation include sophisticated context understanding, diverse data structure identification, and complex sentence construction. Developing a data-to-text generation model often requires training or fine-tuning with a substantial amount of data. Moreover, this process is further complicated by the need to train separate models for different input data formats and output sentence styles. Large Language Models (LLMs) (Brown et al. Reference Brown, Mann, Ryder, Subbiah, Kaplan, Dhariwal, Neelakantan, Shyam, Sastry and Askell2020; Raffel et al. Reference Raffel, Shazeer, Roberts, Lee, Narang, Matena, Zhou, Li and Liu2020) offer a solution to these challenges by effectively understanding both natural language and structured text, as well as generating coherent and fluent outputs (OpenAI 2023; Zhao et al. Reference Zhao, Zhang, Si, Nan, Tang and Cohan2023c).
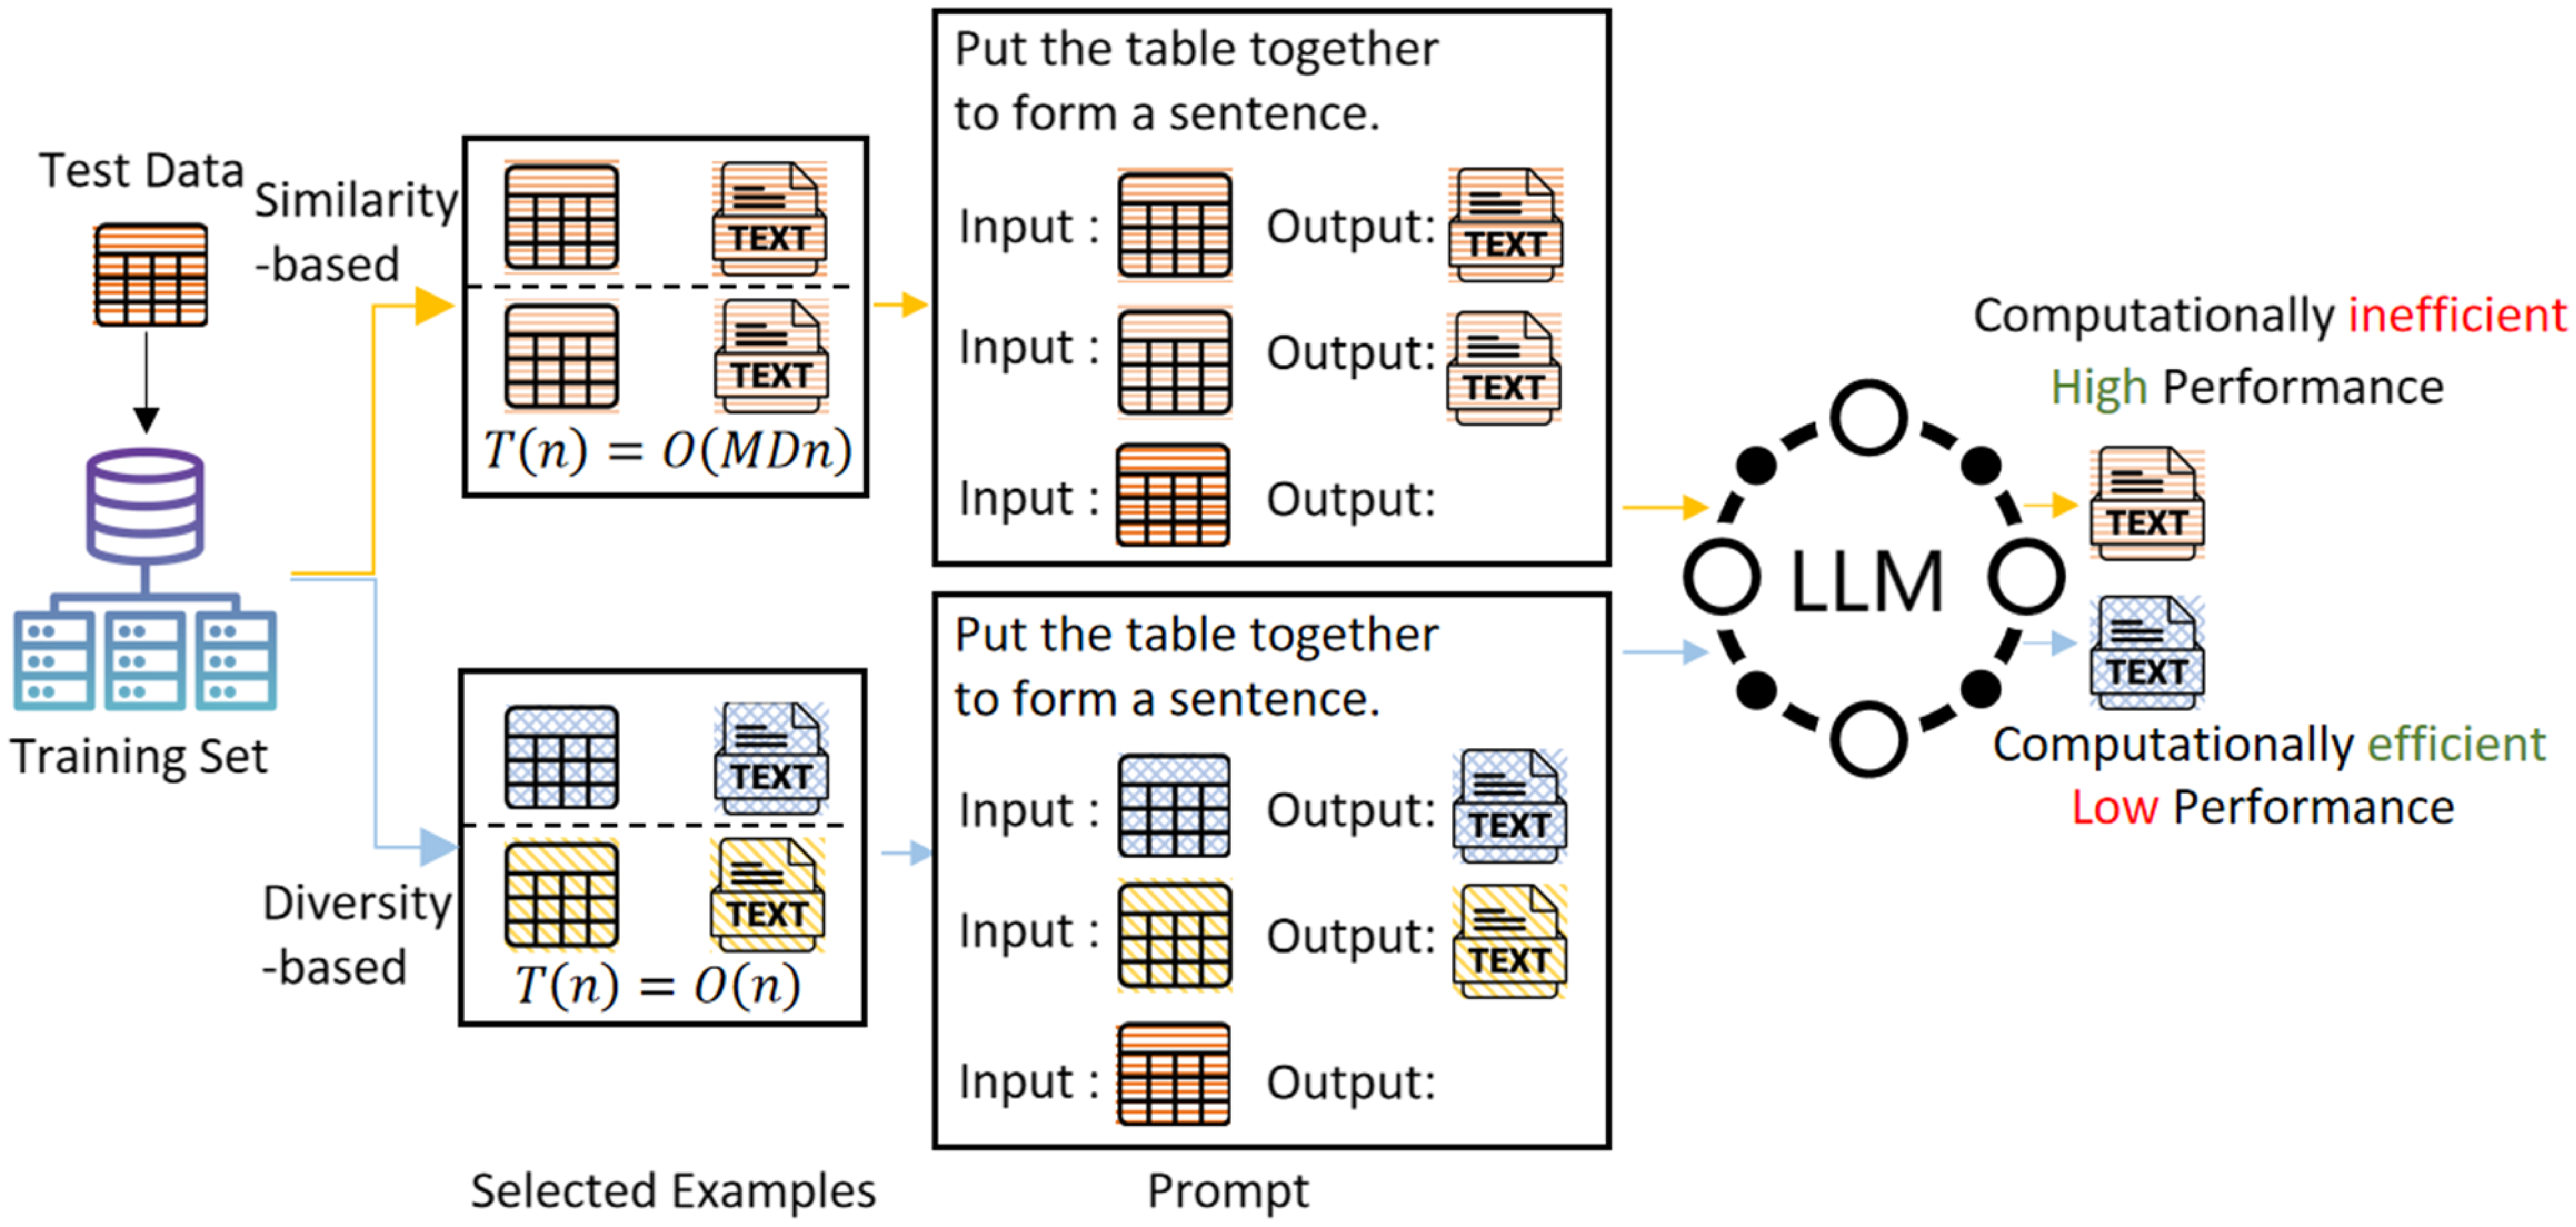
Flowchart of different in-context learning methods for data-to-text. Different colored icons represent the semantic representations of data/text. The similarity-based method chooses demonstrations that are more similar to the input data and achieves better output results, but it has higher time complexity (
 $M$
is the size of the training set,
$M$
is the size of the training set,
 $n$
is the size of the test set,
$n$
is the size of the test set,
 $D$
is the size of the representation vector). In contrast, the diversity-based method has lower time complexity but produces poorer output results.
$D$
is the size of the representation vector). In contrast, the diversity-based method has lower time complexity but produces poorer output results.
While some heuristic methods have been used to create prompts for data-to-text generation (Zhao et al. Reference Zhao, Zhang, Si, Nan, Tang and Cohan2023c), these methods can be time-consuming and labor-intensive. Therefore, automatic prompt generation is needed to guide LLMs in meeting specific text requirements. In-Context Learning (ICL) (Brown et al. Reference Brown, Mann, Ryder, Subbiah, Kaplan, Dhariwal, Neelakantan, Shyam, Sastry and Askell2020; Dong et al. Reference Dong, Li, Dai, Zheng, Ma, Li, Xia, Xu, Wu, Chang, Sun, Li and Sui2024) provides a simple yet effective approach by incorporating input–output demonstrations into the prompt, thereby enhancing generative performance.
Recent studies have shown that the selection, format, and order of in-context examples in the prompt can significantly affect the model’s output (Zhao et al. Reference Zhao, Wallace, Feng, Klein and Singh2021; Min et al. Reference Min, Lyu, Holtzman, Artetxe, Lewis, Hajishirzi and Zettlemoyer2022; Liu et al. Reference Liu, Shen, Zhang, Dolan, Carin and Chen2022b). Figure 1 illustrates how different choices of in-context examples influence the generation results of LLM.
Consequently, methods for prompt construction based on in-context example selection have emerged. These methods can be broadly categorized into unsupervised methods (Lu et al. Reference Lu, Bartolo, Moore, Riedel and Stenetorp2022; Su et al. Reference Su, Kasai, Wu, Shi, Wang, Xin, Zhang, Ostendorf, Zettlemoyer and Smith2022; Liu et al. Reference Liu, Shen, Zhang, Dolan, Carin and Chen2022b) and supervised methods (Rubin, Herzig, and Berant, Reference Rubin, Herzig and Berant2022). Supervised methods require fine-tuning the model for different tasks, which is not only costly but also impractical, especially when the model is accessed only via API calls. Unsupervised methods can be further divided into similarity-based (Liu et al. Reference Liu, Shen, Zhang, Dolan, Carin and Chen2022b) and diversity-based approaches (Zhang et al. Reference Zhang, Zhang, Li and Smola2022).
Similarity-based methods aim to select training samples most similar to the test input for use as in-context examples. This approach often yields favorable results in many cases. However, it requires comparing the test input with all candidate samples in the training set. As a result, it incurs high computational costs for large datasets.
In contrast, diversity-based methods aim to include as many diverse examples as possible to cover a broader range of potential input distributions. These methods typically cluster samples and select representative examples from each cluster, or design and apply heuristic strategies to choose diverse examples. Compared to similarity-based methods, diversity-based methods use the same set of in-context examples for different test inputs, which in turn improves computational efficiency. However, since the examples in the prompt are not closely related to the test input, the generated text may lack precision.
The generation results in data-to-text tasks can be significantly influenced by the structured data and reference texts in the in-context examples. If the characteristics of the in-context examples differ significantly from those of the test input, the generation results may degrade, particularly in smaller models or for tasks requiring high precision. Improving the efficiency of utilizing LLMs for data-to-text generation remains an important area of research, particularly for large-scale datasets, where balancing efficiency with the accuracy and consistency of generated results presents unique challenges. To address these challenges, we propose an efficient prompt generation method through in-context example selection: Double Clustering-based in-Context example Selection (DCCS), tailored for data-to-text tasks. The contributions of our research are as follows:
-
a) We propose a two-step in-context example selection method based on double clustering. In the preprocessing phase, we perform two clustering operations on the training dataset. The first clustering process ensures data similarity among the in-context examples, while the second clustering process ensures the diversity of the reference texts. In the inference phase, we simplify the in-context example selection process to a cluster selection process for efficiency.
-
b) We propose a batched generation method based on the DCCS approach, which groups similar samples from the first clustering into batched prompts based on the batch size and then utilizes a LLM for generation. This method effectively improves token utilization while ensuring the accuracy of the generated results.
-
c) We conducted experiments on four data-to-text datasets. The experimental results indicate that prompts constructed using our in-context example selection method achieved high accuracy across multiple LLMs. Additionally, our method significantly reduces the time and tokens needed for prompt generation in LLMs.
The subsequent sections provide a comprehensive discourse on our proposed methodology, the experimental setup, and the consequent findings. These sections elucidate the capacity of our DCCS approach to advance data-to-text generation.
2. Related work
2.1 Data-to-text generation
Data-to-text generation focuses on converting structured data into coherent textual descriptions. This task has garnered substantial attention due to its applications in sports commentary, biographical text generation, and open-domain table summarization. Commonly used datasets include WebNLG (Gardent et al. Reference Gardent, Shimorina, Narayan and Perez-Beltrachini2017) and DART (Nan et al. Reference Nan, Radev, Zhang, Rau, Sivaprasad, Hsieh, Tang, Vyas, Verma, Krishna, Liu, Irwanto, Pan, Rahman, Zaidi, Mutuma, Tarabar, Gupta, Yu, Tan, Lin, Xiong, Socher and Rajani2021), with additional studies addressing related challenges (Wen et al. Reference Wen, Gasic, Mrkšić, Su, Vandyke and Young2015; Lebret, Grangier, and Auli Reference Lebret, Grangier and Auli2016; Wiseman, Shieber, and Rush Reference Wiseman, Shieber and Rush2017). In addition to open-domain table summarization, converting tables into text and learning embeddings of tables have been shown to benefit open-domain question answering and information retrieval, for example, by enabling dense retrieval that embeds questions and tables in a shared vector space (Deng, Zhang, and Balog Reference Deng, Zhang and Balog2019; Herzig et al. Reference Herzig, Müller, Krichene and Eisenschlos2021).
Initial research on data-to-text generation predominantly involved template filling and rule-based approaches (Hallett, Power, and Scott Reference Hallett, Power and Scott2006; Turner et al. Reference Turner, Sripada, Reiter and Davy2008). While effective for narrowly defined, domain-specific tasks, these methods often struggled to produce diverse and natural outputs, limiting their broader applicability. Subsequent work shifted toward fine-tuning models such as T5 (Raffel et al. Reference Raffel, Shazeer, Roberts, Lee, Narang, Matena, Zhou, Li and Liu2020) and GPT-2 (Radford et al. Reference Radford, Wu, Child, Luan, Amodei and Sutskever2019) on task-specific datasets (Li and Liang Reference Li and Liang2021; Clive, Cao, and Rei Reference Clive, Cao and Rei2022). For instance, LOFT (Zhao et al. Reference Zhao, Qi, Nan, Flores and Radev2023a) employs logic forms as fact verifiers and content planners to enhance controllability, faithfulness, and diversity. PLOG (Liu et al. Reference Liu, Dong, Okazaki, Han and Zhang2022a) continuously pre-trains text generation models on a data-to-logic-form generation task to improve output fidelity. Despite their success, these methods typically require separate training for each new task. This approach is time-consuming, costly, and difficult to scale, especially in rapidly evolving fields where task requirements frequently change.
More recent research leverages the inherent capabilities of LLMS, such as employing chain-of-thought prompts (Zhao et al. Reference Zhao, Zhang, Si, Nan, Tang and Cohan2023b), which guide LLMs through step-by-step reasoning to enhance faithfulness and coherence in data-to-text tasks. However, such methods require complex prompt engineering and substantial prior knowledge, limiting their efficiency.
To address these limitations, an emerging paradigm is In-Context Learning (ICL). ICL enables LLMs to adapt to new tasks by including a few task-specific examples in the prompt, eliminating the need for fine-tuning. This approach offers a flexible and scalable solution for data-to-text generation and serves as the basis for our investigation.
2.2 In-context learning
With LLMs widely deployed across various tasks, their ability to learn from a few examples in the prompt has garnered substantial attention. ICL enhances the efficacy of these models without extensive fine-tuning (Brown et al. Reference Brown, Mann, Ryder, Subbiah, Kaplan, Dhariwal, Neelakantan, Shyam, Sastry and Askell2020; Wei et al. Reference Wei, Wang, Schuurmans, Bosma, ichter, Xia, Chi, Le, Zhou, Koyejo, Mohamed, Agarwal, Belgrave, Cho and Oh2022), enabling LLMs to perform diverse tasks, such as web browsing and coding (Nakano et al. Reference Nakano, Hilton, Balaji, Wu, Ouyang, Kim, Hesse, Jain, Kosaraju and Saunders2021; Chen et al. Reference Chen, Tworek, Jun, Yuan, Pinto, Kaplan, Edwards, Burda, Joseph and Brockman2021). The OpenICL framework provides a unified platform that simplifies ICL implementation (Wu et al. Reference Wu, Wang, Ye, Wu, Feng, Xu and Qiao2023b).
The effectiveness of ICL heavily relies on the selection and formatting of demonstrations (Zhao et al. Reference Zhao, Wallace, Feng, Klein and Singh2021; Min et al. Reference Min, Lyu, Holtzman, Artetxe, Lewis, Hajishirzi and Zettlemoyer2022; Liu et al. Reference Liu, Shen, Zhang, Dolan, Carin and Chen2022b), which has prompted the development of optimization strategies. These strategies can be broadly categorized into supervised and unsupervised methods (Dong et al. Reference Dong, Li, Dai, Zheng, Ma, Li, Xia, Xu, Wu, Chang, Sun, Li and Sui2024). Supervised methods train a scorer to select in-context examples using supervision signals (Rubin et al. Reference Rubin, Herzig and Berant2022; Li et al. Reference Li, Lv, Yan, Lin, Zhu, Ni, Xie, Wang and Qiu2023), leveraging feedback from language model inference to adaptively identify suitable demonstrations. CEIL (Ye et al. Reference Ye, Wu, Feng, Yu and Kong2023) and MoD (Wang et al. Reference Wang, Chen, Shi, Shen, Li, Globerson, Mackey, Belgrave, Fan, Paquet, Tomczak and Zhang2024) model the selection of the exemplar set and train one or multiple retrievers to score the exemplar set. While these methods often yield better performance, they are challenging to implement for black-box LLMs accessed via token-level APIs and can be computationally expensive.
In contrast, unsupervised methods rely on heuristics such as similarity-based, diversity-based, or entropy-based approaches (Lu et al. Reference Lu, Bartolo, Moore, Riedel and Stenetorp2022; Liu et al. Reference Liu, Shen, Zhang, Dolan, Carin and Chen2022b; Levy, Bogin, and Berant Reference Levy, Bogin and Berant2023) for demonstration selection. A straightforward approach is to choose the nearest neighbors of input instances based on their similarities, using metrics such as L2 distance or cosine similarity computed from sentence embeddings (Liu et al. Reference Liu, Shen, Zhang, Dolan, Carin and Chen2022b; Tanwar et al. Reference Tanwar, Dutta, Borthakur and Chakraborty2023; Qin et al. Reference Qin, Zhang, Chen, Dagar, Ye, Al-Onaizan, Bansal and Chen2024). Beyond distance metrics, other unsupervised approaches include mutual information (Sorensen et al. Reference Sorensen, Robinson, Rytting, Shaw, Rogers, Delorey, Khalil, Fulda and Wingate2022) and perplexity (Gonen et al. Reference Gonen, Iyer, Blevins, Smith, Zettlemoyer, Bouamor, Pino and Bali2023), which have shown promise for prompt selection without labeled data or task-specific LLMs. However, most of these methods are designed for general question-answering tasks and do not consider, in data-to-text generation, the differing impacts that in-context examples’ structured data and reference text components have on the model’s output quality.
In this work, we propose a novel unsupervised demonstration selection strategy that reduces reliance on heuristics while improving efficiency and reducing token overhead. Our approach retains the simplicity and broad applicability of unsupervised methods while achieving better performance for data-to-text tasks.
3. Methodology
In this section, we present our Double Clustering-based in-Context Example Selection (DCCS) methodology, aimed at rapidly selecting high-quality in-context examples to improve the efficiency of data-to-text tasks. Building on DCCS, we further propose the DCCS-Batch method, which enhances token utilization.
3.1 Definitions and problem formulation
Let the training set consist of
 $M$
samples denoted by
$M$
samples denoted by
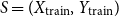 $S = (X_{\mathrm{train}}, Y_{\mathrm{train}})$
, where
$S = (X_{\mathrm{train}}, Y_{\mathrm{train}})$
, where
 $X_{\mathrm{train}} = \{\mathrm{x}_{1}, \mathrm{x}_{2},\ldots , \mathrm{x}_{M}\}$
contains the data portions of the samples, and
$X_{\mathrm{train}} = \{\mathrm{x}_{1}, \mathrm{x}_{2},\ldots , \mathrm{x}_{M}\}$
contains the data portions of the samples, and
 $Y_{\mathrm{train}} = \{\mathrm{y}_{1}, \mathrm{y}_{2},\ldots , \mathrm{y}_{M}\}$
contains the corresponding reference texts. Given a test input
$Y_{\mathrm{train}} = \{\mathrm{y}_{1}, \mathrm{y}_{2},\ldots , \mathrm{y}_{M}\}$
contains the corresponding reference texts. Given a test input
 $x_{\mathrm{test}}$
, our goal is to produce an output
$x_{\mathrm{test}}$
, our goal is to produce an output
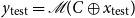 $y_{\mathrm{test}} = \mathscr{M}(C \oplus x_{\mathrm{test}})$
, where
$y_{\mathrm{test}} = \mathscr{M}(C \oplus x_{\mathrm{test}})$
, where
 $\mathscr{M}$
denotes a large language model (e.g., GPT-3.5) and
$\mathscr{M}$
denotes a large language model (e.g., GPT-3.5) and
 $C$
is composed of an instruction
$C$
is composed of an instruction
 $I$
along with
$I$
along with
 $m$
in-context examples, denoted by
$m$
in-context examples, denoted by
 $s(x_i, y_i)$
. Formally,
$s(x_i, y_i)$
. Formally,
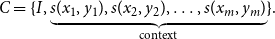 \begin{equation} C = \{ I, \underbrace {s(x_1, y_1), s(x_2, y_2), \ldots , s(x_m, y_m)}_{\text{context}} \}. \end{equation}
Conventional unsupervised in-context example selectors usually optimize a single dimension – either semantic similarity (e.g., KATE Liu et al. Reference Liu, Shen, Zhang, Dolan, Carin and Chen2022b) or diversity (e.g., choosing cluster centroids Zhang et al. Reference Zhang, Zhang, Li and Smola2022). In data-to-text generation, each approach exhibits a characteristic weakness. Diversity-only schemes often return demonstrations that are too remote from the test instance, yielding sub-optimal outputs. Similarity-only schemes, by contrast, require evaluating the similarity between the test instance and every training sample, then taking the top-k neighbors; although such exhaustive search can sometimes achieve the best generations, its inference-time complexity is prohibitive when the training set is large. To overcome these issues, we compare the test instance with only a small subset of the training data while still recovering near-optimal demonstrations. Our key insights are as follows: (i) examples whose data fields are sufficiently similar to the test instance are beneficial; (ii) the absolutely closest neighbors are unnecessary – near-enough examples suffice; and (iii) maximizing diversity in the text fields helps the model cover a wide range of reference-level linguistic patterns.
3.2 Method overview
Our approach leverages both data-level similarity and text-level diversity to optimize the selection process:
Data-Level Similarity: We cluster the training samples into
 $K$
groups based on the semantic representations of their data components, and Section 3.3.2 details how
$K$
groups based on the semantic representations of their data components, and Section 3.3.2 details how
 $K$
is selected. Samples within the same cluster are considered similar in terms of their data characteristics, while those from different clusters are treated as dissimilar. For a test input, we compare its data representation only with the
$K$
is selected. Samples within the same cluster are considered similar in terms of their data characteristics, while those from different clusters are treated as dissimilar. For a test input, we compare its data representation only with the
 $K$
cluster centers, thereby significantly reducing the computational cost of similarity comparisons compared to evaluating all samples in the training set.
$K$
cluster centers, thereby significantly reducing the computational cost of similarity comparisons compared to evaluating all samples in the training set.
Text-Level Diversity: We argue that if two in-context examples are highly similar in their textual content, including only one of them is sufficient to represent that semantic segment. To ensure textual diversity, we perform a second clustering step within each relevant data cluster; this time focusing on the text components of the samples. The center of each text cluster is then selected as an in-context example, enabling broader coverage of possible expressions while keeping the example quantity unchanged.
Conventional diversity-driven selectors – for example, Determinantal Point Process (DPP) (Wu et al. Reference Wu, Wang, Ye and Kong2023a) and centroid-based clustering (Zhang et al. Reference Zhang, Zhang, Li and Smola2022; Levy et al. Reference Levy, Bogin and Berant2023) – pursue diversity alone and neglect semantic alignment, so demonstrations that are overly dissimilar to the test instance can undermine data-to-text generation. DCCS mitigates this shortcoming with a two-stage clustering scheme: the first stage filters out irrelevant samples by data similarity, and the second stage enforces textual diversity within the retained subset. This dual focus simultaneously preserves relevance and expands linguistic coverage, yielding higher-quality outputs. The proposed method also offers substantial efficiency gains. Instead of comparing a test instance with all
 $M$
training samples, DCCS consults only the
$M$
training samples, DCCS consults only the
 $K$
data-cluster centroids (
$K$
data-cluster centroids (
 $K\ll M$
) and supports Batched Generation, whereby a single demonstration set is reused for every test input in the same cluster. This sharply lowers prompt-construction time and token consumption – an important benefit for LLM APIs billed per token. Unlike supervised selectors such as CEIL (Ye et al. Reference Ye, Wu, Feng, Yu and Kong2023) and MoD (Wang et al. Reference Wang, Chen, Shi, Shen, Li, Globerson, Mackey, Belgrave, Fan, Paquet, Tomczak and Zhang2024), DCCS requires no additional training and thus operates directly on black-box APIs.
$K\ll M$
) and supports Batched Generation, whereby a single demonstration set is reused for every test input in the same cluster. This sharply lowers prompt-construction time and token consumption – an important benefit for LLM APIs billed per token. Unlike supervised selectors such as CEIL (Ye et al. Reference Ye, Wu, Feng, Yu and Kong2023) and MoD (Wang et al. Reference Wang, Chen, Shi, Shen, Li, Globerson, Mackey, Belgrave, Fan, Paquet, Tomczak and Zhang2024), DCCS requires no additional training and thus operates directly on black-box APIs.
3.3 Double clustering based in-context example selection
For data-to-text tasks, our intention is to ensure that the context in the prompt is as pertinent to the data of
 $x_{test}$
as possible, while also possessing maximum diversity in reference texts. Thus, we stratify the in-context example selection task into two steps: (i) Cluster selection for input data, (ii) In-context example selection for reference text. In the cluster selection step, we select a subset of samples whose data content is similar to the given input semantics. In the in-context example selection step, we select training samples with diverse descriptions from the subset to construct a prompt.
$x_{test}$
as possible, while also possessing maximum diversity in reference texts. Thus, we stratify the in-context example selection task into two steps: (i) Cluster selection for input data, (ii) In-context example selection for reference text. In the cluster selection step, we select a subset of samples whose data content is similar to the given input semantics. In the in-context example selection step, we select training samples with diverse descriptions from the subset to construct a prompt.
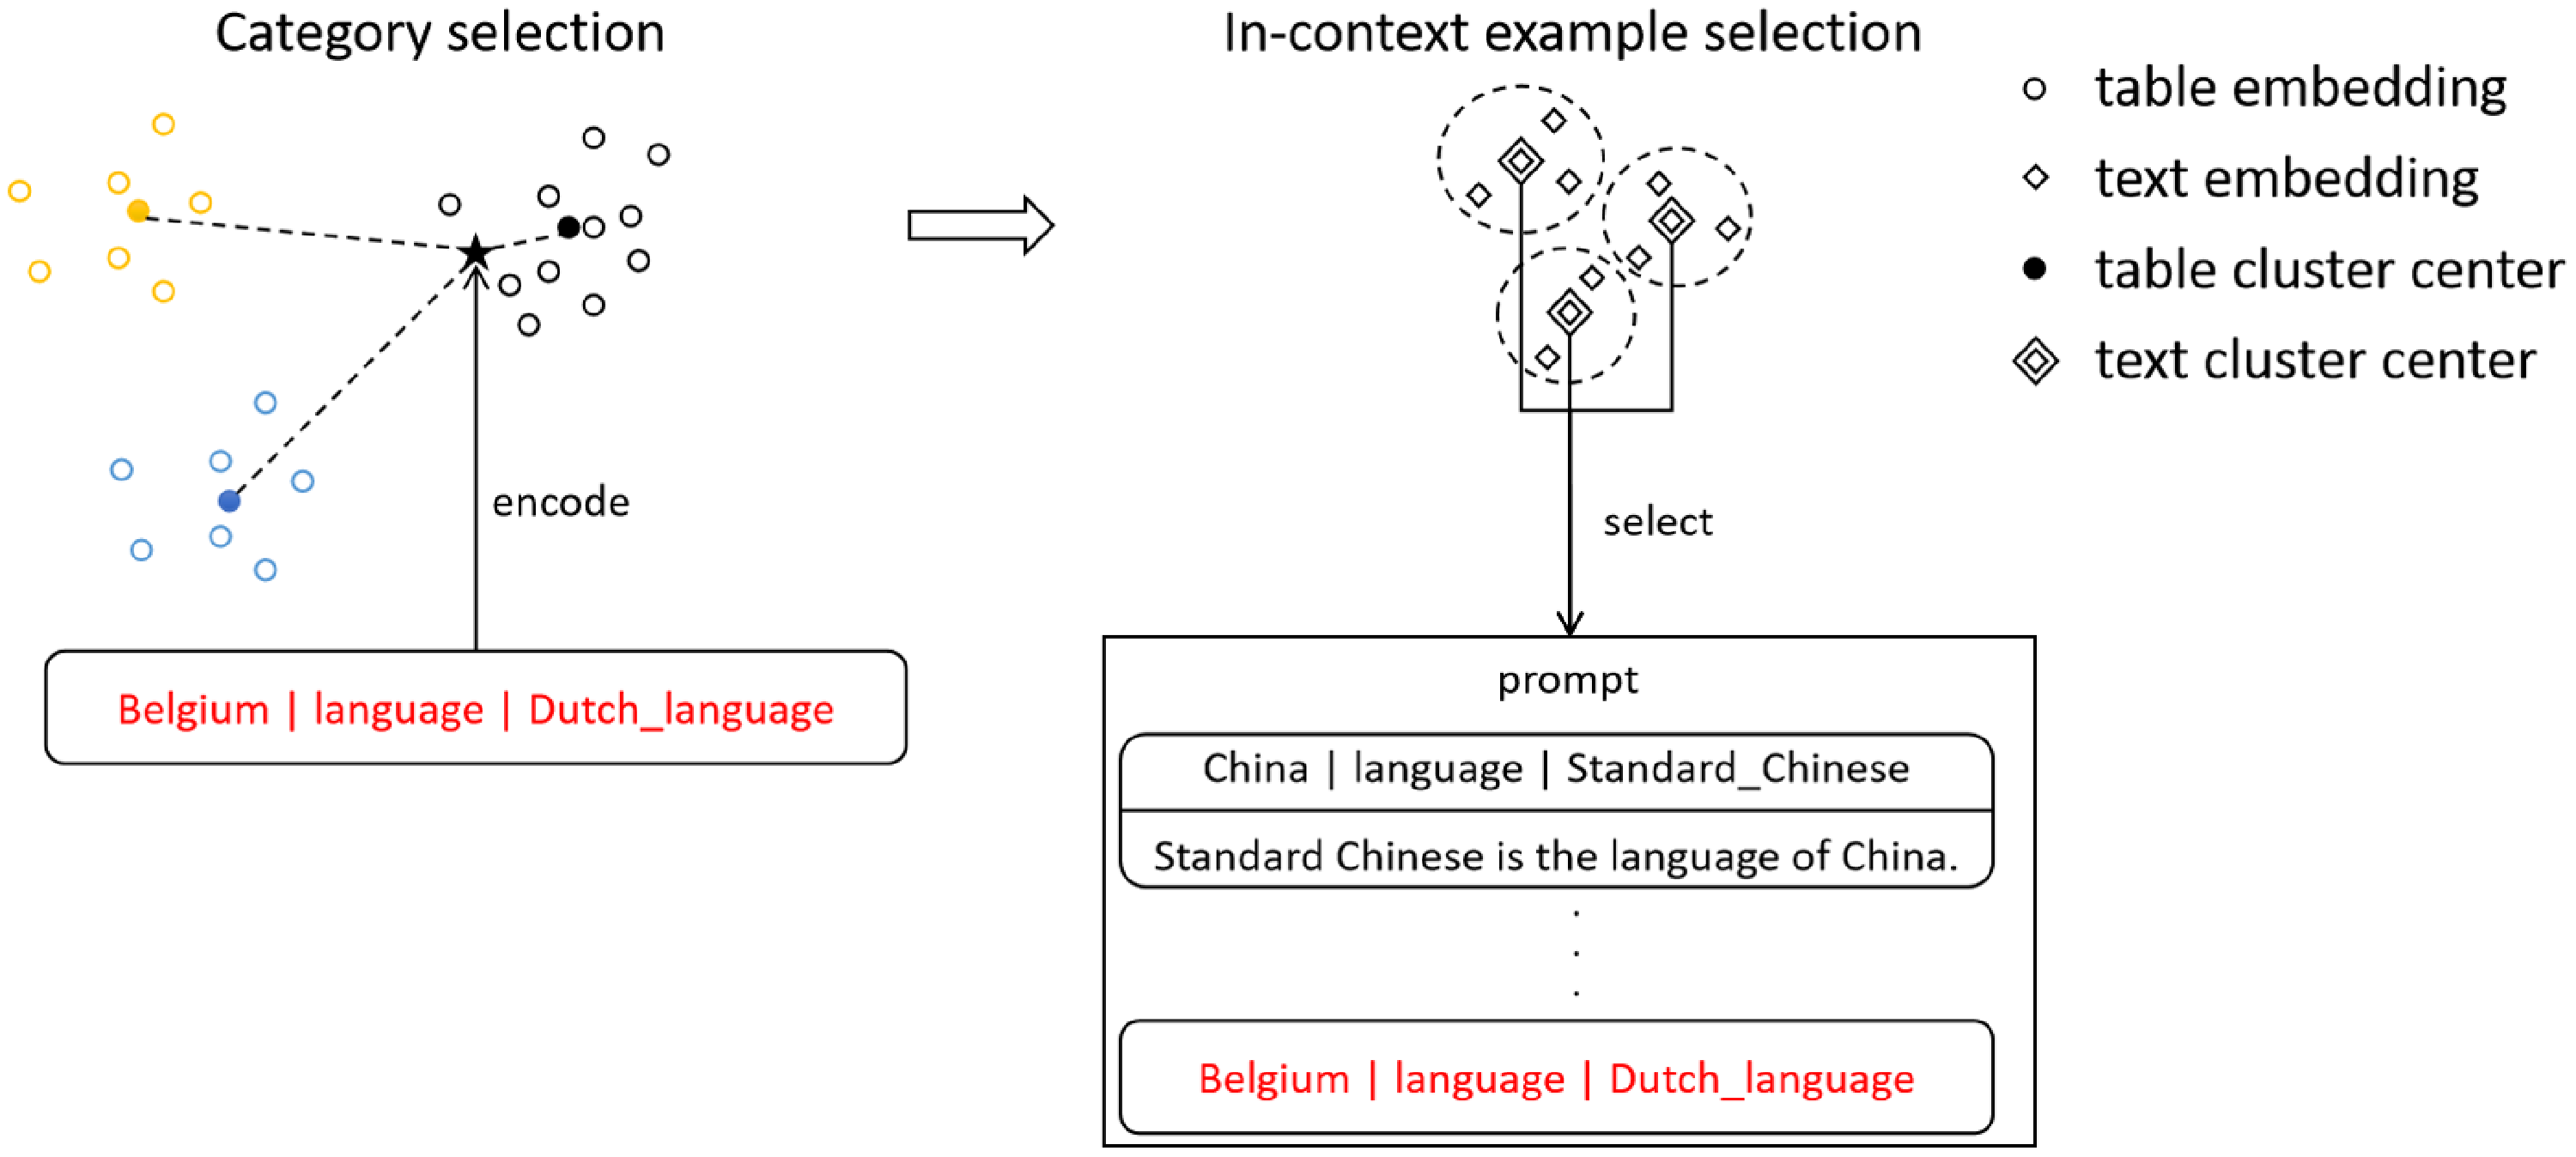
This procedure is implemented through two separate clustering operations. The first clustering operation divides the original training set into different categories. The second clustering operation identifies the most diverse in-context examples. We opted for the K-means algorithm for both clustering operations due to its simplicity, swift convergence, and straightforward implementation (Yuan and Yang Reference Yuan and Yang2019). The DCCS method is visualized in Figure 2. We divided the whole generation process into two phases: the preprocessing phase and the inference phase, as shown in Algorithms 1 and 2.
The schematic representation of DCCS. The training set is initially stratified into
 $K$
primary clusters based on the embeddings of the data. Each primary cluster subsequently undergoes sub-clustering into
$K$
primary clusters based on the embeddings of the data. Each primary cluster subsequently undergoes sub-clustering into
 $m$
categories based on the embeddings of the reference texts. The
$m$
categories based on the embeddings of the reference texts. The
 $m$
centroid samples are selected as candidate in-context examples for each primary cluster. During the inference phase, the test data
$m$
centroid samples are selected as candidate in-context examples for each primary cluster. During the inference phase, the test data
 $x$
is encoded and assessed for similarity against the
$x$
is encoded and assessed for similarity against the
 $K$
cluster centers, and the candidate in-context examples from the proximal category is selected.
$K$
cluster centers, and the candidate in-context examples from the proximal category is selected.
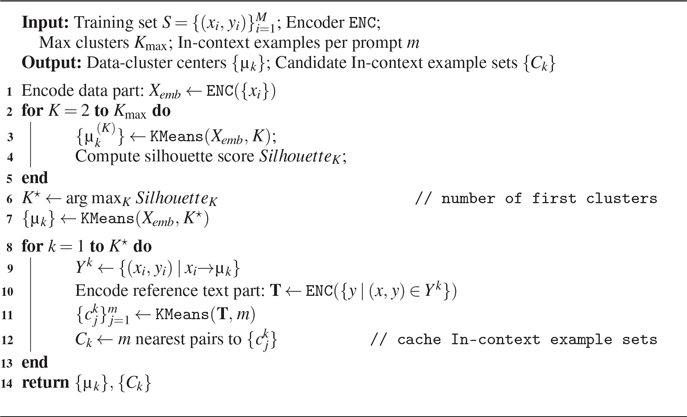
The preprocessing phase involves clustering the training set into
 $K$
primary clusters, each of which is further subdivided into
$K$
primary clusters, each of which is further subdivided into
 $m$
secondary clusters through a subsequent round of clustering. After the double clustering, the centroids of the first clusters are recorded for future comparison with input samples, while the
$m$
secondary clusters through a subsequent round of clustering. After the double clustering, the centroids of the first clusters are recorded for future comparison with input samples, while the
 $m$
samples proximate to the centroids of the
$m$
samples proximate to the centroids of the
 $m$
secondary clusters are retained, forming the candidate in-context example sets.
$m$
secondary clusters are retained, forming the candidate in-context example sets.
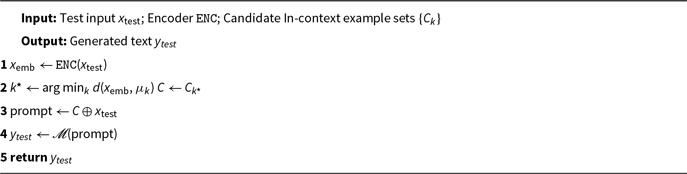
The inference phase involves calculating the distances between the input samples and the centroids of the
 $K$
clusters. The candidate in-context example sets from the closest cluster are then selected to generate the prompt.
$K$
clusters. The candidate in-context example sets from the closest cluster are then selected to generate the prompt.
3.3.1 Preprocessing phase
We utilize a smaller Pre-trained Language Model (PLM) to encode
 $X_{train}$
in the embedding space, resulting
$X_{train}$
in the embedding space, resulting
 $X_{emb}\in {R}^{M \times D }$
, where
$X_{emb}\in {R}^{M \times D }$
, where
 $M$
represents the number of sentences and
$M$
represents the number of sentences and
 $D$
is the embedding dimension. For this study, we employed RoBERTa-large model (Liu et al. Reference Liu, Ott, Goyal, Du, Joshi, Chen, Levy, Lewis, Zettlemoyer and Stoyanov2019) as the PLM, using the pooler output for sentence embedding, with
$D$
is the embedding dimension. For this study, we employed RoBERTa-large model (Liu et al. Reference Liu, Ott, Goyal, Du, Joshi, Chen, Levy, Lewis, Zettlemoyer and Stoyanov2019) as the PLM, using the pooler output for sentence embedding, with
 $D=1024$
.
$D=1024$
.
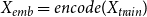 \begin{equation} X_{emb}=encode(X_{train}) \end{equation}
By using the PLM, we obtain the encoded representation
 $X_{emb}$
, which captures the semantic information of training set.
$X_{emb}$
, which captures the semantic information of training set.
Preprocess of DCCS
Inference of DCCS
In the first clustering step,
 $X_{emb}$
is partitioned into
$X_{emb}$
is partitioned into
 $K$
categories, yielding
$K$
categories, yielding
 $K$
cluster centers. The selection of
$K$
cluster centers. The selection of
 $K$
is based on the comparison of silhouette coefficients (Kaufman and Rousseeuw Reference Kaufman and Rousseeuw2009), considering different numbers of clusters. We select the number of clusters that corresponds to the maximum silhouette coefficient value as optimal. The clustering procedure terminates once the relative decrease in inertia falls below
$K$
is based on the comparison of silhouette coefficients (Kaufman and Rousseeuw Reference Kaufman and Rousseeuw2009), considering different numbers of clusters. We select the number of clusters that corresponds to the maximum silhouette coefficient value as optimal. The clustering procedure terminates once the relative decrease in inertia falls below
 $10^{-4}$
or after 300 Lloyd iterations, whichever occurs first.
$10^{-4}$
or after 300 Lloyd iterations, whichever occurs first.
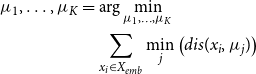 \begin{align}\mu _1,\ldots ,\mu _K & = \arg \min _{\mu _1,\ldots ,\mu _K} \nonumber \\ & \quad \sum _{x_i \in X_{emb}} \min _{j} \left ( dis(x_i, \mu _j) \right )\end{align}
Here,
 $dis()$
denotes the euclidean distance. Based on the clustering results of
$dis()$
denotes the euclidean distance. Based on the clustering results of
 $X_{train}$
,
$X_{train}$
,
 $Y_{train}$
is also partitioned into
$Y_{train}$
is also partitioned into
 $K$
categories.
$K$
categories.
 \begin{equation} Y^{k}=\{ y_i | dis(y_i,\mu _k) \lt dis(y_i,\mu _j),j\ne k \} \end{equation}
The same PLM used in the previous step encodes
 $Y^{k}$
in the embedding space.
$Y^{k}$
in the embedding space.
 \begin{equation} Y^{k}_{emb}=encode(Y^{k}) \end{equation}
Inference of DCCS-Batch

In the second clustering step, we select
 $m$
samples that can encompass all samples in each category with minimal distance. Based on preliminary experiments, we observed that increasing the number of in-context examples beyond ten rarely leads to additional performance improvements. Accordingly, we conduct experiments under both 5-shot and 10-shot settings, with the 10-shot results reported in the appendix.
$m$
samples that can encompass all samples in each category with minimal distance. Based on preliminary experiments, we observed that increasing the number of in-context examples beyond ten rarely leads to additional performance improvements. Accordingly, we conduct experiments under both 5-shot and 10-shot settings, with the 10-shot results reported in the appendix.
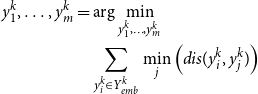 \begin{align} y^{k}_1,\ldots ,y^{k}_m & = \arg \min _{y^{k}_1,\ldots ,y^{k}_m} \nonumber \\ & \quad \sum _{y^{k}_i \in Y^{k}_{emb}} \min _{j} \left ( dis(y^{k}_i, y^{k}_j) \right ) \end{align}
For each category, the candidate in-context example set, denoted as
 $C_k$
, is constructed. These in-context example sets are indexed by cluster number and can, therefore, be accessed quickly using the corresponding category index.
$C_k$
, is constructed. These in-context example sets are indexed by cluster number and can, therefore, be accessed quickly using the corresponding category index.
 \begin{equation} C_k=\{I,s(x^{k}_1,y^{k}_1),s(x^{k}_2,y^{k}_2),\ldots ,s(x^{k}_m,y^{k}_m)\} \end{equation}
3.3.2 Determining the number of clusters
To determine the number of clusters in the first clustering step, we use the Silhouette Coefficient Rousseeuw (Reference Rousseeuw1987), a metric that evaluates the effectiveness of a clustering algorithm by combining measures of cohesion and separation. This helps identify the optimal number of clusters (
 $K$
) for
$K$
) for
 $k$
-means clustering. The coefficient ranges from
$k$
-means clustering. The coefficient ranges from
 $-1$
to
$-1$
to
 $1$
: values close to
$1$
: values close to
 $1$
suggest that a sample is well matched to its own cluster and poorly matched to neighboring clusters; values near
$1$
suggest that a sample is well matched to its own cluster and poorly matched to neighboring clusters; values near
 $0$
indicate proximity to the boundary between clusters; and negative values imply potential misclassification.
$0$
indicate proximity to the boundary between clusters; and negative values imply potential misclassification.
For each sample
 $i$
, two quantities are computed:
$i$
, two quantities are computed:
 $a(i)$
, the mean distance between
$a(i)$
, the mean distance between
 $i$
and all other points in the same cluster (measuring cohesion); and
$i$
and all other points in the same cluster (measuring cohesion); and
 $b(i)$
, the mean distance between
$b(i)$
, the mean distance between
 $i$
and all points in the nearest different cluster (measuring separation). The Silhouette Coefficient
$i$
and all points in the nearest different cluster (measuring separation). The Silhouette Coefficient
 $s(i)$
for each sample is calculated as follows:
$s(i)$
for each sample is calculated as follows:
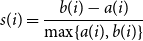 \begin{equation*} s(i) = \frac {b(i) - a(i)}{\max \{a(i), b(i)\}} \end{equation*}
The average Silhouette Coefficient across all samples serves as an evaluation metric for selecting the value of
 $K$
that maximizes clustering quality. This method provides an objective and efficient means of determining the appropriate number of clusters for
$K$
that maximizes clustering quality. This method provides an objective and efficient means of determining the appropriate number of clusters for
 $k$
-means clustering.
$k$
-means clustering.
3.3.3 Inference phase
When generating text for the input data
 $x$
, we propose the following method:
$x$
, we propose the following method:
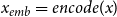
Encoding. We utilize PLM to encode the information present in the input data
 $x$
.
$x$
.
 \begin{equation} x_{emb}=encode(x) \end{equation}
Selecting cluster. We compare the encoded representation
 $x_{emb}$
with the clustering centers obtained from the training set. This comparison allows us to determine the closest cluster to which the input data belongs. The index
$x_{emb}$
with the clustering centers obtained from the training set. This comparison allows us to determine the closest cluster to which the input data belongs. The index
 $k$
is selected as the cluster that minimizes the distance between
$k$
is selected as the cluster that minimizes the distance between
 $x_{emb}$
and the cluster center
$x_{emb}$
and the cluster center
 $\mu _k$
. By assigning the input data to the appropriate cluster, we can effectively categorize the test data into different clusters.
$\mu _k$
. By assigning the input data to the appropriate cluster, we can effectively categorize the test data into different clusters.
 \begin{equation} k=\arg \min _k(x_{emb}-\mu _k) \end{equation}
Concatenating prompt. After identifying the domain-specific cluster
 $C_k$
, we select it as the representative set of in-context examples. To construct a prompt for text generation, we concatenate
$C_k$
, we select it as the representative set of in-context examples. To construct a prompt for text generation, we concatenate
 $C_k$
with the original input data
$C_k$
with the original input data
 $x$
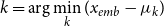
. This prompt serves as a comprehensive input to guide the LLM in generating coherent and relevant text outputs. After obtaining these in-context examples, we concatenate them into a complete prompt following the format illustrated in Figure 4 and Table 1.
$x$
. This prompt serves as a comprehensive input to guide the LLM in generating coherent and relevant text outputs. After obtaining these in-context examples, we concatenate them into a complete prompt following the format illustrated in Figure 4 and Table 1.
Generating output. The constructed prompt, composed of the cluster examples
 $C_k$
and the input data
$C_k$
and the input data
 $x$
, is fed into LLM for text generation. The LLM utilizes the contextual information provided by the prompt to generate the desired output
$x$
, is fed into LLM for text generation. The LLM utilizes the contextual information provided by the prompt to generate the desired output
 $y$
.
$y$
.
 \begin{equation} y=\mathscr{M}(C_k \oplus x) \end{equation}
3.4 DCCS-batch
Traditional KNN-based in-context learning example selection methods require a separate selection process for each test case, as the closest
 $k$
samples in the training set vary for each test sample. However, the DCCS method allows for the same context samples to be used for different test samples if they are classified into the same cluster. This enables us to combine test samples with identical in-context examples into a single prompt, allowing the LLM to perform text generation for multiple data points simultaneously. Figure 3 illustrates the differences between our batched generation method and the traditional single-generation method. This batched generation method significantly improves the token utilization efficiency of LLMs. Figures 4 and 5, respectively, present examples of prompts for the single-generation and batched-generation methods, with each prompt selecting
$k$
samples in the training set vary for each test sample. However, the DCCS method allows for the same context samples to be used for different test samples if they are classified into the same cluster. This enables us to combine test samples with identical in-context examples into a single prompt, allowing the LLM to perform text generation for multiple data points simultaneously. Figure 3 illustrates the differences between our batched generation method and the traditional single-generation method. This batched generation method significantly improves the token utilization efficiency of LLMs. Figures 4 and 5, respectively, present examples of prompts for the single-generation and batched-generation methods, with each prompt selecting
 $k$
ICL examples. The batched generation method simultaneously performs text generation tasks on
$k$
ICL examples. The batched generation method simultaneously performs text generation tasks on
 $n$
input data.
$n$
input data.
Instruction and data format in prompt text
Left: Single Generation, where text is generated for one structural data at a time. Right: Batched Generation, with text being generated for 5 simultaneously.

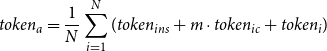
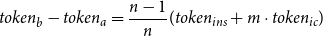
By using batched generation, we can reduce the average token usage per instance by
 $\frac {n-1}{n}(token_{ins} + m \cdot token_{ic})$
, where
$\frac {n-1}{n}(token_{ins} + m \cdot token_{ic})$
, where
 $token_{ins}$
and
$token_{ins}$
and
 $token_{ic}$
respectively represent the number of tokens used for the instruction and a single in-context learning example within the prompt,
$token_{ic}$
respectively represent the number of tokens used for the instruction and a single in-context learning example within the prompt,
 $n$
is the batch size, and
$n$
is the batch size, and
 $m$
is the number of in-context learning examples. We provide detailed proofs in the subsequent sections.
$m$
is the number of in-context learning examples. We provide detailed proofs in the subsequent sections.
Prompt for single generation.

Prompt for batched generation.
3.5 Computational complexity analysis
Let
 $M$
represent the number of samples in the training set,
$M$
represent the number of samples in the training set,
 $K$
denote the number of clusters in the first clustering, and
$K$
denote the number of clusters in the first clustering, and
 $m$
be the number of subclusters in the second clustering.
$m$
be the number of subclusters in the second clustering.
Preprocessing phase: The typical complexity of K-means clustering during the first phase of clustering is
 $O(MKDI_1)$
, where
$O(MKDI_1)$
, where
 $I_1$
is the number of iterations required for the algorithm to converge. Similarly, for the second phase of clustering within each primary cluster, the average complexity would be
$I_1$
is the number of iterations required for the algorithm to converge. Similarly, for the second phase of clustering within each primary cluster, the average complexity would be
 $O(\frac {M}{K}mDI_2)$
, where
$O(\frac {M}{K}mDI_2)$
, where
 $I_2$
is the number of iterations for the second round of clustering to converge. The total complexity of the clustering phase can be represented as
$I_2$
is the number of iterations for the second round of clustering to converge. The total complexity of the clustering phase can be represented as
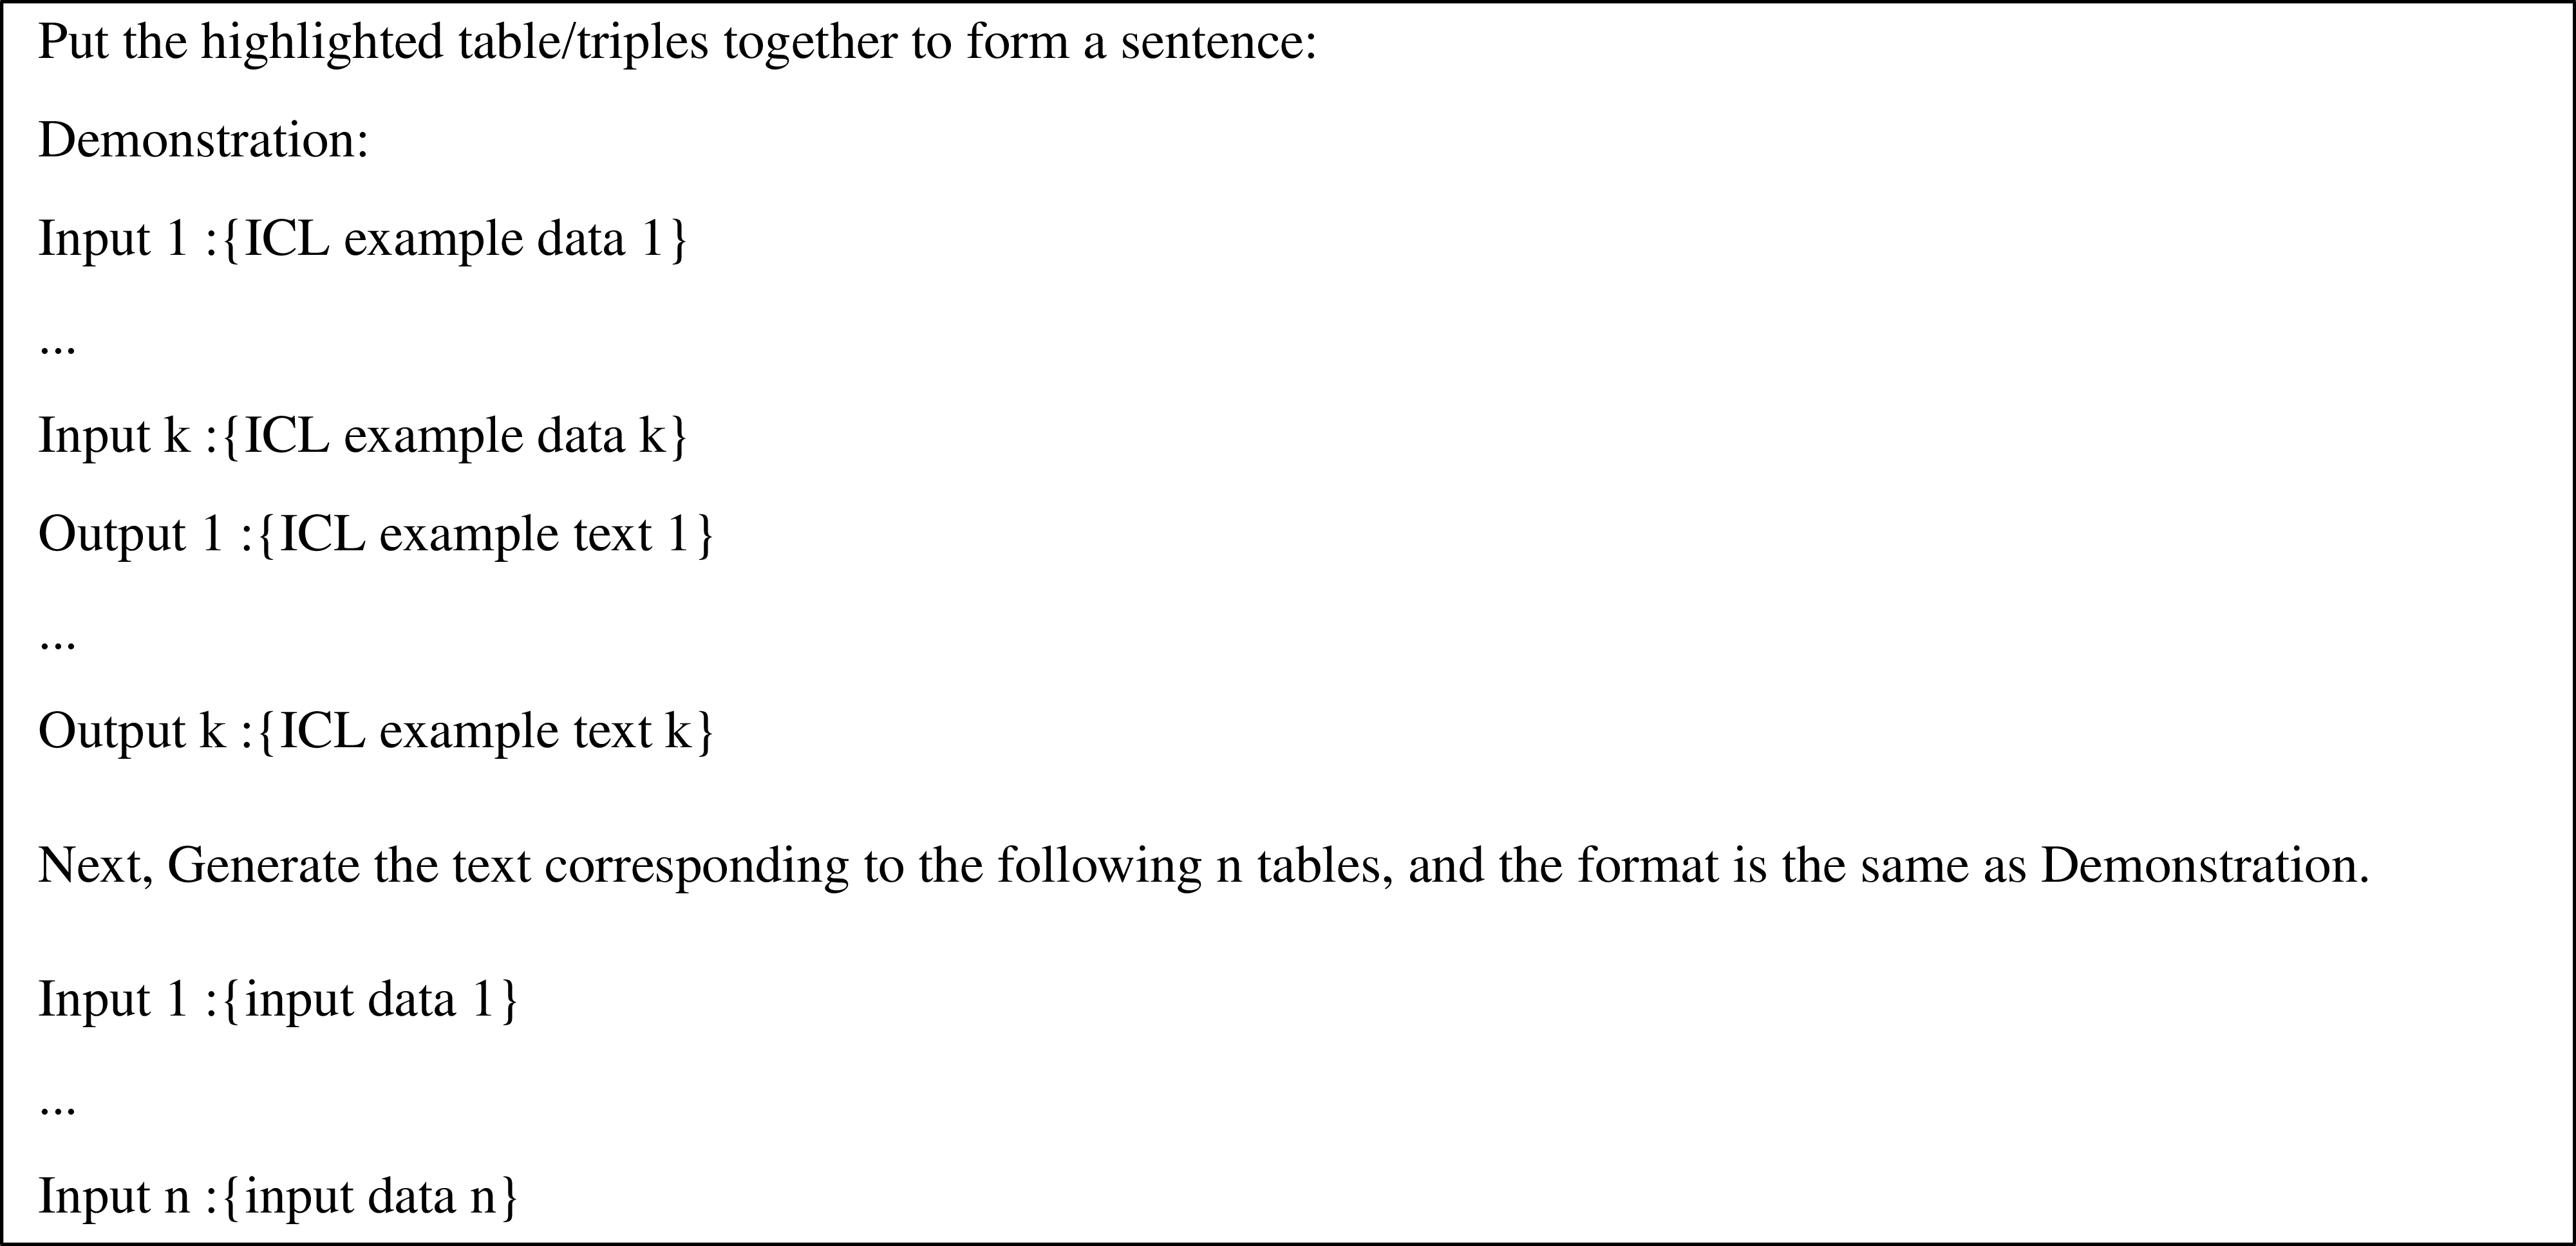
 $O(M(m+K)D(I_1+I_2))$
.
$O(M(m+K)D(I_1+I_2))$
.
Inference phase: For each input sample, the algorithm compares it with
 $K$
cluster centers to select the nearest one. The time complexity for this step would be
$K$
cluster centers to select the nearest one. The time complexity for this step would be
 $O(KD)$
. Assume
$O(KD)$
. Assume
 $N$
be the number of samples in testing set, the complexity of inference phase is
$N$
be the number of samples in testing set, the complexity of inference phase is
 $O(KDN)$
.
$O(KDN)$
.
Considering
 $K$
,
$K$
,
 $I_1$
,
$I_1$
,
 $I_2$
, and
$I_2$
, and
 $m$
as constants, and both
$m$
as constants, and both
 $M$
and
$M$
and
 $N$
are significantly larger than
$N$
are significantly larger than
 $K$
,
$K$
,
 $I_1$
,
$I_1$
,
 $I_2$
, and
$I_2$
, and
 $m$
, the overall algorithmic complexity of the DCCS method is thus
$m$
, the overall algorithmic complexity of the DCCS method is thus
 $O((M+N)D)$
.
$O((M+N)D)$
.
Existing methods based on selecting similar samples (i.e., KATE Liu et al. Reference Liu, Shen, Zhang, Dolan, Carin and Chen2022b and CEIL Ye et al. Reference Ye, Wu, Feng, Yu and Kong2023) are designed to compare distances with all
 $N$
samples during each inference. The complexity of these methods is
$N$
samples during each inference. The complexity of these methods is
 $O(MND)$
.
$O(MND)$
.
In scenarios where
 $N$
is considerably large, the DCCS method can significantly decrease the time required for in-context example selection.
$N$
is considerably large, the DCCS method can significantly decrease the time required for in-context example selection.
For DCCS-Batch, since DCCS-Batch and DCCS use the same ICL example selection method, the time for generating prompts is also similar. We constructed
 $K$
queues (
$K$
queues (
 $K$
represents the number of clusters), and after determining which cluster a test data belongs to, we stored it in this queue. When a queue is full (containing batch-size data), we combined them into a prompt (as shown in Figure 5), and then cleared the queue. This results in an additional table storage and retrieval process for DCCS batch compared to single-input DCCS, but the time required for similarity comparison between samples is negligible.
$K$
represents the number of clusters), and after determining which cluster a test data belongs to, we stored it in this queue. When a queue is full (containing batch-size data), we combined them into a prompt (as shown in Figure 5), and then cleared the queue. This results in an additional table storage and retrieval process for DCCS batch compared to single-input DCCS, but the time required for similarity comparison between samples is negligible.
3.6 Token utilization efficiency in batched generation
For data-to-text tasks, let’s assume
 $m$
in-context learning samples are selected,
$m$
in-context learning samples are selected,
 $n$
is the batch size. The final input prompt text to the LLM typically consists of the instruction, context, and test input. Assuming
$n$
is the batch size. The final input prompt text to the LLM typically consists of the instruction, context, and test input. Assuming
 $token_{ins}$
and
$token_{ins}$
and
 $token_{ic}$
respectively represent the number of tokens used for the instruction and a single in-context learning sample within the prompt.
$token_{ic}$
respectively represent the number of tokens used for the instruction and a single in-context learning sample within the prompt.
 $token_{i}$
is the number of tokens used for the input data. For a traditional single inference prompt, the prompt length
$token_{i}$
is the number of tokens used for the input data. For a traditional single inference prompt, the prompt length
 $(L_P)$
is given by
$(L_P)$
is given by
 $ token_{ins} + m \cdot token_{ic} + token_{i}$
.
$ token_{ins} + m \cdot token_{ic} + token_{i}$
.
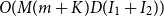
The input token per sample is calculated as:
 \begin{equation} token_{a} = \frac {1}{N}\sum _{i=1}^{N} (token_{ins} + m \cdot token_{ic} + token_{i}) \end{equation}
In contrast, for batched inference prompt,assumed batch size is
 $n$
, the prompt length
$n$
, the prompt length
 $(L_P)$
is given by
$(L_P)$
is given by
 $ token_{ins} + m \cdot token_{ic} + n token_{i}$
. The input token per sample is calculated as:
$ token_{ins} + m \cdot token_{ic} + n token_{i}$
. The input token per sample is calculated as:
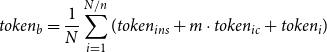 \begin{equation} token_{b} = \frac {1}{N}\sum _{i=1}^{N/n} (token_{ins} + m \cdot token_{ic} + token_{i}) \end{equation}
 \begin{equation} token_{b} - token_{a}=\frac {n-1}{n}(token_{ins} + m \cdot token_{ic}) \end{equation}
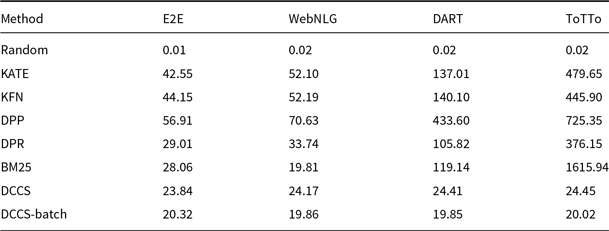
Assuming the instruction part of the prompt remains unchanged, as the batch size and the number of ICL samples increase, the token utilization efficiency of batched generation becomes higher. Table 2 presents the percentage reduction in retrieval time and token usage achieved by our DCCS, DCCS-Batch (batch size 5), and DCCS-Batch (batch size 10) methods in comparison to KATE, evaluated across four datasets of varying sizes.
Comparison of Retrieval Time Saved and Token Saved (%) between DCCS and KATE across datasets

4. Experiments
In this section, we present experiments designed to assess the DCCS and DCCS-Batch methods in terms of generation quality and efficiency.
4.1 Experimental setup
4.1.1 Datasets and environment
We conducted experiments on four widely used datasets for the data-to-text task: E2E (Novikova, Dušek, and Rieser Reference Novikova, Dušek and Rieser2017; Dušek et al. Reference Dušek, Novikova and Rieser2020), WebNLG (Gardent et al. Reference Gardent, Shimorina, Narayan and Perez-Beltrachini2017), DART (Nan et al. Reference Nan, Radev, Zhang, Rau, Sivaprasad, Hsieh, Tang, Vyas, Verma, Krishna, Liu, Irwanto, Pan, Rahman, Zaidi, Mutuma, Tarabar, Gupta, Yu, Tan, Lin, Xiong, Socher and Rajani2021), and ToTTo (Parikh et al. Reference Parikh, Wang, Gehrmann, Faruqui, Dhingra, Yang and Das2020).
E2E contains 42 000 restaurant meaning representations with up to eight slot–value pairs (e.g., name, food, area). Inputs are short and domain-specific, and most references are single sentences, making it a compact closed-domain benchmark.
WebNLG covers 15 DBpedia categories (e.g., Airport, University) and provides sets of 1–6 triples as input. Compared with E2E, it spans multiple domains and often requires multi-sentence outputs to verbalize more varied predicates.
DART extends WebNLG to an open-domain setting by mining RDF-style triples from Wikipedia tables and sentences. Its inputs are longer and noisier, so systems must generalize to unseen predicates and cope with imperfect schemas.
ToTTo is a table-to-text dataset that highlights a subset of Wikipedia table cells to be verbalized. Unlike the pure triple formats of WebNLG and DART, ToTTo inputs preserve table structure and require the model to reason over cell context and aggregation.
The experimental environment incorporated the following hardware configurations:
-
• CPU: Intel Xeon Gold 6240 CPU (2.6 GHz, 72 cores);
-
• RAM: 512 GB DDR4;
-
• GPU: NVIDIA Tesla T4.
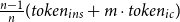
We used the GPT-3.5 API (gpt-3.5-turbo-0125) provided by OpenAIFootnote a and the GLM-3 API (glm-3-turbo) provided by ZHIPU AIFootnote b as LLM in our method. We set the temperature parameter to 0 for GPT-3.5 and 0.01 for GLM-3, using the default configuration for other arguments. To minimize the influence of external factors on the in-context examples in the prompt, we adopted the method used by (Li et al. Reference Li, Li, Geng, Yang, Li, Yuan, He, Yuan, Ma and Huang2024), which involves merely inserting a brief instruction at the beginning of each prompt. For example, ”Put the highlighted table/triples together to form a sentence.” Detailed examples of such prompts can be seen in Table 1, Figure 4, and Figure 5. Considering the cost implications of LLM API calls, we conducted experiments using the full test dataset for batch generation methods. For single-generation methods with GPT-3.5 and GLM-3, we randomly selected 100 test samples, ensuring the same samples were used across all methods. Additionally, we conducted experiments with a smaller open-source model, LLaMA 3.1-8B,Footnote c which extends the context length to 128K and supports our long-prompt experiments. We have made the complete source code publicly available – including our DCCS implementation, all baseline methods, and the exact experimental configurations.Footnote d
4.1.2 Baseline
To evaluate the performance of our DCCS and DCCS-Batch methods, we benchmarked them against seven existing in-context example selection methodologies:
Random: For each test input,
 $m$
samples are randomly selected from the training set to serve as in-context examples.
$m$
samples are randomly selected from the training set to serve as in-context examples.
KATE (Liu et al. Reference Liu, Shen, Zhang, Dolan, Carin and Chen2022b): The Knn-Augmented in-conText Example selection (KATE) method identifies the
 $m$
training samples with the shortest distance to the test input in the embedding space.
$m$
training samples with the shortest distance to the test input in the embedding space.
KFN: In contrast to KATE, the K-Furthest Neighbors (KFN) method selects the
 $m$
training samples that exhibit the longest distance to the test input in the embedding space.
$m$
training samples that exhibit the longest distance to the test input in the embedding space.
DPP (Kulesza and Taskar Reference Kulesza and Taskar2011): The Determinantal Point Process (DPP) is designed for set selection problems emphasizing diversity. Following Ye et al. Reference Ye, Wu, Feng, Yu and Kong(2023) we first retrieve the top-100 nearest neighbors of the test instance with a dense KNN retriever, and then apply the conditional DPP MAP solver to pick
 $m$
demonstrations that maximize a relevance–diversity objective.
$m$
demonstrations that maximize a relevance–diversity objective.
BM25 (Karpukhin et al. Reference Karpukhin, Oguz, Min, Lewis, Wu, Edunov, Chen and Yih2020): BM25 is a widely used text retrieval method based on the term frequency-inverse document frequency (TF-IDF) principle. It ranks training samples according to their relevance to the test input, determined by a weighted TF-IDF scheme.
DPR (Karpukhin et al. Reference Karpukhin, Oguz, Min, Lewis, Wu, Edunov, Chen and Yih2020): The Dense Passage Retriever (DPR) employs a dense encoder that transforms text into
 $d$
-dimensional vectors in dense space. It builds an index of all training passages for efficient retrieval. At runtime, a separate encoder converts the test input into a
$d$
-dimensional vectors in dense space. It builds an index of all training passages for efficient retrieval. At runtime, a separate encoder converts the test input into a
 $d$
-dimensional vector, retrieving the top-
$d$
-dimensional vector, retrieving the top-
 $m$
passages whose vectors are most similar to the test input vector.
$m$
passages whose vectors are most similar to the test input vector.
Random-Batch: This method randomly selects input samples to form a batch and chooses
 $m$
samples from the training set as in-context examples in a random manner.
$m$
samples from the training set as in-context examples in a random manner.
4.1.3 Evaluation metrics
We evaluated the generated texts using four widely used automatic metrics: BLEU (Papineni et al. Reference Papineni, Roukos, Ward and Zhu2002), ROUGE-L (Lin Reference Lin2004), and BERTScore (Zhang et al. Reference Zhang, Kishore, Wu, Weinberger and Artzi2019). For the ToTTo dataset, we used the official evaluation scriptFootnote e to calculate BLEU and PARENT (Dhingra et al. Reference Dhingra, Faruqui, Parikh, Chang, Das and Cohen2019). These metrics capture complementary aspects of generation quality, ranging from lexical overlap to deeper semantic and factual accuracy.
BLEU quantifies the similarity between a generated output and one or more reference texts by computing a geometric mean of modified
 $n$
-gram precisions, adjusted with a brevity penalty (BP) to discourage trivially short outputs.
$n$
-gram precisions, adjusted with a brevity penalty (BP) to discourage trivially short outputs.
ROUGE-L focuses on the longest sequence of tokens that appear in both texts in the same order, though not necessarily contiguously. This metric effectively captures sentence-level fluency and coherence, outperforming simple
 $n$
-gram matching.
$n$
-gram matching.
BERTScore employs contextualized embeddings (e.g., from BERT) to measure semantic similarity. Each token in the generated text is matched to the most similar token in the reference text based on cosine similarity.
PARENT is designed for data-to-text generation, incorporating both lexical overlap and alignment with source data. It assigns credit for
 $n$
-grams in the generated text that appear in the reference or can be inferred from the input data. By jointly considering textual similarity and factual consistency, PARENT better captures the factual consistency of the generated output with the provided information.
$n$
-grams in the generated text that appear in the reference or can be inferred from the input data. By jointly considering textual similarity and factual consistency, PARENT better captures the factual consistency of the generated output with the provided information.
4.2 Automatic evaluation results
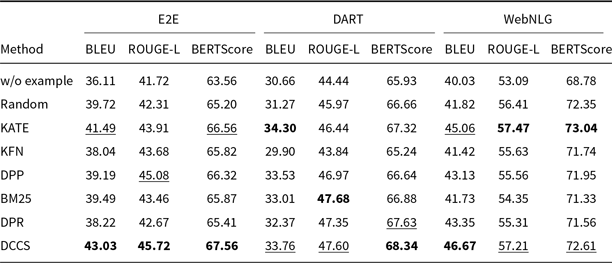
Tables 3 and 4 report the 5-shot single-generation results for GPT-3.5 across all automatic metrics. Table 5 provides the corresponding scores for GLM-3, and Tables 6 and 7 list the results for Llama-3.1-8B. Batched-generation results appear in Tables 8, 9, and 10. The analogous 10-shot tables are included in Appendix A and B.
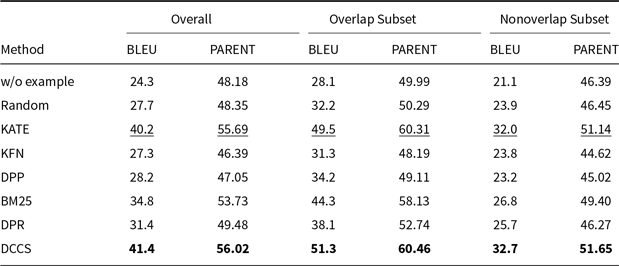
Comparative results of data-to-text generation using GPT-3.5 on the E2E, DART, and WebNLG (100 test samples) in a 5-shot setting. The best performance per metric is shown in bold and the second-best result is underlined
Comparative results of data-to-text generation using GPT-3.5 on the ToTTo (100 test samples) in a 5-shot setting. The best performance per metric is shown in bold and the second-best result is underlined

Comparative results of data-to-text generation using GLM-3 on the E2E, DART, and WebNLG (100 test samples) in a 5-shot setting. The best performance per metric is shown in bold and the second-best result is underlined

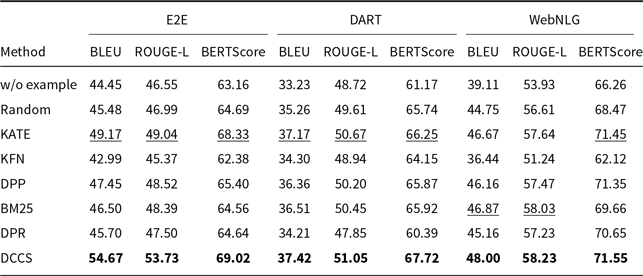
Comparative results of data-to-text generation using Llama-3.1 on the E2E, DART, and WebNLG in a 5-shot setting. The best performance per metric is shown in bold and the second-best result is underlined
BLEU and PARENT on the ToTTo using Llama-3.1 in a 5-shot setting. The best performance per metric is shown in bold and the second-best result is underlined
BLEU for batched generation on the E2E, WebNLG, DART and ToTTo using GPT-3.5 in a 5-shot setting. The best performance per dataset is shown in bold

BLEU for batched generation on the E2E, WebNLG, DART and ToTTo using GLM-3 in a 5-shot setting. The best performance per dataset is shown in bold

BLEU scores for batched generation on the E2E, DART, WebNLG, and ToTTo using Llama-3.1 in a 5-shot setting. The best performance per dataset is shown in bold

Comparison of 5-shot prompt generation time (ms)
4.2.1 Single generation performance
As shown in Tables 3–6, and 7, both our proposed method and the KATE method significantly outperform the Random baseline. The corresponding significance tests are reported in Section 4.2.5. This demonstrates that, compared to randomly selecting in-context examples, selecting semantically similar examples tailored to each input instance more effectively enhances the generation quality of LLMs.
Random underperforms DCCS on all datasets, yet it consistently outperforms the zero-shot setting and occasionally matches the weaker similarity-based baselines. Uniform random sampling of
 $m$
demonstrations still provides representative lexical and syntactic patterns, giving it helpful prior clues that it never gets in a zero-shot prompt. Because it requires neither similarity scoring nor index lookup, Random incurs negligible computational overhead (Table 11). Accordingly, when low-latency inference is essential and accurate retrieval is unavailable, Random offers a fast, competitive baseline, albeit still inferior to semantically informed selection.
$m$
demonstrations still provides representative lexical and syntactic patterns, giving it helpful prior clues that it never gets in a zero-shot prompt. Because it requires neither similarity scoring nor index lookup, Random incurs negligible computational overhead (Table 11). Accordingly, when low-latency inference is essential and accurate retrieval is unavailable, Random offers a fast, competitive baseline, albeit still inferior to semantically informed selection.
Our DCCS method consistently ranks first or second across most datasets and evaluation metrics, underscoring its strong generalization ability and adaptability to various dataset structures and evaluation criteria. In the E2E dataset, DCCS achieved the highest BERTScore (67.56, 70.15, and 69.02 for GPT-3.5, GLM-3, and LLaMA-3.1, respectively) in the 5-shot setting. On the WebNLG dataset, DCCS demonstrated robust adaptability to diverse and complex domains, attaining the highest BLEU scores across all three models under the same setting.
Our method performs slightly less effectively than KATE on certain more complex datasets, such as ToTTo in the GPT-3.5 experiments (Table 4) and DART in the GLM-3 experiments (Table 5). We attribute this to two main factors. First, compared to other datasets, ToTTo contains more complex textual separation tags in its training samples, which adversely affect the performance of RoBERTa as a semantic encoder – a limitation we plan to address in future work. Second, the ToTTo test set contains a substantial number of instances that are nearly identical to those in the training set. Leveraging a K-nearest neighbor strategy over the entire training set, the KATE method can retrieve highly similar examples, resulting in higher BLEU and related evaluation scores.
Although our method does not select the globally most similar samples due to its design, it provides notable improvements in computational efficiency – particularly on large-scale datasets such as ToTTo. Moreover, the two-stage clustering procedure in DCCS allows the same in-context examples to be reused for similar test instances, thereby enabling efficient batched generation. Subsequent experiments confirm that this design contributes to improvements in both generation accuracy and efficiency.
4.2.2 Comparison with SOTA models
We compare our DCCS against the SOTA on each benchmark dataset. The BLEU scores of these state-of-the-art (SOTA) systems are directly cited from the original publications. For the WebNLG dataset, the highest reported BLEU score is 67.32, achieved by the Controlled Prefixing approach using a fine-tuned T5 model (Clive et al. Reference Clive, Cao and Rei2022). On the E2E dataset, ALoRA attains 70.6 BLEU (Liu et al. Reference Liu, Lyn, Zhu, Tian and Graham2024), while the UniD2T system sets the benchmark on ToTTo and DART with 49.9 and 54.96 BLEU, respectively (Li et al. Reference Li, Li, Geng, Yang, Li, Yuan, He, Yuan, Ma and Huang2024).
Fine-tuned models consistently outperform in-context learning (ICL) because they update millions of task-specific parameters, effectively absorbing corpus-level lexical and syntactic regularities. ICL, by design, keeps the backbone frozen and can only leverage a handful of demonstrations, so a performance gap is expected. Despite this, we pursue ICL for three pragmatic reasons: (i) zero training cost – new domains can be served without GPU-intensive fine-tuning; (ii) data frugality – no large parallel corpus is required, which is crucial for low-resource tables; and (iii) fast iteration – example sets can be swapped on-the-fly to meet downstream constraints (e.g., privacy or domain drift) that would otherwise force a costly model retrain.
We also find that GPT-3.5 and GPT-4, although strong in instruction following, occasionally inject polite or conversational fillers unrelated to the table, depressing automatic metrics. In contrast, LLaMA 3.1-8B, when prompted with the same demonstrations, tends to generate more concise, schema-aligned sentences and therefore yields higher BLEU under the ICL regime.
4.2.3 Ablation experiments
To evaluate the individual contributions of each component in our two-stage clustering framework, we conduct ablation studies by comparing the proposed DCCS method with several simplified variants.
Comparative results of data-to-text generation using Llama-3.1 on the E2E, DART, and WebNLG datasets in a 5-shot setting. The best performance per metric is shown in bold and the second-best result is underlined

BLEU and PARENT on the ToTTo using Llama-3.1 in a 5-shot setting. The best performance per metric is shown in bold

Nearest Cluster (DCCS w/o second clustering): This variant employs only a single-stage clustering process on the training set. For each test input, the nearest cluster is identified by computing its similarity to all cluster centers. Rather than selecting the centroid,
 $m$
in-context examples are randomly sampled from within the nearest cluster. This design helps isolate the impact of the second-stage refinement employed in our full method.
$m$
in-context examples are randomly sampled from within the nearest cluster. This design helps isolate the impact of the second-stage refinement employed in our full method.
Diversity-based Clustering (Zhang et al. Reference Zhang, Zhang, Li and Smola2022): This baseline focuses solely on the diversity of in-context examples, irrespective of their semantic proximity to the test input. In the context of data-to-text generation, diversity is examined from two perspectives:
-
• Data-based Centroid (DCCS w/o second clustering): Structured data entries from the training set are embedded and clustered into
 $m$
groups using the K-Means algorithm. The centroids of these clusters are then selected as in-context examples.
$m$
groups using the K-Means algorithm. The centroids of these clusters are then selected as in-context examples. -
• Text-based Centroid (DCCS w/o first clustering): Similarly, the textual outputs associated with the training samples are embedded and clustered into
$m$
groups, with each cluster’s centroid used as an in-context example.


As shown in Tables 12 and 13, under the same low-time-complexity constraint, approaches that consider only similarity (Nearest Cluster) or only diversity (Data-based Centroid and Text-based Centroid) score lower than our DCCS method on every dataset. A similarity-only strategy fails to ensure adequate semantic coverage of the example space, leading to many redundant in-context demonstrations. In contrast, a diversity-only strategy selects demonstrations that are semantically too distant from the test input, so the language model learns little beyond the desired output format.
4.2.4 Batched-generation performance
Tables 8, 9, and 10 report BLEU scores for different batched generation strategies across the E2E, DART, WebNLG, and ToTTo datasets, evaluated with GPT-3.5, GLM-3, and LLaMA-3.1. The proposed DCCS-Batch method consistently outperforms baseline approaches, demonstrating robust effectiveness in enhancing data-to-text generation quality.
For GPT-3.5, DCCS-Batch consistently surpasses other methods. On the E2E dataset, it achieves a BLEU score of 53.2 with a batch size of 5 – substantially outperforming the Random-Batch baseline (46.4). Similarly, it obtains scores of 44.5 on WebNLG and 30.7 on ToTTo, highlighting its ability to maintain output accuracy while controlling prompt length. Across GLM-3 and LLaMA-3.1, DCCS-Batch remains competitive, consistently outperforming both Text-based and Data-based Centroid baselines under both 5-shot and 10-shot configurations. These findings indicate that in batched generation scenarios, our method achieves more accurate outputs than both random selection and diversity-only strategies.
Overall, DCCS-Batch achieves the highest BLEU scores in most evaluation settings. By effectively balancing semantic similarity and textual diversity, it optimizes token efficiency while preserving high-quality generation.
4.2.5 Statistical analysis
Table 14 shows that, in the 5-shot GPT-3.5 setting, our DCCS method significantly outperforms the Random baseline (
 $p\lt 0.05$
) on BLEU, ROUGE-L, and BERTScore across the E2E, DART, and WebNLG datasets. Even on the domain-specific and relatively homogeneous E2E corpus, DCCS achieves notable improvements, demonstrating its ability to retrieve semantically complementary demonstrations within a narrow domain. For the more heterogeneous DART and WebNLG datasets, DCCS yields the largest gains, often with
$p\lt 0.05$
) on BLEU, ROUGE-L, and BERTScore across the E2E, DART, and WebNLG datasets. Even on the domain-specific and relatively homogeneous E2E corpus, DCCS achieves notable improvements, demonstrating its ability to retrieve semantically complementary demonstrations within a narrow domain. For the more heterogeneous DART and WebNLG datasets, DCCS yields the largest gains, often with
 $p\lt 0.001$
, reflecting its effectiveness in selecting demonstrations that balance relevance and diversity.
$p\lt 0.001$
, reflecting its effectiveness in selecting demonstrations that balance relevance and diversity.
Statistical comparison of the DCCS and Random methods on E2E, DART, and WebNLG datasets in 5-shot setting using GPT-3.5. Metrics include BLEU, ROUGE-L, and BERTScore. The t-test results (t-value and p-value) indicate that DCCS significantly outperforms Random across most metrics (p < 0.05)

We further conducted a one-way repeated-measures ANOVA followed by Tukey’s HSD to compare the four selection strategies – DCCS, KATE, BM25, and Random – on each dataset. The main effect of method is significant for every dataset (minimum
 $F_{3,16}=10.91$
,
$F_{3,16}=10.91$
,
 $p\lt 0.001$
,
$p\lt 0.001$
,
 $\eta ^{2}=0.26$
). Tukey-HSD confirms that DCCS significantly outperforms Random on all datasets; however, its advantage over KATE is not statistically significant. The complete Tukey matrices are provided in Appendix Table C1.
$\eta ^{2}=0.26$
). Tukey-HSD confirms that DCCS significantly outperforms Random on all datasets; however, its advantage over KATE is not statistically significant. The complete Tukey matrices are provided in Appendix Table C1.
4.2.6 Determine the number of clusters
Average Silhouette Coefficient across varying cluster counts for the (a) E2E (top left), (b) DART (top right), (c) WebNLG (bottom left), (d) and ToTTo (bottom right) datasets. The number of clusters with the highest coefficient is chosen for the first clustering.
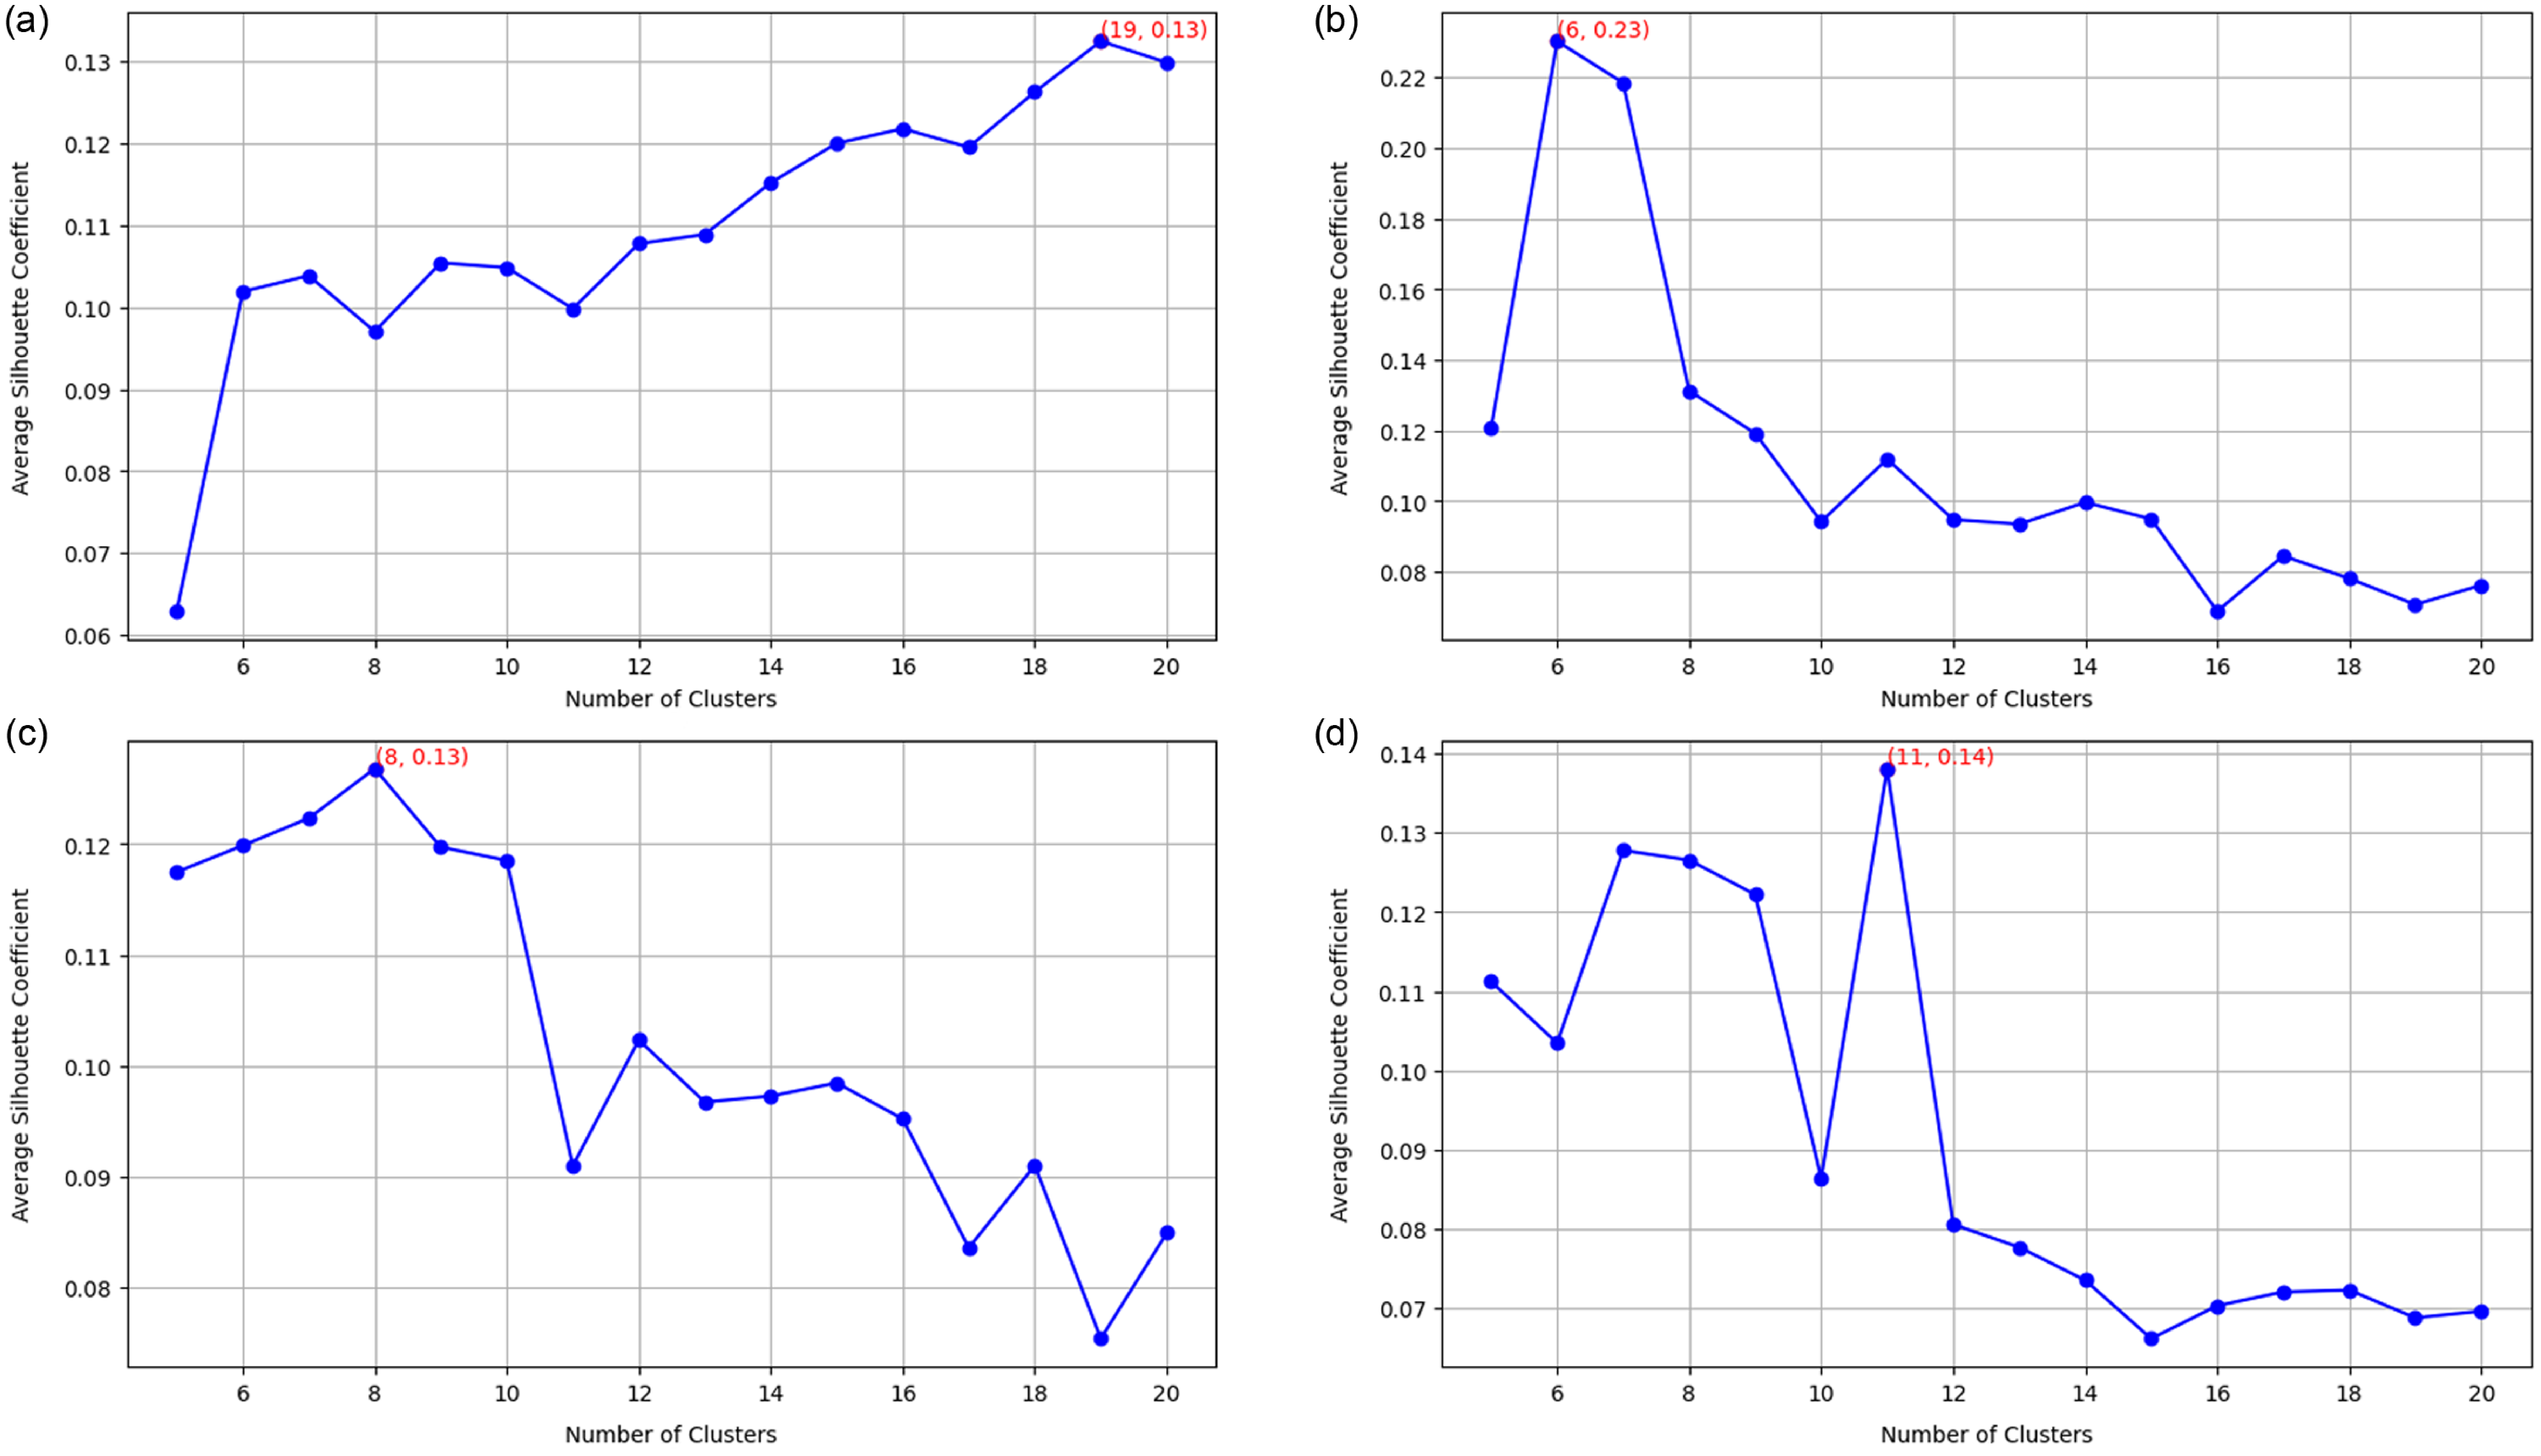
We select the number of clusters for the first clustering in the DCCS method based on the number that maximizes the average silhouette coefficient. The silhouette coefficient measures how similar a sample is to its own cluster compared to other clusters, with higher values indicating more cohesive clustering. Therefore, a higher average silhouette coefficient suggests better clustering quality.
We computed the average silhouette coefficient for all training samples while varying the number of clusters from 5 to 20 for each dataset. Figure 6 presents the average silhouette coefficient across training samples for the E2E, DART, WebNLG, and ToTTo datasets.
Based on these comparisons, we selected the number of clusters with the highest silhouette coefficient for the first clustering step. Specifically, we set the number of clusters to 19 for E2E, 6 for DART, 8 for WebNLG, and 11 for ToTTo.
4.2.7 The role of in-context examples’ similarity
We compare similarity-based example selection methods (e.g., KATE, BM25) with those emphasizing diversity (e.g., clustering by data or text) and observe that merely pursuing diversity does not consistently improve performance in data-to-text generation. As shown in Table 3, prioritizing semantic similarity provides stronger guidance for mapping structured data into coherent and faithful text. While diverse examples can theoretically broaden the model’s generalization, their contribution is constrained if the examples are not closely aligned with the input data.
Nevertheless, our experiments also indicate that the highest possible similarity is not strictly necessary. Moderate relaxation of similarity criteria can still maintain content fidelity and textual quality while reducing computational costs. In particular, selecting a sufficiently similar yet not overly redundant set of examples helps retain the benefits of semantic alignment without inflating the inference load. This balance is demonstrated by our DCCS approach, which applies a two-stage clustering: first, we narrow down candidate examples by cluster centroids to cut down on exhaustive comparisons; second, we diversify the final selection of
 $m$
in-context samples to cover a broader semantic space. By ensuring that each chosen example is both relevant and not excessively repetitive, we achieve robust generation performance with lower overhead.
$m$
in-context samples to cover a broader semantic space. By ensuring that each chosen example is both relevant and not excessively repetitive, we achieve robust generation performance with lower overhead.
4.2.8 Case study: the role of in-context examples’ diversity
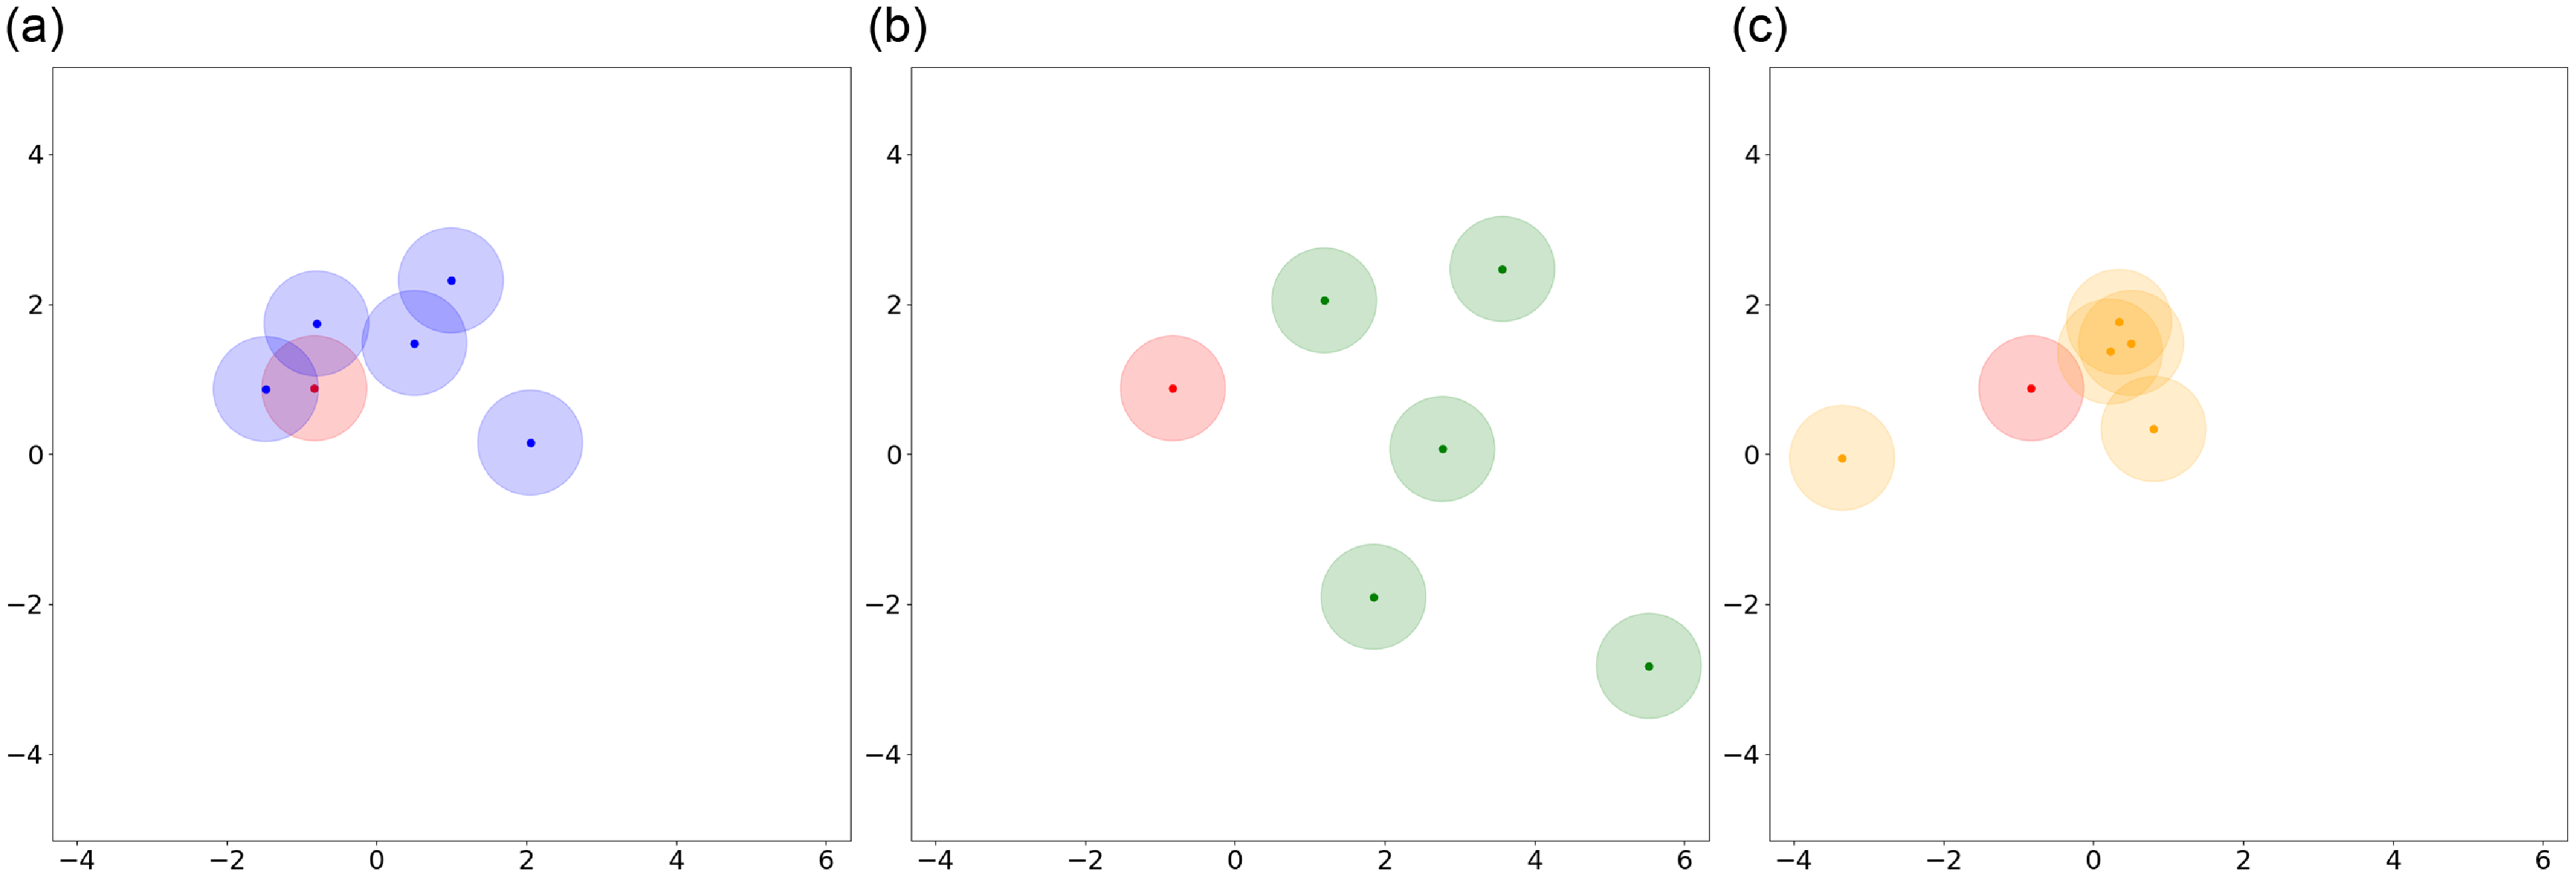
Table 15 presents a test example from the WebNLG dataset (5-shot setting) with three groups of in-context examples selected by Data-based Centroid, Nearest Cluster, and DCCS. Figure 7 visualizes the semantic distribution of these examples, where each text is encoded using RoBERTa-large and then reduced to two dimensions via PCA. Blue points represent examples selected by the DCCS method, green points by Data-based Centroid, gold points by Nearest Cluster, and red points indicate the reference text.
A test sample with three groups of in-context examples selected by Data-based Centroid, Nearest Cluster, and DCCS from the WebNLG dataset in 5-shot setting

Compared to the Data-based Centroid method, our DCCS approach achieves a superior balance between diversity and relevance. Although the Data-based Centroid method selects cluster centers to maximize semantic diversity (as evidenced by the wider green distribution in Figure 7), this approach often positions cluster centers farther from the desired reference text (red points). Such misalignment can result in prompts containing in-context examples that fail to adequately capture the semantic content needed to guide the model toward generating outputs closely aligned with the reference text.
In contrast, the Nearest Cluster method improves the likelihood of selecting in-context examples that are closer to the reference text (red points), owing to its focus on relevant clusters. However, by randomly sampling in-context examples within a cluster, the method neglects semantic diversity, frequently resulting in examples with overlapping semantic coverage. This overlap diminishes the ability of the prompt to encompass a broad range of semantic contexts related to the reference text.
By incorporating a second clustering step, DCCS addresses the limitations of both approaches. It ensures relevance by focusing on clusters proximal to the test input while simultaneously enhancing diversity within the selected cluster. This dual-layered approach allows DCCS to generate prompts that both represent a wide semantic space and maintain strong alignment with the reference text, leading to improved generation quality.
4.3 Efficiency evaluation results
From the automated evaluation results, we observed significant improvements with our DCCS method compared to random and diversity-based approaches. While the accuracy improvement of our method over similarity-based methods such as KATE and BM25 was not as prominent (achieving second-best results in some cases), DCCS demonstrated substantial efficiency gains. These efficiency improvements are evident in two aspects: Time Efficiency and Cost Efficiency.
Semantic representation of in-context examples selected by different methods. (a) Blue points represent the DCCS method, (b) Green points represent the Data-based Centroid method, (c) Orange points represent the Nearest Cluster method, and Red points indicate reference text.
4.3.1 Time efficiency
Compared to existing methods that require comparisons with all samples in the training set, our method necessitates comparison with only
 $K$
clustering centers,
$K$
clustering centers,
 $K$
is significantly smaller than the number of training set size. To demonstrate the efficiency improvement of our method in prompt generation, we compared the average time required to construct the prompt for each input to the test across four datasets using different methods. We selected 5 in-context examples. The training datasets consist of the following sample sizes: 4,862 samples for the E2E dataset, 6,940 samples for the WebNLG dataset, 30,526 samples for the DART dataset, and 120,761 samples for the ToTTo dataset. Due to the need for embedding structural data whenever test data is received and then comparing these embeddings with those from the training set, a significant amount of time is consumed. Therefore, we pre-generated and saved the embedding results of the training set to optimize the process.
$K$
is significantly smaller than the number of training set size. To demonstrate the efficiency improvement of our method in prompt generation, we compared the average time required to construct the prompt for each input to the test across four datasets using different methods. We selected 5 in-context examples. The training datasets consist of the following sample sizes: 4,862 samples for the E2E dataset, 6,940 samples for the WebNLG dataset, 30,526 samples for the DART dataset, and 120,761 samples for the ToTTo dataset. Due to the need for embedding structural data whenever test data is received and then comparing these embeddings with those from the training set, a significant amount of time is consumed. Therefore, we pre-generated and saved the embedding results of the training set to optimize the process.
Table 11 shows that there is a positive correlation between the processing time of both KATE and DPP methods and the size of the dataset. In contrast, our method exhibits considerably more consistent and faster performance. The time cost is approximately 23.84, 24.17, 24.41, and 24.45 ms across different datasets. This consistency can be attributed to the fact that the largest time expenditure in prompt generation lies in the comparison of distances between samples. These experiments indicate that our DCCS method indeed manages to significantly reduce the time required to construct prompts for each input while ensuring the effectiveness of the selected in-context examples.
For frequency-based search method(e.g., BM25), although it does not incur the time cost of embedding the text, its performance significantly lags behind vector-based representations when dealing with large training datasets (such as the ToTTo dataset). This is because for each query term, the BM25 algorithm needs to search through all documents and calculate its contribution, which substantially increases the computation time as the size of the document collection grows.
DCCS-Batch requires slightly less time per sample compared to DCCS. This is because, even though both methods involve the same number of distance computations for each test input, DCCS must extract in-context examples from the training set for every individual test sample, whereas DCCS-Batch only needs to perform this extraction once per batch.
4.3.2 Cost efficiency
We measure efficiency in terms of the average number of tokens per instance (TpI), encompassing both input and output tokens. In principle, using larger batch sizes allows for higher token utilization because the fixed overhead of prompt tokens is amortized across multiple test samples. However, we observed in our experiments that excessively large batch sizes can cause the model to lose focus on individual test samples. This problem, which we call Generation Failure, occurs when the model fails to produce the correct number of sentences corresponding to the batch size or otherwise deviates from the required output.
Figure 8 presents the generation failure rate and token utilization rate at different batch sizes using the DCCS method. The results suggest that a batch size of 5–10 strikes a balance between low generation failure and efficient token usage. For example, on the WebNLG dataset, using a batch size of 5 reduced token usage to 32.43% of the single-generation baseline, while a batch size of 10 lowered it further to 23.59%. Under OpenAI’s GPT-3.5 pricing as of May 21, 2024 ($0.0005 per 1K input tokens and $0.0015 per 1K output tokens for gpt-3.5-turbo-0125), these token savings translated into cost reductions of 60.85% and 68.84%, respectively.
The change in Generation Failure Rate and the Average Number of Tokens per Instance (TpI) with increasing batch size.
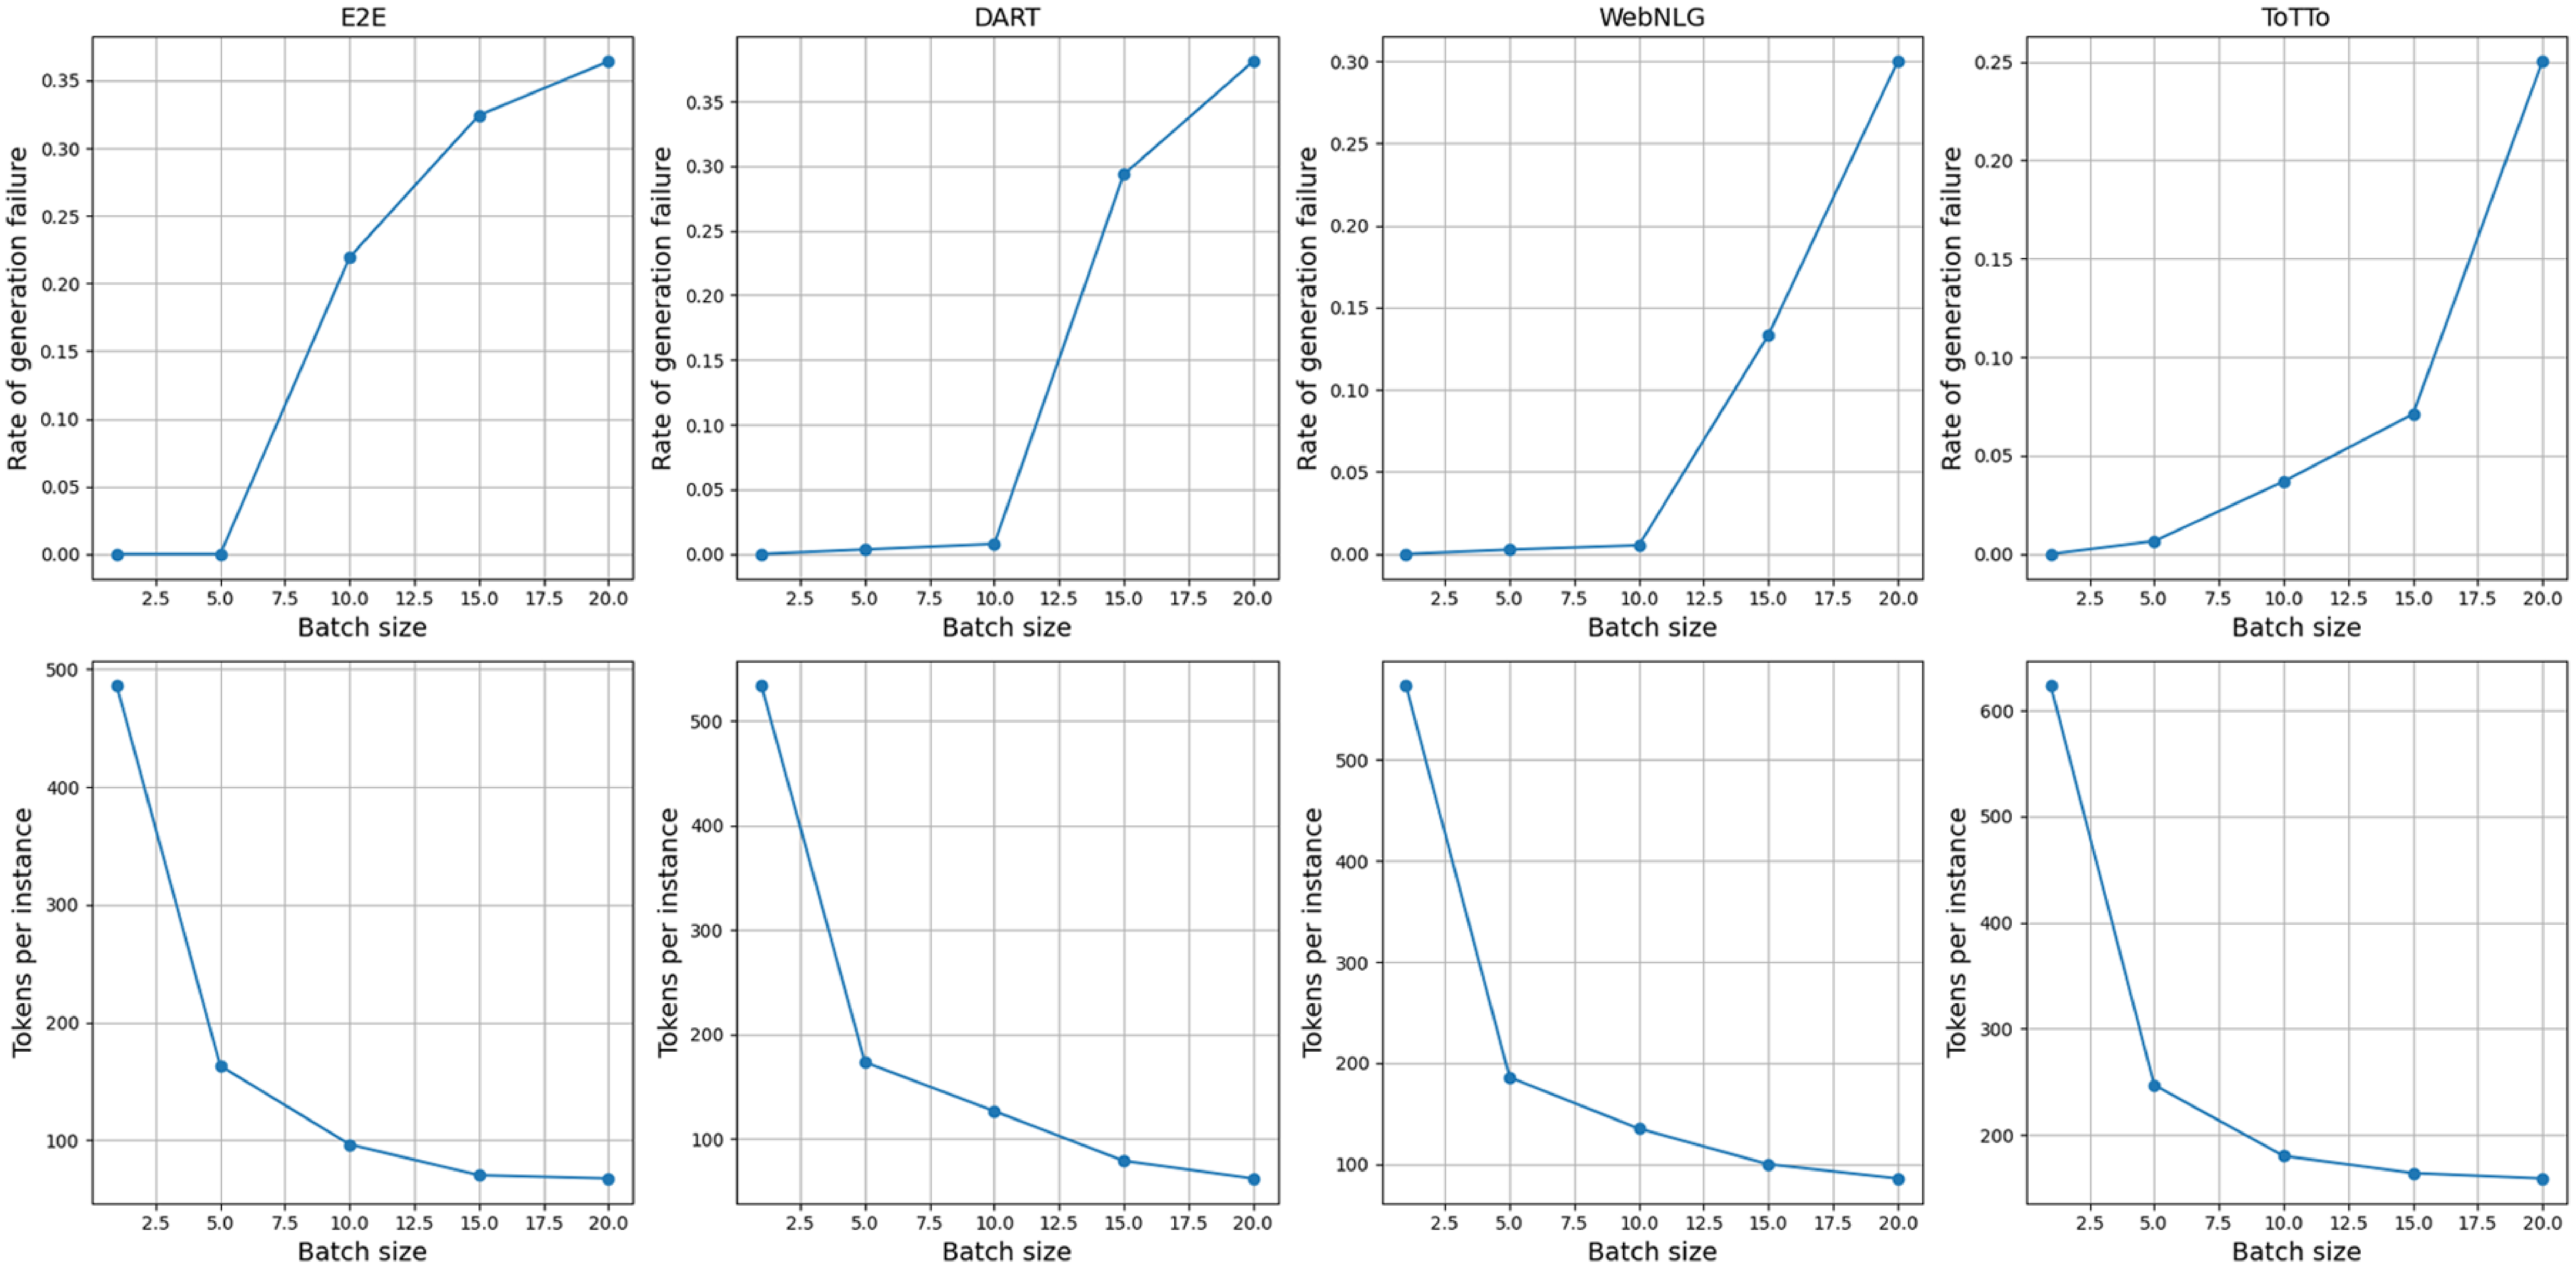
4.4 Human evaluation results
In addition to automated evaluation, we conducted a human evaluation study on the E2E, DART, and WebNLG datasets. Following widely used text generation criteria (van der Lee et al. Reference van der Lee, Gatt, van Miltenburg and Krahmer2021; Fu et al. Reference Fu, Ng, Jiang and Liu2023), we adopted three assessment dimensions – Fluency, Informativeness, and Relevance – to evaluate the text generated by the LLMs. Below are the definitions of these dimensions (Fu et al. Reference Fu, Ng, Jiang and Liu2023):
-
• Fluency: Is the generated text well-written and grammatically correct?
-
• Informativeness: How well does the generated text capture the key ideas of the source data?
-
• Relevance: How closely is the generated text related to the source data?
We employed the Categorical Choice method to compare the DCCS method against KATE and Random. Empirical studies have shown that, in human evaluation tasks for text generation, asking participants to select the best or worst outcome is more reliable and consistent than using Likert scale-based scoring (van der Lee et al. Reference van der Lee, Gatt, van Miltenburg and Krahmer2021). For Fluency, participants directly compared the paired outputs for each test sample. For Informativeness and Relevance, participants were provided with the input data fed to the LLM before comparing the paired outputs for each test sample. All sentences were produced by GPT-3.5 using five in-context examples selected by the respective method. For each dataset, we created 200 sentence pairs, giving 600 comparisons overall. Six graduate-level NLP researchers – none otherwise involved in the project – independently chose the better sentence in every pair. Fleiss’
 $\kappa$
across the six raters was 0.63, indicating substantial agreement.
$\kappa$
across the six raters was 0.63, indicating substantial agreement.
Table 16 reports, for each criterion, the percentage of comparisons in which the DCCS output was preferred to the baseline (KATE or Random). DCCS is consistently favored over Random across all datasets and criteria, confirming the value of principled example selection. Compared with KATE, DCCS achieves higher preference rates on most metrics – particularly informativeness and relevance on the more heterogeneous DART and WebNLG sets – even though KATE requires substantially higher computation.
Average human evaluation scores (in percentage) for DCCS-generated outputs compared to KATE and Random across Fluency, Informativeness, and Relevance dimensions

Human evaluation of factual consistency for GPT-3.5 outputs on the E2E, DART, and WebNLG datasets (Hallucination
 $\downarrow$
, Missing Fact
$\downarrow$
, Missing Fact
 $\downarrow$
, Accurate
$\downarrow$
, Accurate
 $\uparrow$
).
$\uparrow$
).
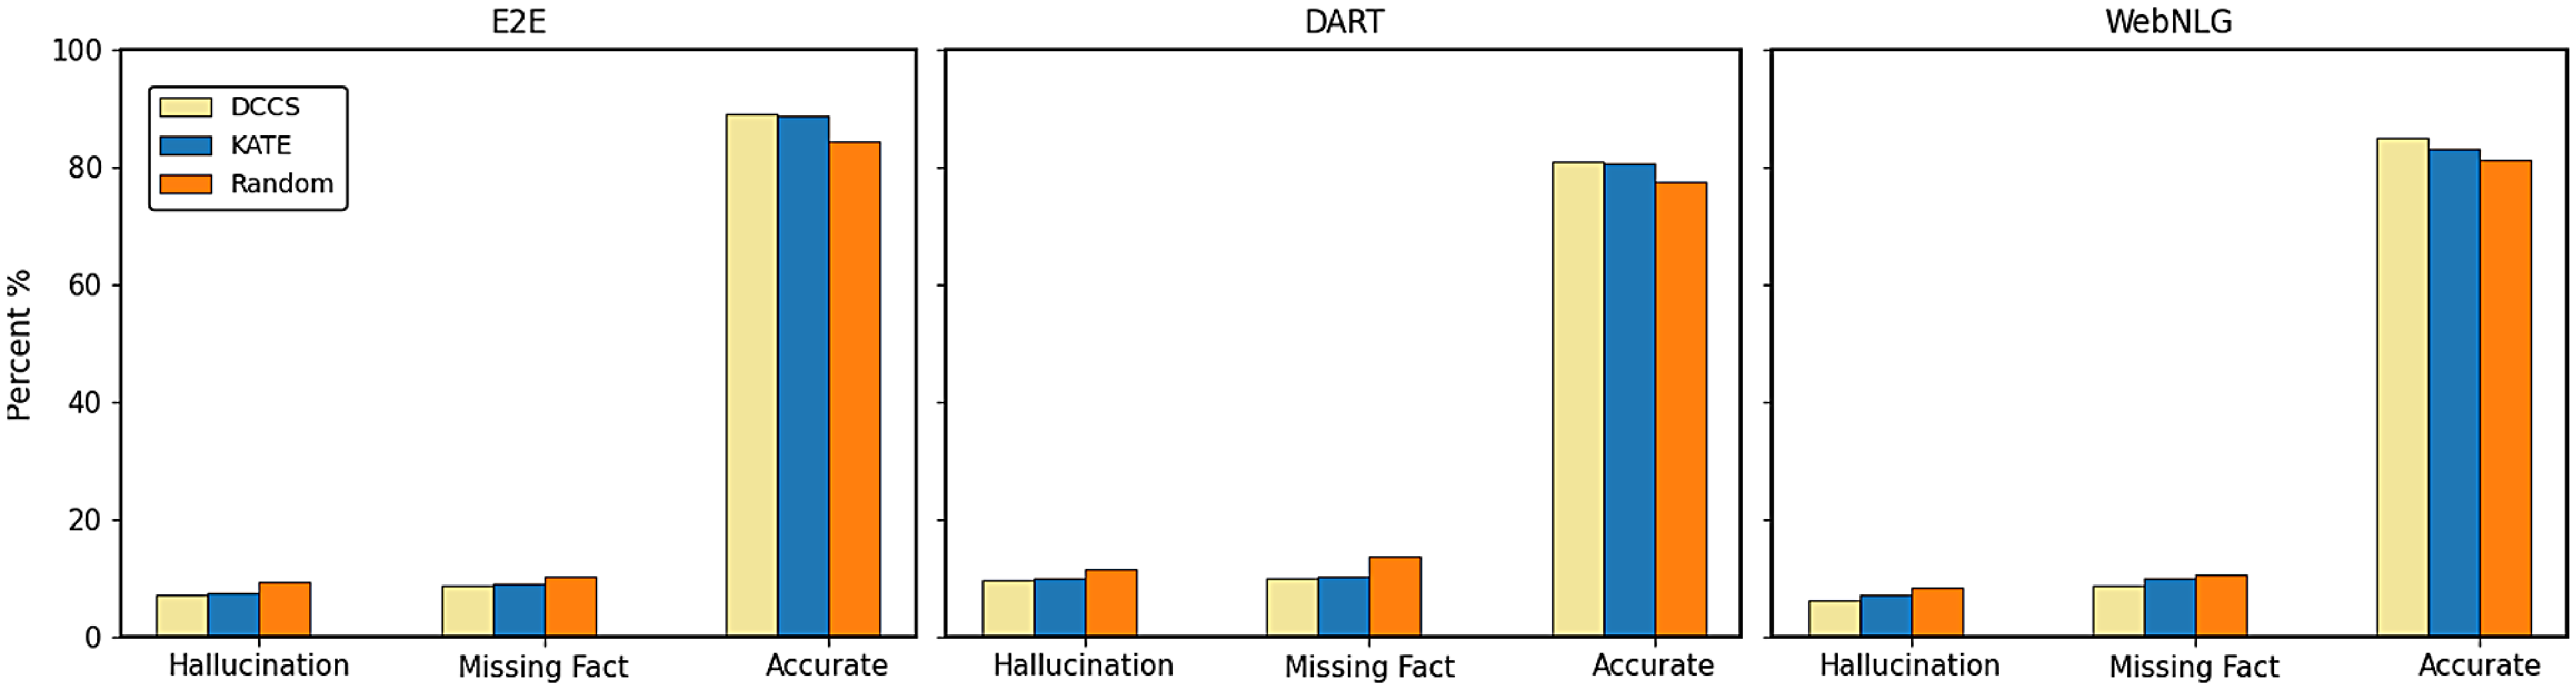
4.5 Factual consistency metrics
To complement the subjective criteria above, we also assessed factual consistency. Following Li et al. Reference Li, Li, Geng, Yang, Li, Yuan, He, Yuan, Ma and Huang(2024), each output was checked for two non-exclusive errors – Hallucination and Missing Fact. A sentence is labeled Accurate only when neither error is present.
Six annotators, independent of the study, each labeled 100 sampled test instances per dataset. Source triples or table rows were displayed alongside the three candidate sentences. Annotators marked both error types, and Accurate was derived automatically as no Hallucination & no Missing Fact.
Figure 9 shows the proportion of sentences exhibiting each error. DCCS produces the fewest hallucinations and omissions across all datasets, yielding the highest share of accurate outputs. These findings echo the human-preference results in Table 16: the dual-clustering strategy not only enhances perceived informativeness and relevance but also markedly improves factual fidelity.
5. Limitations and future work
Although our proposed in-context example-selection method improves accuracy, prompt-construction efficiency, and generation speed for data-to-text tasks, several limitations remain.
First, certain error types persist even under the DCCS framework. We still observe missing facts, where salient input fields are omitted; hallucinations, where information unsupported by the input is introduced; and output-format errors, which occur in batch generation, particularly when the batch size exceeds ten. Our analysis indicates that these errors become more pronounced when the training examples selected for a cluster differ structurally from the test instance (e.g., in field count or entity type). While dual clustering improves relevance and diversity, it does not fully guarantee factual completeness or consistency. Future work will explore incorporating chain-of-thought prompting and LLM self-revision to mitigate these issues.
Second, anchoring and attribution remain practical concerns. In our current benchmarks (WebNLG, E2E, DART, and ToTTo), each test instance contains fewer than ten triples or table rows, allowing us to directly present the raw input data. However, when the method is applied in larger-scale scenarios – such as enterprise reporting or knowledge-base verbalization – each generated fact should be explicitly paired with its provenance. Providing verifiable provenance enables readers to quickly validate each statement and correct any factual errors introduced by the model.
6. Conclusion
In this paper, we presented a method to enhance data-to-text generation using LLMs by focusing on the effective selection of in-context examples through our Double Clustering-based in-Context example Selection (DCCS) method. This method emphasizes the importance of example similarity and diversity, and, along with the proposed batched generation method, significantly improves efficiency and performance in text generation tasks.
Comparison of BLEU scores between fine-tuned state-of-the-art (SOTA) models and our DCCS-based in-context learning (ICL) method using 5-shot prompts across different base models and datasets

Our experimental findings on various datasets demonstrate the potential of our approach to significantly improve LLM performance. This success opens avenues for further research into more personalized text generation and the application of our methods across a broader spectrum of tasks and models. By doing so, we aim to increase the utility and personalization of language model outputs for diverse user needs.
Future work could explore further optimization of the clustering process, the application of our method to other types of generation tasks, and the integration of additional contextual information to further enhance the personalization and relevance of generated outputs.
Acknowledgements
This work was partially supported by the National Natural Science Foundation of China (No. 62072153), the Anhui Provincial Key Technologies R&D Program (No. 2022h11020015), and the 111 Center (No. B14025).
Appendix A. Additional Single Generation Experiment Results
Comparative results of data-to-text generation using GPT-3.5 on the E2E, DART, and WebNLG (100 test samples) in a 10-shot setting. The best performance per metric is shown in bold and the second-best result is underlined

Comparative results of data-to-text generation using GPT-3.5 on the ToTTo (100 test samples) in a 10-shot setting. The best performance per metric is shown in bold and the second-best result is underlined

Comparative results of data-to-text generation using GLM-3 setting on the E2E, DART, and WebNLG (100 test samples) in a 10-shot setting. The best performance per metric is shown in bold and the second-best result is underlined

Comparative results of data-to-text generation using Llama-3.1 on the E2E, DART, and WebNLG in a 10-shot setting. The best performance per metric is shown in bold and the second-best result is underlined
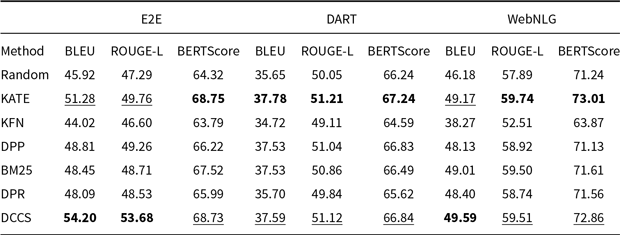
BLEU and PARENT on ToTTo using Llama-3.1 in a 10-shot setting. The best performance per metric is shown in bold and the second-best result is underlined
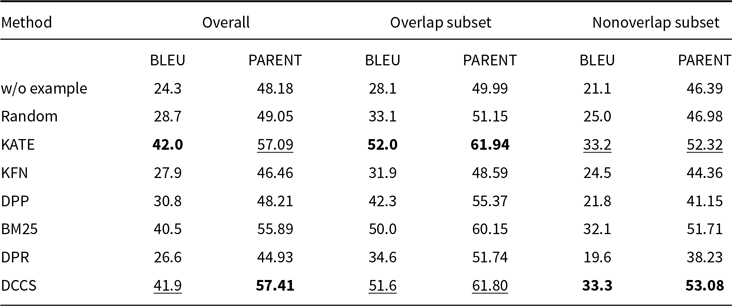
Appendix B. Additional Batched Generation Experiment Results
BLEU for batched generation on the E2E, WebNLG, DART and ToTTo using GPT-3.5 in a 10-shot setting. The best performance per dataset is shown in bold

BLEU for batched generation on the E2E, WebNLG, DART and ToTTo using GLM-3 in a 10-shot setting
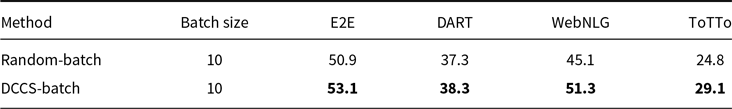
BLEU for batched generation on the E2E, DART, WebNLG and ToTTo using Llama-3.1 in a 10-shot setting. The best performance per dataset is shown in bold

Appendix C. Additional Statistical Analysis Result
Tukey–HSD pairwise comparisons on BLEU (
 $\Delta$
= G2–G1). Bold
$\Delta$
= G2–G1). Bold
 $p\lt 0.05$

Appendix D. Choice of the Secondary-Cluster Size
Following prior work on in-context example selection Liu et al. Reference Liu, Shen, Zhang, Dolan, Carin and Chen(2022b), we restrict the number of secondary clusters – and thus the number of in-context examples – to
 $m\in \{5,10\}$
throughout the paper. Figure D1 illustrates how BLEU varies with the number of in-context examples on the three datasets. All results were obtained with LLaMA-3.1-8B, using 100 randomly sampled test instances from each dataset. Preliminary runs showed that using fewer than five examples reduced performance, whereas increasing
$m\in \{5,10\}$
throughout the paper. Figure D1 illustrates how BLEU varies with the number of in-context examples on the three datasets. All results were obtained with LLaMA-3.1-8B, using 100 randomly sampled test instances from each dataset. Preliminary runs showed that using fewer than five examples reduced performance, whereas increasing
 $m$
beyond ten yielded no consistent BLEU gain while incurring noticeably higher prompt cost and latency. We therefore adopt
$m$
beyond ten yielded no consistent BLEU gain while incurring noticeably higher prompt cost and latency. We therefore adopt
 $m=5$
as the default setting and
$m=5$
as the default setting and
 $m=10$
as a high-accuracy variant.
$m=10$
as a high-accuracy variant.
BLEU scores on the E2E, DART, and WebNLG as a function of the number of in-context examples (
 $m$
).
$m$
).

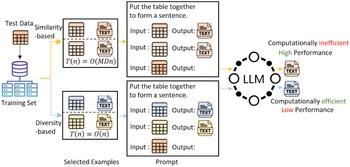


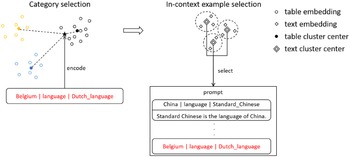


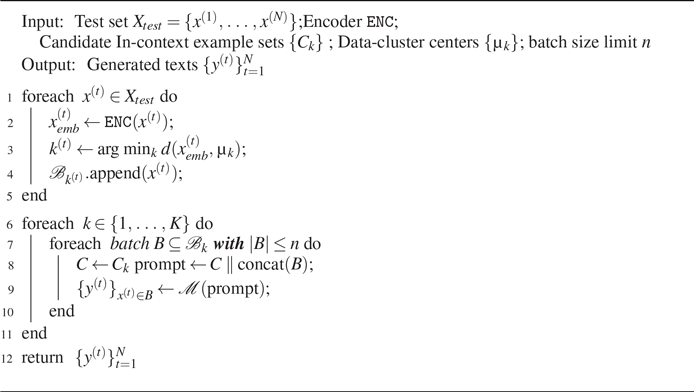

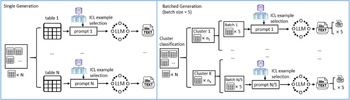
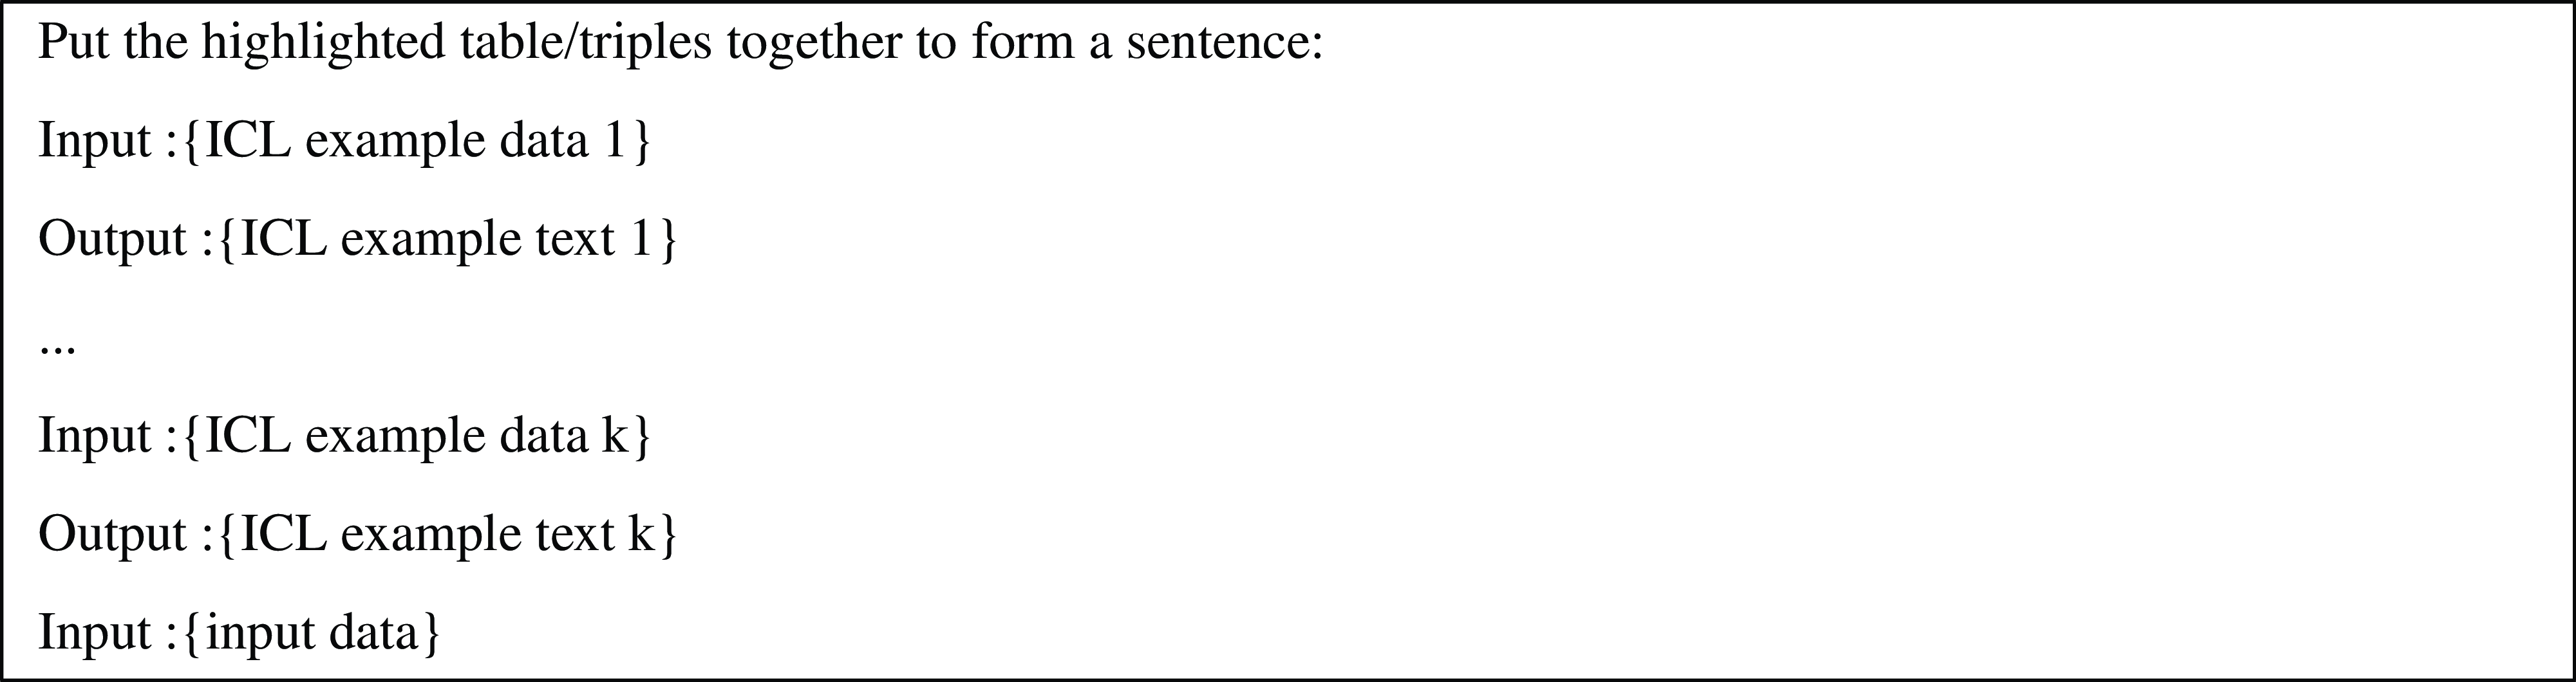

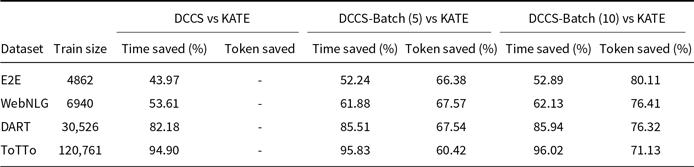

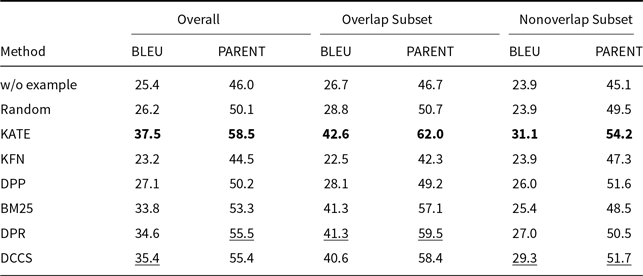
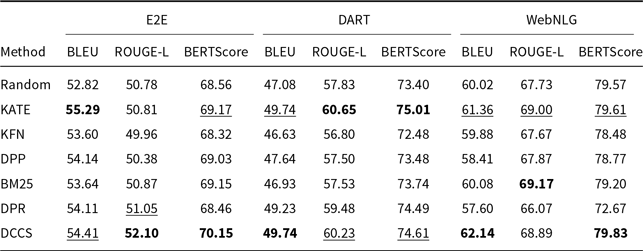


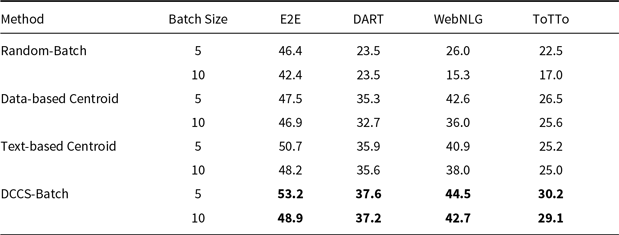
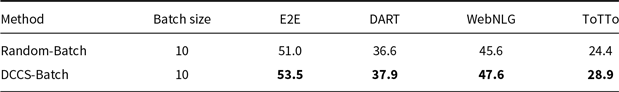
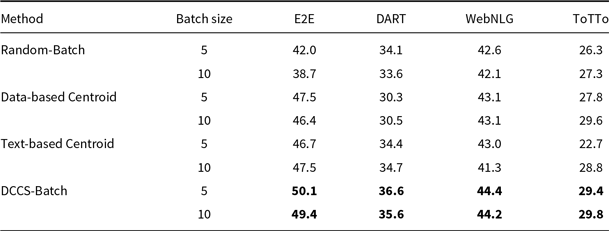

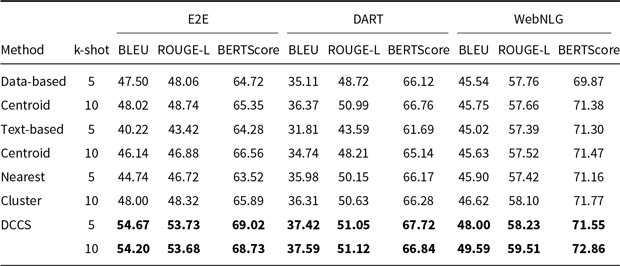
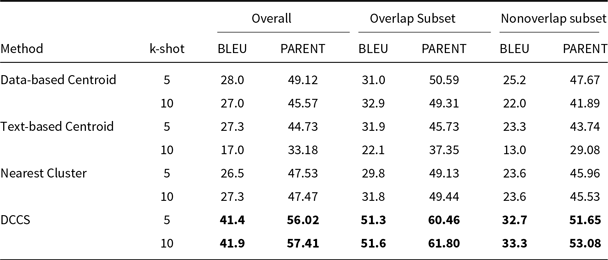
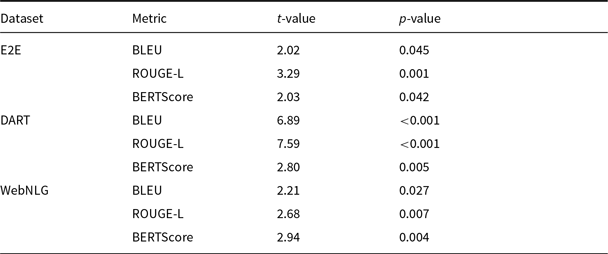

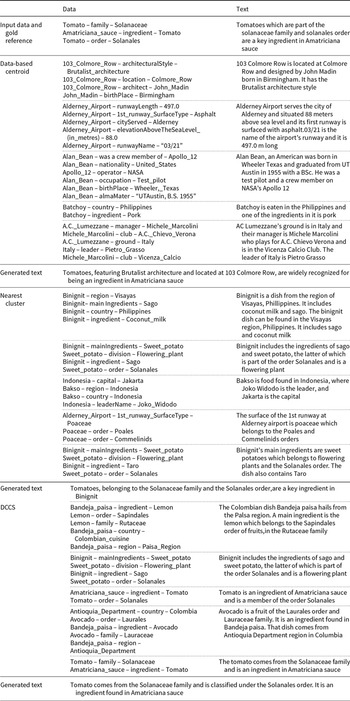

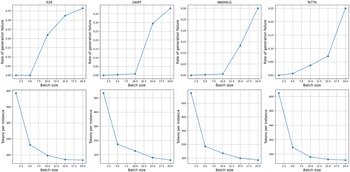
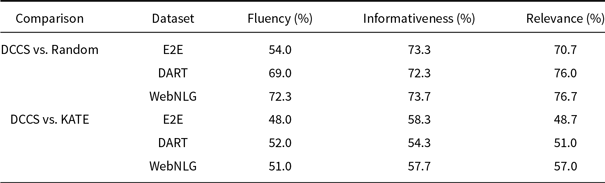


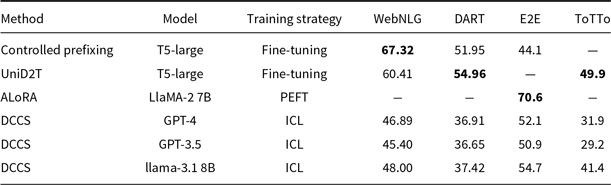
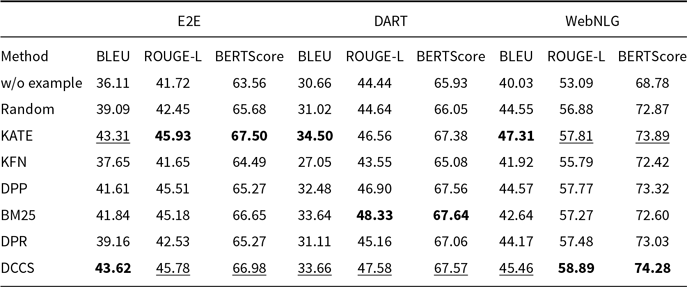
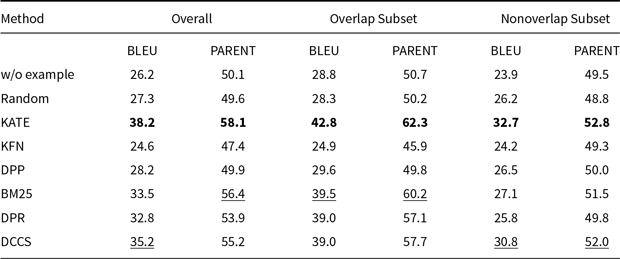
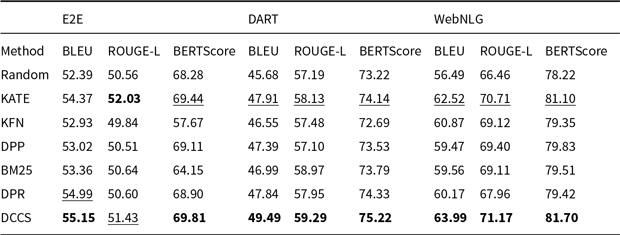


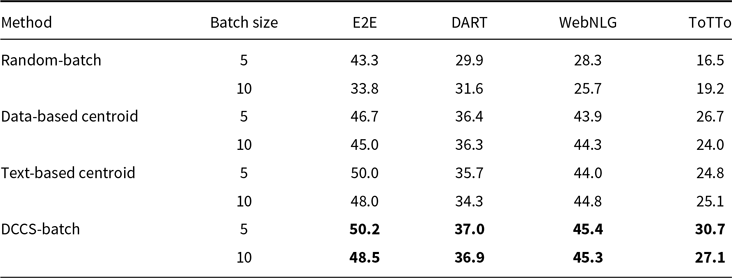

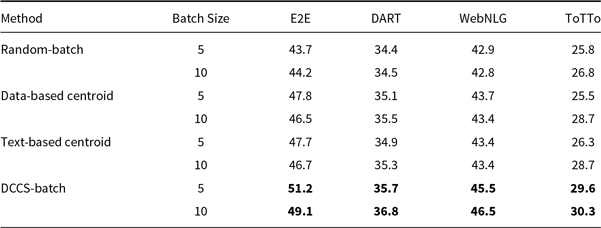
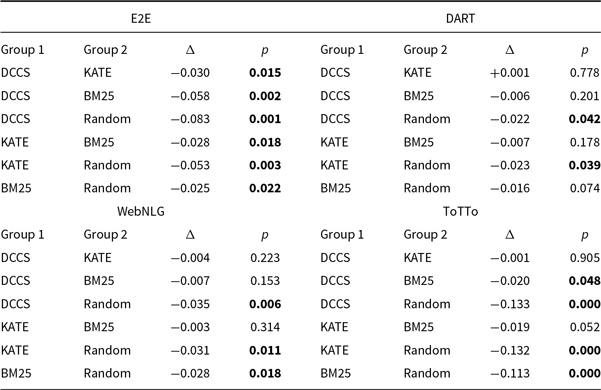


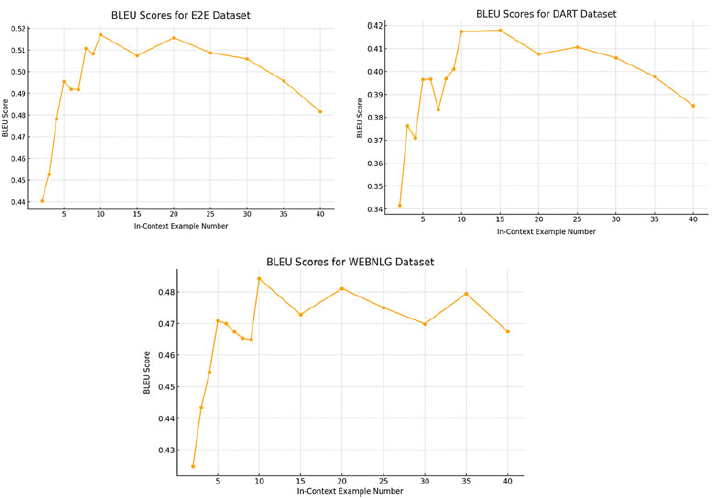


 Open access