


Introduction
Britain has now endured more than a decade of austerity, during which the real value of social benefits has been significantly diminished. Children were among the most vulnerable to these changes. Child poverty has risen significantly in the last few years and is projected to reach its highest recorded level at 33 per cent by the end of this decade if current policies remain in place (Clegg & Corlett, Reference Clegg and Corlett2025). While this shows the current challenges facing children today, the longer-term implications might even be more harmful. Annual figures capture how many children are poor at a given point in time, but do not give information on how long children remain in poverty. We know from the large literature on poverty dynamics that many households move in and out of poverty from year to year (e.g., Jenkins, Reference Jenkins2011). While many experience poverty only briefly, others remain in it for much longer. Austerity might have increased not only the number of children experiencing poverty but also the time they spend in it.
Growing up in poverty has well-documented negative consequences for children’s education, health, and long-term earnings (Cooper & Stewart, Reference Cooper and Stewart2021; Duncan et al., Reference Duncan, Magnuson and Votruba-Drzal2017; Ziol-Guest et al., Reference Ziol-Guest, Duncan, Kalil and Boyce2012). These effects are amplified with longer exposure: the longer a child lives in poverty, the more severe and lasting the harm (Cooper & Stewart, Reference Cooper and Stewart2021; Dickerson & Popli, Reference Dickerson and Popli2016; Lai et al., Reference Lai, Wickham, Law, Whitehead, Barr and Taylor-Robinson2019). Long-term childhood poverty is therefore not only a concern for current well-being but also a driver of future poverty, reinforcing cycles of poverty across generations.
Despite its importance, we know relatively little about the extent and evolution of long-term childhood poverty. Some studies suggest that persistent poverty became more common in countries such as Sweden (Mood, Reference Mood2015), the Netherlands (Snel et al., Reference Snel, Reelick and Groenenboom2013), and Germany (Groh-Samberg, Reference Groh-Samberg and Lutz2017) during the 1990s and 2000s, often linked to a lack of stable and well-paid jobs and inadequate minimum income support. In the UK, existing evidence for children mainly focuses on shorter periods.Footnote 1 Moreover, most studies adopt a household rather than child-centred perspective and typically compare poverty across time periods rather than birth cohorts, making it difficult to disentangle life-cycle effects from generational shifts. As a result, we still know little about how widespread long-term childhood poverty is, how it has changed across cohorts, and what factors explain these shifts.
In this paper, we provide new evidence on the trends and drivers of long-term childhood poverty in Britain. Adopting a life-course perspective, we track children from birth to age ten and analyse trends in long-term childhood poverty across successive birth cohorts from 1991 to 2017. This perspective circumvents the problem of left- and right-censoring by fixing the observation period to a specific life stage and allows us to calculate the prevalence of long-term poverty, enabling a cohort comparison. While missing data and attrition remain concerns, we address these using longitudinal imputation and weighting strategies. Our main measure defines long-term poverty as spending at least half of childhood in poverty, though we test alternative thresholds in robustness checks.
We first present cohort-level trends in long-term childhood poverty and then examine its drivers. To examine drivers, we apply two different methods. First, we examine the role of risk factors related to work-family characteristics using Kitagawa-Oaxaca-Blinder (KOB) decomposition, following the prevalence and penalty framework developed by Brady et al. (Reference Brady, Finnigan and Hübgen2017). Then, we explore how changes in household earnings (predistribution) and the tax-benefit system (redistribution) shape these trends using a sequential income accounting and Shapley decomposition.Footnote 2
This paper makes four main contributions to the literature. First, it provides new evidence showing that the long-term childhood poverty remains a significant problem in Britain. Across the 1991–2017 birth cohorts, around 17 per cent of children experienced poverty for at least half of their childhood. Levels declined for those born in the late 1990s but rose sharply for cohorts born after 2012, when austerity measures took effect. Second, it shows that cross-cohort changes in long-term poverty are driven more by shifts in the penalties associated with work–family risk factors than by changes in their prevalence. These penalties reflect broader shifts in redistribution (e.g., reductions in child benefits) and predistribution (e.g., higher employment or relative earnings growth among at-risk groups). Third, it demonstrates that changes in redistribution affect not only current but also long-term childhood poverty, indicating that transfers play a crucial role beyond lifting households out of temporary poverty. Finally, it highlights the role of predistribution in shaping long-term poverty trends and emphasises the importance of balancing redistribution with strategies that raise the earnings of low-income families relative to the median.
What can explain cross-cohort trends in long-term childhood poverty?
While some studies investigate why individuals or households remain in poverty persistently (e.g., Biewen, Reference Biewen2009), there is relatively little discussion of the factors driving long-term poverty trends at the aggregate level. Assuming that the determinants of overall child poverty trends also shape long-term poverty, two broad explanations can be considered: redistribution and predistribution.
In the UK, redistribution for families with children changed significantly during our observation period through two major reform periods. The first was the post-1997 welfare reforms, which substantially expanded the level and coverage of child benefits and tax credits.Footnote 3 For example, child benefit for the first child rose by 25.3 per cent in real terms between April 1997 and April 2003. Reforms to child-related tax credits made these income top-ups more generous by increasing maximum entitlements, reducing taper rates, and introducing more generous childcare rebates; coverage was also widened by removing asset tests and work requirements for child-specific tax credits (Brewer & Hoynes, Reference Brewer and Hoynes2019).Footnote 4 Overall, spending on child-related benefits and tax credits rose by about 60 per cent in real terms between 1999 and 2006, an increase of roughly £11 billion (Stewart, Reference Stewart, Hills, Sefton and Stewart2009). These reforms substantially reduced child poverty between 1997 and 2010 (Joyce & Sibieta, Reference Joyce and Sibieta2013), helped counteract rising earnings inequality and contain household income inequality (Cribb et al., Reference Cribb, Joyce and Wernham2023), and likely contributed to the decline in long-term childhood poverty.
The second period began with the 2013 austerity reforms and was followed by harder measures in 2016 (Beatty and Fothergill, 2018; House of Commons Work and Pensions Committee, 2019) . These included the benefit freeze, the benefit cap, the bedroom tax, and the introduction of the two-child limit. The benefit freeze limited annual uprating of most working-age benefits to 1 per cent (2013–15) and then 0 per cent (2016–19) despite rising prices. This represented a substantial real-term cut for low-income households. The benefit cap set a maximum total amount a household could receive in benefits, regardless of assessed need, for example £26,000 per year initially, lowered to £20,000 (£23,000 in London) in 2016. It primarily affected larger families and renters in high-cost areas as the cap removed entitlement above the limit by cutting Housing Benefit or Universal Credit (UC) payments. Officially called the ‘under-occupancy penalty’, the bedroom tax reduced the Housing Benefit for social tenants deemed to have ‘spare’ bedrooms 14 percent cut for one extra room and 25 per cent for two or more. It applied only to working-age households, not pensioners. The policy aimed to encourage downsizing but often reduced incomes because many tenants had no smaller properties available. Introduced in April 2016, the two-child limit restricts the Child Tax Credit and UC so that families can only receive the child benefits for two children, with exceptions in limited cases (e.g., multiple births, non-consensual conception); so, the entitlements for the third and following children born after April 6, 2017 were permanently removed, regardless of income level. It is widely regarded as the main driver of rising child poverty, specifically among large families (Stewart et al., Reference Stewart, Patrick and Reeves2025).
The roll-out of UC during this period also reduced benefit levels. UC replaced six existing means-tested benefits and tax credits for those of working age, with one integrated benefit through the aim of simplification, effectiveness, and increasing incentives to work while potentially making the benefits more generous. It introduced a range of policy changes to taper rates, eligibility, conditionality, and earnings disregards that affected the generosity of the benefit system in complex ways, creating both winners and losers (Brewer et al., Reference Brewer, Joyce and Waters2019; Browne et al., Reference Browne, Hood, Joyce, Emmerson, Johnson and Joyce2016).Footnote 5 Since its initial proposal in 2013, UC’s design has changed substantially. In particular, work allowances, the amounts recipients can earn before benefits begin to be withdrawn, were significantly cut (Browne et al., Reference Browne, Hood, Joyce, Emmerson, Johnson and Joyce2016). Moreover, increasing conditionality and sanctions and expanding such conditions to working families likely lead some recipients to lose their benefits (Browne et al., Reference Browne, Hood, Joyce, Emmerson, Johnson and Joyce2016; Wright & Dwyer, Reference Wright and Dwyer2022).
Taken together, these changes are likely to have increased long-term childhood poverty for children spending most of their early years during this period. These measures disproportionately affected low-income households with children (Brewer et al., Reference Brewer, Joyce and Waters2019; De Agostini et al., Reference De Agostini, Hills and Sutherland2018). For example, Bourquin et al. (Reference Bourquin, Norris Keiller and Waters2019a) estimate that the poorest 10 per cent of households with children lost around 20 per cent of their income (about £4000) between 2010 and 2019. Moreover, Brewer et al. (Reference Brewer, Joyce and Waters2019) argue that UC hit the persistently poor harder than those with higher, longer-term incomes.
Predistribution, in the context of poverty, refers to the ability of households to avoid poverty through earnings; that is, the adequacy of earnings relative to the poverty threshold. Shifts in the labour market and family dynamics can strongly influence predistribution. First, the decline in worklessness and single-earner households during the 1990s, particularly among single-parent families (Bourquin et al., Reference Bourquin, Cribb, Waters and Xu2019b), likely reduced long-term poverty. This trend was partly driven by increased conditionality and the expansion of in-work benefits under the 1997 reforms (Avram et al., Reference Avram, Brewer and Salvatori2018; Blundell and Hoynes, Reference Blundell, Hoynes, Card, Blundell and Freeman2004). Second, over the past three decades, growing inequality in household earnings, combined with rising pensioner incomes, has pushed up median household income and thus the poverty threshold; as a result, the effectiveness of employment as a route out of poverty has declined (Cribb et al., Reference Cribb, Joyce and Wernham2023; Joyce & Ziliak, Reference Joyce and Ziliak2019).Footnote 6 Finally, the introduction of the National Minimum Wage in 2003, which became more prominent as a primary tool for boosting incomes in the 2010s, may have had only a limited impact on long-term childhood poverty, given that it is not well targeted toward low-income households and overall income gains are limited due to withdrawal of means-tested benefits as earnings increase (Brewer et al., Reference Brewer, May and Phillips2009; Cribb et al., Reference Cribb, Giupponi, Joyce, Lindner, Waters, Wernham and Xu2021).
It is useful to distinguish between the periods before and after 2008. The Great Recession, at least in the early aftermath until 2011, significantly reduced employment and increased earnings inequality in Britain, weakening the effectiveness of employment as a long-term route out of poverty (Belfield et al., Reference Belfield, Blundell, Cribb, Hood and Joyce2017; Brewer et al., Reference Brewer, Browne, Joyce and Sibieta2010; Joyce & Ziliak, Reference Joyce and Ziliak2019). Two factors partially offset these effects. First, benefit levels rose substantially in the aftermath of the crisis, well above inflation, resulting in real income growth in the bottom quartile of the distribution (Pacitti & Smith, Reference Pacitti and Smith2019).Footnote 7 Second, from 2011, the minimum wage increased sharply, likely boosting earnings for some of the households at the lower end of the distribution. However, its poverty-reducing impact was likely limited, as gains were largest in the middle of the income distribution, potentially raising the poverty threshold, and were offset by benefit withdrawal as earnings increased (Cribb et al., Reference Cribb, Giupponi, Joyce, Lindner, Waters, Wernham and Xu2021; Joyce & Ziliak, Reference Joyce and Ziliak2019). In this post-crisis context, especially for the later period, the more decisive factor was likely the impact of austerity reforms, which, as described above, likely had a substantial negative effect on long-term childhood poverty.
In terms of family dynamics, living in a single-parent household or in a large family (three or more children) is widely recognised as a major risk factor for child poverty, largely due to higher needs relative to earning potential, often linked to employment constraints such as care responsibilities (Stewart et al., Reference Stewart, Patrick and Reeves2025). While the number of single-parent households has increased in the UK, their effect on poverty has been limited (Brewer et al., Reference Brewer, Browne, Joyce and Sibieta2010), partly due to greater labour market participation among these families. Nevertheless, households with higher needs and lower earning potential are increasingly competing in a dual-earner society, where poverty thresholds largely reflect the income of two-earner households (Nieuwenhuis, Reference Nieuwenhuis2022), which in general might increase their risk of poverty. The proportion of households with three or more children fell during the 1990s and 2000s, likely limiting their aggregate impact. However, the poverty risk for large families fell sharply after the 1997 reforms but has risen substantially since 2013 (Stewart et al., Reference Stewart, Patrick and Reeves2025).
Bringing these together, the interplay between predistribution and redistribution is central to explaining long-term poverty trends. Many have argued that the impact of rising earnings inequality on poverty (and the resulting increase in the poverty threshold) was contained by the expansion of social transfers following the 1997 reforms, particularly in the 2000s (Brewer et al., Reference Brewer, Browne, Joyce and Sibieta2010; Cribb et al., Reference Cribb, Joyce and Wernham2023). In the 2010s, however, the rise in the minimum wage was insufficient to meaningfully strengthen predistribution, and the erosion of redistribution likely led to a rise in long-term childhood poverty for those who spent most of their early years during this period.
Analytical approach
To explain trends in long-term childhood poverty across cohorts, we apply two main approaches: (i) the prevalence-and-penalty framework using KOB decomposition (Brady et al., Reference Brady, Finnigan and Hübgen2017), and (ii) sequential income accounting (Caminada et al., Reference Caminada, Goudswaard, Wang and Wang2021).
The prevalence and penalty framework allows us to assess the role of work-family risk factors in explaining the variation in long-term poverty across cohorts. This method essentially compares poverty levels between two groups (e.g., a younger vs. an older cohort) and decomposes the difference into: (i) prevalence effects, differences in the share of population with a given risk between the two groups, and (ii) penalty effects, differences in the probability of poverty associated with that risk between the two groups. If cohort differences are mainly due to changes in the composition or levels of risk factors, the prevalence component will dominate; if they are due to changes in the extent to which risk groups are penalised, the penalty component will be larger. Penalty effects can be due to changes in earnings inequality and the poverty threshold (e.g., if it rises disproportionally relative to the earnings of risk groups) or the effects of taxes and transfers.Footnote 8 Following Brady et al. (Reference Brady, Finnigan and Hübgen2017), we include all risk factors in the model simultaneously to control for their overlap.
To directly assess the role predistribution vs. redistribution, we first apply the sequential accounting technique (Caminada et al., Reference Caminada, Goudswaard, Wang and Wang2021). We calculate poverty rate against the original poverty threshold (based on equivalised net household income) using different income definitions, starting with gross household income as the primary source, sequentially adding different income components. The differences in poverty rate between these definitions indicate the poverty-reducing effect of: (i) private transfers, (ii) social transfers, and (iii) taxes and social contributions (see Table 1).Footnote 9
Sequential income definitions and corresponding poverty-reducing effects
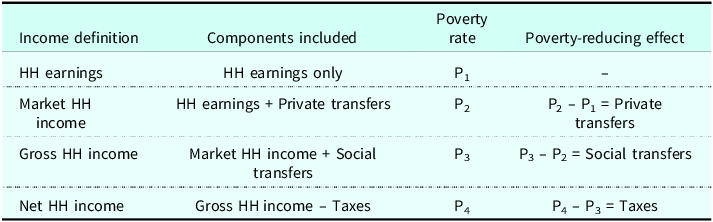
Notes: P1 to P4 represent the share of individuals with income below the poverty threshold (60 per cent of median net household income), which is fixed across all income definitions. Social transfers include both means-tested and non-means-tested transfers available in relevant periods. Private transfers include inter-house transfers, child maintenance, and investment income. Investment income is usually not considered as part of private transfers, but for simplicity we include them in this category, considering that their effect is usually limited for poverty reduction. Taxes also include social contributions, for example, those paid for the National Health Service.
While sequential income accounting is a common strategy to assess the role of redistribution in the field, it assumes that earnings are the primary income source and that all other components are added in a fixed order. Different ordering, for example, starting with social transfers and then adding earnings, can lead to different conclusions. To avoid this normative dependence on sequencing, we use a Shapley decomposition, which evaluates all possible orderings of income components and averages their marginal contributions (Shorrocks, Reference Shorrocks2013). We compare two cohorts and decompose the change in childhood poverty rates into the contributions of each income source, allowing us to assess the role of redistribution and predistribution in explaining cross-cohort trends.
Data and measures
We use data from the British Household Panel Survey (BHPS) and Understanding Society (UKHLS) for the period of 1991–2024 (University of Essex, 2024). The BHPS began in 1991 with 5,000 households in Great Britain and expanded to the UK in 2001 with a Northern Ireland sample; it was succeeded by UKHLS in 2009, which scaled up to around 40,000 households. The BHPS sample members have continued to participate as part of UKHLS (starting from the second wave). Combined, these two surveys provide over three decades of continuous, nationally representative longitudinal data. This anonymised data is made available from UK Data Service and secondary analysis of this data does not require ethics approval.Footnote 10
The analytic sample comprises children aged zero to ten, reflecting a life-course definition of childhood. Of the 33,864 children enumerated at least once across the thirty-two waves, several restrictions are applied to ensure temporal comparability and sufficient longitudinal information. We exclude the Northern Ireland sample because it was not observed in the first ten survey years. UKHLS children born before 2009 are also excluded to maintain a clear separation between the BHPS and UKHLS cohorts. We apply two conditions to select our sample. First, we remove children with five or fewer years of valid income observations, given our focus on long-term poverty experience.Footnote 11 Second, we keep only those who have household income information at age zero or one as this information is crucial in defining birth cohorts and using survey weights. Finally, we exclude cases with missing data on risk factor variables (around 2 per cent). These restrictions yield a final sample of 6,218 children in Great Britain, born between 1991 and 2017.Footnote 12
We measure poverty using information on equivalised net household income. Net household income is calculated as the sum of the net monthly incomes of all household members, including net labor income, miscellaneous income, private benefits, investment income, pension income, and social benefits.Footnote 13 From this total, council tax liabilities are subtracted, and adjustments are made for housing benefits.Footnote 14 To account for differences in household size and composition, income is equivalised using the Organisation for Economic Co-operation and Development (OECD)-modified scale, which assigns a weight of 1.0 to the first adult, 0.5 to each additional adult, and 0.3 to each child. The household’s total net income is then divided by the sum of equivalence weights to produce the equivalised net household income. For the main analysis, we use a threshold of 60per cent of the median equivalised disposable household income, but also present results for alternative thresholds in the Appendix.Footnote 15
How to measure long-term poverty?
We measure long-term childhood poverty using a simple counting approach. Focusing on the first eleven years of childhood (and minimum six years for the later cohorts), we count the number of years each child spends in poverty. Our main analysis defines long-term poverty as spending at least half of childhood in poverty, but in robustness checks, we also test alternative thresholds and examine the average duration spent in poverty.
This counting measure is straightforward, transparent, and well established in the poverty dynamics literature (Jenkins, Reference Jenkins2011). It is also widely used by government and non-government bodies to measure persistent poverty (e.g., Eurostat, UK Office of National Statistics (ONS), Social Metrics Commission). By adopting a life-course perspective and fixing the observation window to the first eleven years of childhood, we avoid problems of left- and right-censoring and can estimate the rate of long-term poverty consistently across cohorts (Ashworth et al., Reference Ashworth, Hill and Walker1994). These advantages are not available to other approaches, such as spell-based or axiomatic methods. Attrition remains a challenge, as not all children remain in the survey for the full observation period. We address this by using imputation and longitudinal weighting to account for missing data.
First, following Halpin’s (Reference Halpin2016) chained multiple imputation procedure for life-course data, missing income information is imputed based on the timing of each gap within childhood, prior and subsequent income status relative to the national median, and sociodemographic characteristics. To avoid excessive imputation, children with fewer than six valid income observations are excluded (including for those born after 2013). These imputations are held separately for each birth cohort.
Next, to deal with attrition and other missing data, we calculate longitudinal weights using inverse probability weighting. A logit model is fitted to predict the probability of having six or more income observations and complete risk factor information based on sample status (permanent vs. temporary) and household characteristics (e.g., region, size, education level) and risk factors (see below). The inverse of the predicted probability is then used as the longitudinal weight.Footnote 16
Using the newly constructed weights with imputed data yields long-term poverty rates 1–3 percentage points higher than estimates without imputation, reflecting higher attrition among disadvantaged groups (see Figure A8 in the Appendix). We tested the robustness of these procedures by comparing yearly rates of poverty and various risk factors after imputation and weighting with those from full cross-sectional samples. Results are very similar, with only small differences for certain risk factors, such as living in a single-parent or low-pay household. While imputation and longitudinal weighting improve the estimates, the unadjusted sample already produces results that closely match the original, suggesting that attrition poses only a limited problem for estimating long-term childhood poverty (see Figure A9 in the Appendix).
Risk factors
Our main explanatory variables are measures of risk factors as follows:
-
3+ kids HH: Household with three or more children aged fifteen or under.
-
Single parent HH: Household with a single parent.
-
Workless HH: No household member is employed.
-
Single-earner HH: Only one household member is employed.
-
Low pay HH: All household members earn less than two-thirds of the median hourly wage.
-
Low work hours HH: Total weekly hours worked by all household members is below 30.
We also use other variables to explore the risk profiles:
-
1+ informal carer in HH: At least one household member provides care to other household members or to someone outside the household.
-
1+ disability in HH: At least one household member has a health condition limiting daily activities.
-
Social renter: Renting a home from a local authority or housing association.
-
Private renter: Renting a home from a private landlord or employer.
-
Living in London: Household lives in London region.
Table A1 in the Appendix shows the descriptive statistics for these variables.
Long-term childhood poverty: Trends for 1991–2017 cohorts
Figure 1 shows the rate of long-term childhood poverty across birth cohorts from 1991–93 to 2016–17. On average, 17 per cent of children experienced long-term childhood poverty. This significantly varies across cohorts, revealing three distinct periods. First, there was a marked decline for cohorts born in 1990s, from 25 per cent for those born in 1991–93 to only 13–14 per cent for the 1998–99 cohort. A similar trend was also noted in previous research by Jenkins (Reference Jenkins2011). These children were among the first to benefit from 1997 reforms, which may have raised employment and social transfers for some in these groups. Indeed, as we show in Table A2 in the Appendix, poverty rates for all cohorts start to decline after 1999 when the Working Family Tax Credit replaced the Family Credit with a lower taper rate and more generous earnings disregards and rebates against childcare costs.
Trends in long-term childhood poverty for 1991–2017 birth cohorts in Britain.
Notes: The figure shows the rate of long-term childhood poverty, the proportion of children living at least half of their childhood in poverty. It is based on a poverty definition using 60 per cent of median equivalised net household income as the threshold. The equivalisation is held using the modified OECD scale. The estimates are based on imputed data and using longitudinal weights. The shaded areas represent 95 per cent confidence intervals.

Second, long-term childhood poverty remained relatively stable among cohorts born in the 2000s. Although there were some fluctuations, overall levels were similar across these cohorts, despite rising unemployment and widening earnings inequality following the 2008 financial crisis. This stability in long-term rate masks important yearly variation: poverty rates for these groups increased in the years leading up to 2008 and then declined sharply afterward (see Table A2 in the Appendix), likely due to policy responses to the crisis, such as increases in benefit generosity through changes to uprating.
Finally, long-term childhood poverty has surged among cohorts born after 2012–13, reaching 23 per cent for those born in 2016–17. These children spent their entire childhoods under post-2013 austerity measures, and the increase likely reflects the erosion of the real value of benefits during this period, considering substantial rises in the minimum wage. Apart from a brief improvement during the COVID-19 response, which likely reflects the temporary £20 uplift, yearly poverty rates generally rise after 2013 and, in particular, after 2016 for the latest cohorts (see Table A2 in the Appendix).
We test the sensitivity of these findings to several methodological choices. The results are reported in the Appendix. First, we vary the threshold for defining long-term poverty, using one-third and three-quarters of childhood spent in poverty as alternative thresholds. The trends remain consistent, showing a marked decline for children born in the 1990s and a sharp increase for those born after 2013 (see Figure A2). We also confirm these trends using a broader measure of duration (i.e., the proportion of childhood spent in poverty) (see Figure A3).
Second, we test the impact of using alternative poverty thresholds. Instead of the 60 per cent of median equivalised household disposable income used in the main analysis, we estimate long-term childhood poverty based on 50 per cent and 70 per cent thresholds. As expected, the absolute levels vary, but the overall trends remain robust: declines for 1990s cohorts and substantial increases after 2013 (see Figure A4).
Third, we assess the impact of varying the number of years used to calculate long-term childhood poverty. Our main analysis uses data from the first eleven years of life, but for recent cohorts who have not yet reached age eleven, we use shorter observation windows, with a minimum of seven years for those born in 2017. These later cohorts also show the largest increases in long-term poverty. To test whether the shorter observation period influences our results, we re-estimate rates for all cohorts using only the first seven years of childhood. The overall levels and trends remain consistent with our main findings, except for a few fluctuations for certain cohorts (see Figure A5). This shows that using at least seven years of data already gives enough indication about the childhood poverty trends.
Finally, we explore the impact of housing costs. We compare long-term childhood poverty before and after accounting for housing costs, which include self-reported rent and mortgage payments. Until 2008, the poverty rates are similar across both measures, but post-2008, poverty rates after housing costs rise significantly and diverge from the before-housing-cost figures. The levels, however, converge again for the latest cohort. While this is not a definitive test as median incomes may also reflect rising housing costs, it suggests that accounting for changes in cost-of-living may alter conclusions (see Figure A6). We return to this point in the conclusion.
Explaining trends: Prevalence and penalty of risk factors
To understand the drivers of change in long-term childhood poverty, particularly for the earlier and later cohorts, we begin with a KOB decomposition. We first identify relevant risk factors by examining the profiles of children in long-term poverty. As shown in Appendix Figure A1, long-term poverty is significantly more common in single-parent households and households with three or more children, with disability, as well as with no employment, low pay, or low working hours. In contrast, being a single-earner household, having an informal carer in the household, living in private rental housing, or residing in London are not associated with a higher risk of poverty.Footnote 17 Therefore, we only use the significant risk factors to decompose the cross-cohort changes.
Figure 2 presents our KOB decomposition results for the decline in long-term childhood poverty among 1990s cohorts and the increase among the latest 2010s cohorts, focusing on whether these changes are driven by shifts in the prevalence of risk factors or in their penalties.
KOB decomposition of cross-cohort changes in long-term childhood poverty.
Notes: The figure shows the results of a KOB decomposition applied to examine the sources of cross-cohort changes in long-term childhood poverty. The estimates are based on imputed data and using longitudinal weights. The error bars represent 95 per cent confidence intervals.

The left panel shows the decomposition of changes in long-term childhood poverty between cohorts born in 1991–93 and 1998–2001. The gap between these two groups shows an 11-percentage-point decline, with one-third explained by changes in the prevalence of risk factors and two-thirds by the changes in their penalties. The main contributors were the reduction in the prevalence of workless and low-pay households, likely reflecting rising employment rates during this period, and decreases in the penalties associated with living in a low-pay household. As discussed earlier, shifts in penalties may reflect changes in benefit generosity or rising earnings among at-risk groups relative to the poverty threshold (i.e., median income). The declining penalty for low pay suggests that these households may have experienced income gains, either through higher earnings or social benefits, that lifted later cohorts above the poverty line in at least some years.
The right panel presents a similar decomposition for the later period, focusing on the differences between cohorts born in 2010–11 and 2016–17. The sharp rise in long-term childhood poverty across these cohorts appears to be driven only by changes in the penalties associated with certain risk factors, particularly having 3+ kids, single parenthood, low pay, and low working hours. Given that this period saw increases in the minimum wage, the growing impact of these risk factors is likely explained by declining benefit levels due to austerity reforms, including the two-child limit. Rising penalties for single parents might also be related to stricter job-search conditions applied with 2008–12 reforms (Hoynes et al., 2024).
Explaining trends: sequential income accounting
While the KOB decomposition analysis helps explain whether changes in the prevalence and penalty of risk factors drive long-term childhood poverty trends, it does not directly assess the role of redistribution vis-à-vis predistribution. To address this, we first apply sequential income accounting, calculating poverty rates under different income definitions and attributing changes to specific income components specifically related to redistribution.
Figure 3 shows the poverty rate for different income definitions on the left and the extent to which long-term childhood poverty is reduced by social transfers, taxes and social transfers, and private transfers when they are added to gross household earnings on the right.
The role of redistribution and predistribution in explaining trends in long-term childhood poverty for 1991–2017 birth cohorts in Britain: sequential income accounting.
Notes: The figure shows the results of sequential income accounting analysis to examine the role of redistribution and predistribution. All income definitions are equivalised for household size and composition. The estimates are based on imputed data and using longitudinal weights. The error bars represent 95 per cent confidence intervals.

We separately interpret three periods. First, the decline among those born in the 1990s seems largely due to improvements in predistribution, defined here as the ability to avoid poverty through household earnings alone. The dotted line for gross household earnings shows how this measure has evolved over time. The decline in long-term childhood poverty among 1990s cohorts coincides with a period of rising predistribution: poverty based on household earnings fell from 33 per cent for children born in 1991–93 to 25 per cent for those born in 1997–98. A KOB decomposition shows that more than half of this decline was due to reduced prevalence of workless, low-pay, and low-work households, while another half is explained by declining penalties for low-pay households, likely driven by rising employment and wage growth among these households relative to the median (see Figure A7 in the Appendix). Moreover, for the same groups, the reduction of poverty by social transfers seems to grow, but only slightly. Taxes seem to increase poverty for all cohorts, echoing recent findings on fiscal impoverishment (Schechtl & O’Brien, Reference Schechtl and O’Brien2024)Footnote 18 , yet this regressive effect also declines slightly for those born in the late 1990s compared to the earlier cohorts, possibly as a result of rising tax credits. The role of private transfers (difference between market income and gross household earnings) appears relatively negligible for these cohorts in this analysis.
Second, stable trends for those born in the 2000s are a result of counteracting effects of predistribution and redistribution. Predistribution trends reversed for children born in the 2000s. Long-term poverty based on earnings rose from 25 per cent for the 2000–01 cohort to 40 per cent for the 2008–09 cohort. Despite this deterioration in predistribution, overall long-term childhood poverty remained stable during this period, largely due to growing poverty reduction via social transfers. This suggests that growing reliance on benefits may have offset worsening predistribution conditions, such as rising earnings inequality, helping to maintain stable poverty levels. In the Appendix, we examine the drivers of declining predistribution (see Figure A7). The results point to rising prevalence of workless, low-pay, and low-work households, alongside rising penalties for single-earner, low-pay, and low-work hours households. These trends are likely linked to declining earnings for low-income households (mainly due to rising part-time work and declining work hours among men) against a rising poverty threshold as well as the rising earnings inequality in the aftermath of the 2008 financial crisis, which led to higher unemployment and increased earnings inequality (Cribb et al., Reference Cribb, Joyce and Wernham2023; Joyce & Ziliak, Reference Joyce and Ziliak2019).
Third, the surge in long-term childhood poverty for those born in the 2010s seems largely due to worsening redistribution, despite slightly improving predistribution. For children born in 2008–09, adding social transfers to gross household earnings leads to a 31 percentage points reduction in poverty, but this figure steadily declines to 15 percentage points (pp) for the 2016–17 cohort. The slight improvement in predistribution is likely due to significant rises in minimum wage, which became the main anti-poverty tool in this period, yet our findings show that its effectiveness was limited and did not translate into lower long-term childhood poverty, and the resurgence in long-term childhood poverty was most likely driven by cuts to social transfers. During this period, the poverty-reducing effect of private transfers and the poverty-increasing effect of taxes seem to increase slightly when they are evaluated after adding them to gross household earnings.
Explaining trends: Shapley decomposition
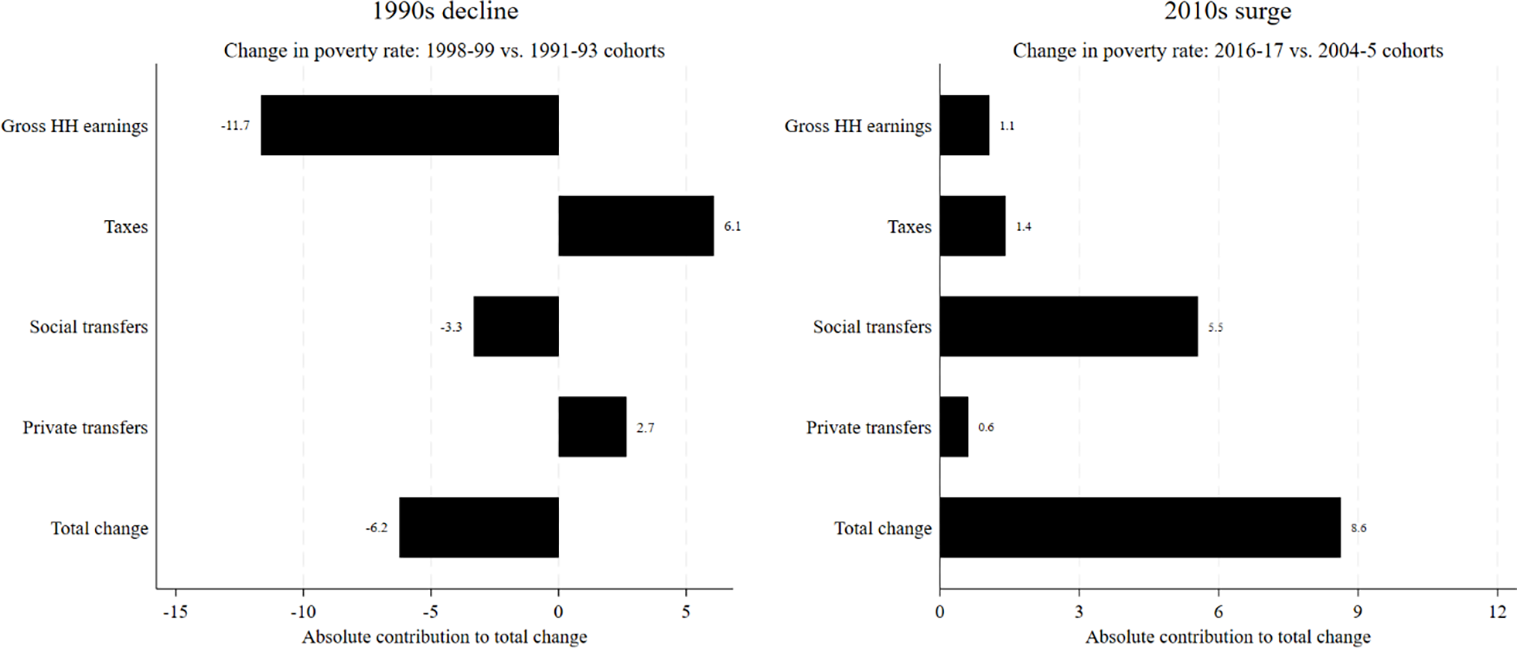
We now turn to the Shapley decomposition to explain the 1990s decline and the 2010s surge in long-term childhood poverty by assessing the contribution of different income sources across all possible order combinations. This method evaluates the average marginal contribution of each income component to observed changes in poverty trends. Figure 4 presents the results: the left panel compares the 1991–93 and 1998–99 cohorts (the 1990s decline), and the right panel compares the 2004–05 and 2016–17 cohorts (the 2010s surge).
The role of redistribution and predistribution in explaining cross-cohort trends in long-term childhood poverty: Shapley decomposition.
Notes: The figure shows the results of Shapley decomposition of poverty rates between two cohorts described in subtitles. The analysis is held on pooled data, so reflect a decomposition of changes in average poverty rates during cohorts’ observation windows, rather than changes in long-term childhood poverty rate. The estimates are based on imputed data and using longitudinal weights.

The 1990s decline is mainly associated with rising predistribution. Consistent with earlier findings on increasing employment and lower penalties for low-pay households. Changes in household earnings alone seem to reduce long-term childhood poverty by around 11 percentage points. However, these gains were partly offset by higher taxes associated with increased earnings, which contributed around 6 percentage points in the opposite direction. Declining private transfers also had a small negative effect, pushing poverty upwards, while social transfers contributed modestly to the overall decline, reducing poverty by around 3 percentage points.
In contrast, the 2010s surge in long-term childhood poverty was primarily associated with falling redistribution. Consistent with our previous results, austerity measures substantially reduced the generosity of social benefits, and these changes in social transfers seem to explain roughly two-thirds of the increase in poverty among the later cohorts. Changes in household earnings also contributed to the rise, likely reflecting growing earnings inequality and the worsening position of low earners relative to the median, despite significant increases in the minimum wage. Taxes further added to the rise in poverty, likely due to the freeze in nominal tax thresholds, which gradually expanded the tax base. Finally, declines in private transfers seem to also modestly contribute to the increase.
Discussion
This study shows that long-term childhood poverty is a significant social problem in Britain. Around 25 per cent of children born in the early 1990s spent at least half of their childhood in poverty. This share almost halved for cohorts born after the 1997 reforms and remained stable for most of the 2000s, before rising sharply for those born after the 2013 austerity reforms, reaching back to 23 per cent for the 2016–2017 cohort.
The early decline was driven largely by rising employment and earnings in low-income households. This is likely partly due to increased conditionality and the expansion of tax credits, particularly for single mothers; however, this progress was not sustainable as much of this employment was part-time and low-paid, offering limited prospects for progression (Avram et al., Reference Avram, Brewer and Salvatori2018; Blundell & Hoynes, Reference Blundell, Hoynes, Card, Blundell and Freeman2004; Hoynes et al., Reference Hoynes, Joyce and Waters2024). As a result, predistribution for subsequent cohorts deteriorated significantly, likely due to rising household earnings inequality in the 2000s. Despite this, long-term childhood poverty remained low during this period because increased social transfers following the post-1997 reforms offset the negative effects of widening earnings gaps. At their peak, adding these transfers to earnings led to a 30 percentage point decline in long-term poverty, echoing broader evidence on their role in counteracting worsening earnings inequality (Cribb et al., Reference Cribb, Joyce and Wernham2023).
This progress reversed for cohorts born after 2013. Despite increases in the minimum wage and slightly improving predistribution, long-term childhood poverty rose substantially for the most recent cohorts. The main driver was declining social transfers, which explained around two-thirds of the increase in long-term childhood poverty for cohorts born in 2016–17. This likely reflects the sustained erosion of benefit values relative to average earnings as a result of austerity reforms (Corlett, Reference Corlett2019) and underscores the central role of redistribution in shaping long-term poverty outcomes, especially when predistribution alone offers insufficient protection.
These findings have important implications for policy. Social transfers matter not only for reducing current child poverty but also for limiting long-term childhood poverty, even within the current system that likely does not effectively target longer-term experiences. Increased transfers played a crucial role in containing long-term poverty for children born in the 2000s. In contrast, more recent cohorts have faced rising long-term poverty due to the austerity-driven erosion of social transfers.
Predistribution was also instrumental in reducing long-term poverty for children born in the 1990s. These gains were, however, not sustainable (despite rising minimum wage) as much of the employment growth was in part-time and low-paid jobs with limited opportunities for progression, and earnings inequality increased in the following decade. Yet, as recently argued, parental employment has substantially increased over the last two decades, and those who do not work face substantial barriers to employment due to health difficulties or care needs, so employment alone would not be adequate to reduce childhood poverty substantially (Patrick et al., Reference Patrick, Reeves and Stewart2025). Protecting current and future generations from long-term poverty will therefore require both maintaining gains in predistribution and restoring the strength of the redistributive system.
Children born over the past three decades have experienced very different combinations of redistribution and predistribution. Those born during periods when both were strong, particularly around the 1997 reforms, faced the lowest levels of long-term childhood poverty. By contrast, children born after 2013 saw some of the highest rates, driven by low predistribution and declining redistribution. Therefore, to prevent today’s children from falling into long-term childhood poverty, improvements for both redistribution and predistribution are necessary.
Considering redistribution, while current debates have rightly focused on reversing the two-child limit and benefit cap, it is equally important to restore the generosity of means-tested benefits, especially child and housing support, to pre-2013 levels, as their real value has fallen behind rising earnings and living standards (Corlett, Reference Corlett2019). Still, we saw that the penalty for living in a household with three or more children has significantly risen for cohorts born in 2016–17, which partly explains deteriorating redistribution for this group, and the removal of the two-child limit in the 2025 November budget is an effective first step in that respect. Recent evidence on the impact of the temporary uplift of £20 during COVID has shown that increased transfers within the current system can effectively reduce poverty and food insecurity (Loopstra et al., 2025).
Improving predistribution will require tackling earnings inequality, which demands policies that go beyond the minimum wage. Recent increases in the minimum wage have not significantly reduced long-term childhood poverty, as wages do not adjust for household size and are not enough to meet extra needs (Patrick et al., Reference Patrick, Reeves and Stewart2025). Moreover, many minimum wage earners live in households above the poverty threshold, and for those below the threshold, increases in earnings are counteracted by withdrawal of means-tested benefits. Increases in minimum wage also benefit those in the middle part of the income distribution, possibly contributing to an increase in the poverty threshold (Brewer et al., Reference Brewer, May and Phillips2009; Cribb, Reference Cribb, Giupponi, Joyce, Lindner, Waters, Wernham and Xu2021). This may be changing recently due to rising employment and stagnation in pay (Joyce & Ziliak, Reference Joyce and Ziliak2019), but sustained progress will depend on complementary measures that address low pay, job security, and progression opportunities, as employment and minimum wage alone are unlikely to have significant impacts on poverty rates (Patrick et al., Reference Patrick, Reeves and Stewart2025).
Our analysis has several limitations. The first is the effectiveness of imputation and longitudinal weights in addressing sample attrition. Our robustness analysis, however, shows that attrition does not pose a significant challenge for representativeness, especially after our adjustments with imputation and weighting. The second is that we used less than ten years of data for certain cohorts for calculating their long-term childhood poverty rate, yet this does not seem affect our findings significantly. We hope to revisit this once more recent data becomes available. Third, our survey data likely suffer from under-reporting of benefits, leading to overestimation of poverty levels. Yet without the possibility of a data linkage with administrative data, we have limited options to overcome this problem. Lastly, our analysis focuses on income-based poverty measures; it does not fully account for rising costs in key areas such as childcare and housing, which can significantly affect material living standards. The main assumption in relative income measures of poverty is that changes in the median incomes largely reflect living conditions, including changes in the cost of living. However, this might not be true if the cost of specific goods or services, such as housing, rises more than the living standards, which, in the context of poverty, is measured by the household incomes at the median.
Supplementary material
The supplementary material for this article can be found at https://doi.org/10.1017/S0047279426101366.
Acknowledgements
We owe thanks to Kitty Stewart and the members of Comparative Social Policy Research Group at the University of Oxford for their valuable comments and suggestions on the draft paper. Remaining errors are ours.
Funding statement
We gratefully acknowledge funding under the John Fell Fund of Oxford University.
Competing interests
The authors declare none.
AI declaration
Proofreading was carried out independently by the authors, relying on AI technology for support.


 Open access