


Current and future heating demand: the potential market for geothermal energy
The Netherlands is clearly heading towards a future in which natural gas will no longer be an acceptable energy source to supply heating demand. Other renewable sources must be found. The Paris Climate Accord (COP21) has provided targets and the impetus to shift energy systems from reliance on fossil fuels to a more sustainable ‘carbon-free’ basis. The target is a tall order and has become a significant matter of policy. It has led the Dutch Government to establish a Climate and Energy Accord, with the intention that it be signed shortly by all the significant parties involved in the energy industry. Round tables for various sectors have been set up to find the best ways of reducing CO2 emissions.
The ‘Master Plan Geothermal Energy in the Netherlands’ (Stichting Platform Geothermie, 2018) highlights the implications for the heating sector, and the potential role that geothermal energy can play. The following paragraphs are based on the findings of this report.
Reduction of CO2 emissions must reach 49% by 2030 as compared with 1990 levels (40% compared with the emissions of 2015). By 2050, the reductions need to rise further to 95%. For the heating sector this means cutting 20 megatonnes of CO2 production per year by 2030, and a further 36 megatonnes by 2050. The rate at which the transition is taking place will have to increase sixfold to achieve these goals.
Current heat demand is around 960 petajoules (PJ). In 2030 this is expected to fall to 930 PJ, and by 2050 further to 870 PJ as a result of better insulation, limited population growth and more efficient processes. The current split in source of demand is roughly 50% from the urban environment and 10% from agriculture, which has the same alternatives to natural gas that apply in the urban environment and is essentially also space heating. Lots of solutions exist to supply this space heating, but it is the only market that is potentially amenable to supply from ‘conventional’ geothermal sources. The temperature required is under 100°C and this can be delivered by ‘conventional’ wells to depths of around 2.5 to 3.5 km.
The remaining 40% is from industry. This demand is specific to individual industrial applications and generally requires higher temperatures. For light industry which uses heat at temperatures up to 250°C, ‘Ultra-deep Geothermal Energy’ (UDG) could be the solution. Pilot projects are needed to establish this technology. For heavy industry which requires temperatures above this level, geothermal sources are not suitable. Geothermal applications focus on heat. Geothermal-based electricity generation is not widely seen as viable for the Netherlands due to the relatively low temperatures in the subsurface.
The targeted transition level for the sustainable ‘carbon-free’ share of heat sector energy demand is 400 PJ (43%) by 2030, and 870 PJ (100%) by 2050. The share of this which geothermal energy could meet is estimated at 50 PJ in 2030 (of which 30 PJ to greenhouses used in horticulture), rising to 200 PJ in 2050. Of the 200 PJ in 2050, by far the largest part relates to space heating (175 PJ, including 40PJ to horticulture). The remainder is the estimate of what could be provided to light industry. This essentially depends on the success of UDG. The current share of heating supplied by geothermal sourcing is almost negligible at 0.5% of total demand. This will rise to 5% and 23% by 2030 and 2050 respectively if these targets are achieved.
Many different factors influence Dutch use of geothermal energy. Perhaps the most important of these is the geographical proximity of geothermal resources to the demand which is, or can be, connected to a district heating grid. District heating grids need high demand density to be economically viable. This concentrates opportunity on densely populated areas. Currently only 25 PJ of Dutch heating demand is connected to district heating systems. A great deal of infrastructure will have to be built to make these geothermal aspirations possible. If this is done then geothermal energy can contribute 3 megatonnes of CO2 savings in 2030, and 12 megatonnes in 2050. This is respectively 4% and 7% of the total savings the Netherlands must make to achieve its international climate change obligations.
The report ‘Scaling up Geothermal Energy in District Heating Grids’ (Berenschot & CE Delft & IF Technology, 2019) uses a model which analyses lots of different space-heating solutions. It shows in some detail the areas within the Netherlands that are suitable for the use of collective district heating systems. In total, these systems cover 270 PJ of heat demand (space heating for built environment and greenhouses). Towns and cities are the clear targets, because of both substantial total space-heating demand and high demand density. Future development of these urban areas will determine where geothermal energy may be able to play a role in the provision of energy. Horticulture also provides concentrated heat demand and has so far proved to be the cradle for the nascent Dutch geothermal energy industry. Concentrated space heating demand for greenhouses is combined with relatively few, but much larger, consumers.
An estimate of the heat consumed by one household is often used in connection with district heating systems as a basis for measuring the size of demand. One ‘WEQ’ (‘Woning equivalent’, the equivalent heat of one household.) is the annual ‘heating equivalent’ for one household, assumed here to be equal to 36 GJ, consistent with the use in the ‘National Warmtenet Trendrapport 2017’ (http://warmtenettrendrapport.nl). The WEQ is a handy unit as it helps to couple a mental picture of the size of the demand and its associated district heating network, with the size of production. A successful geothermal doublet could be expected to produce approximately 10 MW thermal. If such a doublet could produce at an absolutely constant rate all year round, without any interruption, then the energy it would produce would be equivalent to the total consumption of 8760 WEQs (10 MW = 36 GJ h−1. 8760 hours in a (non-leap) year).
Capacity: how is space heating consumed?
The demand for space heating varies greatly depending on factors such as temperature or hour in the day. The required heat delivery rate is constantly changing and this adds a crucial dimension to any consideration of supply. It determines which heat sources are suitable to supply different segments of demand: the steady base-load, or the peak moments when it is very cold. Demand can differ from one year to the next. But variations also occur over all smaller time periods. The district heating system must have the capacity to follow the variations through all time periods, right down to the minimum period needed to keep temperature fluctuations within buildings at a comfortable level.
The graphs shown in Figure 1 are derived from an hourly gas off-take curve typical of domestic and commercial use in the Netherlands. This use is mainly space heating and heating for tap water. The data has been used here as an illustrative proxy for the demand that a district heating grid has to meet. The plots show the relative energy demand rates for two periods: a cold winter month average hourly profile through the week, and a warm summer month average hourly profile through the week. Demand is plotted for comparison as a percentage of the highest hourly average off-take rate in the winter month.
Variability in hourly heating demand, summer month (A) vs winter month (B).
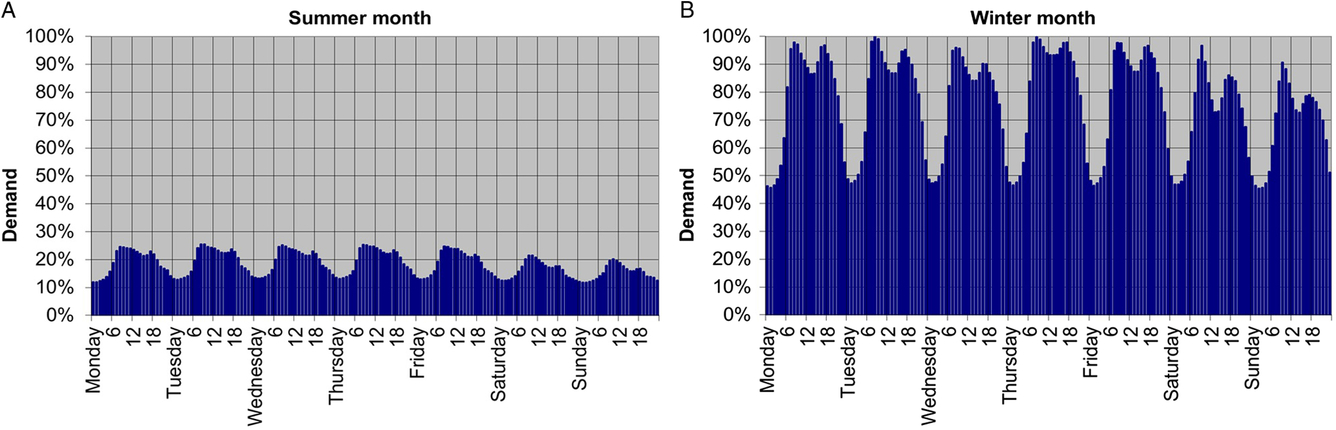
It is obvious that steady base-load supply, which would have to fit under the minimum off-take of the right-hand graph, is only a small fraction of the total volume of energy required. Heating grids also require an additional more or less base-load heat supply all year round, in order to cover the system heat losses. So the demand of a district heating grid is slightly larger and less variable than that of the end users it supplies. For technical reasons (reliability of electric subsurface pumps, and avoidance of reservoir issues which may arise from varying flow and temperatures), geothermal doublets ideally produce at a constant rate. This mismatch is a significant hurdle which must be overcome in order to allow geothermal sources to supply a substantial share of the demand.
The same data has been sorted into a load duration curve (Fig. 2). This plots the demand per hour in the order of highest to lowest. It can be used to visualise the volume of energy associated with different delivery rates. The lowest delivery rate can be used all year round, but the highest rate is only required for one hour in the year.
Illustrative load duration curve for heat demand in a district heating.
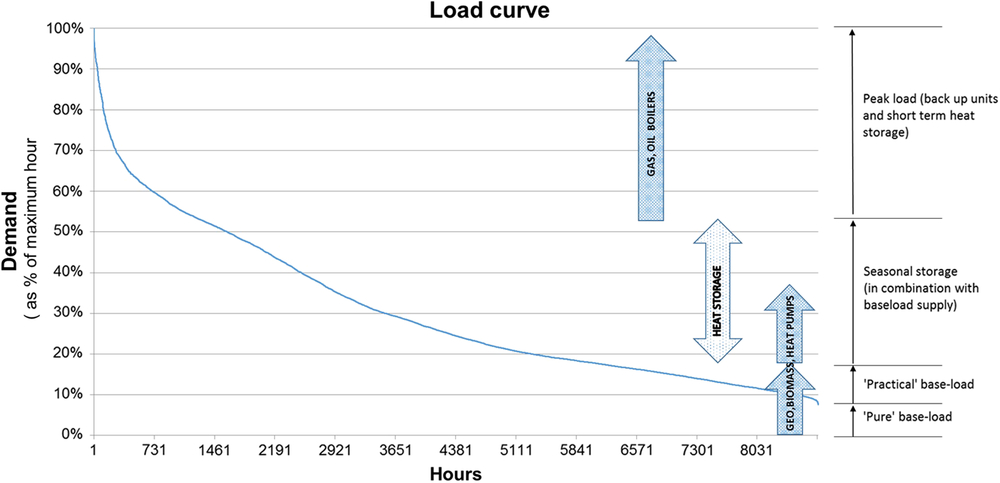
The total area under the load duration curve corresponds to 100% of the total energy demand in a year. The fraction of this total area which is bounded by the load curve, the axes and a horizontal line from the y (capacity) axis corresponds with the fraction of energy which can be provided at different delivery rates. About 80% of the energy can be supplied with a third of the maximum capacity. But to achieve this, the primary heat supply source would have to run at full capacity for only about 3000 hours in the year, which requires some modulation of the heat production beyond just the ‘practical’ base-load supply.
The economics of a doublet benefit from the highest possible number of load hours, as most of the cost for such a project is up-front capital investment. Larger grids are better, because this increases the absolute demand for base-load heat. However, the share of total energy demand which can be supplied by base-load production can also be increased by using heat storage. This can store some of the summer base-load production and deliver it during winter.
Development in the housing stock over the period to 2050 should help to reduce the levels of variation in space-heating demand. Modernisation over time is likely to bring better insulation, though older existing housing stock, and demand for warm tap water, will continue to ensure significant short period variations remain. District heating systems will continue to need to use a mix of different heat sources and assets to function properly in the future.
District heating systems
A district heating system is a prerequisite to the application of geothermal energy. It can be viewed as a collection of connected closed loop heating circuits. Each circuit contains heat exchangers to transfer heat in and out of the circuit, pumps and pipes to circulate the heat transportation working fluid (demineralised water). The main circuit may be connected to sub-circuits at a neighbourhood or apartment complex level. Grid water can be used to supply heat by direct feed into the heating circuit of individual homes, though this can also be done via individual heat exchangers. Tap water is always heated via a heat exchanger.
The trunk lines of a district heating system are generally made of steel. The demineralised water is treated to ensure that it contains as little oxygen as possible, to avoid corrosion. In recent years distributary pipes leading to residential areas and individual houses have started to be made of insulated plastic, as this is less sensitive to corrosion and cheaper to install.
The heating grids currently in place have often been established on the basis of a large local source of waste heat. This is usually a power station, heavy industry or a waste incineration plant. These sources usually provided heat at quite high temperatures. Existing networks have often been designed to operate at delivery temperatures as near this level as possible. In practice this means close to 100°C. Economic considerations require a relatively high demand density in the neighbourhood of the source, which means that urban areas with relatively old housing stock are good targets.
Waste heat is generally a base-load source with a degree of downtime, and potential unreliability associated with the industrial process that creates it. Heating grids need back-up for this supply. They also have to arrange flexible sourcing to provide peak capacity to follow the end load demand pattern. Gas (or oil) boilers have traditionally been the obvious choice to meet these two requirements. They are usually installed at distributed points around the grid. Heat buffers (storage tanks) may also be used to provide short-period storage by increasing the thermal ‘inertia’ of the system.
District heating systems are the engineering result of many local factors, and are complicated systems. In practice there may be many pumps and heat exchangers in each circuit, and various different layouts could potentially be used to achieve the same goal. The delivered product is heat, not molecules, so there is constant leakage of energy from the system, and there are trade-offs to be made between the choices of operating temperatures for a system and the volume of water circulating through it. Energy is delivered by cooling the hot working fluid through a temperature range. A larger cooling range means that a greater amount of energy per volume of circulated fluid can be delivered. This in turn means smaller pipes, and/or slower flow rates, and less pumping power. But higher temperatures can also lead to the effective exclusion of heat sources. If an industrial process delivers waste heat at 130°C and this is then used as the chosen operating temperature for a district heating system, then it becomes challenging to feed in geothermal energy at 90°C. This cannot be done simply by using heat exchangers alone, it requires some other approach (e.g. mixing, or in combination with heat pumps).
The system must consider the flow rates required for all possible weather scenarios. It must be able to ensure that adequate temperatures are delivered at the end of each circuit to heat tap water, even when there is very little space-heating demand. And it must be designed to ensure enough redundancy to guarantee supply and cover reasonable future expansion plans. It may include heat delivery at different temperatures depending on the requirement of different neighbourhoods.
Sources of heat for district heating grids
Geothermal energy is one of a number of possible heat sources that can be used to provide the renewable bulk energy supply at high load factor. For the peak supply and back-up, there is not really a current alternative to gas (or oil)-fired boilers.
The other principal clean ‘bulk’ energy sources for heating grids are:
Industrial waste heat
Waste heat from industrial processes can come with zero additional carbon footprint. But this is only the case where the underlying industrial process is economically robust enough to be independent of any income from the sale of the waste heat. In this case, the costs of connecting to the district heating grid are the only incremental costs. Most existing grids have been built in the past to harness this type of opportunity, which has had a fundamental impact on their design and situation.
Waste heat may come with a zero additional carbon footprint. But the industrial process which creates it in the first place could very well still be a substantial carbon emitter. In the push towards lower emissions this is also coming under scrutiny, and if the response leads to changes in its methods then the waste heat production may be affected.
A geothermal doublet can be a good replacement (or additional source to allow grid expansion) for a grid built around waste heat. It is a relatively large incremental source and requires significant heating grid demand to justify development. Back-up and alternative heat sources are already available in an existing grid. This situation is best suited to mitigate the initial uncertainty around the success of a doublet.
Biomass
Producing heat from biomass is fundamentally different to doing so with geothermal doublets or heat pumps. Biomass stores energy chemically in molecules and this makes it an inherently more valuable product than a pure heat source. It can be burned at will to meet peak demand at the top of the load curve or used for back-up. But it also has other potential uses. It could for example potentially be used as a molecular feedstock in industry to enable the shift away from the use of fossil feedstock sources.
Renewable methane and liquid biofuels are manufactured from biomass and can be burned in the same way as natural gas and fossil-based liquid fuels. The limited availability of this fuel makes it seem sensible to use it first where there is little alternative. For heat supply this means as a fuel for the peak capacity and back-up boilers.
Several district heating grids in the Netherlands use biomass as a source of heat. The preferred form is wood chips which are collected and burnt centrally as a ‘bulk’ heat supply. These units are mainly base-load in nature, but they do allow some degree of regulation of the heat production. Biomass boilers have the advantage that they are an established technology that can be installed with relatively little geographical constraint. They offer the opportunity to choose (and adjust) the temperature at which the grid operates, and have been used to replace obsolescent industrial-waste heat sources around which heating grids were originally established (e.g. in Purmerend.).
Biomass is a relatively limited resource. Although availability could be increased greatly (Ecofys, 2018), this does not look likely to happen on a sufficient scale within the time frame of the carbon emission targets. All types of carbon-neutral energy are likely to be necessary in order to achieve these. It seems best to reserve the use of molecules wherever possible for premium value applications. The use of biomass to produce heat would then be encouraged only where other alternatives are not available.
Heat pumps
Heat pumps may be a good way of providing distributed heating solutions in individual buildings where there is low demand density and no district heating network. They may also be useful in conjunction with collective low-temperature heating systems that are developed for office complexes or local housing developments. But where a ‘conventional’ district heating network is viable, then a central heat pump using a large source of heat (e.g. sewage or river water) at a stable temperature is also a technical alternative.
An example of a working system is that of Drammen in Norway, which uses ammonia as a refrigerant and pumps heat from the local fjord. The economic viability of this solution depends on the efficiency of the heat pump and on the price of electricity. Norway has a surfeit of cheap clean hydroelectricity, so the picture may be quite different in the Netherlands. Nonetheless the technology is under serious consideration, for example in Hengelo (https://warmtebedrijfhengelo.nl/). Hengelo is currently testing this technology by upgrading waste heat from salt mining to provide district heating.
Heat pumps operate best at base-load and run on electricity. This means that the power required must also be base-load and comes with an associated carbon footprint. Dutch emission-free sources do not usually produce base-load power. They are normally intermittent and depend on the weather. The problem could be solved using large-scale electricity storage, but there is no current prospect of battery technology which can do this from season to season at reasonable cost. The use of molecules, and more specifically hydrogen, is possibly the best way of storing electrical energy over longer time periods. In the absence of power storage, fossil-fuel power generation capacity must still be available to fill in the gaps and provide back-up.
The extent of the carbon footprint associated with this power usage depends on the share of fossil-based power production in the base-load supply, and the coefficient of performance (COP) of the heat pump. The COP is the ratio: (heat power produced) / (Pump motive power input). (The Drammen heat pump in Norway achieves a COP of over 3, over a wide temperature difference (see David et al., Reference David, Mathiesen, Averfalk, Werner and Lund2017)). A geothermal doublet also requires base-load electricity to pump the formation water through the primary heat exchanger circuit and underground reservoir. But a ‘standard’ doublet producing at a reasonable rate will achieve a better COP than a heat pump and will therefore have a smaller carbon footprint associated with its energy production.
Heat pumps open access to lots of possible sources for heat supply. They can be used to upgrade low-temperature waste heat, and sources of this type are common and widely distributed. But they can also be used to extract heat energy from surface water. In the Netherlands this is a ubiquitous resource. Heat production is known with certainty in advance and heat pumps can be dimensioned to fit demand. With a geothermal doublet this is not the case, at least until the play has been proven by other doublets. In combination with geothermal heat production a heat pump can be very useful, for example by pumping heat from the return water before it goes back into the ground.
The cost of base-load electricity and the associated carbon footprint it entails may be a significant limiting factor, and electrical grid infrastructure may require reinforcement and investment. Some degree of heat storage for the heat supply may also be necessary to ensure that it remains at a stable temperature. This would then allow the heat pump to perform in a consistent manner throughout the year.
Blue and green hydrogen
There is currently no gas grid that can distribute hydrogen, except perhaps in limited local areas in the neighbourhood of Rotterdam. But (blue) hydrogen can be produced in bulk on a carbon-neutral basis by using natural gas in combination with carbon capture and storage (CCS). It can also be made by electrolysis from carbon-free electricity production, and effectively act as the missing part in the storage puzzle to match ‘green’ power production with demand.
Hydrogen offers the benefit of the inherent energy storage that molecules provide. Because of the premium value that comes with this, it is not likely to be used for the base-load share of heat production in district heating grids. But it could easily be used instead of other molecules as a carbon-free source for heat supply via the peak and back-up boilers.
The impact of operating temperature range, grid size and heat storage
The grid operating temperature range is an important parameter. It determines which sources can be attached to a district heating grid. The choice has an impact on the dimensions of installations, for example pump size and power, and pipeline diameters. A recent study has shown preliminary findings. These suggest that the most cost-effective temperature range (delivery and return) for district heating grids, taking these factors into account, is 70–40°C (TKI WINST consortium, 2018). Fortunately for geothermal doublets this is closely matched to the temperature range which conventional wells can provide. The research compares the relative merits of alternative heating-grid configurations using lower temperatures (40–25°C and 2°C–10°C).
A geothermal doublet is a relatively large incremental base-load heat source. But pure base-load is only a small share of domestic heating demand. This means that a doublet needs a large heating grid to consume all the base-load production that it can provide. Heat storage is a beneficial complement to any form of base-load supply because it opens up access to a greater fraction of the grid demand. This decreases the absolute size of grid necessary to provide enough demand for the heat production from one doublet, and increases the opportunity to develop more doublets and the overall contribution of geothermal heat production in the heating mix.
Studies are currently being undertaken to establish large-scale seasonal heat storage technology (www.heatstore.eu). The general idea is that base-load heat production from a doublet continues all year round. In the summer, much of this heat is stored underground at shallower levels (less than 1000 m). In winter the heat is pumped out again for delivery into the district heating grid. The pumps which drive the circuit through the storage formation will run at base-load, but the direction of the heat exchange changes according to the season. The physical volume of such storage for seasonal modulation will need to be very large. It could not easily be achieved using storage tanks above or in the ground.
It is possible to conceive a system that uses heat storage to supply heat demand further up the load curve. For peak supply the ratio of the volume of heat stored to the delivery (and storage) rate decreases. Heat storage tanks could be distributed around the district heating network, and this would increase the ‘thermal inertia’ of the whole system and provide modulation in the order of hours and days. But this does not provide back-up for the heat source itself, as is the case when gas-fired boilers are used.
The way forward for geothermal energy
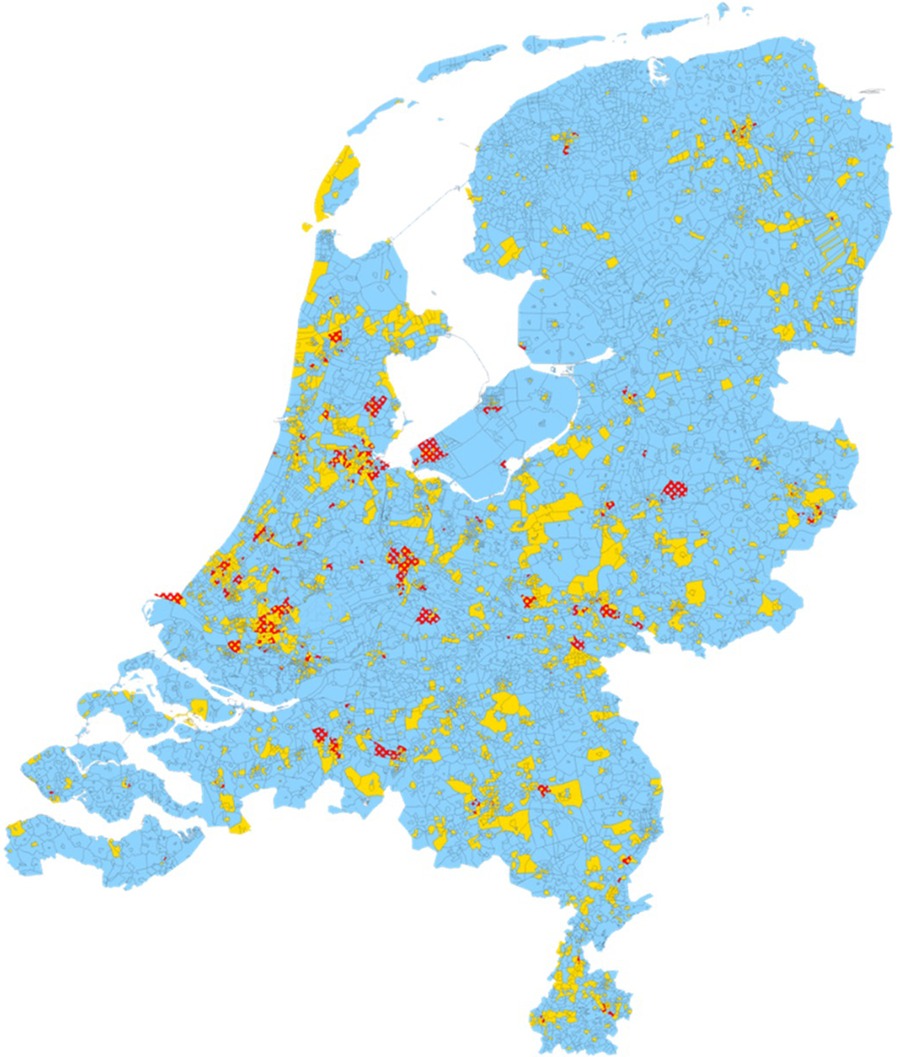
Technical standardisation, grid size and grid interconnection are key to the optimisation of district heating networks for maximum use of geothermal heat. This is not easy because heating grids are complicated and heavily influenced by many local factors. However, existing district heating networks represent only a tiny fraction of the network size that will be required to achieve the goals set out above. So there is plenty of room, in the design of new grids and the extension of existing ones, to optimise as much as possible. Figure 3 shows this in a map as presented in Berenschot & CE Delft & IF Technology (2019), but here it also includes the existing heating grids.
District heating grids in the Netherlands: existing (red) and potential collective (yellow) solutions.
For optimal geothermal sourcing, the ideal district heating infrastructure of the future could include the following:
A working fluid temperature range of around 70°C (supply temperature) to 40°C (return temperature), which matches the expected temperature ranges that a conventional doublet can produce.
Maximum use of seasonal heat storage. (But heat storage suitable for shorter time periods certainly helps too and can reduce the need for peak heat units that run on fossil fuel.)
Standardisation of network equipment and technical operating regimes, to minimise ‘technical lock-out’.
Large network size.
Wherever possible, interconnection between neighbouring heating grids.
Large grid size and interconnections mean that a larger portfolio of heating assets is connected to the system. This creates inherent back-up and minimises the necessary redundancy. Inherent back-up will help to reduce the use of fossil-fired back-up boilers, which increases emission reductions. Geothermal doublets need ‘critical mass’ because they are large heat sources. Where entirely new grids are started they will probably be built at first around other heat sources. A geothermal doublet can be added later when the grid has reached sufficient size to absorb the relatively large incremental production.
The potential exists to use geothermal doublets to provide a meaningful contribution to the reduction of Dutch greenhouse gas emissions. But at conventional well depths they are sources that are best suited to the provision of space heating, so it makes sense to try to optimise district heating grid development at a national level to enable the maximum possible contribution. This will free up the other, limited, premium energy supplies (specifically electricity and molecules), which can then be used in other higher-value applications for which there is no better alternative. The emission savings that geothermal energy can provide will be lost if these other heat sources are chosen in preference as supply for district heating, whereas the converse is not true.


 Open access